 Andy Peal1
 Barbara Evans2*
 Sangaralingam Ahilan2,3
 Radu Ban4
 Isabel Blackett5,6
 Peter Hawkins5,7
 Lars Schoebitz8,9
 Rebecca Scott10Andy Sleigh2
 Linda Strande8
 Oscar Veses2
- 1Independent Consultant, Macclesfield, United Kingdom
- 2Water@leeds, School of Civil Engineering, University of Leeds, Leeds, United Kingdom
- 3Centre for Water Systems, College of Engineering, Mathematics and Physical Sciences, University of Exeter, Exeter, United Kingdom
- 4Bill & Melinda Gates Foundation, Seattle, WA, United States
- 5Water and Sanitation Program (WSP), World Bank, Washington, DC, United States
- 6Independent Consultant, Saffron Walden, United Kingdom
- 7Independent Consultant, Norwich, United Kingdom
- 8Eawag: Swiss Federal Institute of Aquatic Science and Technology, Sandec: Department of Water, Sanitation and Solid Waste for Development, Dübendorf, Switzerland
- 9Independent Consultant, Lars Schöbitz GmbH, Zurich, Switzerland
- 10Water Engineering and Development Centre (WEDC), Loughborough University, Loughborough, United Kingdom
The urban population will rise to 6.7 billion by 2050. The United Nations has committed to provide everyone with safely managed sanitation, but there is limited understanding of the scale of the challenge. This paper describes a methodology for rapid assessment of sanitation in cities including a graphical representation (a shit-flow diagram or SFD) and reports on findings from implementation in 39 cities. The SFD provides high level information for planning purposes covering the entire sanitation system in a city. More than half of the human excreta produced in these cities is not safely managed. The most significant portions of the unsafely managed excreta are: (i) contents of pits and tanks which are not emptied and are overflowing, leaking, or discharging to the surrounding environment (14%); (ii) contents of pits and tanks which are emptied but not delivered to treatment (18%); (iii) fecal sludge and supernatant delivered to treatment but not treated (3%); (iv) wastewater in sewers not delivered to treatment (14%); and (v) wastewater delivered to treatment but not treated (6%). Many cities currently relying on onsite sanitation for safe storage, particularly in Africa, will need new strategies as populations grow. Containment systems that discharge to open drains are common in some Asian cities; these pose a public health risk. Dumping of excreta is widespread and there is a lack of realistic performance data on which estimates of the extent and effectiveness of treatment can be made. The SFD production process can be challenging due to a lack of data and low technical capacity in cities. There is often uncertainty over terminology and over the status of infrastructure. Formalizing definitions for the SFD preparation process was found to be useful in overcoming capacity constraints in cities. The SFD produces a credible snapshot of the sanitation situation in a city. The paper provides evidence of the urgent need for improved management and monitoring of urban sanitation in cities around the world and highlights the role of the SFD as a planning tool.
Introduction
The United Nations Millennium Development Goals (MDGs) are widely recognized as having increased attention by key decision makers of the need for investments in sanitation. While the world missed the MDG sanitation target in 2015, nevertheless it is estimated that 1.9 billion people gained access to “improved” sanitation between 1990 and 2015, equivalent to more than 200,000 people every day (Mara and Evans, 2017). High rates of urbanization and the greater ambition of the new Sustainable Development Goals (SDGs) which cover the period from 2015 to 2030 suggest that the challenge for sanitation in the future will be even greater. The urban population will rise to 6.7 billion by 2050 (United Nations Department for Economic and Social Affairs, 2018). In cities and towns, it is increasingly clear that global targets now call for solutions which provide “safely managed sanitation” from the toilet through treatment to the point of disposal or end-use (World Health Organization/United Nations Children's Fund, 2017a).
Urban sanitation requires a high level of technical competency, due to the need for interlinked or networked systems that address both the intensely personal sphere of private sanitation and the management of excreta for public health and environmental protection. Before cities can improve the rate of safe management of sanitation, they must first understand the current situation. This is challenging since services are often provided informally; regulatory control is low and performance data unavailable (Baum et al., 2013; Sato et al., 2013; Williams and Overbo, 2015). The assessment of “safety” is also challenging since it requires an understanding of both hazards in the environment and exposure in affected populations (World Health Organization, 2016; Robb et al., 2017).
Several recent efforts have attempted to fill these gaps. The Performance Assessment System (PAS) developed in India for water supply and sanitation benchmarking (Mehta et al., 2011), AQUASTAT (Food and Agriculture Organization, 2018), and the International Benchmarking Network (IBNET) (2018), all attempt to describe the current status of urban sanitation in large numbers of locations. PAS is comprehensive and widely accepted in parts of India but AQUASTAT and IBNET have both largely failed to encompass systems outside of those provided by large scale utility service providers. Very little reliable data are to be found on overall performance of the mixed and somewhat chaotic sanitation systems, which predominate in rapidly growing low- and middle-income cities with limited management capability or planning control. Sanitation Safety Planning (SSP) assesses risks associated with poor sanitation (World Health Organization, 2016); it was developed by the World Health Organization and builds on their Guidelines for Wastewater Re-use (World Health Organization, 2006). SaniPath is an effort to apply the same approach at a higher resolution at the local level (Robb et al., 2017). However, neither has yet been widely adopted.
Peal et al. (2014a) describe the development of a methodology for assessing urban sanitation service delivery through a service delivery assessment (SDA) scorecard and a fecal waste flow diagram (also known as a shit-flow diagram, SFD, or SFD Graphic). The SDA and SFD Graphic provide an overview of the sanitation situation without recourse to detailed field studies. The SDA facilitates the analysis of a complex situation by breaking down the systems and assessing the individual components according to a series of objective criteria, while the SFD Graphic provides immediate visual cues about where system failures may be occurring, which can be linked back to institutional aspects of service delivery. This work fills the gap between the generalized data in AQUASTAT and IBNET and the more detailed SaniPath approach. The “shit-flow diagram” or SFD approach has had rapid uptake and is now accepted as a tool for focusing political will and technical effort on critical sanitation problems at city level. For example, based on this approach, the World Bank developed the Fecal Sludge Management (FSM) Diagnostics for Service Delivery in Urban Areas tools (Scott et al., 2019) and the International Resource Centre (IRC) developed a Fecal Waste Flow Calculator (IRC, 2018). A similar approach is also used for monitoring target 6.2 of the Sustainable Development Goals—which has as its indicator “the proportion of the population with safely-managed sanitation”—although the definition of safe management used by the Joint Monitoring Programme for Water Supply, Sanitation and Hygiene (JMP) is not the same as those used to prepare an SFD (World Health Organization/United Nations Children's Fund, 2017b). The 2018 World Health Organization guidelines on sanitation and health also make use of the SFD methodology (World Health Organization, 2018).
This paper describes a standardized methodology that has been developed and used to prepare SFDs. It also reports on the implementation of the approach in 39 cities. The results are used to examine key trends and gaps in both information and implementation relating to urban sanitation globally.
Methods
The SFD Production Process
Since 2014 the approach described by Peal et al. has been further developed through a project entitled the SFD Promotion Initiative (SFD-PI). The SFD production process has been codified in a manual which is available on the project website (SFD-PI, 2018a). The manual includes a set of standard definitions; the assumptions used to model excreta flows; and lists of recommended data sources on which estimates can be made. It also describes the process of preparing an SFD Report including: approaches to stakeholder consultation; methods for data collection and verification; a list of guidance questions for assessing the service delivery context (Table 1); and standard report format. There is also an SFD Graphic Generator tool, which automates drafting of SFD Graphics (SFD-PI, 2018b). The tool produces outputs as portable network graphics (.png), which can be downloaded for use in an SFD Report or for sharing directly with stakeholders.
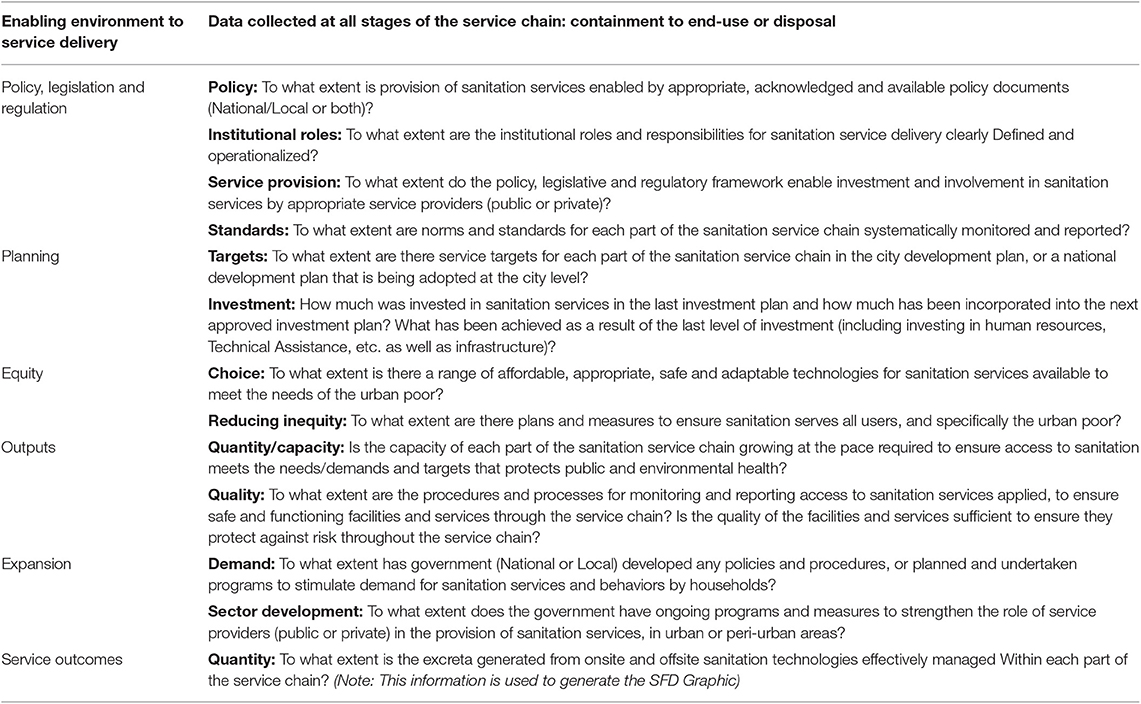
Table 1. Guidance questions for assessing service delivery context (from SFD-PI, 2018a).
General Approach to SFD Analysis
SFD analysis uses the “sanitation chain” to ensure that excreta flows are tracked from the point of production (containment), through emptying, transport and treatment, up to the point of end use/disposal (Figure 1). It is based on the idea that excreta flows are either “safe” or “unsafe”. “Safety” is assessed in terms of whether the hazard (pathogens in excreta) are likely to enter the environment at each point along the sanitation chain and if human exposure to that hazard at that point is also likely to result in a public health risk. To keep the SFD Graphic clear and uncluttered, very few technical terms are displayed; generic terms and color-coded arrows sized proportionally to the population whose excreta follow each pathway are used to describe the sanitation chains and service outcomes. Green arrows represent flows at each step along the chain which are likely to have a “safe” outcome; red arrows represent “unsafely managed” flows.
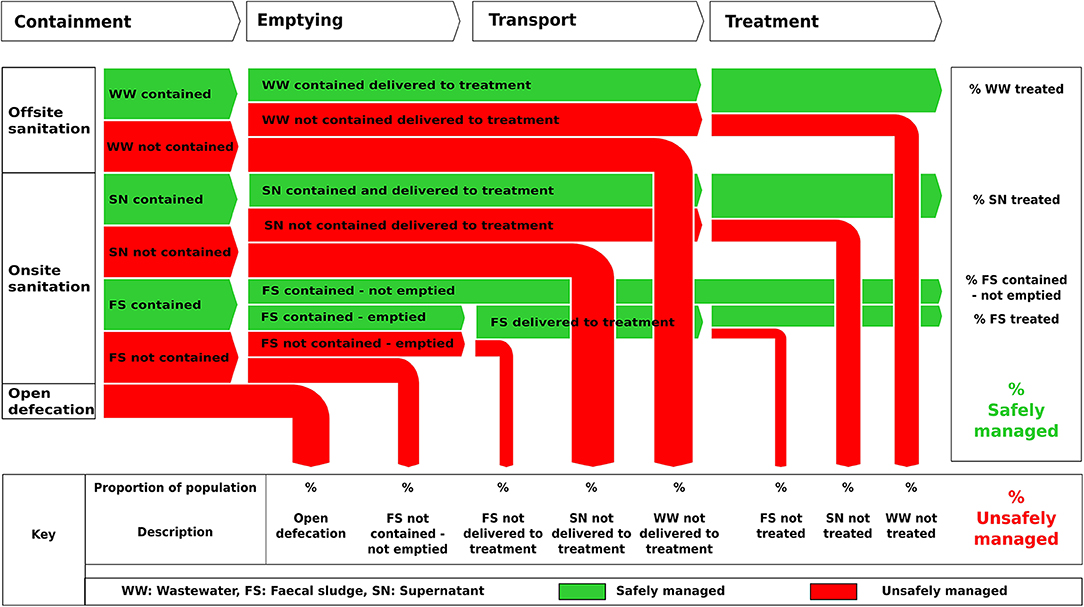
Figure 1. SFD graphic used in SFD production process (from SFD-PI, 2018a).
The analysis is therefore divided up according to the sanitation chain: firstly, an assessment of the containment system and the extent to which excreta are safely “contained” at the point of production and then an assessment of how excreta flow from the point of production through piped networks (e.g., sewerage), or via non-piped networks (e.g., handcarts, vacuum tankers, or trucks), to treatment and end use/disposal.
Standard Definitions of Terms and Variables
Terminology
Terminology used to describe the components of sanitation systems is extensive, varies regionally, and is often inaccurately applied. To ensure consistency, standard definitions of terms and variables were developed based on the most recent literature (Strande et al., 2014; Tilley et al., 2014). A broad distinction is made between onsite sanitation in which excreta (primarily fecal sludge) are collected and stored where they are generated; and offsite sanitation in which excreta are collected and transported away from where they are generated, in the form of sewage or wastewater (SFD-PI, 2018a).
Containment Systems
The “containment system” is the first step in the sanitation chain (see Figure 1) and refers to both the toilet and the infrastructure immediately following the toilet. Thus, for offsite systems it refers to the toilet and the connection to a sewer or drain. For onsite systems it refers to the toilet, the pit or tank into which the toilet discharges and any soak pit, sewer, drain, or open ground to which the pit or tank is connected (SFD-PI, 2018a).
Assessing “safe management” at the toilet is challenging and depends on a range of behavioral issues including cleaning of facilities and handwashing. For this reason, the terms “contained” or “not contained” are used rather than “safe” or “unsafe” management for this step. Contained systems are those which are unlikely to result in pathogen transmission to the user or the general public in the absence of any other adverse behavior. By contrast systems described as “not contained” result in an elevated risk of exposure to pathogens in the nearby population irrespective of household habits such as handwashing.
A set of 33 generic “containment systems” were developed (Table 2). The systems are distinguished specifically by features that impact on “containment”—for example whether or not a tank is fully lined (sealed) or has permeable walls or a permeable bottom, and those which are damaged or flooded. An important distinction is made between septic tanks which, when properly designed and constructed, always have an effluent outlet connected to a soak pit, leach field or to sewerage, and basic tanks even if the latter are fully lined.
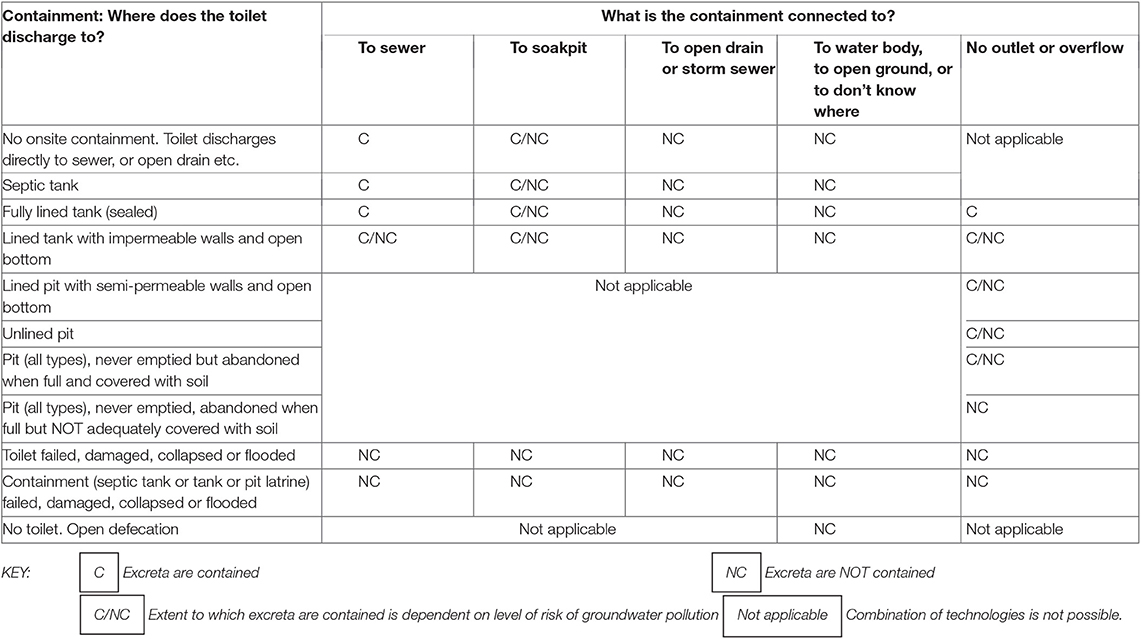
Table 2. Containment systems (from SFD-PI, 2018a).
Four of the containment systems are always “contained”. For example, excreta from toilets that discharge directly to sewers are “contained” because excreta within a sealed and impermeable sewer present a low public health risk.
Twenty systems are always “not contained” either because they are broken, flooded, or damaged, or because they discharge supernatant (liquid effluent) directly to the environment. This includes any kind of tank connected directly to open drains, water bodies or open ground which results in a high risk of population exposure to pathogens.
The remaining systems are designated as contained/not contained (Table 2). These are systems where some fraction of the excreta infiltrate to the ground including systems with a lined or unlined pit, a tank with open bottom or soak pit (which includes leach fields). These systems are assumed to be “contained” unless their use results in a significant risk of polluting groundwater which is used for drinking by people in the nearby vicinity. The risk of groundwater pollution is estimated from the depth of groundwater, the percentage of groundwater used for drinking water, local geology, and the distance between groundwater sources and the sanitation containment system (ARGOSS, 2001; Bains et al., 2014).
Emptying and Transport
“Emptying,” the second step on Figure 1, is defined as “the manual or motorized removal of fecal sludge from onsite sanitation systems” (SFD-PI, 2018a). “Transport,” includes “the manual or motorized conveyance of fecal sludge emptied from onsite sanitation systems” and “the conveyance of wastewater using a sewer network” (SFD-PI, 2018a).
Assessing safe management of both emptying and transport operations, from the perspective of workers and people in the immediate vicinity, is challenging and, as with containment, driven largely by behavioral issues. For this reason, the approach focuses on the fate of the excreta being emptied and transported. All excreta which are delivered to treatment contribute to the green “safely managed” arrows. This includes all fecal sludge which is trucked to treatment, and wastewater and supernatant which reaches treatment in a sewer, irrespective of whether these originated in a system defined as “contained” or “not contained.”
Fecal sludge which is dumped into open drains or water bodies, or otherwise not delivered to treatment, plus sewer overflows caused by blockages and unregulated discharges of wastewater to open drains or water bodies are considered “not safely managed” and contribute to the red arrows at this point in the sanitation chain. This is also true of leakage from sewers where this is likely to result in a significant risk of polluting groundwater used for drinking.
Treatment
“Treatment” is any “process (or series of processes) that changes the physical, chemical, and biological characteristic or composition of any and all influent (wastewater or fecal sludge or supernatant) so that it is safe for end use” (SFD-PI, 2018a). The approach is aligned with the approach set out in the WHO Guidelines on Reuse of Wastewater and the SSP. Importantly, the SFD definition does not specify treatment processes that are “safe” but calls on stakeholders in any given city to assess the risk to downstream populations and designate flows as “safe” or “not safe” accordingly. Thus, wastewater discharging without treatment to a long sea outfall (a pipeline or tunnel that discharges wastewater to the sea) may be deemed safe, while partially-treated wastewater re-used to irrigate salad crops may be deemed unsafe. Stakeholders are also urged to take into account the extent to which treatment facilities meet national standards, operate reliably year-round, and the impact of climate events which may, for example, cause combined sewer overflows.
Fecal Sludge Which Remains in Containment Systems
A special case exists where excreta does not “flow” physically from a container, but remains within a containment system and does not create a risk of groundwater pollution. Typically, this would comprise a well-designed, properly managed pit latrine that has not yet been emptied or where the contents are covered over in situ once the container is full. This is represented on the SFD Graphic by a green “safely managed” arrow, from containment to treatment although there is no actual flow.
The 39 Cities
To date the SFD production process has been implemented in numerous cities by a wide range of organizations. The SFD reports for over 90 of these have been reviewed, published and are available on the open access project website (SFD-PI, 2018c). This paper presents findings for the 39 cities for which reports were finalized during phase 1 of the SFD Promotion Initiative project. The phase 1 cities were selected to ensure a spread in terms of region, size, and demographics; selection was also influenced by demand and the existence of links to the SFD Promotion Initiative's partners. Data from six of these cities—Dhaka, Bangladesh; Kampala, Uganda; New Delhi, India; Santa Cruz, Bolivia; Hawassa, Ethiopia and Lima, Peru—were previously studied (Peal et al., 2014b; Scott et al., 2019) and were subsequently updated in phase 1 of the SFD-PI.
The city with the largest population is New Delhi, India with 16.35 million inhabitants while Bure, Ethiopia has the smallest population, 27,386. Eight are either capital cities or cities with populations in excess of three million, 13 are secondary cities with populations between 500,000 and three million, and 18 have populations below 500,000. The total population of the 39 cities is 72 million (Table 3).
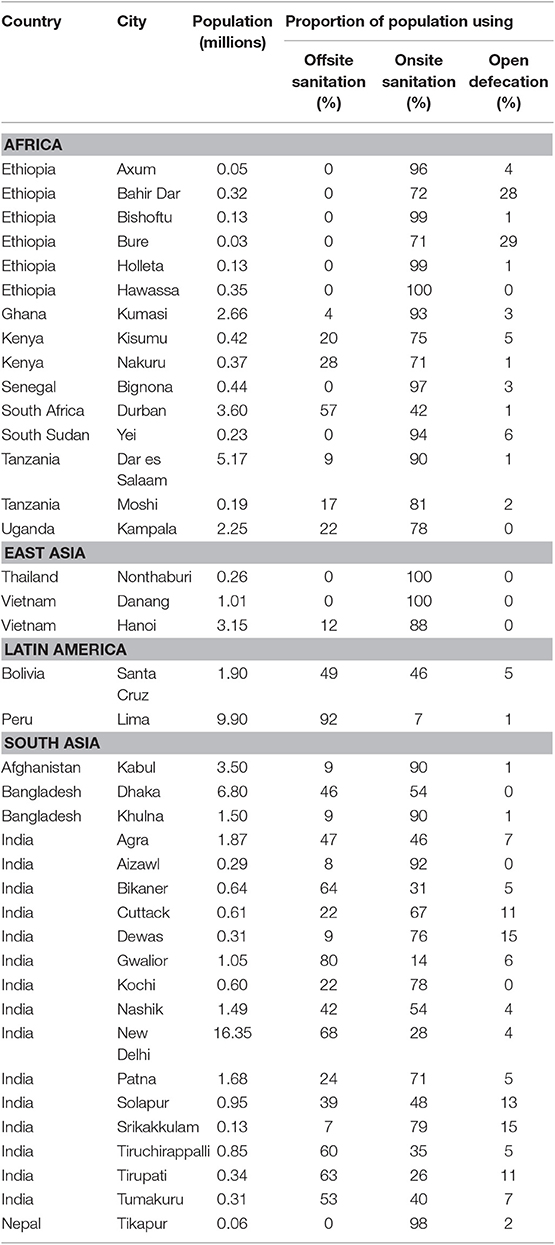
Table 3. Summary data for the 39 cities where the SFD production process was implemented (SFD-PI, 2018c).
In most of the cities, sanitation is provided through a mix of onsite and offsite services with some open defecation. Three cities are completely reliant on onsite sanitation—Nonthaburi, Thailand; Danang, Vietnam and Hawassa, Ethiopia, while the cities with the highest proportion of the population connected to offsite sanitation services are Lima, Peru (92%) and Gwalior, India (80%). Only six cities reported no open defecation.
Results
Assessment of Safely Managed Sanitation
The results broadly confirm analysis and findings from earlier implementation of the SFD method reported in Peal et al. (2014b). Overall, only two-fifths (42%) of the 72 million people living in the 39 cities use a sanitation system that results in safe management of their excreta (Figure 2). A summary of the main drivers of unsafe management is shown in Table 4.
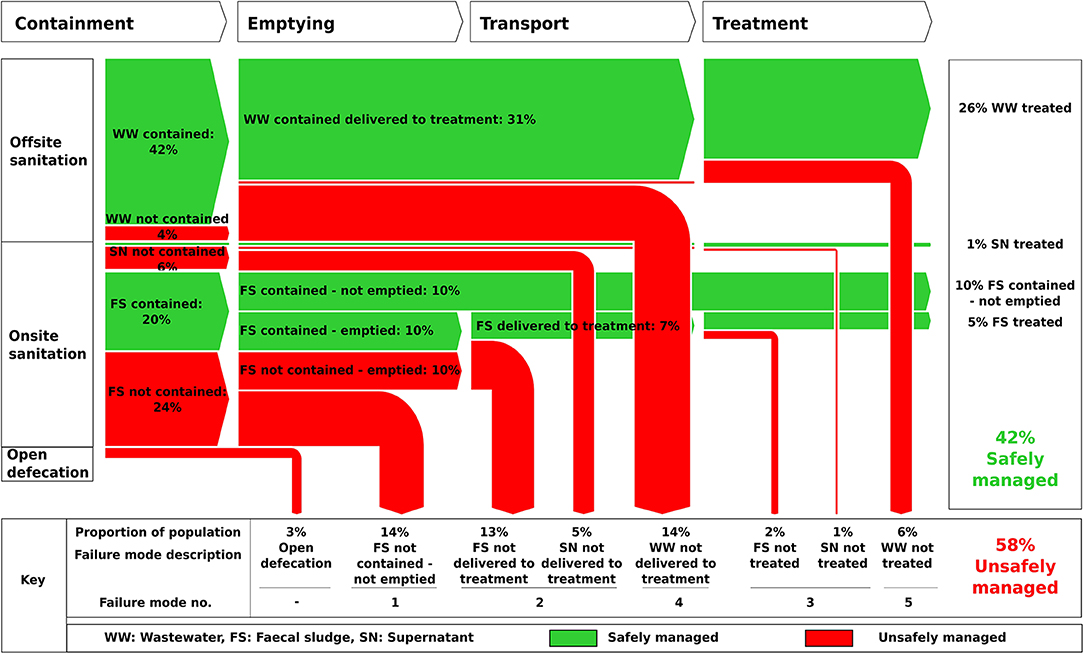
Figure 2. Summary SFD Graphic for the 39 cities where the SFD production process was implemented (from SFD-PI, 2018c).
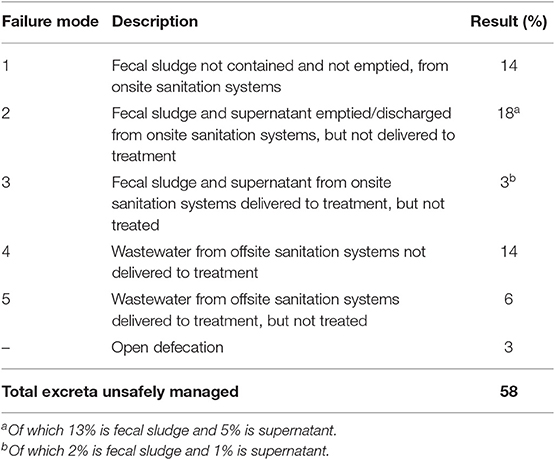
Table 4. Summary of failure modes shown on Figure 2 (SFD-PI, 2018c).
Approximately one half (51%) of the total population (72 million) in the 39 cities use onsite sanitation. Of these one third (31%) are associated with excreta being ultimately safely managed. Just over half of the population (57%) who use offsite sanitation are using systems that are associated with safe management of excreta.
Modes of Failure at City Level
In only three cities are 75% or more of excreta safely managed, while in 13 cities <25% of excreta are safely managed. In Dhaka and Khulna, Bangladesh and Dewas, Solapur and Srikakkulam, India, <10% of excreta in each city are safely managed (Figure 3).
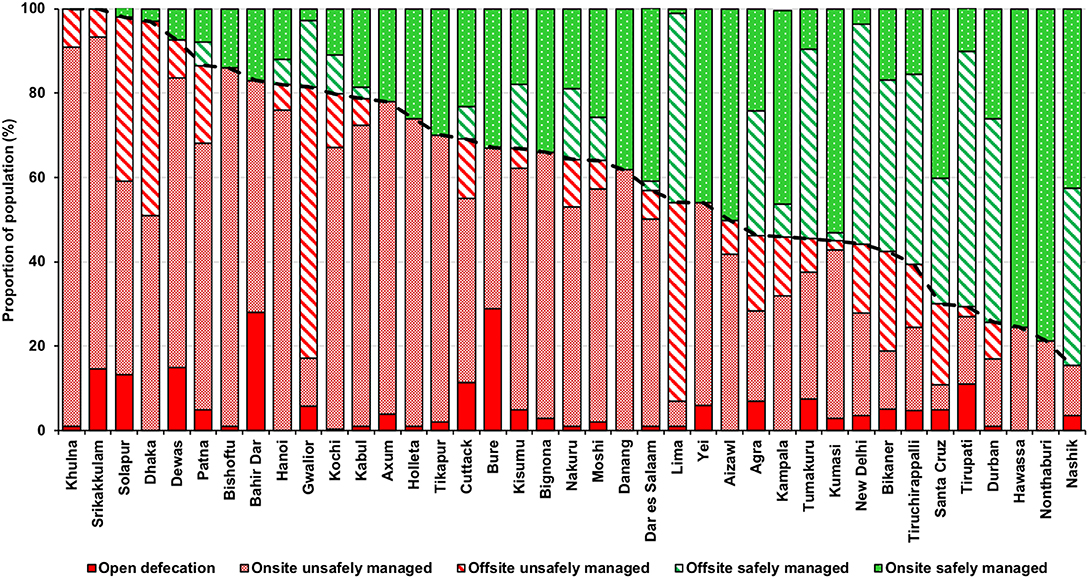
Figure 3. Proportion of population with safely managed and unsafely managed sanitation (onsite and offsite) by city (SFD-PI, 2018c).
The SFD Report for each city highlights where “failures” in sanitation service are occurring, as indicated by the red arrows in each SFD Graphic. In most cities there are multiple service failures, see for example Kampala, Uganda; Patna, India or Santa Cruz, Bolivia, while in some cities there is a dominant mode of failure, see for example Bishoftu, Ethiopia; Khulna, Bangladesh and Kumasi, Ghana. Depending on local conditions failure can result either in contamination being concentrated at the community level or being spread more widely, primarily through drainage channels, placing a larger population at risk.
There are three failure modes for onsite sanitation (Figure 4) and two failure modes for offsite sanitation (Figure 5).
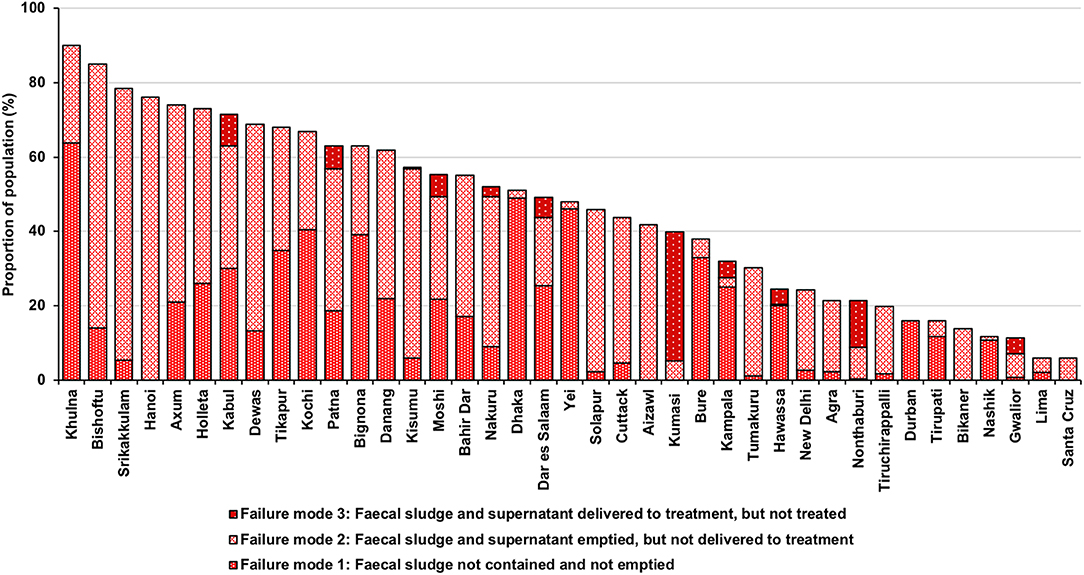
Figure 4. Proportion of population with unsafely managed sanitation (onsite) by city, by failure mode (SFD-PI, 2018c).
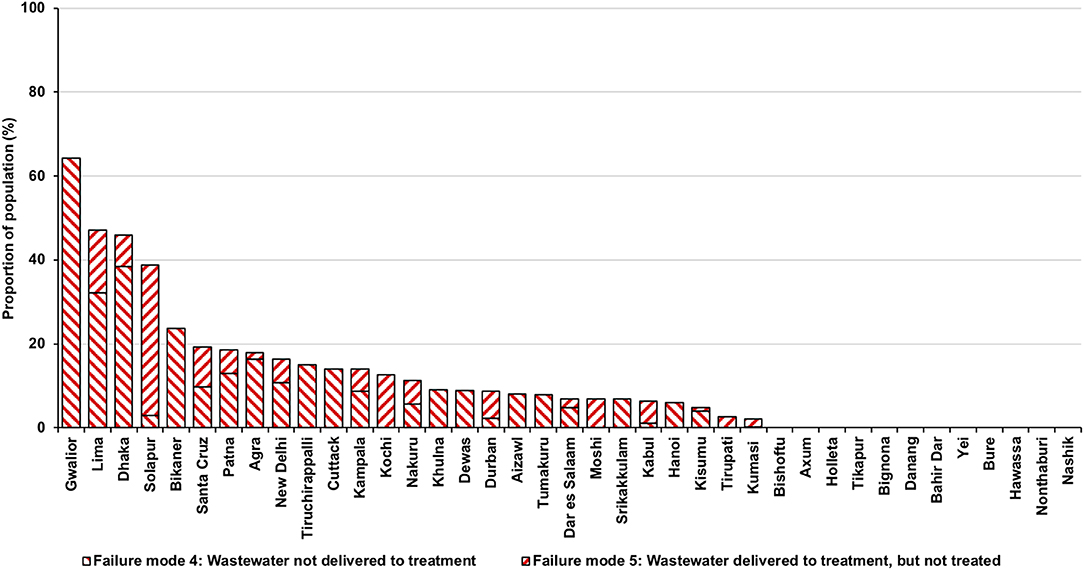
Figure 5. Proportion of population with unsafely managed sanitation (offsite), by city, by failure mode (SFD-PI, 2018c).
Failure Mode 1—Fecal Sludge Not Contained and Not Emptied From Onsite Sanitation Systems
Fifty-nine per cent of the total population using onsite sanitation use a containment system that does not “contain” excreta and nearly two thirds (59%) of these are also not emptied (Figure 2). This includes systems that have been unsafely abandoned or are intentionally or unintentionally discharging to open drains or water bodies and the surrounding environment, and are not emptied. This type of containment system is common in the Asian cities where in 10 of the 22 cities more than 30% of the population use this arrangement (Figure 6). Failure mode 1 affects 14% of the population (Table 4) and is most significant in Khulna and Dhaka, Bangladesh and Yei, South Sudan (Figure 4).
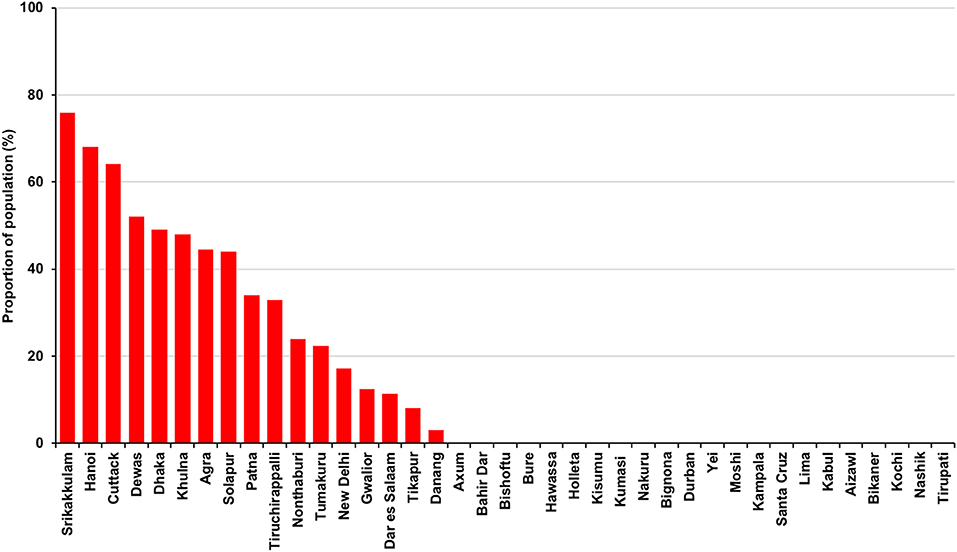
Figure 6. Proportion of population using tanks connected to open drains by city (SFD-PI, 2018c).
Failure Mode 2—Fecal Sludge and Supernatant Emptied/Discharged From Onsite Sanitation, but Not Delivered to Treatment
Non-delivery of fecal sludge and supernatant affects 18% of the total population (Table 4) and is most significant in Hanoi, Vietnam; Srikakkulam, India and Bishoftu, Ethiopia (Figure 4). The majority of material emptied from onsite systems is dumped into open drains, water bodies or on open ground either due to the absence of a treatment plant, or due to illegal dumping. Two-fifths (39%) of the total population using onsite sanitation have their containment system emptied (either manually or using motorized equipment), but only 35% of the emptied contents reaches treatment. Less than a third (28%) of the supernatant discharged to open drains reaches treatment (Figure 2).
Failure Mode 3—Fecal Sludge and Supernatant From Onsite Sanitation Delivered to Treatment, but Not Treated
Around two-thirds (66%) of the fecal sludge and/or supernatant delivered to treatment is reportedly treated, the remainder is either reused or discharged to the environment without treatment. Inadequate or absent treatment affects 3% of the total population (Table 4) and is most significant in Kumasi, Ghana (Figure 4).
Failure Mode 4—Wastewater From Offsite Sanitation Systems Not Delivered to Treatment
Of the 46% of the total population that are connected to offsite sanitation, 69% use a system where wastewater is collected and delivered to treatment (Figure 2). The remaining (31%) either leaks or overflows from sewers or open drains or is discharged to water bodies or to open ground. This may be due to poor design or poor management resulting in absent or broken sewer pipes, pump failures or power supply outages or to the absence of a treatment plant. Non-delivery of wastewater affects 14% of the total population (Table 4) and is most significant in Gwalior, India; Dhaka, Bangladesh and Lima, Peru (Figure 5).
Failure Mode 5—Wastewater From Offsite Sanitation Systems Delivered to Treatment, but Not Treated
Around four-fifths (81%) of the wastewater delivered to treatment is reportedly treated, the remainder is either reused or discharged to the environment without treatment. Inadequate or absent treatment affects 6% of the total population (Table 4) and is most significant in Solapur, India (Figure 5).
Discussion
Implications of the Results
Containment
Many tanks are connected temporarily or permanently to open drains. In terms of public health and pathogen flow, this direct discharge to the environment is effectively open defecation, particularly since it occurs in densely-populated urban areas where exposure to polluted drainage water is likely to be frequent and often significant (Robb et al., 2017). However, it is difficult to gain momentum to change. The use of open drains to carry the supernatant to treatment is often preferred to the construction of soak pits or leach fields; reported reasons include high groundwater levels which limit infiltration, and concerns about polluting the shallow groundwater. The alternative option to install sewers is perceived to be both more technically challenging and expensive. The true costs and benefits of these options are rarely considered.
In these cases where tanks are connected to open drains, the SFD method divides the contents into two flows: (a) the fraction that is supernatant discharging from the tanks to a drainage network and (b) the fraction that is fecal sludge, which may or may not be emptied from the tanks. However, there is limited evidence on which to base estimates of the relative size of each flow, and therefore in the absence of data, the SFD method assumes that the two fractions are equal in size.
The findings from further research, with reference to the work in this field described by Millls et al. (2018) and Robb et al. (2017), could improve not only estimates of the relative size of these fractions but also understanding of their relative public health risks.
Emptying and Transport
Strande et al. (2014) report that the emptying frequency of tanks and pits varies greatly based on the volume and number of users and can be anywhere from weeks to years; while during the filling of onsite containment technologies, the fecal sludge will become denser at the bottom due to compaction, digestion, mineralization, and the ingress of soil. This fecal sludge is more difficult to remove by pumping and is therefore frequently not emptied and left at the bottom of the pit or tank. In addition, fecal sludge that has been stored in a septic tank for a period of years will have undergone more stabilization than for instance fecal sludge held in a tank connected to a public toilet, which has to be emptied frequently to prevent the contents from overflowing.
Although numerous variables influence the level of public health risk, in the absence of globally applicable data, the SFD method assumes that regardless of the frequency of emptying or method deployed, all fecal sludge emptying events are equally effective. The approach therefore focuses on the outcome of emptying and transport services, specifically asking whether or not the emptied fecal sludge reaches treatment or not. It does not consider how “safely” the emptying is performed—i.e., the health risk experienced by emptying service providers and/or the general public living in the immediate vicinity of an emptying event.
Further research into the relative health risks from fecal sludges of different characteristics, which are held in different onsite containment technologies, for different time intervals, under different conditions and emptied using different methods or buried (either in situ or locally), would enable better understanding of the relative public health risks, which could allow further sophistication of the SFD method.
Treatment
With no specified discharge standard, or level set for treatment effectiveness or efficiency, the definition of “treated” within the current SFD production process is agreed by local stakeholders in each city. This is considered reasonable as it both allows for use of the approach in many, varied settings, while potentially improving ownership of the SFD production process and its outputs in the host city.
However, although the main objective of “treatment” is commonly understood by local stakeholders to be linked to protection of public and environmental health, there was little appreciation that treatment technology designs and targets based on pathogen reduction rather than BOD/COD removal, as is the current norm, would improve safeguarding of public health. Many widely used treatment technologies are very poor at removing pathogens (World Health Organization, 2006).
An observation is that many stakeholders would benefit from further guidance to improve understanding of the multi-barrier approach as described in World Health Organization (2006, 2016) and to highlight the importance of linking treatment objectives to the intended end-use or disposal of both liquid effluents and fecal sludge, for instance as described by Strande et al. (2014).
Credibility of SFD Estimates
The intention of the SFD Graphic is to present a credible estimate of sanitation service delivery—a “snapshot” of the current situation—that is a useful starting point for planning purposes. However, using the SFD Graphic on its own (without reference to an accompanying SFD Report), or failing to take into account future scenarios, may provide an overly optimistic picture of urban sanitation service delivery. In the 39 cities this was noted in three key areas:
Proportion of Fecal Sludge “Not Emptied” From Onsite Containment
A significant proportion of excreta are managed using tanks or pits, part of which may remain inside the tank or pit because either it has not yet been emptied, or it is abandoned and covered over when full. For example, in Hawassa, Ethiopia it is estimated that 71% of excreta are currently safely managed in pits and tanks that are not emptied. These practices are significant; a quarter (26%) of the population in the African cities manage their excreta this way, where the majority (58%) of onsite containment systems are pit latrines (Supplemental Data); and a quarter (24%) of the population with safely managed excreta across all the cities, manage their excreta this way (Figure 2). However, eventually all onsite pits and tanks will fill up and will need to be emptied or relocated. If no emptying service is provided and if all available space for relocating a pit or locally burying fecal sludge is used up, the proportion of the population whose excreta are safely managed will fall.
Treatment of Wastewater, Fecal Sludge, and Supernatant
Across all the cities, approximately four fifths (79%) of all excreta delivered to treatment from the total population are reportedly treated. However, data on treatment was not always readily available, particularly where treatment facilities were poorly maintained or where monitoring protocols were not being followed. Information on reuse of wastewater and sludge was also lacking in many cases. This made estimating the proportion of excreta that are safely treated more challenging.
Where treatment performance data were incomplete, the expert opinion of key stakeholders was often used to guide estimations. For example, in Dar es Salaam, Tanzania and in Kampala, Uganda the lack of data was taken as a proxy that performance was low and a figure of 50% was assumed for specific treatment plants.
However, in other locations stakeholders were minded to agree estimates that probably do not reflect reality. For example, in the cities of Bikaner, Tiruchirapalli and Tumakuru, India, an estimate of 100% treatment efficiency was used, commonly based on treatment design capacity. This assumption is likely to result in estimates that would be higher than actual performance and could lead to an over estimate of the proportion safely managed.
Unsafe Flows Which Become Safe
In some cases, excreta may be managed unsafely at one step of the sanitation chain but then managed safely at the next step. For instance, in Cuttack, India where supernatant is reportedly conveyed in open drains to treatment plants; or in Kampala, Uganda where a proportion of the fecal sludge in pits and tanks is considered to be “not contained” but is then emptied and transported to treatment. In both these cities, it is reported that when these flows reach treatment plants a proportion is treated effectively. On the respective SFD Graphics, the treated fractions are drawn as “green” arrows and included in the overall safely managed total. It is important to highlight that this assumption may overestimate the proportion “safely managed” at preceding steps of the sanitation chain, and that the “red” arrows at any earlier steps still require active management to reduce or eliminate the hazard and/or risk of exposure.
Experience From the SFD Production Process
Urban sanitation in cities in low- and middle-income countries is usually delivered using a combination of formal and informal services and there is rarely a single agency in the city that has a reliable overall picture of the situation. The production of SFD Reports in the 39 cities was therefore strongly influenced by the levels of engagement and ownership amongst local stakeholders. Validation of results was significantly improved by using an iterative approach, and in some cases the level of engagement was significantly raised when SFD production was linked to local decision making. For example, in India the level of engagement with the SFD production process was increased by the prospect of it being used within the Government of India's City Sanitation Plans, which guide strategic planning and investment decisions (Centre for Science and Environment, 2018).
Accessing credible data was an issue in all the cities and specific challenges arose in three key areas.
Firstly, the capacity of local technical staff to identify different sanitation containment systems was often limited. This was exacerbated by the fact that it is difficult to assess the substructure of onsite sanitation systems such as septic tanks or the extent of leakage from sewerage.
Secondly there is often confusion over words in common use to describe elements of sanitation systems. Terminology was found to vary widely, not only across regions but within countries and even amongst stakeholders within a city. Tanks of all types were often given a range of names. Many that were referred to as “septic tanks” were not engineered correctly. For example, some had open bottoms, or permeable walls, inadequate retention times, no outlets or outlets discharging directly to open drains, open ground, or water bodies.
Finally there is a widespread lack of performance data, particularly relating to onsite sanitation services. For instance, in locations where emptying of tanks and pits is most commonly carried out by informal service providers, credible data were hard to obtain—especially where manual emptying is used and even more so where manual emptying is technically illegal. In the locations where formal emptying and transport services are used, such as in Kampala, Uganda, data was comparatively more available.
Addressing all three of these constraints, engagement with the SFD process was reported to create a much stronger understanding and concensus amongst key stakeholders about what the current sanitation system currently comprises and how well it is performing.
Conclusion
The SFD Promotion Initiative's standard methodology for the first time provides a consistent framework and increasing dataset with which to consider the urban sanitation challenge in terms of regional trends, common issues, and priorities.
The data present a stark picture with respect to SDG target 6.2. Three-fifths of the 72 million people living in the 39 cities use a sanitation system that does not result in safe management of their excreta (although it is important to recall that the definition of safe management used here is not the same as that used by the JMP when reporting progress on SDG 6.2). Both onsite sanitation with fecal sludge management and sewerage were associated with safe management and unsafe management with no discernable difference in outcomes between the two types of systems.
The performance of sanitation systems in these cities point to some urgent areas for improvement:
• The review and improvement in the quality of onsite containment systems to ensure that they protect against public health and wider environmental risks. The risks associated with the use of open drains as a means of conveying supernatant from tanks appear to be systematically underestimated.
• Scaling up of emptying, transport, treatment, and reuse options for fecal sludge from onsite containment systems, along with improved monitoring. These systems remain important and can provide appropriate containment at household level, but improvements in service delivery are required to ensure safe management along the entire sanitation chain.
• Improved management and monitoring of sewerage to reduce leakage and overflows from piped systems.
• Greater emphasis on the importance of safeguarding public health by linking wastewater and fecal sludge treatment objectives to the intended end-use or disposal in line with WHO guidelines.
• Efforts to improve management and monitoring at national and local level could usefully be focused on development and dissemination of appropriate norms and standards at each step of the sanitation chain.
At the most fundamental level, adequate funding, training, and investment in human resources to secure sustained and active management of urban sanitation is imperative.
The process of analyzing excreta flows also supports more sophisticated means to analyse their complexity within any given city, enabling bespoke development of a range of appropriate, integrated sanitation solutions. The implications are the importance of recognizing that every city has its own specific sanitation characteristics, and that many and varied parallel solutions are needed to achieve city-wide integrated sanitation in each case.
Data Availability Statement
The datasets on which the analysis described in this paper are based are available on https://sfd.susana.org/data-to-graphic. A downloadable excel file with an extract of the relevant data is available at https://sfd.susana.org/knowledge/resources/sfd-library.
Author Contributions
All authors were active in the conception and delivery of the SFD-PI project on which this analysis is based. AP and BE led the conception and design of the analysis on which this paper is based. AS led the development of the SFD graphic generator and database. SA and OV carried out the preliminary analysis of data from the SFD database. AP performed the final analysis and wrote the first draft of the manuscript. BE wrote substantial sections and restructured the manuscript. LSt, LSc, RS, RB, IB, and PH contributed to the overall structure of the paper. All authors contributed to manuscript revision, read, and approved the submitted version.
Funding
The work described in this paper was funded by the Bill & Melinda Gates Foundation under grant agreement SFD v1 (OPP1118283) and SFD v2 (OPP1140623). Funding for open access publishing of results from this grant is also financed under separate funding arrangements provided by the Bill & Melinda Gates Foundation.
Conflict of Interest
The authors declare that the research was conducted in the absence of any commercial or financial relationships that could be construed as a potential conflict of interest.
Acknowledgments
Data used in the preparation of city SFDs was provided by a large number of local stakeholders who are listed in each report. Important contributions to the development of the method and collection of data were also made by: Susanne Bieker, Arne Panesar, and Cecilia Rodrigues [Gesellschaft für Internationale Zusammenarbeit (GIZ) GmbH, Dag-Hammarskjöld-Weg 1-5, 65760 Eschborn, Germany]; Bhitush Luthra, Shantanu Padhu, and Suresh Rohila [Centre for Science and Environment (CSE), 41, Tughlakabad Institutional Area, New Delhi 110062, India]; and Claire Furlong and Alix Lerebours [Water Engineering and Development Centre (WEDC), The John Pickford Building, Loughborough University, Loughborough, United Kingdom].
Supplementary Material
The Supplementary Material for this article can be found online at: https://www.frontiersin.org/articles/10.3389/fenvs.2020.00001/full#supplementary-material
References
ARGOSS (2001). Guidelines for Assessing the Risk to Groundwater from on-Site Sanitation. British Geological Survey Commissioned Report, CR/01/142, 97.
Bains, R., Cronk, R., Wright, J., Yang, H., Slaymaker, T., and Bartram, J. (2014). Fecal contamination of drinking water in low- and middle-income countries: a systematic review and meta-analysis. PLoS Med. 11:e1001644. doi: 10.1371/journal.pmed.1001644
Baum, R., Luh, J., and Bartram, J. (2013). Sanitation: a global estimate of sewerage connections without treatment and the resulting impact on MDG progress. Environ. Sci. Technol. 47, 1994–2000. doi: 10.1021/es304284f
Centre for Science Environment (2018). Centre for Science and Environment. Available online at: https://www.cseindia.org (accessed November 20, 2018).
Food Agriculture Organization (2018). AQUASTAT Global Water Information System. Food Agriculture Organization(FAO). Available online at: http://fao.org (accessed November 20, 2018).
International Benchmarking Network (IBNET) (2018). The International Benchmarking Network. Available online at: IB-NET.org (accessed November 20, 2018).
IRC (2018). Faecal Waste Flow Calculator. Available online at: https://www.ircwash.org/tools/faecal-waste-flow-calculator (accessed November 20, 2018).
Mara, D., and Evans, B. (2017). The sanitation and hygiene targets of the sustainable development goals: scope and challenges. J. Water Sanit. Hyg. Dev. 8, 1–16. doi: 10.2166/washdev.2017.048
Mehta, M., Mehta, D., and Immanuel, A. (2011). Benchmarking in Emerging Economies: The Performance Assessment System (PAS) Project in India. Ahmedabad: CEPT University.
Millls, F., Willetts, J., Petterson, S., Mitchell, C., and Norman, G. (2018). Faecal pathogen flows and their public health risks in urban environments: a proposed approach to inform sanitation planning. Int. J. Environ. Res. Public Health 15:181. doi: 10.3390/ijerph15020181
Peal, A., Evans, B., Blackett, I., Hawkins, P., and Heymans, C. (2014a). Fecal sludge management (FSM): analytical tools for assessing FSM in cities. J. Water Sanit. Hyg. Dev. 4, 371–383. doi: 10.2166/washdev.2014.139
Peal, A., Evans, B., Blackett, I., Hawkins, P., and Heymans, C. (2014b). Fecal sludge management: a comparative analysis of 12 cities. J. Water Sanit. Hyg. Dev. 4, 563–575. doi: 10.2166/washdev.2014.026
Robb, K., Null, C., Teunis, P., Armah, G., and Moe, C. (2017). Assessment of fecal exposure pathways in low-income urban neighborhoods in Accra, Ghana: rationale, design, methods, and key findings of the SaniPath study. Am. J. Trop. Med. Hyg. 97, 1020–1032. doi: 10.4269/ajtmh
Sato, T., Qadir, M., Yamamoto, S., Endo, T., and Zahoor, A. (2013). Global, regional, and country level need for data on wastewater generation, treatment, and use. Agric. Water Manag. 130, 1–13. doi: 10.1016/j.agwat.2013.08.007
Scott, R. E., Ross, I., Hawkins, P., Blackett, I., and Smith, M. D. (2019). Diagnostics for assessing city-wide sanitation services. J. Water Sanit. Hyg. Dev. 9, 111–118. doi: 10.2166/washdev.2018.113
SFD-PI (2018a). SFD Manual, Volumes 1 and 2, Version 2.0. Available online at: https://sfd.susana.org/knowledge/the-sfd-manual (accessed November 20, 2018).
SFD-PI (2018b). SFD Graphic Generator Source Code. Available online at: https://sfd.susana.org/data-to-graphic (accessed November 20, 2018).
SFD-PI (2018c). SFDs Worldwide. Available online at: https://sfd.susana.org/about/worldwide-projects (accessed November 20, 2018).
Strande, L., Ronteltap, M., and Brdjanovic, D. (2014). Faecal Sludge Management: Systems Approach for Implementation and Operation. London: IWA Publishing.
Tilley, E., Ulrich, L., Lüthi, C., Reymond, P., Schertenleib, R., and Zurbrügg, C. (2014). Compendium of Sanitation Systems and Technologies, 2nd Edn. Zurich: Swiss Federal Institute of Aquatic Science and Technology (Eawag).
United Nations Department for Economic and Social Affairs (2018). World Urbanization and Prospects: The 2018 Revision. New York, NY: United Nations Department for Economic and Social Affairs, Population Division.
Williams, A. R., and Overbo, A. (2015). Unsafe Return of Human Excreta to the Environment: A Literature Review. Chapel Hill, NC: The Water Institute at UNC.
World Health Organization (2006). WHO Guidelines for Safe Reuse of Wastewater, Excreta and Greywater. Geneva: World Health Organization.
World Health Organization (2016). Sanitation Safety Planning: Manual for Safe Use and Disposal of Wastewater, Greywater and Excreta. Geneva: World Health Organization.
World Health Organization (2018). Guidelines on Sanitation and Health. Geneva: World Health Organization.
World Health Organization/United Nations Children's Fund (2017a). Progress on Drinking Water, Sanitation and Hygiene: 2017 Update and SDG Baselines. Geneva; New York, NY: World Health Organization and the United Nations Children's Fund.
Keywords: cities, urban sanitation, monitoring, health risk, excreta flow diagram, SFD, shit-flow diagram
Citation: Peal A, Evans B, Ahilan S, Ban R, Blackett I, Hawkins P, Schoebitz L, Scott R, Sleigh A, Strande L and Veses O (2020) Estimating Safely Managed Sanitation in Urban Areas; Lessons Learned From a Global Implementation of Excreta-Flow Diagrams. Front. Environ. Sci. 8:1. doi: 10.3389/fenvs.2020.00001
Received: 13 September 2019; Accepted: 07 January 2020;
Published: 31 January 2020.
Edited by:
Efthalia Chatzisymeon, University of Edinburgh, United KingdomReviewed by:
Muhammad Hassan, Shanghai Jiao Tong University, ChinaDamir Brdjanovic, IHE Delft Institute for Water Education, Netherlands
Elizabeth Tilley, The Malawi Polytechnic, University of Malawi, Malawi
Copyright © 2020 Peal, Evans, Ahilan, Ban, Blackett, Hawkins, Schoebitz, Scott, Sleigh, Strande and Veses. This is an open-access article distributed under the terms of the Creative Commons Attribution License (CC BY). The use, distribution or reproduction in other forums is permitted, provided the original author(s) and the copyright owner(s) are credited and that the original publication in this journal is cited, in accordance with accepted academic practice. No use, distribution or reproduction is permitted which does not comply with these terms.
*Correspondence: Barbara Evans, Yi5lLmV2YW5zQGxlZWRzLmFjLnVr