 Ivan Mura
 Juan Felipe Franco
 Laura Bernal3
 Juan José Díaz
 Raha Akhavan-Tabatabaei
- 1Department of Electrical and Computer Engineering, Duke Kunshan University, Kunshan, China
- 2Research and Knowledge Department, Hill Consulting, Bogotá, Colombia
- 3Department of Industrial Engineering, Universidad de los Andes, Bogotá, Colombia
- 4School of Management, Sabanci University, Istanbul, Turkey
In this work we apply a rigorous and reproducible data analytics process for validation and analysis of the historical data from Bogotá (Colombia) air quality monitoring network since 1998. The reasons for addressing this research study stem from the lack of a consistent approach for cleaning, validating and reporting air quality data. By analyzing the whole dataset, we are aiming at providing citizens and the city authorities with a clear view of the current situation of air quality and of its historical evolution. Without any loss of generality, we focus our analysis on both respirable and fine particulate matter (PM10 and PM2.5) concentrations, which in Bogotá and worldwide are source of concern for their negative impacts on human health. We develop a reproducible and flexible data cleaning methodology for particulate matter concentration data reported by the local authorities, which allows customizing and applying configurable validation rules. Then, we present statistical descriptive analyses by providing intuitive data visualizations, characterizing historical and spatial change of air pollutant levels. Results raise concerns for the high percentage of invalid data, as well as the high levels of PM2.5 and PM10 ambient concentrations as observed in the valid portion of the available data, which frequently exceed national and international air quality standards. The data exhibit encouraging signs of air quality improvement, particularly for PM10. However, the analyses indicate that significant differences exist across Bogotá, and particularly in the south-west zone of the city annual concentrations of particulate matter are up to three or four times the WHO recommendations. We are confident on the methodology and results from our analysis are useful both for local environmental authority and the general public to help in obtaining consistent conclusions from the available data.
Introduction
Urban air pollution is a major environmental problem due to its negative effects on human health and quality of life (Chow et al., 2004; Gurjar et al., 2008; Romero-Lankao et al., 2013; Baklanov et al., 2016). In many Colombian cities, respirable particulate matter (PM10) and fine particulate matter (PM2.5) are the two most critical air pollutants. The plot in Figure 1 shows the 2018 official data from IDEAM, the Colombian Institute for Hydrological, Meteorological and Environmental Studies, for the yearly average concentrations of particulate matter for several Colombian cities equipped with air quality monitoring networks that measure both PM10 and PM2.5 ambient concentration (Instituto de Hidrología, Meteorología y Estudios Ambientales [IDEAM], 2020). Figure 1 depicts a concerning situation where most cities exceed the threshold values recommended by WHO for the average yearly values, 25 μg/m3 for PM10, and 10 μg/m3 for PM2.5 (World Health Organization [WHO], 2018), which are marked as black contours. Notice that the average yearly PM10 concentration of Yumbo is actually not displayed in the chart, as its extreme value (83 μg/m3) would impair the visualization. Also notice that multiple values are reported for two cities (Barranquilla and Bogotá) that are equipped with multiple monitoring stations. It is important to notice that a few cities exceed the national threshold set for the annual average concentration of PM10 of 50 μg/m3 (Ministerio de Ambiente y Desarrollo Sostenible de Colombia [MADS], 2017).
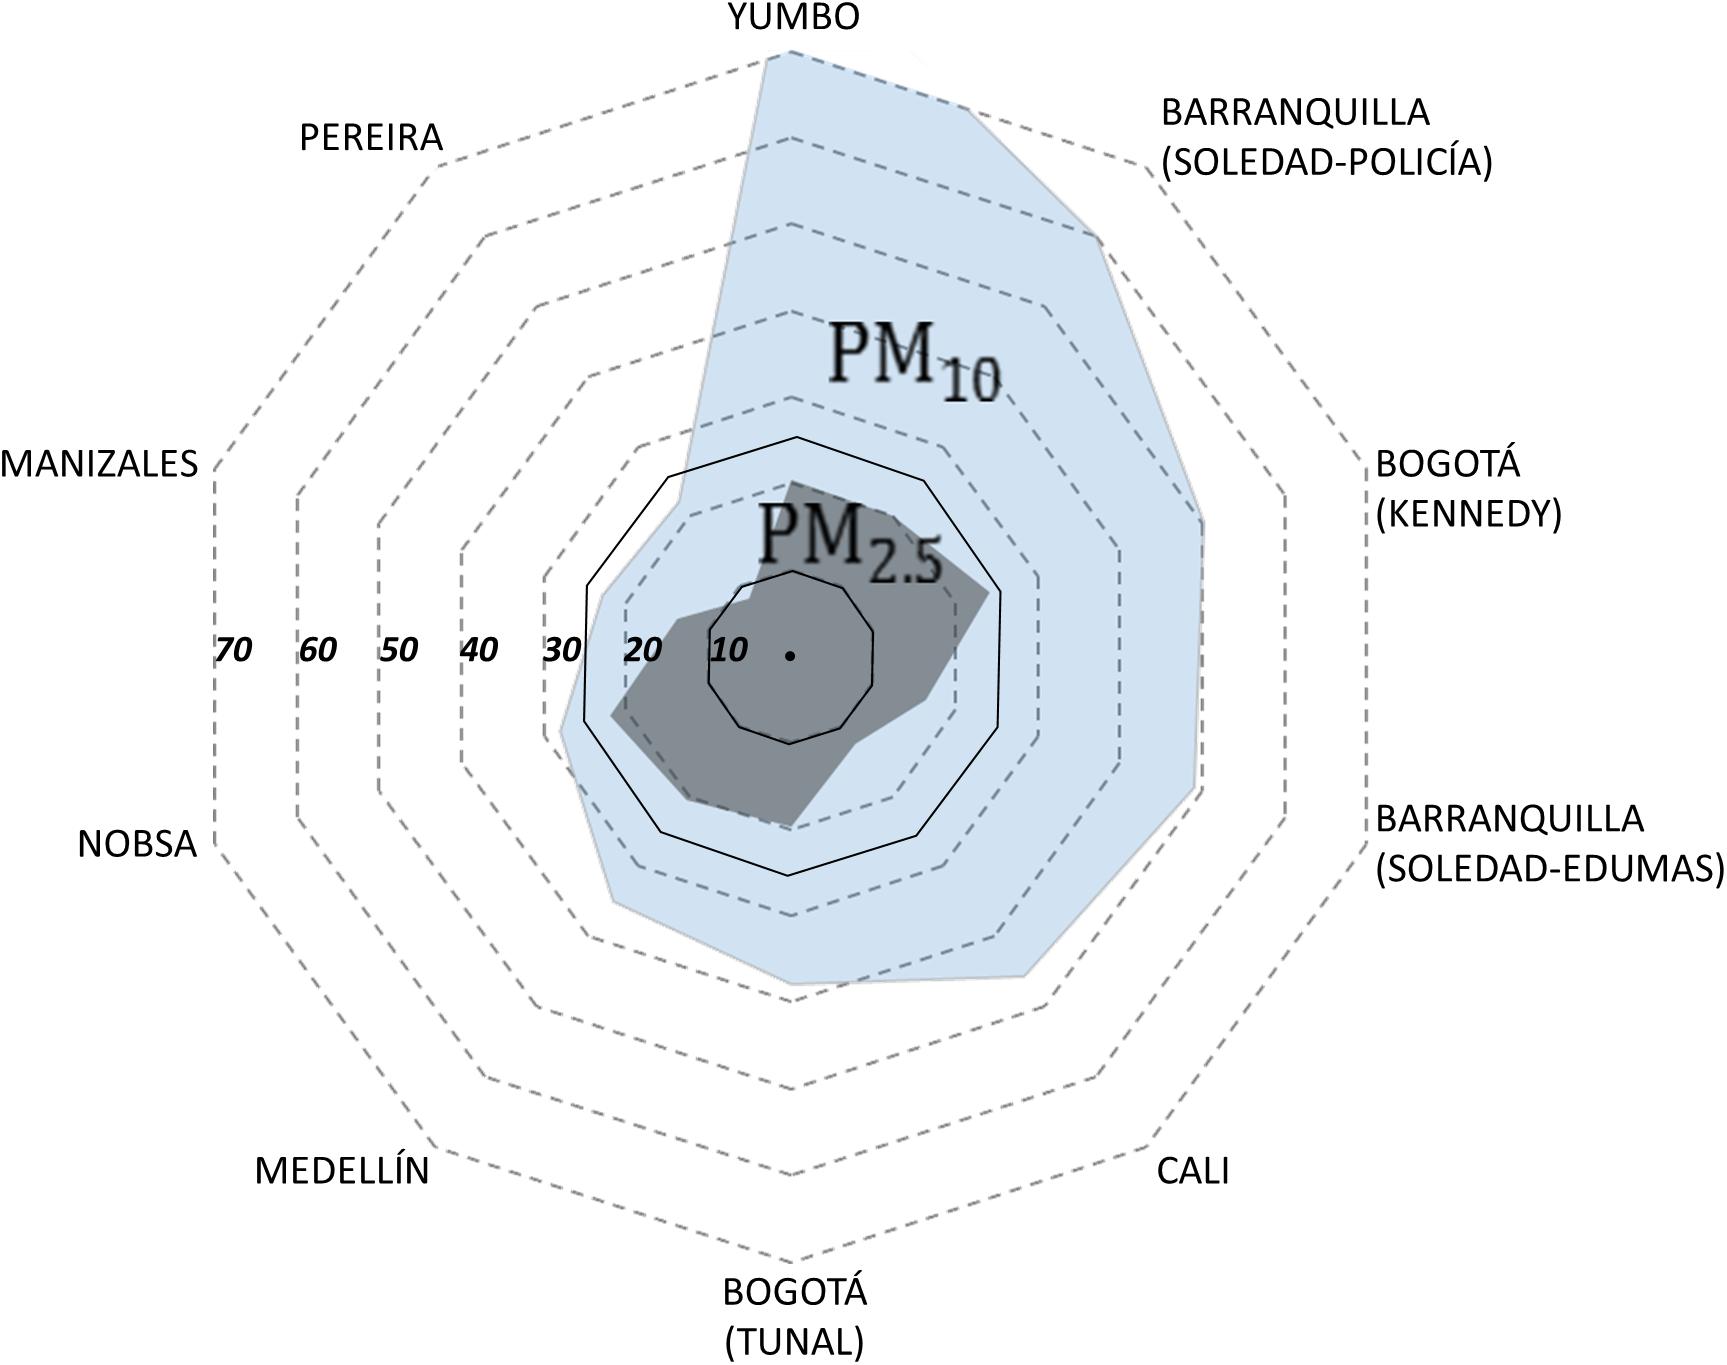
Figure 1. 2018 average concentrations (in μg/m3) of particulate matter for several Colombian cities.
In Bogotá, Colombia (one of Latin American largest cities), PM10 and PM2.5 ambient concentrations are often well above national air quality standards (Franco, 2012; Instituto de Hidrología, Meteorología y Estudios Ambientales [IDEAM], 2016). Even more alarming, during the last decade, annual PM10 and PM2.5 concentrations were more than twice higher than World Health Organization reference values. Recent studies showed that Bogotá ranks among the first cities in the world for the duration of travel times (INRIX, 2018), and that the exposure of citizens traveling across the city with both public and private transportation means can be hazardous for health (Franco et al., 2016; Morales et al., 2019).
This is a matter of concern since Colombia’s national government stated that in Bogotá about 10% of the total deaths are attributable to urban air pollution, representing costs equivalent to 2.5% of the city’s gross domestic product (National Planning Department [DNP], 2017). Moreover, local public health authorities have identified respiratory illnesses as the main cause of morbidity and mortality for children under 5 years of age (Hernández-Flórez et al., 2013).
Much of the effort in terms of air pollution management in Bogotá has been focused on an accurate diagnosis of the problem, mainly strengthening the city air quality-monitoring network and leading to a better understanding of the relevance and impact of the emission sources (Pachón, 2018; Mendez-Espinosa et al., 2019; Morales et al., 2019; Ramírez et al., 2020).
Bogotá air quality network (RMCAB) started its operation in 1998 under the administration of the District Secretariat of Environment, and today it comprises 14 automatic monitoring stations (13 fixed stations and a mobile one) geographically located within Bogotá’s urban area (see Figure 2). Each station measures ambient air pollutant concentrations and meteorological conditions on an hourly basis. RMCAB monitors and sensors use standard methods tested by the United States Environmental Protection Agency (EPA), which are periodically calibrated and receive preventive and corrective maintenance. Specifically, PM10 and PM2.5 instruments use the Beta attenuation monitoring technique to continuously measure the concentrations of these compounds (Secretaria Distrital de Ambiente [SDA], 2019). The data collected by the measuring devices is sent to a central database server managed by the District Secretariat of Environment. Open-access is provided to the data, which can be downloaded in the form of text files from the page of the RMCAB monitoring network (Secretaria Distrital de Ambiente [SDA], 2020).
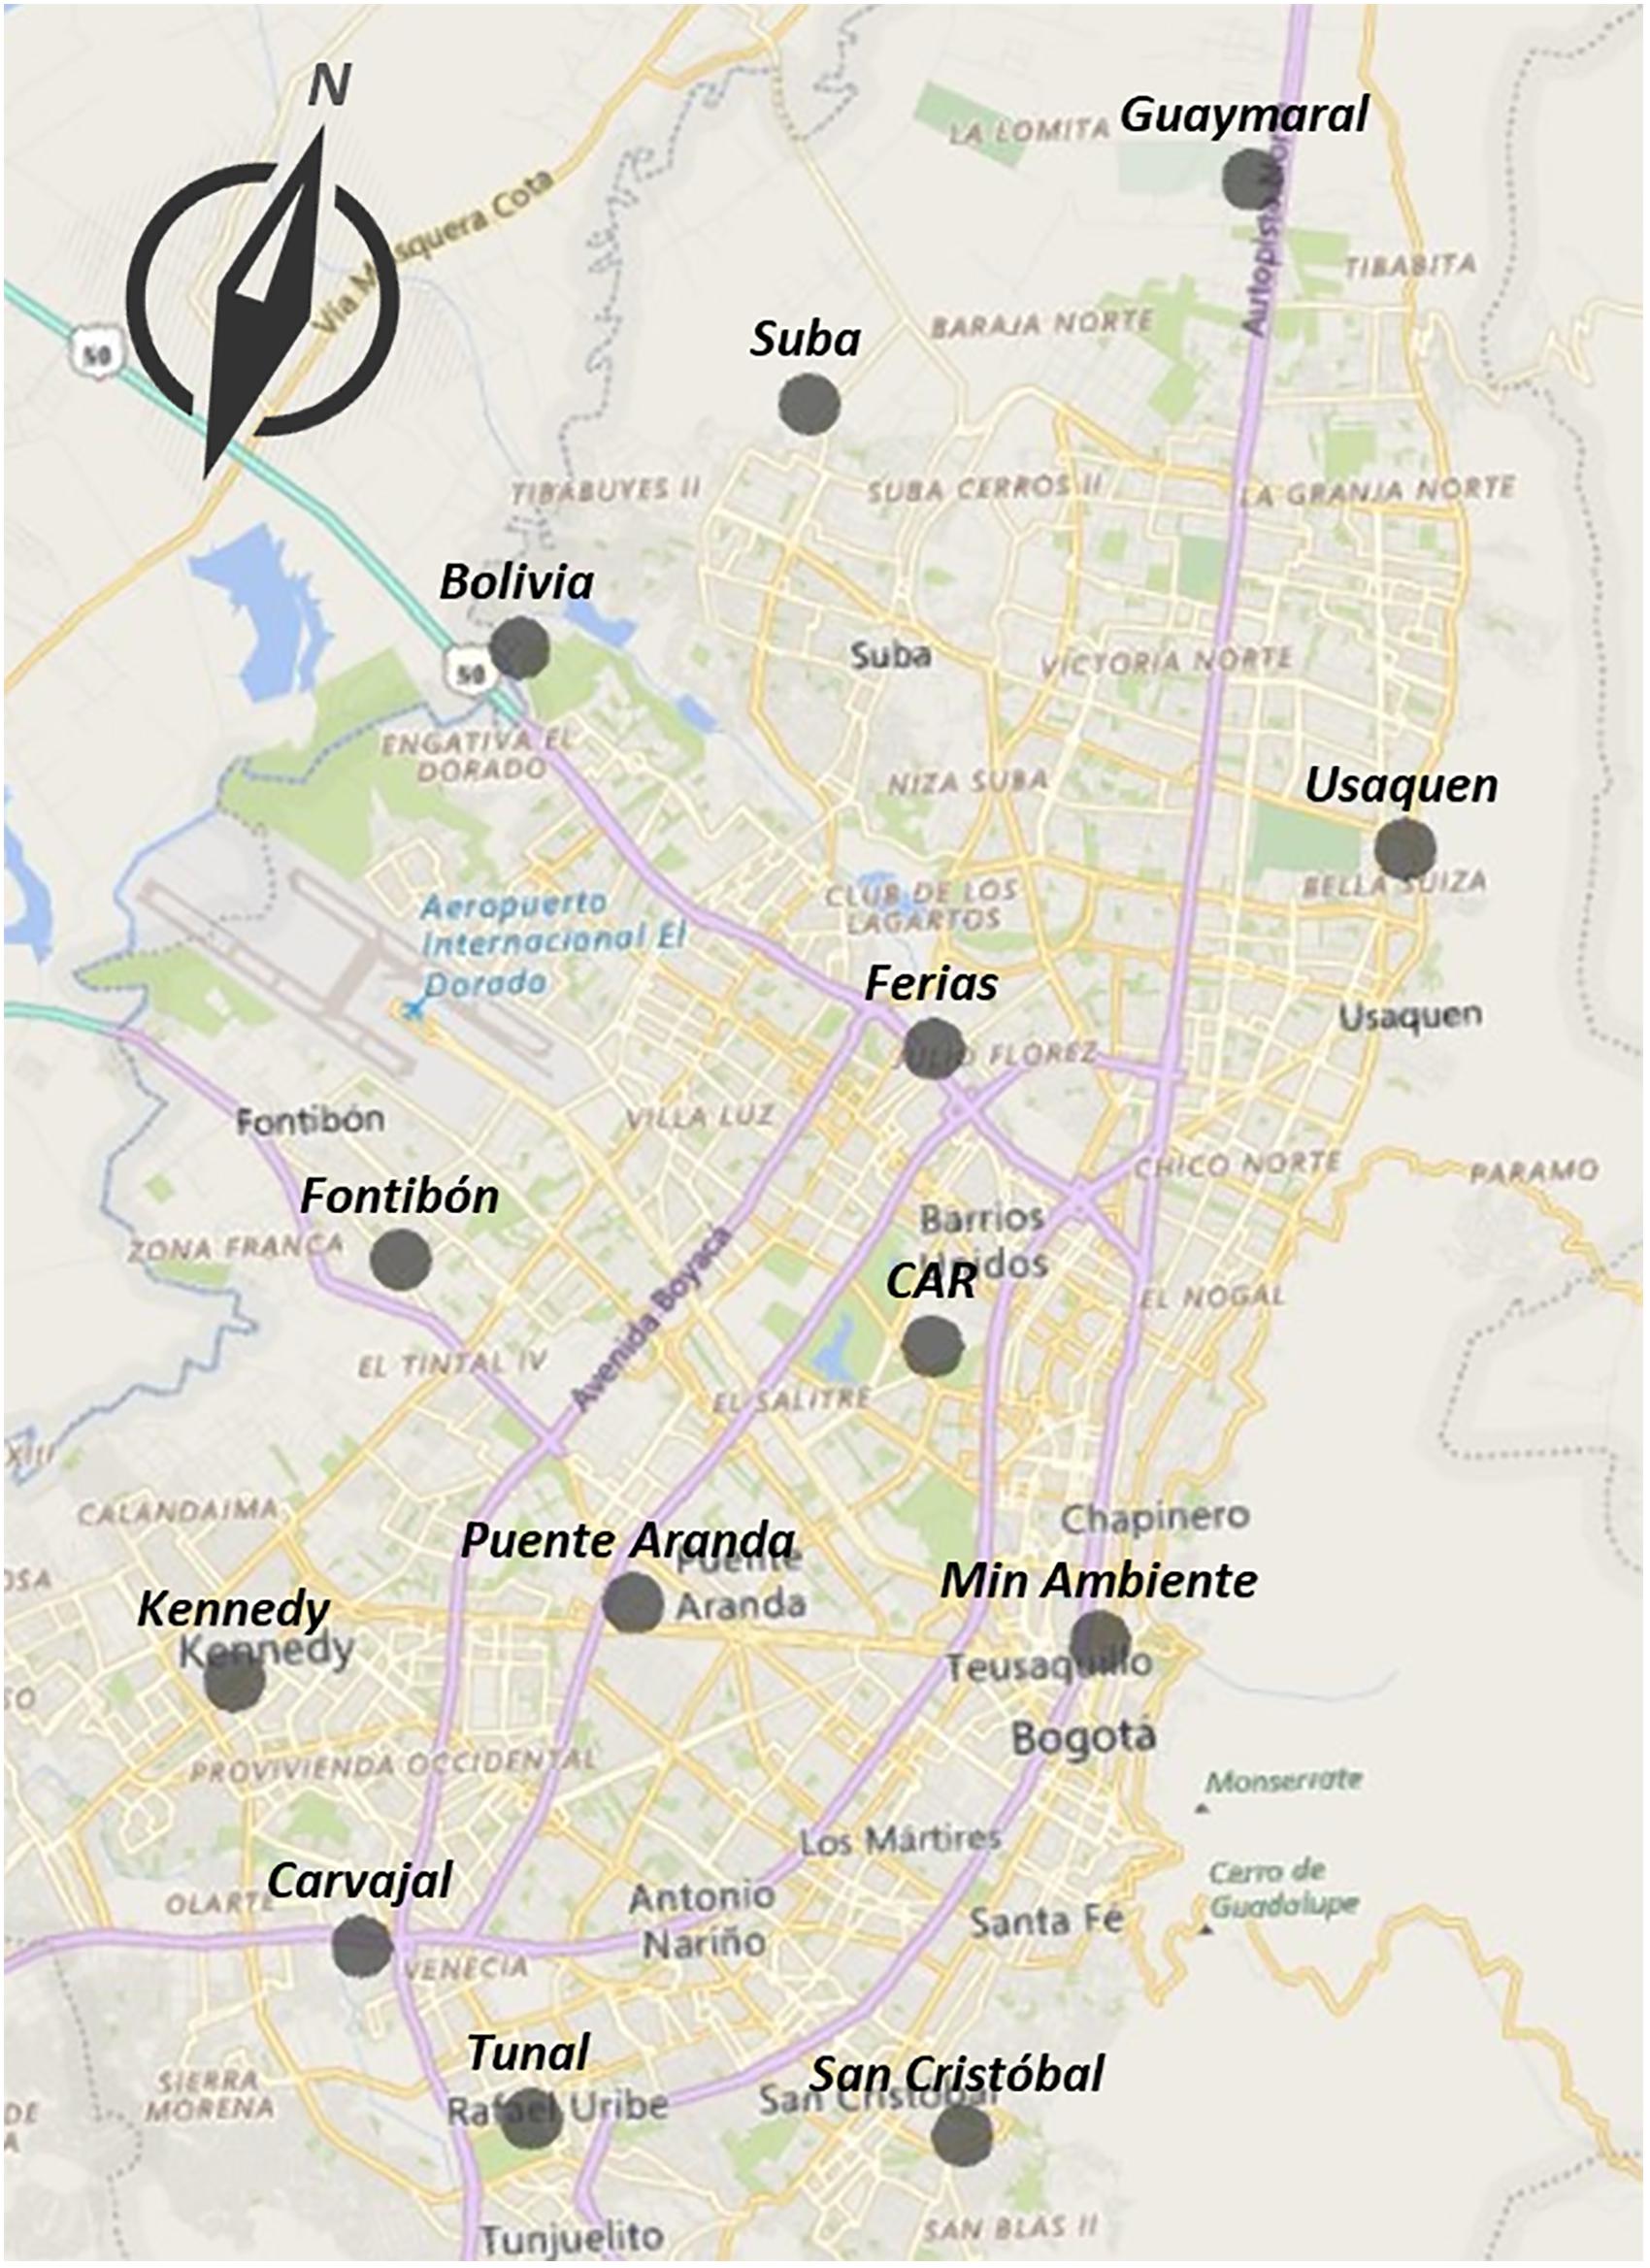
Figure 2. Map of Bogotá urban area with the geographical location of the air quality monitoring stations.
Data from the RCMAB has been crucial for characterizing the problem, leading to the identification of particle-related pollutants as the most critical in Bogotá. Also, it has been relevant when formulating public policies in the city, such as the Ten-Year Air Pollution Abatement Plan (Secretaria Distrital de Ambiente [SDA], 2011). However, much is yet to be done to improve the use and dissemination of the air quality data in the city. While the collected data is open, the public access provided for its visualization and analysis is limited, still focused on the needs of the data owner rather than on those of other data users, including research institutions and the general public. Certainly, one barrier that hinders exploiting historical air quality data is the difficulty in reliably extracting information out of it in a statistically significant way. This data analytics process requires significant technical knowledge not generally available. We believe this is an opportunity given the crucial role of data when formulating pollution control strategies and for improving urban air quality management.
Understanding such data potential, we worked together with the environmental authorities in a collaborative project that defines a structured and replicable methodology for air quality data acquisition, cleaning, validation, analysis and visualization, using big-data and analytics open access instruments. We present in this paper a first glimpse of what this collected data says about air quality in Bogotá, including current condition and historical tendencies.
Materials and Methods
Validation of Air Quality Data
We analyzed PM10 and PM2.5 concentrations data collected by Bogotá Air Quality Monitoring Network. Local environmental authority provided us with the crude datasets for each of the existing 13 fixed stations, containing hourly observations for the 1998–2018 period. The mobile monitoring station data is not included in this analysis since it has been dedicated to the evaluation of air pollution in different heavy traffic roads (at several locations). Also, data from Fontibon and Bolivia monitoring stations are not part of the analysis, as the first station has been in process of site evaluation in the recent years and the latter only reports meteorological data.
We used the R© statistical package (R Core Team, 2018) to consolidate a single tidy dataset. With the aim of defining a simple and repeatable process, we developed a rule-based data validation. Two distinct types of rules were considered for validation:
• Generally applicable rules, which do not refer to the nature of the measured variable, for instance those used to exclude from posterior analysis non-numerical data and reported measurements that are out of the detection range of the monitoring equipment. Also, rules that smooth the data series by removing single points that are extreme peaks/valleys, i.e., data values that drastically differ from the two immediately adjacent measurements. Since monitoring stations are purposefully located far from major emitting sources, such sudden variations are likely due to erroneous measurements.
• Contaminant-specific rules, which do take into account the physical properties of the variable being measured. They are used for instance to invalidate negative values reported for particulate matter measurements, since they are of the nature of concentration and impossible to be negative. Moreover, whenever simultaneous measurements of PM10 and PM2.5 are available at a monitoring station, a rule is applied that verifies whether the PM10 > PM2.5 relationship is maintained. Since PM2.5 (particles whose diameter is not larger than 2.5 μm) is a component of PM10 (particles whose diameter is not larger than 10 μm), valid measurements must satisfy such inequality. In case it is not, this specific rule invalidates both measurements.
Finally, according to the practices of local authorities, we included a rule that removes isolated data points, based on a configurable minimal threshold set on the availability of data in a moving 24-h time window. When applied to the dataset, each rule sets a validation flag for each measurement, without actually removing the invalid values. The specific set of rules to use can thus be flexibly chosen. Each analysis can in principle use a distinct set of validation rules for and new rules can be added to the data validation process in a modular way.
Descriptive Analysis of Air Quality Data
Descriptive analyses of air quality data allow understanding the behavior of pollutant concentrations and provide indications about their trends over time and location. Also, they allow to characterize the very same data availability, defining the scope and statistical significance of the analysis results that can be obtained from such set of data. To portray data availability, we worked on the design of very intuitive visualizations, which can be used to obtain a clear picture of the impact that the validation rules have on the data series. Our objective here was to provide information that is useful for understanding the type of statistical analyses that can be performed with the valid data, as well as to offer a way to analyze the patterns that may exist in the invalid data distribution.
We then determined distributions that adequately fit the valid data on particulate matter, which allows constructing useful models of contaminant behavior. We used the fitdistrplus R© package (Delignette-Muller and Dutang, 2015) to identify suitable fitting distributions for both PM10 and PM2.5 data sets. With this package, we verified the position of the data samples in the Cullen and Frey graph (Cullen and Frey, 1999), which based on the skewness and kurtosis of the data determines feasible distributions to be fitted. Then, we used numerical indicators such as Loglikelihood, Corrected Akaike’s Information Criterion (AICc) and Bayesian Information Criterion (BIC) to determine estimates for the error incurred when using a certain distribution as a model. According to the location of the data samples in the mentioned Cullen and Frey graph, we computed these indicators for the Lognormal, Weibull and Gamma distributions.
Descriptive analyses of the data reported by the different air quality monitoring stations at different time granularities were performed. PM10 and PM2.5 concentrations distribution and variation through hours, days of the week, and years were analyzed. Box plots and confidence intervals (using the Bonferroni method, with a confidence level of 95%) for the average values were produced and mean concentrations were compared to national standards and WHO guidelines.
Valid Data Availability
An important point that we would like to make is that we focused our analysis on achieving an understanding of the PM2.5 and PM10 distribution and tendencies, without dealing with causality factors such as emission sources or factors that influence pollution distribution such as meteorology, or changes in the inventory of sources, quality of fuels, restrictions and regulations. We chose to limit the scope of our work to providing a descriptive analysis of the whole RMCAB dataset, a task that has not been tackled before. We approach our exploration of data through well-stated validation rules, which ensure that our results are reproducible. Finally, we focus on providing intuitive visualizations of the historical air quality of the city. Even though these visualizations are not explicative, they are easily understandable and offer a glimpse into a complex phenomenon that is of significance to the academia, government and the general public.
Results
Valid Data Availability
The data reported by the Bogotá air quality monitoring station includes a set of air pollutants and weather related measurements. Data available for PM10 and PM2.5 in the period 1998–2018 (hourly measurements) was downloaded from the web site of the Bogotá Secretariat of Environment and consolidated in a dataset of around 140 Mb. Then, the rule-based validation process was applied to the dataset.
Figure 3 visualizes the result of the rule-based validation process. It shows the percentage of data that passed all validation rules and those that were invalidated per tidying rule, for the PM2.5 measurements (left panel) and for the PM10 measurements (right panel). A very high percentage of invalid data is remarkable. For PM10, only five monitoring stations have at least 50% of valid data, with just Carvajal and Suba stations having a valid data proportion over 70%. For PM2.5, the percentage of valid data per station is even smaller, also because in the very first years of the monitoring network not all stations were equipped with PM2.5 measurement devices.
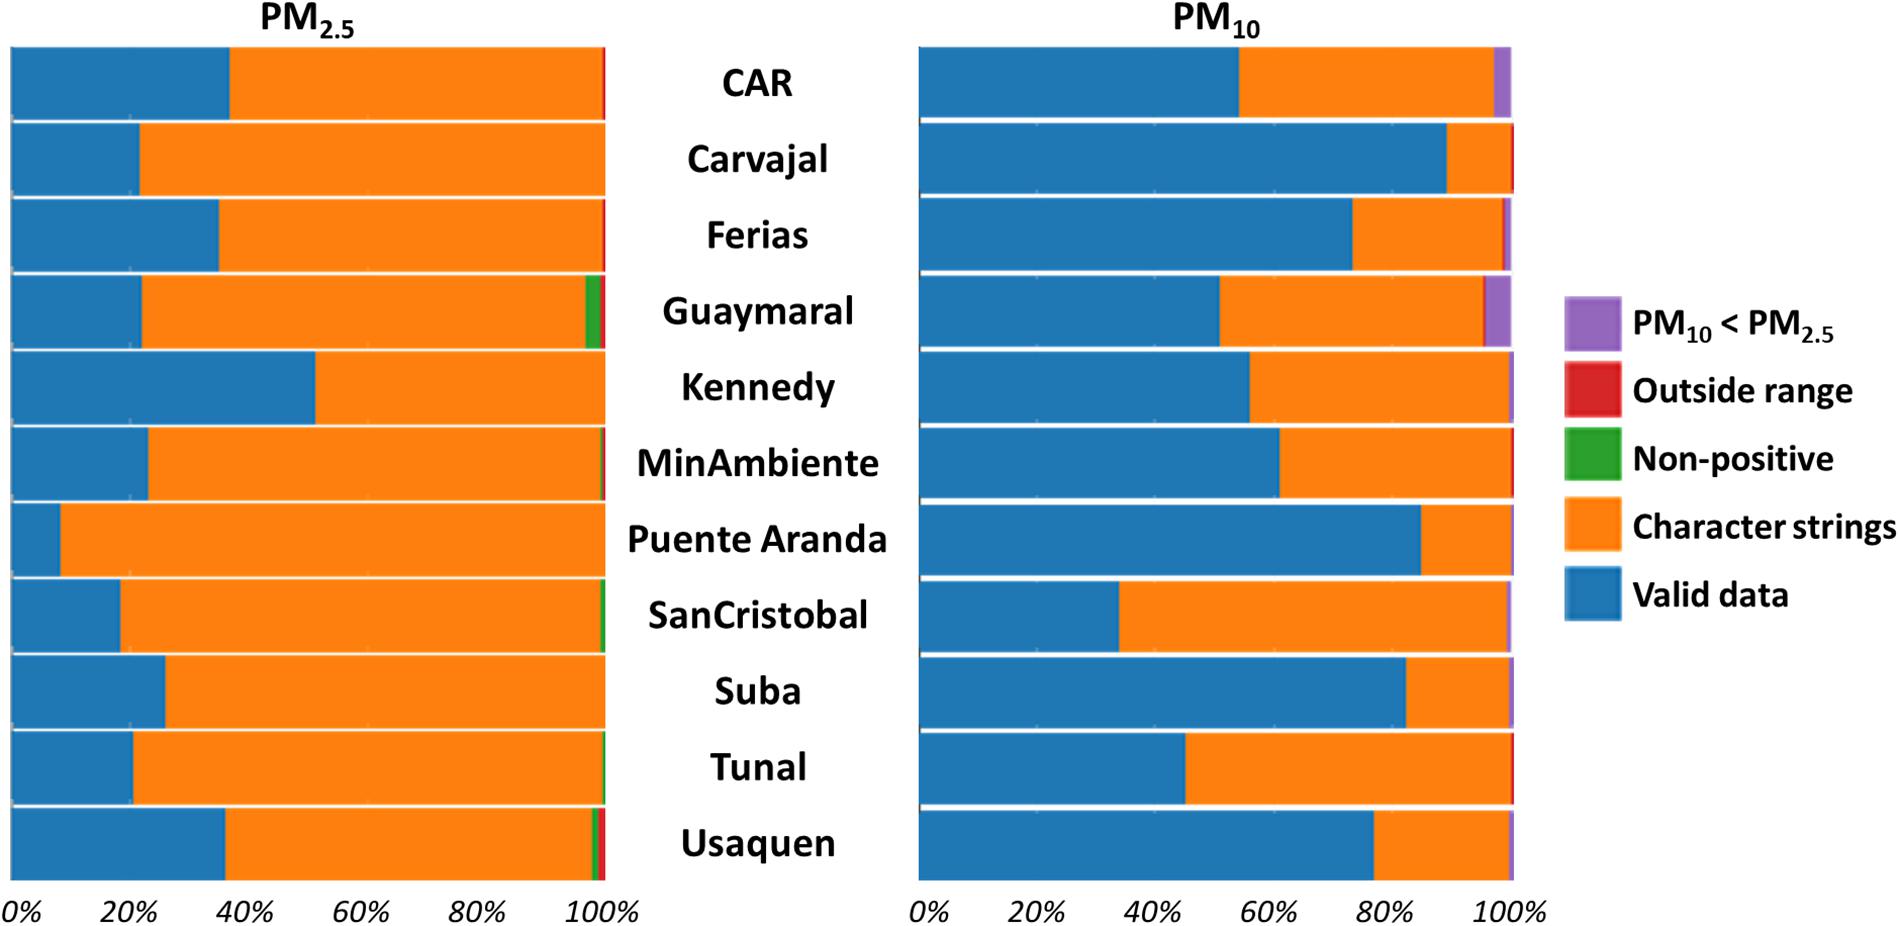
Figure 3. Results of data validation, per station and validation rule, for PM2.5 and PM10 observations.
Most data were invalidated due to the string removal rule (orange portion of the bars). According to the local environmental authority, such string data is inserted in the dataset as a result of instrument failures, preventive maintenance activities, power supply failures, incorporation of new monitoring equipment and communication failure due to port damage. It is therefore worthwhile remarking that most of the data unavailability is due to equipment outages rather than unreliable measurements.
For both pollutants, monitoring stations do not exhibit an appreciable correlation of the percentage of data in the different categories generated by the validation process. Also, no correlation is evident between the amount of valid data for PM2.5 and PM10 at the same station, which suggests that data unavailability is primarily determined by causes that independently affect each contaminant monitoring unit. The subset of data records that passed all the validation tests accounted for around 60 Mb out of the 140 Mb of the original dataset.
Figure 4 shows a heatmap of the daily valid PM2.5 data density for the whole period of analysis (1998–2018). The heatmap reports the density of the valid data with a colored scale according to which a yellow data point indicates the full availability of hourly valid data – 24 valid data points – for a day, while purple denotes no available data. For PM2.5 before 2008 only three stations have reported valid data, and after that valid data was only reported intermittently, while data availability improves significantly from 2009 onwards. Also, for 9 months in year 2013, among all stations only Kennedy reported valid data for PM2.5.
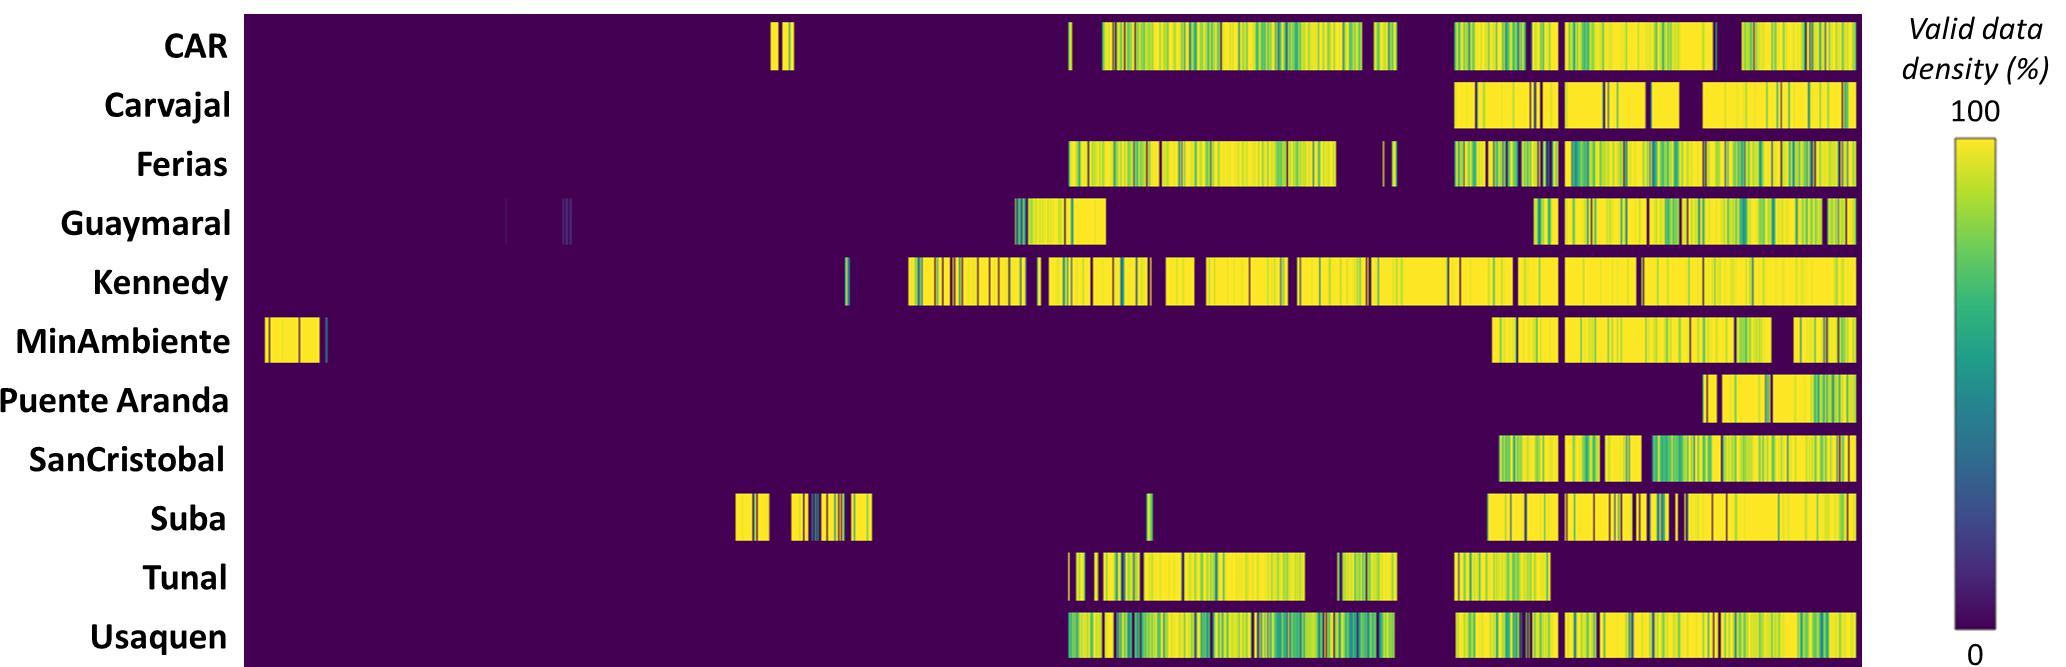
Figure 4. Valid data density heatmap for PM2.5, 1998–2018.
As shown in Figure 5, valid data availability is higher for PM10 than for PM2.5. Several stations, such as Carvajal, Suba, Ferias and Puente Aranda have been consistently reporting valid data within the period of analysis. These visualizations allow determining for which periods it is feasible to generate statistically aggregated indicators for the whole city, and in which ones the available data only allows local or zoned air quality characterization. According to these valid data density results, further analysis in this paper will only take into consideration the 10-year period beginning January the 1st of 2009 and ending December the 31st of 2018.
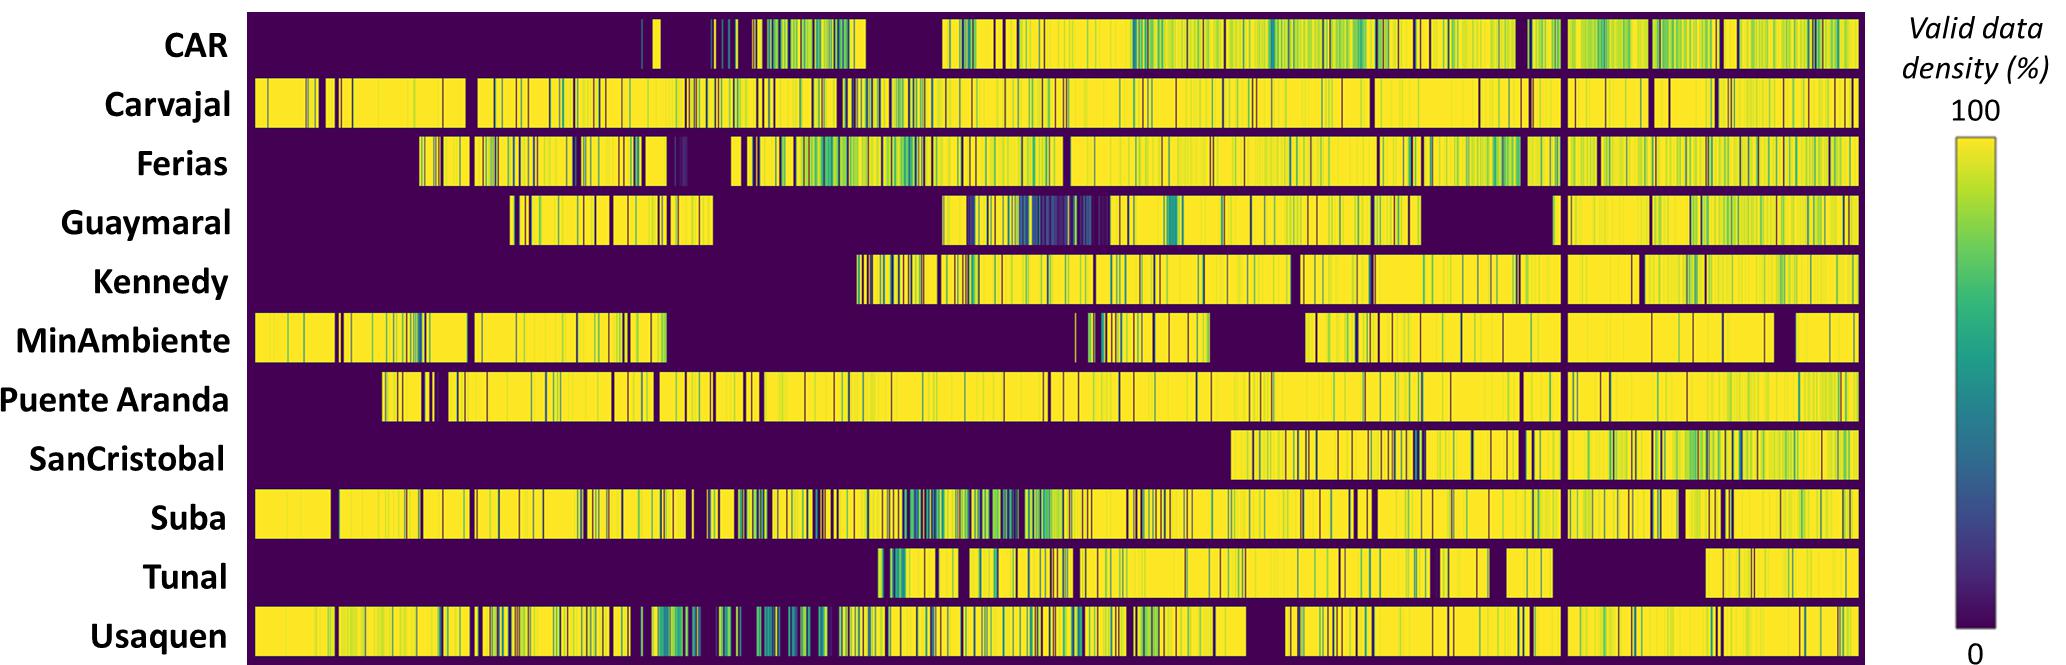
Figure 5. Valid data density heatmap for PM10, 1998–2018.
Statistical Data Treatment
Figure 6 shows the distribution of PM2.5 and PM10 concentrations, with the upper tails in the figure truncated at one fourth of the maximum observed value. The observed PM2.5 measured concentrations ranged in the interval [1.5, 416] μg/m3, with an average of 20.05 μg/m3 and a coefficient of variation (standard deviation/mean) of 0.75, while PM10 ranged in the interval [1.6, 998] μg/m3, with an average of 55.64 μg/m3 and a coefficient of variation of 0.72. Figure 6 also reports WHO annual reference value for particulate matter, i.e., 10 μg/m3 for PM2.5 and 25 μg/m3 for PM10 (World Health Organization [WHO], 2018), and Colombian national standards, i.e., 20 μg/m3 for PM2.5 and 50 μg/m3 for PM10 (Ministerio de Ambiente y Desarrollo Sostenible de Colombia [MADS], 2017). The average values measured for both pollutants are twice above WHO guidelines and for PM10 exceed the threshold value set by the national regulation.
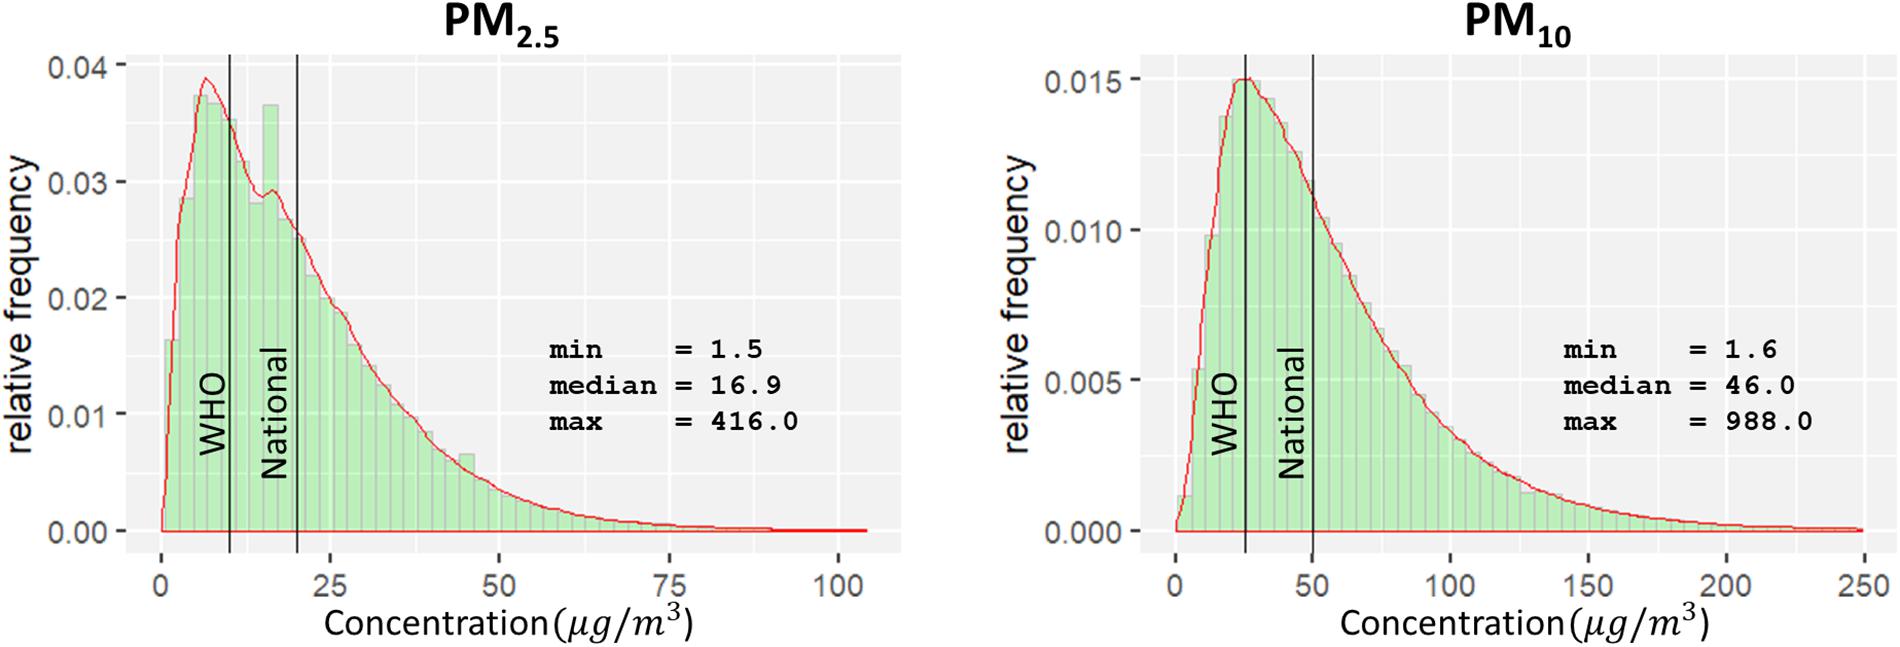
Figure 6. Empirical distributions of measured concentrations of PM2.5 (left chart) and PM10 (right chart).
We plotted the data points in the Cullen and Frey graph to determine suitable distributions for valid data fitting (Figure 7). The orange points are obtained by 500 bootstrapped samples from the original data and allow to see the uncertainty associated with the possible fitting distributions. According to the skewness and kurtosis for the historical data both pollutants can be fitted with a Weibull, Gamma or Lognormal distribution. It should be reiterated that data is obviously auto-correlated, but a time series analysis is not part of this work and only a preliminary descriptive analysis is being conducted.
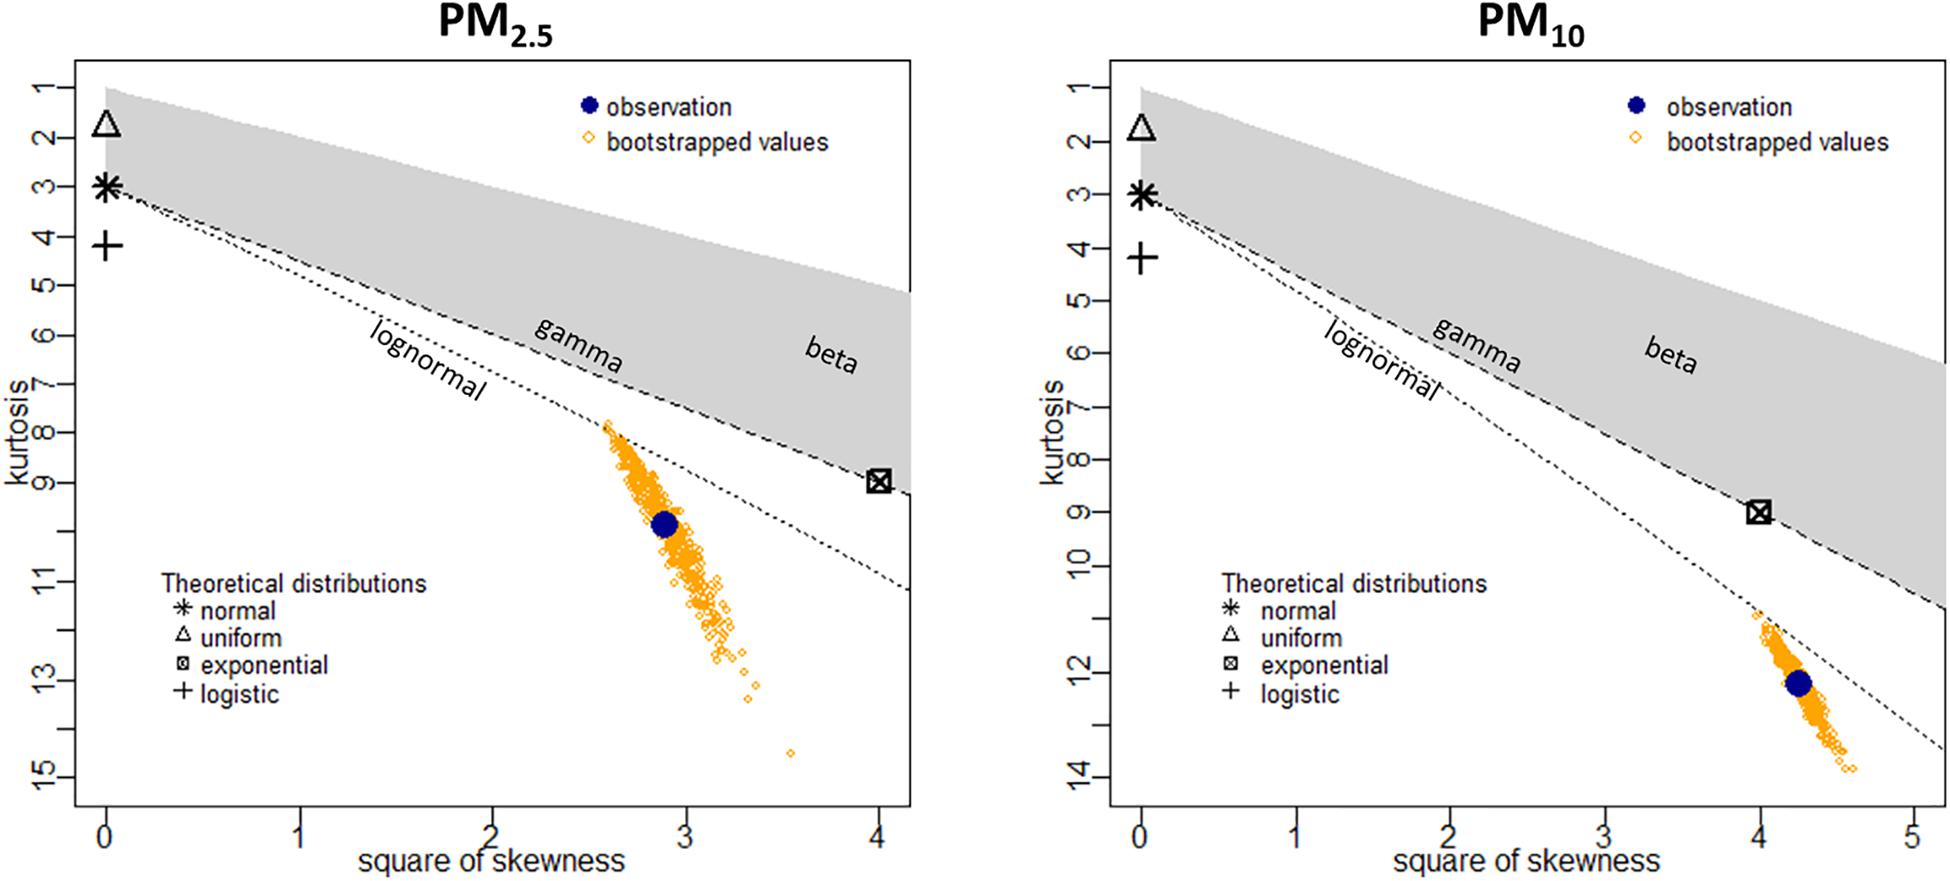
Figure 7. Cullen and Frey graph for PM2.5 (left chart) and PM10 (right chart) valid measured data.
We also compared the data against the three best fitting distributions of each type, finding that for both PM2.5 and PM10 datasets the Gamma distribution was the best choice, as determined by the Loglikelihood, AIC and BIC scores (see Table 1). The best fitting Gamma distribution for the PM2.5 dataset has shape k = 1.839 and rate β = 0.091, while the best fitting Gamma distribution for PM10 has shape k = 2.217 and rate β = 0.026.
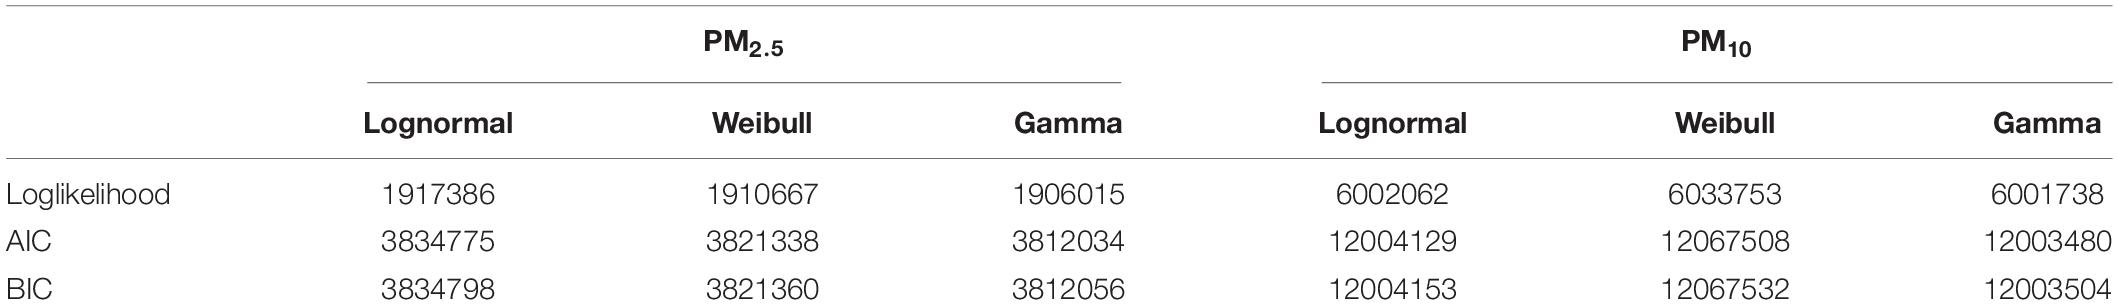
Table 1. Loglikelihood, AIC and BIC indicators for PM2.5 and PM10 data fitting.
Analysis of Air Quality in Bogotá
We start our analysis by exploring the valid data measured at each monitoring station. Figure 8 provides a boxplot of the data (without any aggregation) for the historical concentrations of PM2.5 (left chart) and PM10 (right chart) per station. The boxplots’ center value is the median of the data, while quantiles 75 and 25% are the limits of the box, and the upper/lower whiskers report respectively the largest and smallest measurements within 1.5 times the inter-quartile range. All hourly valid data in the chosen time window (2009–2018) has been considered for this analysis. The chart in Figure 8 describes a situation in which significant differences exist among geographical areas in the city. Monitoring stations located in the southwestern part of Bogotá, such as Carvajal and Kennedy, consistently reported higher concentrations of pollutants.
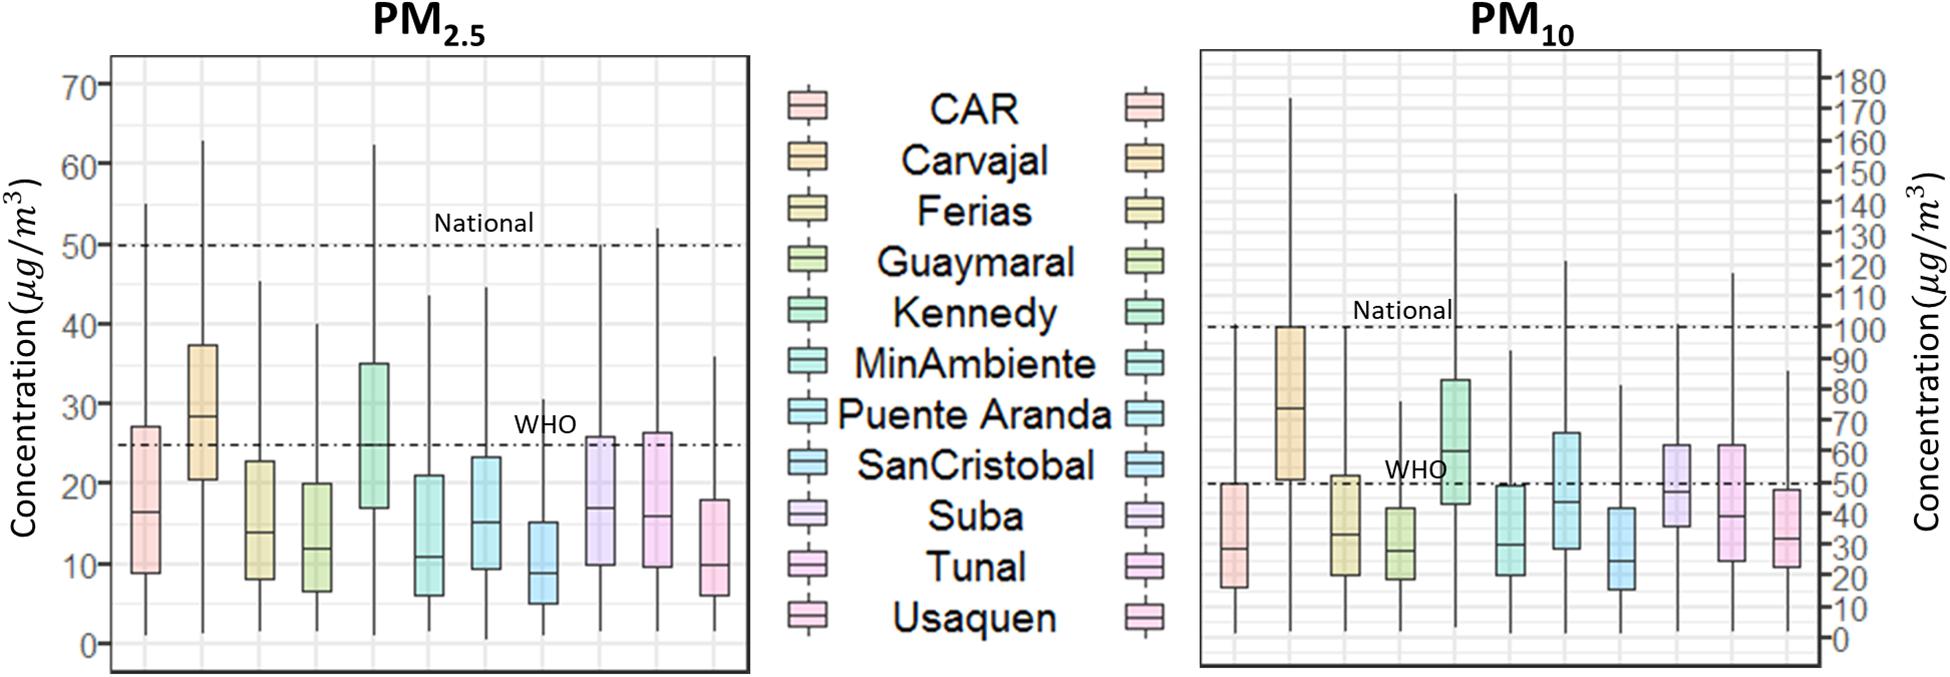
Figure 8. Boxplots of PM2.5 (left chart) and PM10 (right chart) measured concentrations (valid data only), depicting the median as the center value, quantiles 75 and 25% for limits of the box, and the upper/lower whiskers being the largest/smallest measurement within 1.5 times the inter-quartile range.
We report in Figure 8 the average daily reference values from WHO for PM2.5 (25 μg/m3) and PM10 (50 μg/m3), as well as the threshold for the average daily concentrations set as per the Colombian national regulations (50 μg/m3 for PM2.5 and 100 μg/m3 for PM10).
To better appreciate the differences among measurements at distinct stations, we show in Figure 9 the percentage of days, across the whole 2009–2018 period, for which the average daily pollutant concentration measured exceeded the WHO recommendation. The magnitude of these exceedances is shown by the yellow bars, for PM2.5 (left chart) and PM10 (right chart). The percentages inside the red boxes are for the days in which the average concentration of pollutants exceeded the national threshold values.
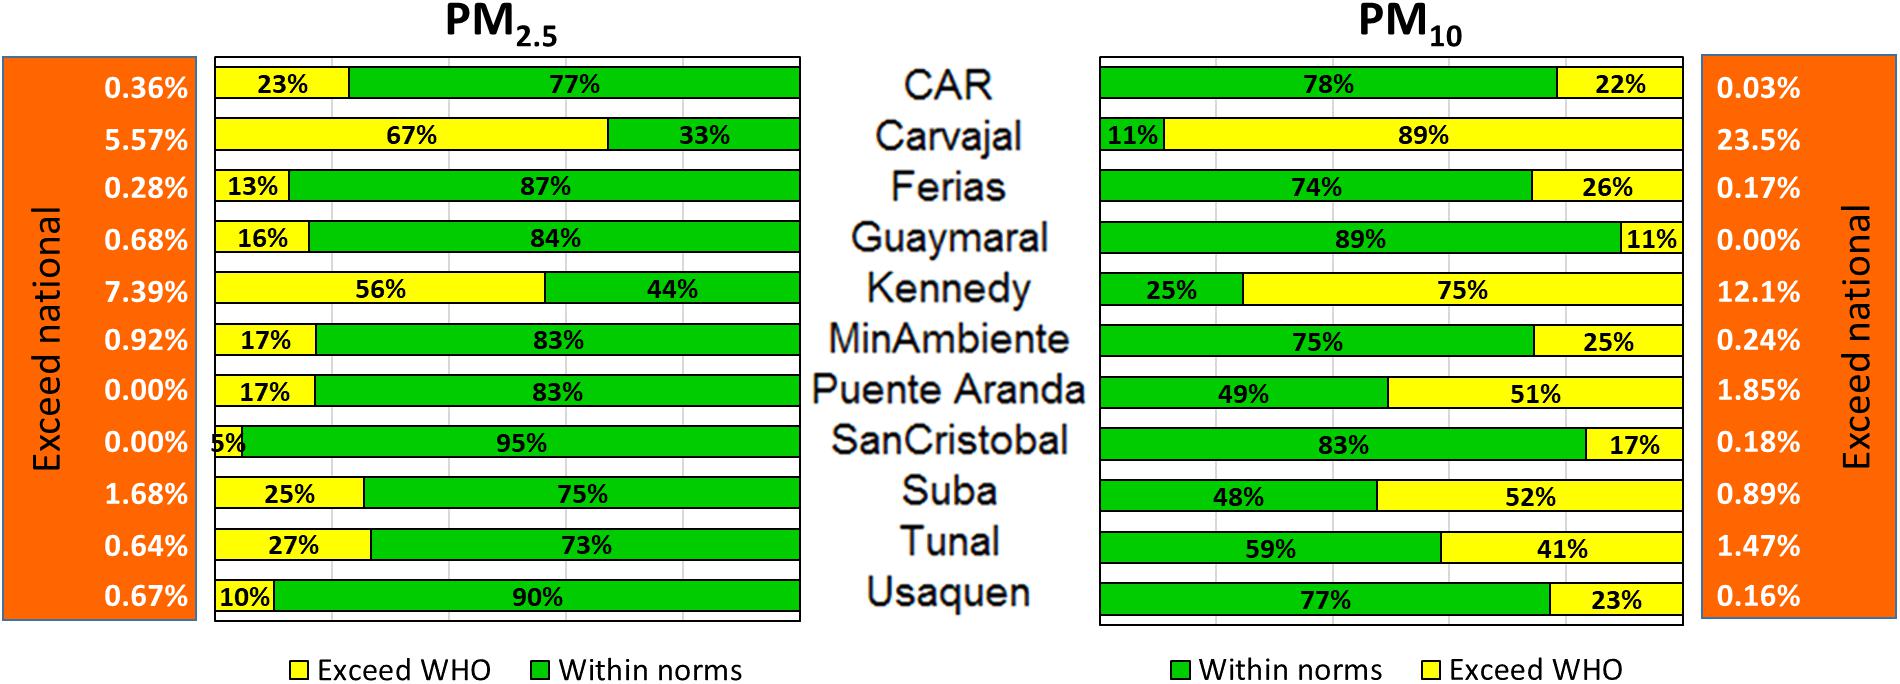
Figure 9. Percentages of days during which the average daily concentration of PM2.5 (left chart) and PM10 (right chart) exceeded the WHO and the national reference values.
From Figure 9 we can observe that Carvajal reported 89% of the measurement days with average PM10 concentration values above WHO standards, and Kennedy reported 75% days above WHO guidelines. Moreover, only two monitoring stations (Guaymaral, located in at the northern border of the city, and San Cristobal, located on the cliffs at the south) registered a percentage of PM10 exceedance days below 20%. In a significant part of the exceedance days of Carvajal and Kennedy, the national threshold for PM10 is exceeded as well, by 23.5 and 12.1%, respectively.
This is also the case for PM2.5 for which Carvajal and Kennedy stations reported more than 50% of the days above WHO reference values and more than 5% above national thresholds, while in stations located in other areas of the city (San Cristobal, Usaquen) almost 100% of the concentration data for this pollutant were below the national threshold values. The reasons for the observed differences can be rooted not only in the meteorological conditions, but in the differential presence of emission sources such as industry and heavy traffic operating by diesel which are much more popular in some areas than in others.
To help identifying the presence of drifts in the measured concentration of pollutants, Figure 10 shows multiannual monthly average concentrations charts, for the period of analysis (2009–2018) for PM2.5 and PM10. In the charts, the orange shadowed area is defined by the 95% confidence intervals for the monthly averages. The continuous line is a smoothing of the data obtained by local regression. One first thing that appears to be a constant for both pollutants through the period of analysis is a seasonal trend. January, February and March are the most polluted months of the year, while June, July and August are the months with lower ambient concentrations. Several studies have demonstrated an influence of meteorological conditions on the air quality of the city. There is evidence showing that the first months of the year are associated to more stable atmospheric conditions while mid-year months are characterized by more intense advections, as well as that distinct microclimate conditions exist in the same urban area, leading to detectable differences in air quality (Secretaria Distrital de Ambiente [SDA], 2019). This is one of the main reasons for which recent guidelines recommend reporting air quality at the station and not at the city level.
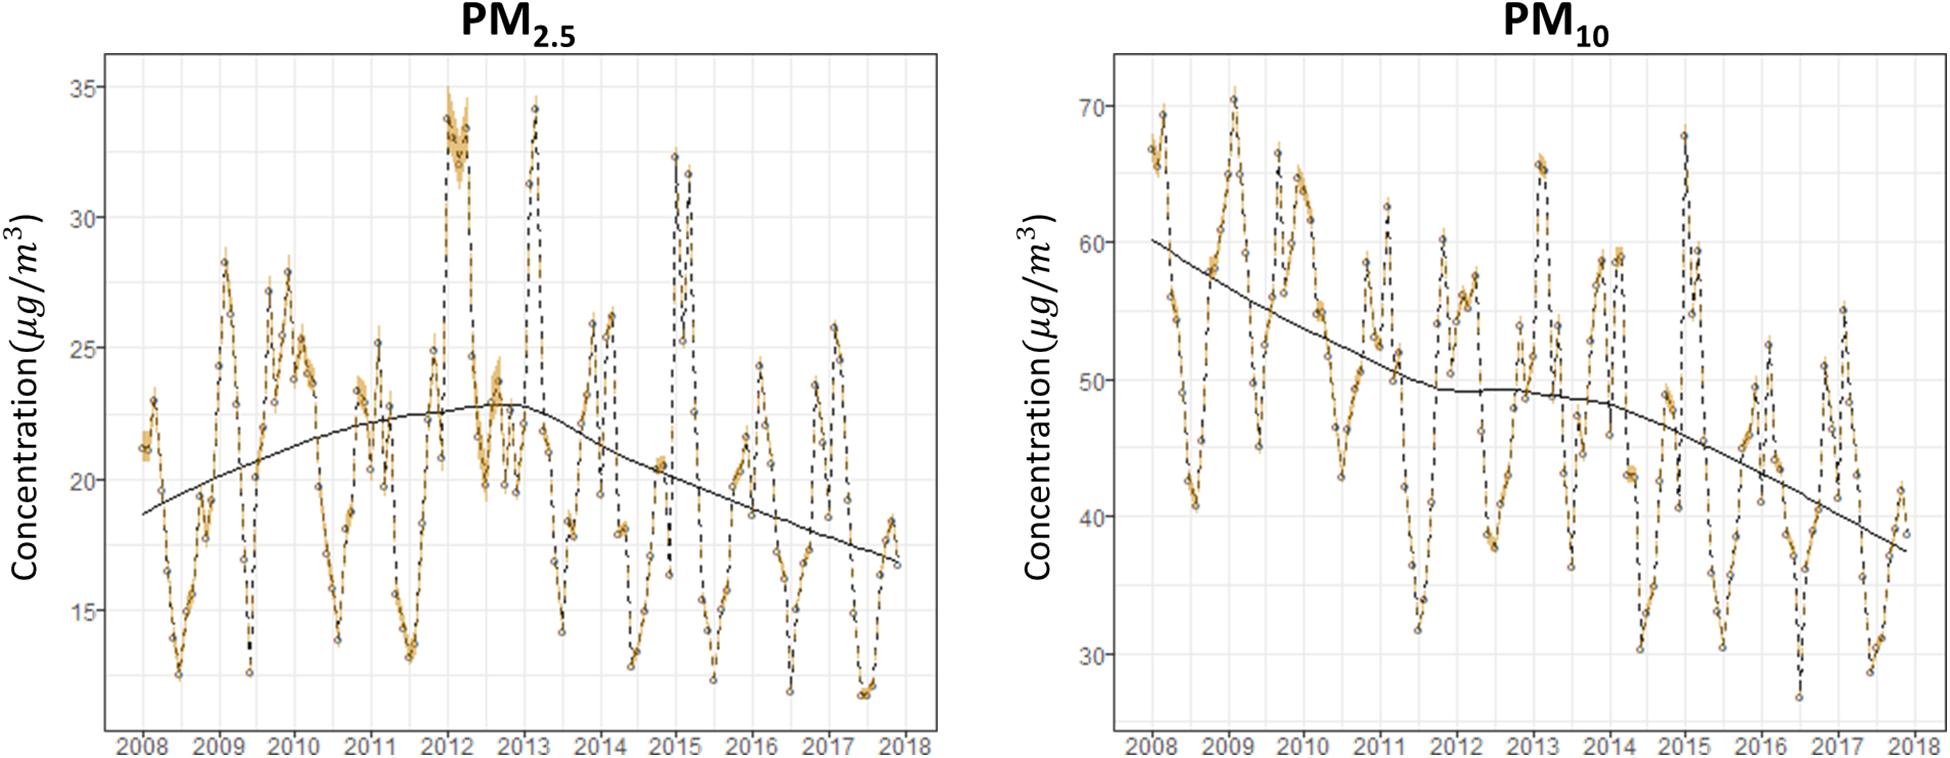
Figure 10. Variations is PM2.5 (left chart) and PM10 (right chart) monthly average concentrations (valid data only).
Historical PM10 concentrations exhibit a steady downward drift (continuous dark line in right panel in Figure 10). For PM2.5 the tendency is less evident. The peak in measurements reported around 2012–2013 corresponds to a period of limited data availability. As visualized in the miss-map for PM2.5 reported in Figure 4, for most of 2013 only the Kennedy monitoring station was providing valid data. As shown in our previous analyses, Kennedy is one of the monitoring stations that consistently reports very high concentration of pollutants.
Since the charts in Figure 10 suggest that the time-series of pollutants may not be stationary, in the subsequent analyses we shall consider explicitly the time dimension of observations.
Figure 11 presents the daily clustered values for PM2.5 and PM10. We show the average daily values and their 95% confidence interval (colored strip) for each of the years of analysis. For both PM2.5 and PM10 there is a consistent increasing drift throughout the week, Sunday being the least polluted day and Friday the most polluted. Even though it is beyond the scope of this article to identify causes or explain the reasons of the observed air pollution levels, it is easy to speculate on mobile sources being the main cause of the pollutant accumulation over the week, as there is a significant statistical difference between Saturdays and Sundays (when heavy traffic is reduced) and weekdays. Also, lower concentrations on Mondays can be partially explained by the fact that most of the national holidays take place on this day of the week (about 15 bank holidays throughout the year). While for PM2.5 average daily concentration (left chart in Figure 11) there is not an evident tendency to improvement, for PM10 (right chart), we observe a steady encouraging decreasing drift in the measured average daily values over the years. While in 2009 all days of the week except for Sundays were exceeding the 50 μg/m3 WHO reference value, since 2015 all the average daily values are consistently below such threshold.
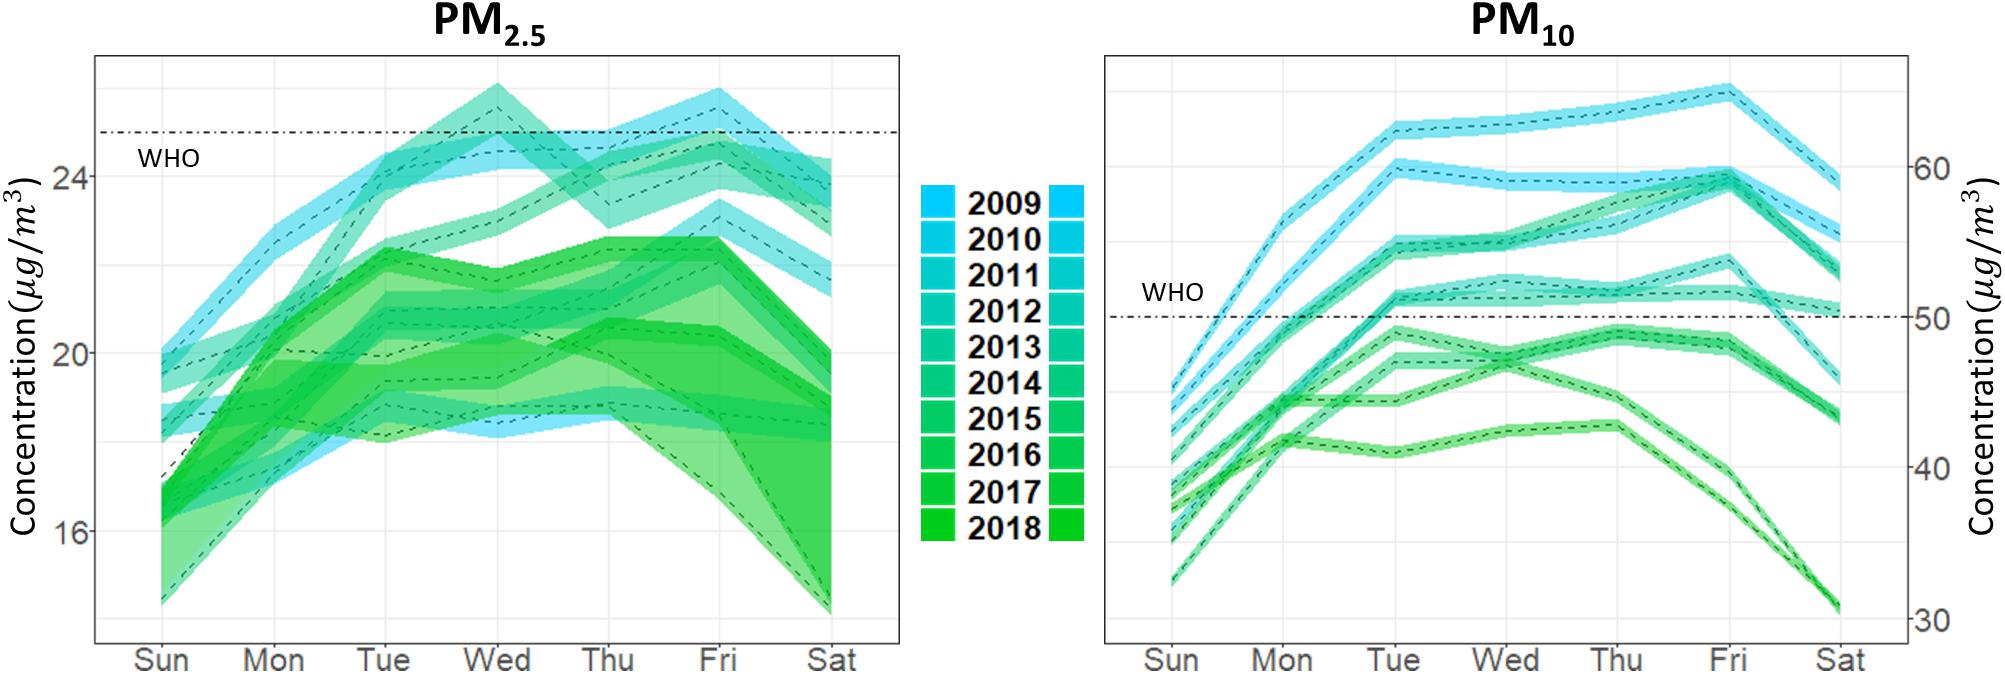
Figure 11. Daily aggregated data for PM2.5 (left chart) and PM10 (right chart) measured concentrations (valid data only).
Figure 12 shows PM2.5 and PM10 data at the hourly aggregation level. The concentrations of both pollutants peak in the time interval between 6:00 a.m. and 9:00 a.m. A secondary, lower peak of concentration arises in the late afternoon until night hours. Such bimodal behavior may be related with the traffic patterns in the city, with high vehicular activity in the morning rush hour and then intense but more dispersed traffic flows throughout the rest of the day. During peak hours, the concentrations of PM2.5 and PM10 are above WHO 24-h reference values, meaning that Bogotá citizens are exposed to unhealthy air quality conditions during that part of the day. It is however, encouraging to observe that, at least for PM10 concentrations (right chart in Figure 12), an improving pattern of change is appreciable, with the average hourly concentration consistently descending over time in the whole hourly range. The analysis in Figure 12 is suggesting that the different traffic restriction strategies that have been put in place in Bogotá have not affected PM2.5 and PM10 daily patterns over time.
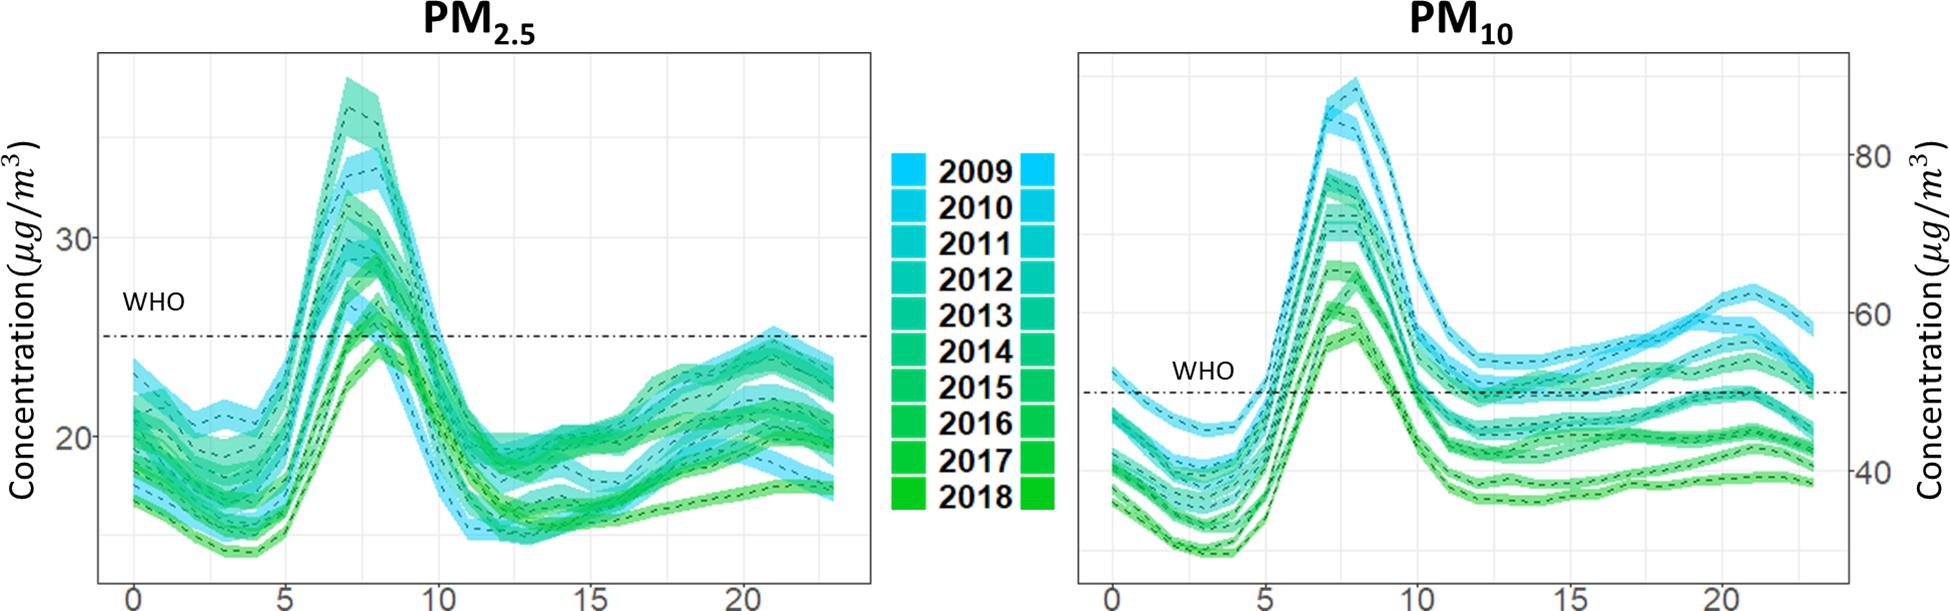
Figure 12. Hourly aggregated data for PM2.5 (left chart) and PM10 (right chart) measured concentrations (valid data only).
Discussion, Conclusion and Future Work
Bogotá’s historical air quality data was validated and analyzed with the intention of representing tendencies of the most critical pollutants (PM10 and PM2.5) over time. We consider this work (presented as a short communication) to serve the purpose of establishing a structured and well-grounded procedure for data cleaning, and of conducting a descriptive analysis using modern analytics tools. Moreover, we present a clean picture of what data says about air quality in the city over the past decade. The results of this work are useful both for local environmental authorities and the general public, since it defines repeatable steps for data preparation and effective visualization of analysis results, which help in obtaining consistent conclusions from the available data.
We would like to highlight three main issues that data say about air quality in Bogotá. First, historically there is a high percentage of invalid data (using the proposed tidying procedure). This is a matter of concern, since data quality is crucial when considering which periods to analyze, as well as what variables and stations to include in analysis. Second, PM2.5 and PM10 ambient concentrations in Bogotá frequently exceed national air quality standards, meaning citizens are exposed to air pollution levels considered harmful for people’s health. In particular, the south-west part of the city, where concentrations of particulate matter are frequently much higher than the values indicated in WHO guidelines.
Moreover, no single mean concentration for the whole city should be used to conclude the air quality conditions in Bogotá, and a spatially differentiated analysis should always be done. From the data collected at the monitoring stations we estimated the average PM10 concentration, for each month of the year, at each one of the 19 administrative subdivisions (localidades, in Spanish) of the main urban area of Bogotá. As it can be easily appreciated from the panel chart in Figure 13, significant differences exist among those different areas of the city within the same month. A distance weighting formula has been used to determine the average pollution level in each area from the valid network measurements.
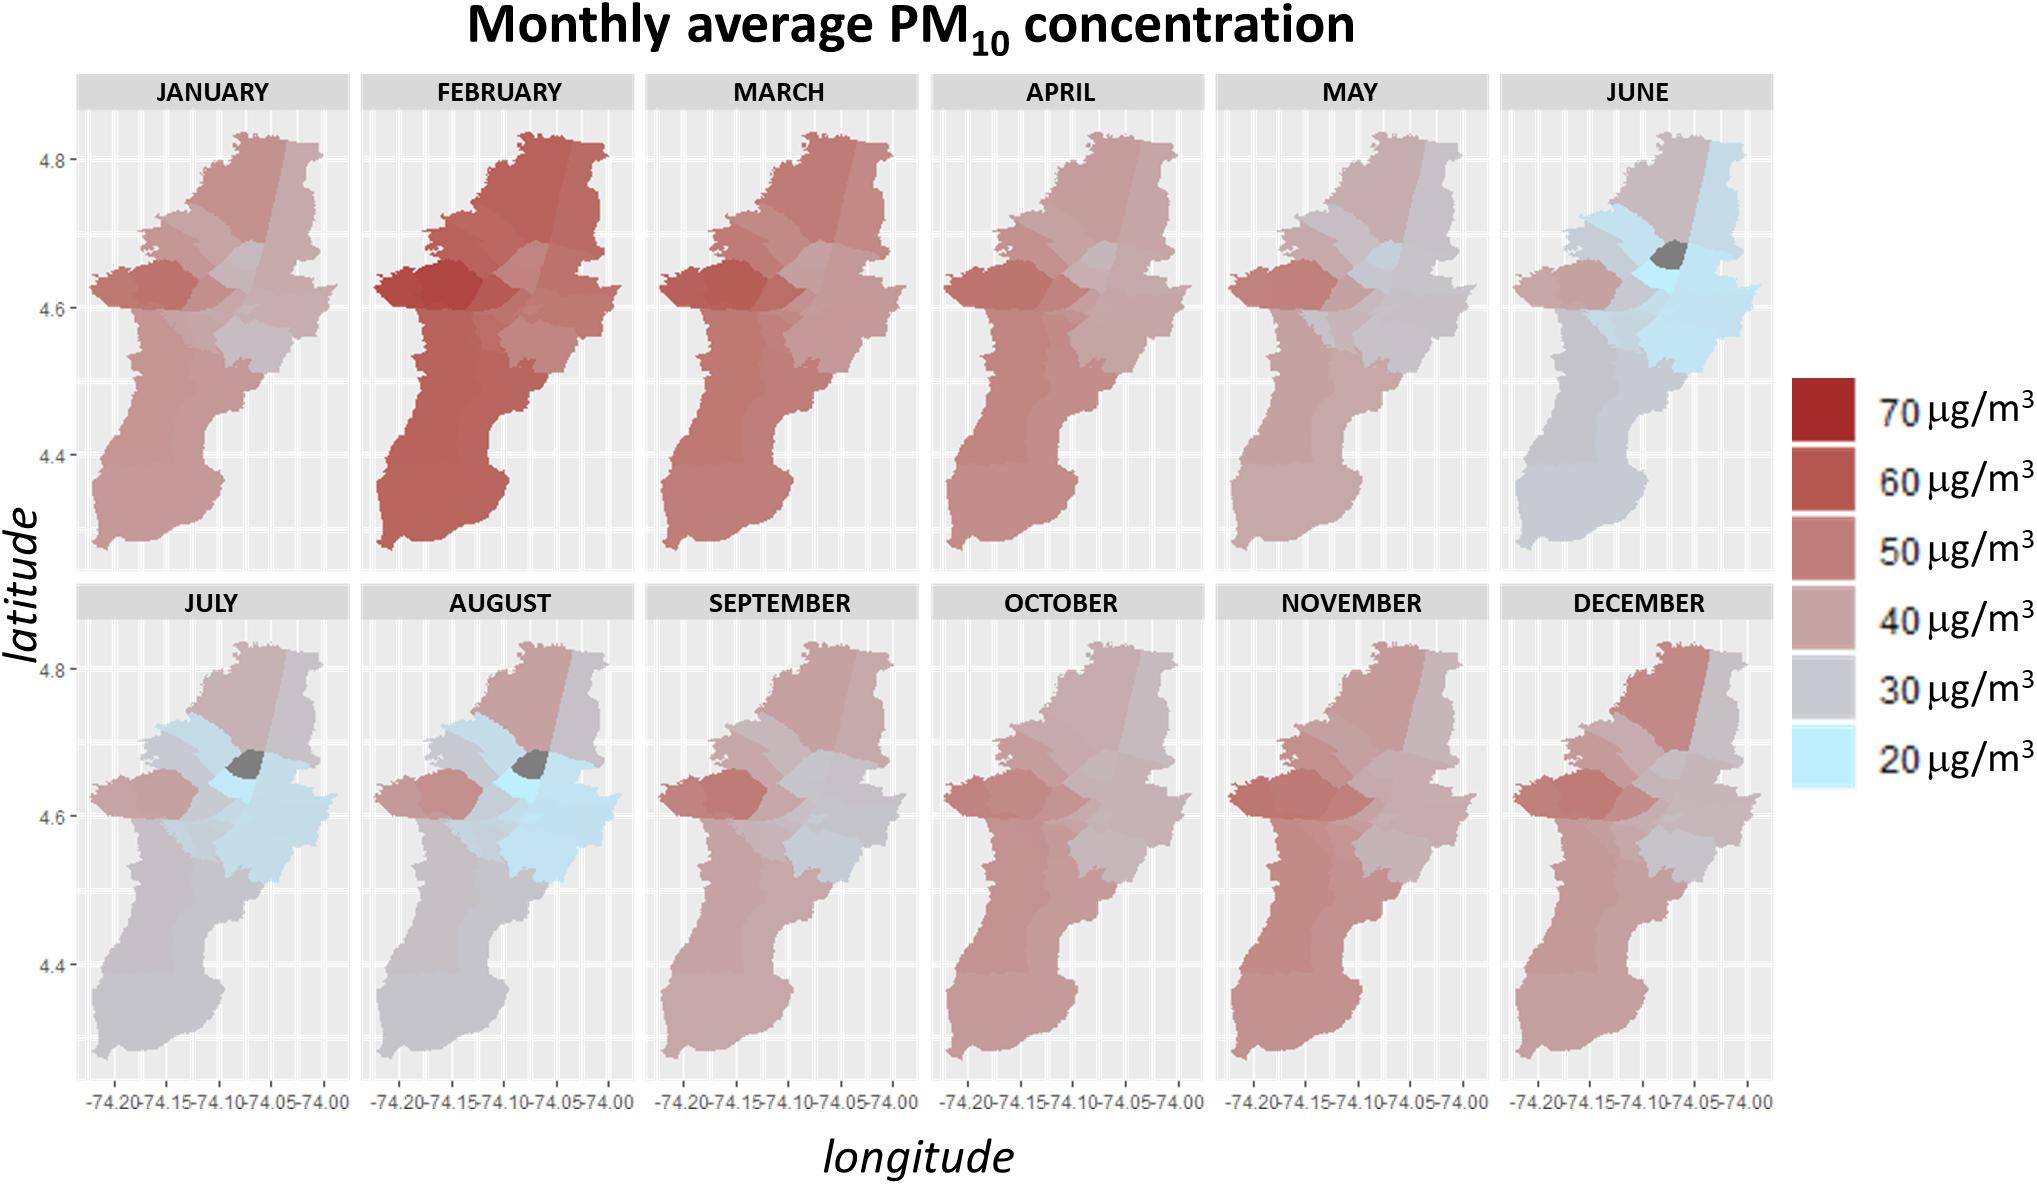
Figure 13. Spatial distribution of the average concentration of PM10 in Bogotá.
Third, even though mobile sources in the city have doubled in the last decade, PM10 concentrations show a consistent downward drift, and PM2.5 concentrations do not appear to have worsened. This may suggest that control strategies, such as improvements in diesel sulfur content, and technological upgrades of industries have had beneficial impacts on particulate matter emissions and a subsequent effect on air quality in the city.
We understand urban air quality as a result of the interaction of different factors (i.e., meteorological conditions, emissions). Our future work will consider the integration of such factors in the analysis. Also, we are working on the development of an air quality data open access visualization tool for both the public and decision makers. We believe the type of analyses hereby presented and the continuity of such academic work in conjunction with environmental and public health authorities can lead to a better understanding of the problem, and to improve the extent of implementation of air pollution control actions.
Data Availability Statement
The datasets generated for this study are available on request to the corresponding author.
Author Contributions
All the authors equally contributed to the manuscript.
Conflict of Interest
The authors declare that the research was conducted in the absence of any commercial or financial relationships that could be construed as a potential conflict of interest.
Acknowledgments
The authors would like to acknowledge the support of Prof. Maria Elsa Correal Nuñez from the Department of Industrial Engineering at Universidad de los Andes in the statistical treatment of the data, and the fruitful technical discussions held with Oscar Julián Guerrero Molina from IDEAM, the Colombian Institute of Hydrology, Meteorology and Environmental Studies. This work has been realized thanks to the voluntary contributions of students and professors at Universidad de los Andes, Colombia, and at other collaborating universities.
References
Baklanov, A., Molina, L. T., and Gauss, M. (2016). Megacities, air quality and climate. Atmos. Environ. 126, 235–249. doi: 10.1016/j.atmosenv.2015.11.059
Chow, J. C., Watson, J. G., and Shah, J. J. (2004). Megacities and atmospheric pollution, critical review discussion. J. Air Waste Manag. Assoc. 54, 1226–1235.
Cullen, A. C., and Frey, H. C. (1999). Probabilistic Techniques in Exposure Assessment: A Handbook for Dealing with Variability and Uncertainty in Models and Inputs. Berlin: Springer-Verlag.
Delignette-Muller, M. L., and Dutang, C. (2015). fitdistrplus: an R package for fitting distributions. J. Stat. Softw. 64, 1–34.
Franco, J. F. (2012). Contaminación atmosférica en centros urbanos. Desafío para lograr su sostenibilidad: caso de estudio Bogotá. Rev. EAN 72, 193–204.
Franco, J. F., Segura, J. F., and Mura, I. (2016). Air pollution alongside bike-paths in Bogotá-Colombia. Front. Environ. Sci. 4:77. doi: 10.3389/fenvs.2016.00077
Gurjar, B. R., Butler, T. M., Lawrence, M. G., and Lelieveld, J. (2008). Evaluation of emissions and air quality in megacities. Atmos. Environ. 42, 1593–1606. doi: 10.1016/j.atmosenv.2007.10.048
Hernández-Flórez, L. J., Aristizabal-Duque, G., Quiroz, L., Medina, K., Rodríguez-Moreno, N., Sarmiento, R., et al. (2013). Air pollution and respiratory illness in children aged less than 5 years-old in Bogotá, 2007. Rev. Salud Públ. 15, 552–565.
INRIX (2018). 2018 Global Traffic Scorecard. Available online at: https://inrix.com/scorecard/ (accessed April 10, 2020).
Instituto de Hidrología, Meteorología y Estudios Ambientales [IDEAM] (2016). Informe del Estado de la Calidad del Aire en Colombia 2011-2015 Bogotá, D.C. Available online at: http://documentacion.ideam.gov.co/openbiblio/bvirtual/023637/Informe_del_Estado_de_la_Calidad_del_Aire_en_Colombia_2011-2015_vfinal.pdf (accessed April 10, 2020).
Instituto de Hidrología, Meteorología y Estudios Ambientales [IDEAM] (2020). National Air Quality Information System (SISAIRE). Available at: http://sisaire.ideam.gov.co/ideam-sisaire-web/consultas.xhtml (accessed April 10, 2020).
Mendez-Espinosa, J. F., Belalcazar, L. C., and Morales-Betancourt, R. (2019). Regional air quality impact of northern South America biomass burning emissions. Atmos. Environ. 203, 131–140. doi: 10.1016/j.atmosenv.2019.01.042
Ministerio de Ambiente y Desarrollo Sostenible de Colombia [MADS] (2017). Resolución 2254 de 2017. Available at http://www.minambiente.gov.co/images/normativa/app/resoluciones/96-res%202254%20de%202017.pdf (accessed April 10, 2020).
Morales, R., Galvis, B., Rincón-Riveros, J. M., Rincón-Caro, M. A., Rodriguez-Valencia, A., and Sarmiento, O. L. (2019). Personal exposure to air pollutants in a bus rapid transit system: impact of fleet age and emission standard. Atmos. Environ. 202, 117–127. doi: 10.1016/j.atmosenv.2019.01.026
National Planning Department [DNP] (2017). Health costs associated with environmental degradation in Colombia 2015. Bogotá D.C. Available online at: https://www.dnp.gov.co/Paginas/Los-costos-en-la-salud-asociados-a-la-degradaci%C3%B3n-ambiental-en-Colombia-ascienden-a-$20,7-billones-.aspx (accessed April 10, 2020).
Pachón, J. (2018). “La experiencia de Bogotá,” in La calidad del aire en las ciudades. Un reto global, ed. X. Querol (Madrid: Fundación Gas Natural Fenosa).
R Core Team (2018). R: A Language and Environment for Statistical Computing. Vienna: R Foundation for Statistical Computing.
Ramírez, O., Sánchez de la Campa, A. M., Sánchez-Rodas, D., and de la Rosa, J. D. (2020). Hazardous trace elements in thoracic fraction of airborne particulate matter: assessment of temporal variations, sources, and health risks in a megacity. Sci. Total Environ. 710, 136–344. doi: 10.1016/j.scitotenv.2019.136344
Romero-Lankao, P., Qin, H., and Borbor-Cordova, M. (2013). Exploration of health risks related to air pollution and temperature in three Latin American cities. Soc. Sci. Med. 83, 110–118. doi: 10.1016/j.socscimed.2013.01.009
Secretaria Distrital de Ambiente [SDA] (2011). Ten-Years Air Pollution Abatement Plan. Bogotá Mayor Office. Available online at: http://ambientebogota.gov.co/en/c/document_library/get_file?uuid=b5f3e23f-9c5f-40ef-912a-51a5822da320&groupId=55886 (accessed April 10, 2020).
Secretaria Distrital de Ambiente [SDA] (2019). Air quality annual report 2018. Bogotá Mayor Office. Available at: http://rmcab.ambientebogota.gov.co/Pagesfiles/IA%20Informe%20Anual%202018%20RMCAB.pdf (accessed April 10, 2020).
Secretaria Distrital de Ambiente [SDA] (2020). Red de Monitoreo de Calidad del Aire de Bogotá – RMCAB. Available at http://www.ambientebogota.gov.co/web/sda/red-de-calidad-del-aire (accessed April 10, 2020).
World Health Organization [WHO] (2018). Ambient (outdoor) air quality and health. Available at: https://www.who.int/en/news-room/fact-sheets/detail/ambient-(outdoor)-air-quality-and-health (accessed April 10, 2020).
Keywords: air quality, particulate matter, data validation, visual analytics, urban health
Citation: Mura I, Franco JF, Bernal L, Melo N, Díaz JJ and Akhavan-Tabatabaei R (2020) A Decade of Air Quality in Bogotá: A Descriptive Analysis. Front. Environ. Sci. 8:65. doi: 10.3389/fenvs.2020.00065
Received: 13 February 2020; Accepted: 06 May 2020;
Published: 27 May 2020.
Edited by:
Peng Liu, Institute of Remote Sensing and Digital Earth (CAS), ChinaReviewed by:
Fabrizio Passarini, University of Bologna, ItalyLuca Lelli, University of Bremen, Germany
Copyright © 2020 Mura, Franco, Bernal, Melo, Díaz and Akhavan-Tabatabaei. This is an open-access article distributed under the terms of the Creative Commons Attribution License (CC BY). The use, distribution or reproduction in other forums is permitted, provided the original author(s) and the copyright owner(s) are credited and that the original publication in this journal is cited, in accordance with accepted academic practice. No use, distribution or reproduction is permitted which does not comply with these terms.
*Correspondence: Ivan Mura, aXZhbi5tdXJhQGR1a2VrdW5zaGFuLmVkdS5jbg==