 Christine Nyagaya Owino
 Nzula Kitaka
 Julius Kipkemboi
 Risper Ajwang' Ondiek
- 1Department of Biological Sciences, Egerton University, Nakuru, Kenya
- 2Institute for Hydrobiology and Aquatic Ecosystem Management, University for Natural Resources and Life Sciences, Vienna, Austria
Rice is an important food crop in Kenya and is the third most consumed cereal crop after maize and wheat. The high demand for rice has resulted in the conversion of wetlands to rice paddies and the increased use of fertilizer, ultimately reducing the ability of wetlands to store carbon. Consequently, emissions from wetlands of three potent greenhouse gases (GHGs): methane (CH4), nitrous oxide (N2O), and carbon dioxide (CO2) have increased. This study assessed the influence of fertilizer application on GHGs emission, organic carbon and nutrient stocks in rice paddies in papyrus dominated wetlands in the Nzoia River basin in Kenya. Sampling was done on a weekly basis for the first two months, and thereafter twice per month in the Anyiko rice paddies, which is a smallholder system partly converted from the Anyiko wetland. Two replicates of three fertilization treatments (standard, control and under fertilization) were assigned randomly in six rice plots. The static chamber method was used to collect the GHGs, which were then analyzed using gas chromatography. Soil samples were collected and analyzed for nitrogen and organic carbon stocks. Statistical tests revealed no significant differences in organic carbon and nitrogen stocks among the three fertilization treatments. The mean CH4 fluxes did not differ significantly among the three treatments where mean flux for control plots were 8.30 ± 4.79 mgm−2h−1; under-fertilized plots had a mean of 6.93 ± 2.42 mgm−2h−1 and standard fertilized plots mean fluxes were 4.00 ± 6.34 mgm−2h−1. Similarly, CO2 mean fluxes were insignificantly different among the three treatments, where control plots had mean of 174.80 ± 26.81 mgm−2h−1, under-fertilized plots mean were 208.81 ± 36.20 mgm−2h−1 and standard fertilized plots mean fluxes were 248.29 ± 41.22 mgm−2h−1. However, mean N2O fluxes were significantly different among the three treatments, control plots had a mean of −3.59 ± 2.56 μgm−2h−1, followed by under-fertilized with mean of −0.59 ± 0.45 μgm−2h−1 and standard fertilized plots with mean of 4.37 ± 3.18 μgm−2h−1. In this study, different fertilization scenarios had significant effects on N2O emission but no significant effect on CO2 and CH4 emission, organic carbon and nutrient stocks. Therefore, there is need for sustainable use of wetlands to ensure a balanced role between ecosystem management and human services.
Introduction
Wetlands occupy about 6% of the earth's surface; covering about 7% of Africa alone (Junk et al., 2013). In Kenya, wetlands cover ~2.5% of the surface area of the country (14,000 km2) and fluctuate up to 6% during rainy seasons (Crafter et al., 1992). Wetland drainage and land reclamation (conversion of wetlands to arable lands) for crop production, papyrus harvesting and draining of wastewater into the wetland have been reported to be the major threats leading to wetland degradation in Kenya (Morrison et al., 2012). Mironga (2005) also noted that drainage and conversion to arable land have been the key drivers to degradation of wetlands in Kenya.
Rice is one of the essential cereal crops grown globally, in Africa and in Kenya (Balasubramanian et al., 2007). The role of rice as a current and future global food security is inevitable since it is one of the three most important food crops globally after wheat and maize (FAO, 2016). The FAO (2017) predicts global rice production to reach 758.9 million tons (503.8 million tons, milled basis) by 2017. In Africa, 2016 season rice output records put the production at 30.8 million tons (20.1 million tons, milled basis) (FAO, 2017). In Kenya, rice cultivation was introduced in 1907 from Asia (Republic of Kenya, 2008). The annual rice consumption rate in Kenya is estimated at 548,000 metric tons whereas the annual production is 129,000 metric tons (Republic of Kenya, 2014). Rice is either grown in upland areas or in lowland areas where the fields are either rain fed or irrigated. Kenya's major irrigation schemes include Mwea, Yatta, Ahero, Bunyala, and west Kano. These schemes are operated by National Irrigation Board (NIB) and produce about 80% of the rice while the remaining 20% is produced from the rain fed fields (Republic of Kenya, 2008). The growing population and socioeconomic changes have stimulated the need for more agriculturally productive land in the pursuit to improve food security (Junk et al., 2013; Mitchell, 2013). To meet the high demand for rice caused by increasing population pressure, more natural wetland area is converted to rice paddies. This land conversion is coupled with an increased use of fertilizer to increase crop yield.
Global sources of GHG emissions are broadly categorized into natural (44.54%) and anthropogenic (55.46%) (Xi-Liu and Qing-Xian, 2018). Wetlands are natural sources of global GHGs emissions, and account for 17.2% of natural emissions. Olivier and Peters (2018) report that rice cultivation on flooded rice fields is the second largest anthropogenic source of CH4 (10%) after cattle stocking. The same authors note that agricultural activities are the main source of N2O where synthetic fertilizers (nitrogen content) account for 18% of N2O emissions after cattle stocking (21%). Concentrations of GHGs in the atmosphere have been rising steadily since the industrial revolution (Olivier et al., 2017). Greenhouse gas emissions lead to climate change and this has been evidenced in the recent years through: rise in mean global temperature, decreasing snow and ice in the northern hemisphere, ocean warming, extreme weather conditions, and CO2 concentration has increased by 40% since the pre-industrial era (Cubasch et al., 2013). An additional warming of 1.1°C to 6.4°C is anticipated by future climate change projections (NRC, 2010). To attain Sustainable Development Goal 13 (take urgent action to combat climate change), the 2015 Paris agreement on climate change requires member countries to reduce global warming to well below 2°C to combat climate change.
Rice paddies are an important source of GHG emission (Garthorne-Hardy, 2013). The main GHGs emitted from rice fields include CO2, CH4, and N2O (Arunrat and Pumijumnong, 2017). The major processes responsible for production and emission of these GHGs are: oxic respiration (decomposition), methanogenesis, nitrification, and denitrification (Zhang et al., 2007). In paddy rice soils, CH4 is produced through methanogenesis under anoxic conditions (Jain et al., 2004). Nitrous oxide production occurs through nitrification and denitrification processes under oxic and anoxic conditions, respectively, whereas, CO2 production occurs when oxygen is supplied in the soil through decomposition process (Ishii et al., 2011). Rice paddy soils are usually waterlogged providing anoxic conditions; however, the soil can be supplied with oxygen at certain circumstances like when the paddy is drained, at the roots and at the soil-water interface thus providing oxic conditions.
Wetlands are usually waterlogged and therefore provide similar conditions as required in rice paddy soils. For that reason wetlands are converted to rice paddies. Draining of wetlands to convert them to agricultural land exposes soil organic matter to oxygen, leading to its oxidation and subsequent release as CO2 to the atmosphere (Moomaw et al., 2018). Consequently, the ability of wetlands to sequester and store carbon is impaired and this leads to increased GHGs emission to the atmosphere, which contributes to climate change (Mitchell, 2013). Fertilizer application is one of the land management practices in rice paddies and is applied to increase crop yield (Singh and Singh, 2017). There are different fertilizer application management practices that influence the emission of GHGs for example: method of placement, type of fertilizer, level and form of fertilizer used (Linquist et al., 2012). Fertilizer application has been found to influence CH4 and N2O but have less impact on CO2 emissions (Linquist et al., 2012). Wang et al. (2017) report that application of nitrogen fertilizer in rice paddies showed variability (increase or decrease) in CH4 emissions but led to increase in N2O emission. Generally, N fertilizer application increases the GWP of N2O by 78% (Bin-feng et al., 2016). The nitrogen electron donors and acceptors can be nitrified or denitrified to N2O when fertilizer is applied to the soil (Wang et al., 2017). Emissions of CO2 from rice paddies is however low (<1%) since CO2 emission is largely offset by primary productivity and atmospheric fixation by plants (Linquist et al., 2012). Apart from fertilizer application, farmers employ other management practices to increase yield production including clearing of natural wetlands to expand production area.
Studies on the effect of nitrogen fertilizer application on GHGs emissions in rice paddies have been conducted widely in other part of the world like in Asian countries (Shang et al., 2011; Cheng-Fang et al., 2012; Bin-feng et al., 2016; Arunrat and Pumijumnong, 2017). In sub-Saharan Africa, such studies remain limited despite considerable pressure on wetlands from agriculture particularly; smallholder farms (Houghton et al., 2012; Pelster et al., 2017). In Kenya for instance, area loss ranging from 34 to 55% have been reported in some wetlands in the last four to five decades majorly as a result of conversion to agriculture (Owino and Ryan, 2007; Ondiek et al., 2020). Due to alarming effect of global warming and climate change, understanding the effects of fertilizer applications in the areas of the wetland converted to agriculture is crucial. Therefore, this study assessed the effect of different fertilizer application scenarios on GHGs emissions in smallholder rice paddies converted from Anyiko natural wetlands in Kenya. The specific objectives of this study were to (1) compare soil organic carbon and nitrogen content in rice paddies under standard fertilization (basal, first and second topdressings), under-fertilization (first and second topdressings) and no fertilization (control); and (2) compare CO2, CH4 and N2O emissions in rice paddies under standard fertilization, under-fertilization and no fertilization (control). We hypothesized that (1) different fertilizer application scenarios have no significant effect on the standing stocks of organic carbon and nitrogen in rice paddies; and (2) standard fertilization (basal, first and second topdressings) and under-fertilization (first and second topdressings) has no significant effect on CO2, CH4, and N2O emission in rice paddies.
Materials and Methods
Study Area
The study was carried in Anyiko irrigation scheme which is a smallholder system partly converted from Anyiko wetland located in North East Ugenya, Siaya County, Kenya (Figure 1). The irrigation scheme was established in 1977 by the Ministry of Agriculture and lies between longitudes 0°16', 38°56”E, 0°14', 18°66”E and latitudes 34°16', 35°55”N, 34°18', 0°57”N in Nzoia River Basin. Currently the scheme is managed by farmers. On inception, the scheme only used water diverted from the adjacent Anyiko wetland via a canal for irrigation. Over the years however, the farmers have converted parts of the wetland to rice paddies and several canals dug out for irrigation. The area of the scheme expanded as a result of conversion of the wetland is unknown. The area covered by the scheme is 120 acres with ~100 farmers, each owning a paddy rice field of ~¾ acres. The growing season of rice runs from April to December.
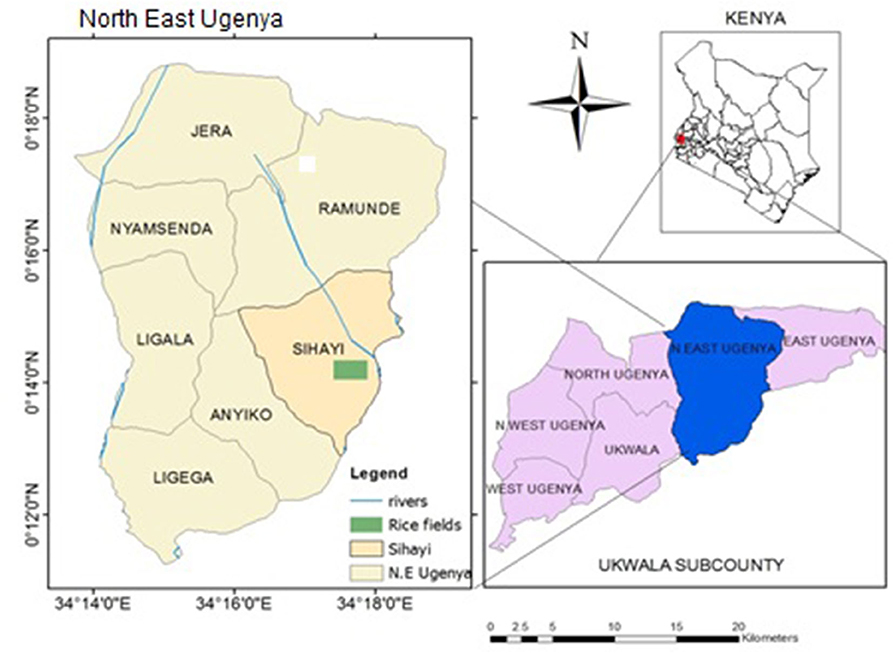
Figure 1. Map of Kenya showing the location of Anyiko rice fields (Modified from Topographical map of Kenya, scale 1:50,000).
Study Design and Sample Collection
The study was carried out from September 2018 to January 2019, during rice growing season in Anyiko irrigation scheme. The experiment was completely randomized with two replicates of three treatments. The three treatments included different fertilization scenarios: standard fertilization (basal, first and second top dressings), under fertilization (first and second top dressings only), and control (no fertilization) at 50 kg of fertilizer per acre for each, excluding the control. Nitrogen Phosphorus Potassium (NPK) 23:23:0 was used for basal fertilization whereas calcium ammonium nitrate (CAN) was used for first and second top dressings. Basal application was done immediately after transplanting, first top dressing was done 21 days after transplanting (DAT) and second top dressing was done 45 DAT. The fertilizer was applied using broadcasting method. In each of the six study plots, three gas chambers were placed. Gas samples were collected and analyzed (see section Study Design and Sample Collection) as well as soil samples (see section Soil Sampling and Analyses for NH4-N, NO3-N, TN and OC).
Gas Sampling and Analysis for CO2, CH4 and N2O Fluxes
Greenhouse gases, CO2, CH4 and N2O fluxes were measured on a weekly basis for the first two months, and thereafter twice a month in the rice paddies using the static chamber method (Butterbach-Bahl et al., 2016). The chambers were fabricated from twenty-four 30-liter plastic buckets from which eighteen were used for bases (34 cm diameter × 15 cm height) and six as lids (34 cm diameter × 23 cm diameter × 41 cm height). The plastic buckets were used because they are inert to the gases being sampled (Collier et al., 2014). The lids were fitted with a gas sampling port, thermometer to measure chamber internal temperature and 50 cm long vent tube (2.5 mm diameter) to equilibrate pressure differences between ambient and headspace as indicated in Plate 1 (Collier et al., 2014; Rosenstock et al., 2016; Pelster et al., 2017; Tully et al., 2017). The lids were also insulated with a reflective duct tape all round to minimize insulation. Three chamber bases per rice plot of about a quarter of an acre were inserted 10 cm into the soil 1 week before the first gas sampling. The chamber bases remained in the field for the entire sampling period to prevent collection of GHGs emitted due to soil disturbances (Plate 2A).
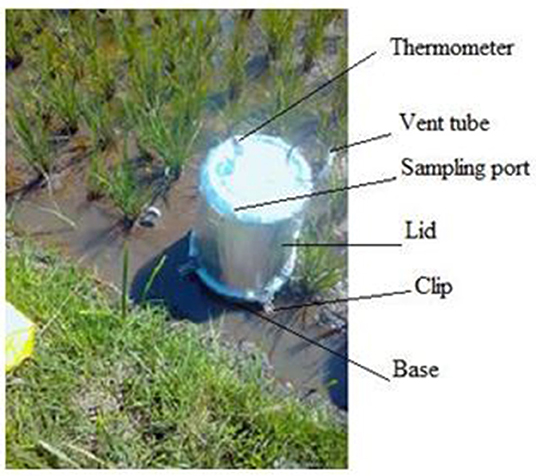
Plate 1. Pictorial representation of a fabricated gas chamber.
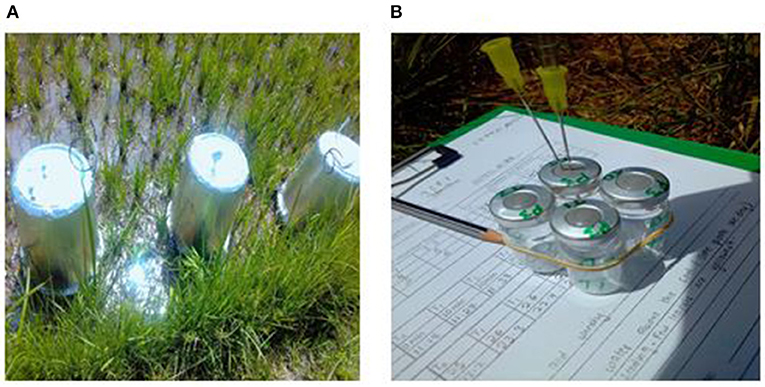
Plate 2. (A) Shows the three chambers installed in a plot, (B) pre-labeled 10 ml glass vial with crimp seal fitted with two syringes, one for evacuation and one for refilling the vial.
During each sampling event, the gas samples were collected between 10 am and 12 noon since studies have shown that this gives average daily emissions estimates (Butterbach-Bahl et al., 2016). Given the six rice plots and having to conduct the sampling within the given time frame, two people (1 person per rice plot) collected the gas samples. Hence, three lids per person per rice plot were used during the gas sampling. The bases and lids were clamped together for 30 min using metallic clips and a rubber seal fitted between them to ensure airtightness (Rochette, 2011). The chambers covered at least 4 rice plants in a transplanted system with spacing of 4 by 6 inches (Butterbach-Bahl et al., 2016). Gas samples (60 ml) were collected from the headspace at 0, 10, 20 and 30 min after lids deployment using a propylene syringe fitted with Luer lock, therefore, giving a total of 4 gas samples per rice plot (Plate 2B). The air inside the chamber was manually mixed before gas collection at each time interval by drawing gas from the chamber then pumping it back several times. To overcome spatial heterogeneity of soil GHG fluxes, samples were pooled from the three replicate chambers at each plot to form a composite air sample of 60 ml (Arias-Navarro et al., 2013). The first 40 ml of the sample was used to flush a 10 ml sealed glass vial through a rubber septum, while the final 20 ml was pushed into the vial, leading to a slight overpressure to minimize leakage and contamination of the gas with ambient air (Rochette and Normand, 2003). The ambient air sample was collected using the same procedure in order to assess ambient GHGs concentration during sampling. The height of each chamber base was measured on each sampling date to derive the total chamber volume (volume of the lid = 30 liters plus volume of the base = base area × height). The gas samples were wrapped with parafilm over the vial's crimp seal and transported to the International Livestock Research Institute (ILRI) laboratory, in Nairobi for analysis within 12 h after collection.
The gas samples were analyzed for CO2, CH4, and N2O in an SRI 8610C gas chromatograph (2.74 m Hayesep-D column) fitted with a 63Ni-electron capture detector for N2O and a flame ionization detector for CH4 and CO2 (after passing the CO2 through a methanizer) (Plate 3). The flow rate for the carrier gas (N2) was 20 mL min−1. Gas concentrations were calculated based on the peak areas measured by the gas chromatograph relative to the peak areas measured for four standard calibration gases. The ideal gas law, atmospheric pressure, internal chamber temperature and chamber volume, measured during sampling were then used to convert the concentrations to mass per volume flux calculated using the the equation below (Butterbach-Bahl et al., 2011).
Where: Ct = slope derived from the linear regression (ppm min−1) for CH4 and CO2 and (ppb min−1) for N2O-N, M = molar weight (g mol-1) (C = 12 for CH4 and CO2, and N = 28 for N2O), Vm = molar gas volume (m1mol−1), (22.41), Vch = Volume of the chamber headspace (3 0 liters), Ach = Area of gas chamber, t = Chamber temperature (°C), P = Pressure at the time of sampling (atm), 60 = conversion factor of minutes to hour.
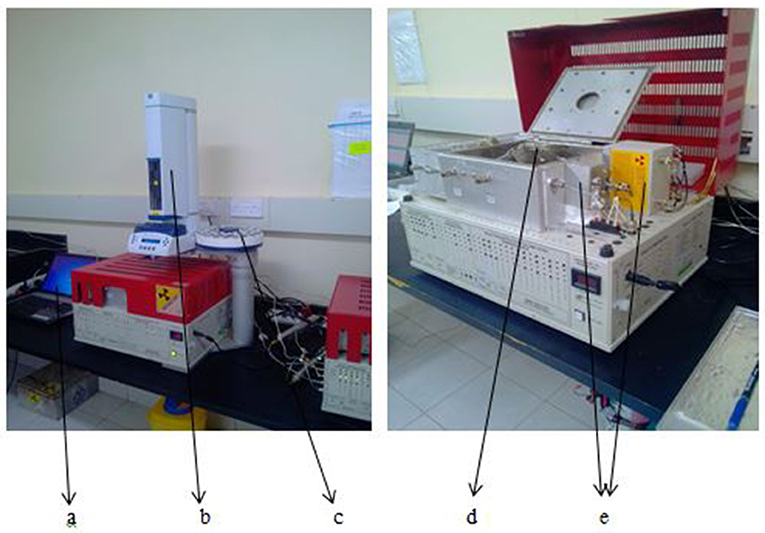
Plate 3. (a) A computer for recording peaks, (b) automated injector, (c) gas sample tray, (d) separation columns, (e) the detection units (FID and ECD).
Auxiliary Measurements
During each gas sampling campaign, soil temperature at a depth of 0 to 20 cm was measured in each rice plot using digital thermometer (Brannan). Digital thermo-hygrometer (model 1141Y43) was used to measure air temperature. Bulk density was determined on the upper 0 to 15 cm using the bulk density ring (98 cm3). Atmospheric pressure was measured during each sampling campaign using a barometer (installed in phone), though the pressure was quite constant since altitude did not change.
Soil Sampling and Analyses for NH4−N, NO3-N, TN and OC
Soil samples were collected using random composite sampling technique at each rice plot using soil auger to a depth of 0 to 15 cm. The samples were collected on every sampling campaign for soil moisture, NO3-N and NH4-N analysis. For soil OC and TN analysis, sampling was carried out twice per month. The samples were then transferred into polythene bags and placed in a cool box containing ice packs for transportation to the laboratory for further analysis.
The standard procedure described by Okalebo et al. (2002) was followed to determine soil moisture content. Soil moisture was determined by oven-drying 250 g of soil samples from each rice plot for 48 h at 105°C and then reweighed. Soil moisture content was calculated as:
The concentrations of NO3-N and NH4-N in the soil samples were determined by colorimetric method, where 10 g of fresh soil samples were extracted with 100 ml of 0.5 M K2SO4. The solution was shaken for 1 h on a Gallenkamp orbital shaker. The samples were filtered through Whatman GF/C filters and the supernatant analyzed for NO3-N and NH4-N. The concentrations of NH4-N and NO3-N were calculated from their respective equations generated from standard calibration curves. The concentrations were converted to soil mass as follows:
Where a = concentration of N in the solution, b = concentration of N in the blank, v = volume of the extract; w = weight of the fresh soil; MCF = moisture correction factor; f = dilution factor.
Total nitrogen was determined by Kjeldahl method (acid digestion, followed by steam distillation and then titration). Soil was oven dried (70°C) and from the dried sample, 0.3 g was digested using 2.5 ml of digestion mixture (hydrogen peroxide, sulphuric acid, selenium, and salicylic acid) at 360°C for 2 h. Thereafter, an aliquot of 10 ml was transferred into a reaction chamber. This was followed by addition of 10 ml of 1% sodium hydroxide and immediately steam distilled for 2 min into 5 ml of 1% boric acid. The distillate was titrated with N/140 HCl until endpoint (color change from green to definite pink). Concentration of total nitrogen was calculated as follows:
Where a = volume of the titer HCL for the blank, b = volume of titer HCL for the sample, v = final volume of the digestion, w = weight of the sample taken and al = aliquot of the solution taken for analysis.
Organic carbon was determined by Walkley–Black method [digestion by sulphuric acid and aqueous potassium dichromate (K2Cr2O7) mixture] (Okalebo et al., 2002). Soil samples was oven dried (70°C) to a constant weight. This was followed by complete oxidation of 0.3 g using 7.5 ml sulphuric acid and 5 ml aqueous potassium dichromate (K2Cr2O7) mixture. The unused K2Cr2O7 was titrated against ferrous ammonium sulfate to endpoint where color changed from greenish to brown. Difference between the added and residual K2Cr2O7 gave the measure of OC content in soil. The concentration of OC was determined according to Okalebo et al. (2002).
Where Vb = volume in ml of 0.2 M ferrous ammonium sulfate used to titrate reagent blank solution, Vs = volume in ml of 0.2 M ferrous ammonium sulfate used to titrate sample solution and 12/4000 is the mili-equivalent weight of C in grams.
Data Analysis
Data collected were statistically analyzed using IBM SPSS statistics version 2.0 (USA). All tests were carried out at p < 0.05 significance level and data subjected to normality (Shapiro-Wilk) and homogeneity of variance (Levene's) tests. Data for soil organic carbon and total nitrogen were normality distributed and therefore, one-way ANOVA was used to test significant differences between means of their standing stocks in the different treatments. The data for NH4-N, NO3−N and fluxes of CH4, CO2, and N2O were not normally distributed and therefore analyzed using the non-parametric Kruskal–Wallis test. Under different fertilizer application scenarios, only N2O emission varied significantly and hence, Tukey's post hoc test was applied to separate the means. Spearman's rank correlation was conducted to determine the relationship between soil properties (C/N ratio, soil moisture content, organic carbon, total nitrogen) and GHGs.
Results
Study Site Characteristics
The mean air temperature and soil temperature for the site were 27.06 ± 3.32°C and 23.46 ± 1.45°C, respectively (Table 1). The soil moisture content differed significantly within the plots [one-way ANOVA, F(2, 57) = 7.74 P = 0.001] with control plots recording lower moisture content (53.93 ± 3.35%) compared to standard fertilized plots (69.14 ± 4.06%) and under-fertilized plots (74.72 ± 4.15%) (Tukey's post-hoc test P < 0.05) (Table 1). The soil bulk density showed no significant variations among the sites [one-way ANOVA F(2, 57) = 1.697, P = 0.192].
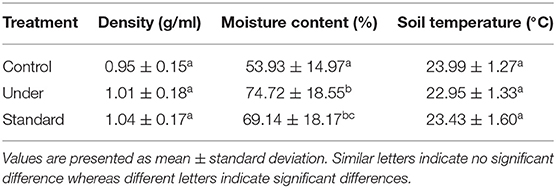
Table 1. Ancillary variable affecting GHG emissions measured at the study site.
Comparison Between Soil Organic Carbon and Nitrogen Content Among Fertilization Scenarios
Mean TN for the control plots was 0.70 ± 0.38%, 0.78 ± 0.43% for under-fertilized and 0.71 ± 0.35% for standard fertilized plots. The mean soil organic carbon fluxes did not differ significantly among the three treatments [one-way ANOVA, F(2, 33) = 0.219, P = 0.804; Figure 2, left]. The mean organic carbon for the control plots was 2.21 ± 0.70%, for the under-fertilized was 2.26 ± 0.68% and for the standard fertilized plots 2.08 ± 0.64%. Mean TN also did not differ significantly among the three treatments (one –way ANOVA, F(2, 33) = 0.134, P = 0.875; Figure 2, right). Mean soil NH4-N for control plots was 44.96 ± 9.60 μg/Kg, 63.57 ± 10.28 μg/Kg for standard fertilized plots and 68.02 ± 12.49 μg/Kg for under-fertilized plots (Figure 3, left). Mean soil NH4-N however did not differ significantly among the three treatments (Kruskal–Wallis test, P = 220). Similarly, mean NO3-N was also insignificant among the three treatments (Kruskal–Wallis test, P = 0.602). Control plots had a mean of 49.37 ± 18.82 μg/Kg, 63.64 ± 26.20 μg/Kg for under-fertilized plots and 71.66 ± 29.44 μg/Kg for standard fertilized plots (Figure 3, right). The C/N ratio did not differ significantly among the three treatments [one-way ANOVA, F(2, 33) = 0.399, P = 0.674]. The C/N ratio for the control plots ranged from 1.2:1 to 8.0:1, under-fertilized plots ranged from 1.3:1 to 8.0:1 while that for standard fertilized plots ranged from 1.2:1 to 5.7:1.
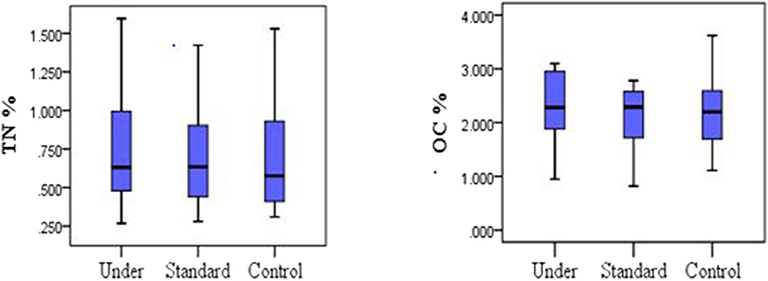
Figure 2. Comparison between nitrogen and carbon stocks in the soil under different fertilizer treatments, (One-way ANOVA, P > 0.05).
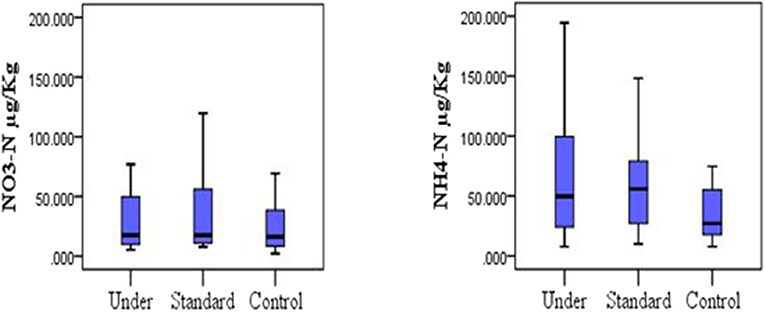
Figure 3. Distribution of nitrogen species (nitrate and ammonium) under different fertilization scenarios in the soil, (Kruskal-Wallis test, P > 0.05).
Carbon nitrogen ratio (C/N), TN, organic carbon and soil moisture were determined as some of the drivers of GHG emissions using Spearman correlation. Carbon/nitrogen ratio affects GHGs emissions by influencing mineralization and immobilization processes of the soil. Nitrous oxide showed positive correlation with TN but negative correlation with organic carbon (OC) and C/N ratio; However, both the positive and negative correlations were statistically not significant (Table 2). Methane showed an insignificant positive correlation with OC, C/N ration and TN (Table 2). Carbon dioxide showed an insignificant positive correlation with OC and C/N ration whereas it had a negative correlation with TN which was equally not significant. Total nitrogen and C/N ratio showed a significant negative correlation (rs= −0.808) whereas OC and C/N ration had a significant positive correlation (rs=0.370), as illustrated in Table 2. However, there was no significant correlation between the soil moisture and the GHGs as shown in Table 2.
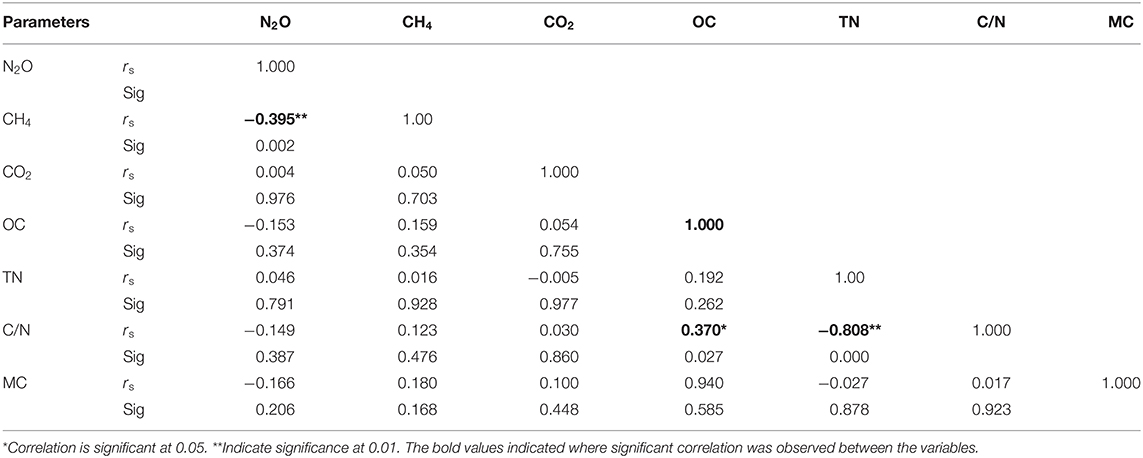
Table 2. Correlation matrix between GHGs, organic carbon, total nitrogen and carbon-nitrogen ratio.
Comparison of GHG Fluxes Among the Fertilization Scenarios
The mean CH4 flux was slightly lower in the under-fertilized plots (7.80 ± 2.12 mgm−2h−1) compared to that of standard fertilized (10.68 ± 3.79 mgm−2h−1) and control (10.82 ± 3.74 mgm−2h−1) plots. No significant difference in the CH4 fluxes was observed among the fertilization scenarios (Kruskal–Wallis test, P = 0.964) as shown in Figure 4. No significant differences in mean CO2 flux were observed among the three fertilization scenarios (Kruskal–Wallis test, P = 0.573; Figure 4). The mean carbon dioxide (CO2) flux was slightly higher in the standard fertilized plots (248.29 ± 41.22 mgm−2h−1) compared to that of the under fertilized plots (208.81 ± 36.20 mgm−2h−1) and control plots (174.80 ± 26.81 mgm−2h−1). The mean N2O flux was significantly higher in standard fertilized plots (4.37 ± 3.18 μgm−2h−1) than in the control plots (−3.59 ± 2.56 μgm−2h−1), (Tukey's post-hoc test, P = 0.009). However, there was no statistical difference in the mean N2O fluxes between standard fertilized plots and under-fertilized plots with a mean of −0.59 ± 0.45 μgm−2h−1, (Tukey's post-hoc test, P = 0.140; Figure 4). The mean N2O fluxes in control and under-fertilized plots also had no statistical difference (Tukey's post-hoc test, P = 0.260; Figure 4). The mean GHG fluxes indicated that under-fertilized rice plots were a sink for N2O (−0.59 ± 0.45 μgm−2h−1) and a source for CH4 (6.93 ± 2.42 mgm−2h−1) and CO2 (208.81 ± 36.20 mgm−2h−1). Standard-fertilized rice plots were source for N2O (4.37 ± 3.18 μgm−2h−1), CO2 (248.29 ± 41.22 mgm−2h−1) and CH4 (4.00 ± 6.34 mgm−2h−1). The control rice plots acted as sink for N2O (−3.59 ± 2.56 μgm−2h−1) and a source for CH4 (8.30 ± 4.79 mgm−2h−1) and CO2 (174.80 ± 26.81 mgm−2h−1).
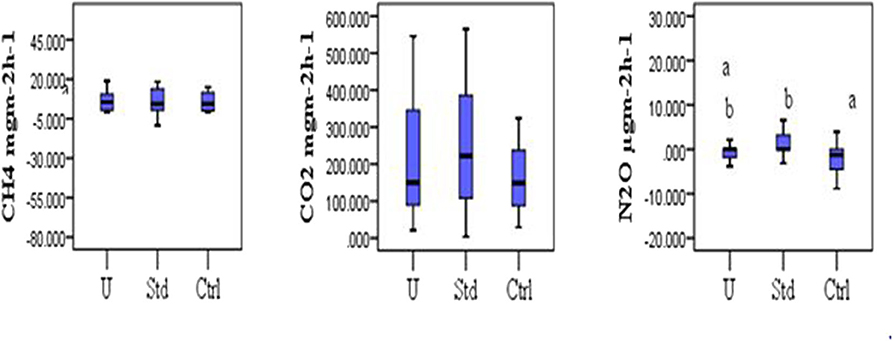
Figure 4. Comparison of GHG fluxes (CH4 mgm−2h−1, CO2 mgm−2h−1, and N2O mgm−2h−1) among the three fertilization scenarios (U, Under-fertilized; Std, Standard fertilized; Ctrl, Control). Different letters denote significant difference, while similar letters indicate no significant differences (Kruskal Wallis test, P > 0.05). Pairwise comparison indicated that the significant difference was between control and standard fertilization.
Global warming potential of CH4 and N2O were estimated by multiplying their fluxes by the IPCC global warming potentials factors which are 25 and 298, respectively, Solomon et al. (2007), and thus converting into CO2 equivalents. The combined effect of the three treatments combined on greenhouse gases emission summed up in the mg CO2 equivalents (CO2 E) did not show any statistical difference (Table 3). The total effect for the three treatments after applying the CO2 equivalents was not significantly different (Kruskal–Wallis test, P > 0.05).
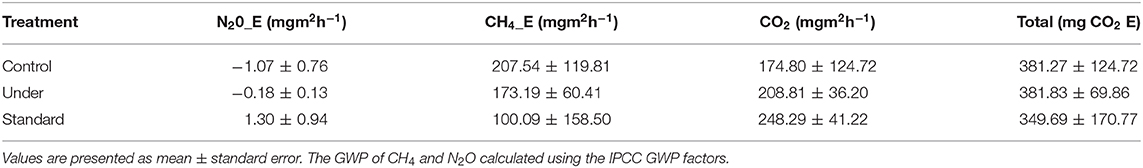
Table 3. Total effect of the greenhouse gases summed up in mg CO2 Equation.
Discussion
Carbon and Nitrogen Stocks in Rice Paddies
Wetland based rice production is an important source of GHGs (Garthorne-Hardy, 2013; Wang et al., 2017). Increased conversion of wetlands to rice paddies reduces their ability to store carbon, thus increasing amount of GHGs (Mitchell, 2013). In this study, low levels of organic carbon stocks were recorded throughout the study period as indicated by the results. Drainage of wetland and land preparation for rice plantation exposed the accumulated organic carbon to oxygen and this accelerated oxidation of organic matter to CO2 and thus reduced carbon stocks. Kumar et al. (2014) and Ma et al. (2016) reported loss of organic carbon through cultivation and wetland drainage, which could be an explanation for the low levels of organic carbon observed in this study. Mitsch and Hernandez (2013) also noted that drainage of saturated wetland soils in addition to its natural dryness result in increased oxygen diffusion, translating to higher rates of decomposition of organic carbon, consequently an increase in CO2 emissions. The observed low soil organic carbon can also be attributed to the high CO2 emission in all the three fertilization scenarios. According to VandenBygaart et al. (2003), when soils in a natural state are converted to agricultural land, there is an important loss of soil organic carbon (SOC) mainly in the form of CO2. Furthermore, rice paddies are characterized with anoxic conditions which result in methanogenesis, leading to a loss of carbon as CH4 and hence reduce carbon stocks (Jain et al., 2004). The loss of soil organic carbon in Anyiko rice paddies can also be explained by–alternate drying and wetting conditions which favor growth of microorganisms and hence high carbon mineralization (Ma et al., 2017). Other studies have also reported an increase in soil microbial activity and carbon mineralization under alternate drying and wetting conditions in incubation experiments (Fierer and Schimel, 2002; Zhao et al., 2011). The alternate drying and wetting season experienced during the experiment supplied more oxygen into the soil and hence increased oxidation of soil organic carbon which results to high emission of CO2 into the atmosphere.
The two major microbial processes responsible for nitrogen transformations in soil are mineralization and assimilation by plants and microorganisms (Booth et al., 2005). In this study, the amount of total nitrogen increased from the initial value recorded in pretest (0.18 ± 0.06%) to 0.73 ± 0.38% after the experiment. Supply of nitrogen fertilizer in the soil during the experiment led to increased nitrogen stocks in under-fertilized and standard fertilized plots. Even though the amount of total nitrogen increased, the effect of the different treatments on the plots was not significant. According to Fuhrmanna et al. (2018), accumulation of nitrogen in the soil could be due to immobilization and retention of N fertilizer in the soil. The applied nitrogen fertilizer increased the available nitrogen stock but did not affect the amount of NH4-N and NO3-N among the three fertilizer application scenarios used. However, the standard fertilized and under-fertilized plots had high amount of NH4-N and NO3-N compared to control plots. This could be associated with fact that application of N fertilizer supplied more nitrogen substrate resulting to enhancement of mineralization and ammonification process (Chirinda et al., 2018). Consequently, more ammonium in the fertilized plots than in the control plots, though the impact was not substantial. Lowland rice is usually grown in waterlogged soils and this condition leads to reductive deamination (conversion of amino acid-N to ammonia via saturated acids), a process called ammonification (Sahrawat, 2010). Additionally, due to varying weather conditions at the study site, the field experienced episodic dry and wet periods. During dry periods, soils become relatively aerated and ammonium formed during mineralization got converted to nitrate via nitrite under oxic conditions (nitrification) (White and Reddy, 2001). This can explain the observed high amount of NO3-N in the paddy soil. Also Sahrawat (2010) noted that nitrification can be supported at the rice plant's root-soil interface in wetland soils by oxygen transported through the air spaces or aerenchyma tissues of the stem and roots of the plant.
The ratio of carbon to nitrogen (C/N) in arable soils usually ranges between 8:1 and 15:1, with the median being 10:1 and 12:1 (Brady and Weil, 2008). The C/N ration in this study ranged between 1:1.2 and 8:1 which is quite low compared to the normal range of 8:1 and 15:1. Carbon nitrogen ratio in the soil is very important because it affects mineralization and immobilization processes of soil. The available carbon and nitrogen stocks in soil, deposition from the atmosphere, addition of manure and application of inorganic fertilizer influences the GHGs emissions (Oertel et al., 2016). This study noted that N2O emissions increased with decreased C/N ratio but CH4 and CO2 had a positive correlation with C/N ratio, though not significant. This is in agreement with the study by Oertel et al. (2016) who reported a negative correlation of N2O emission with the C/N ratio, with the lowest emission being recorded at C/N ≥ 30 and highest at C/N values of 11 and a positive correlation of CO2 and CH4 emission with the C/N ratio. Toma and Hatano (2007) noted that, N2O and CO2 emissions increased as the C/N ratio decreased, but not significantly. It is worth noting that in this case, the result for CO2 contradicts the results of the study by Oertel et al. (2016) and the results of this study. Moreover, intensive management of the peat lands has been found to alter the soil C/N balance, leading to higher variability of GHG emission (Veber et al., 2017).
Other environmental and agronomic factors like temperature, soil moisture content, water regimes, pH, C:N ratio, nutrient supply among others affect the mineralization processes in waterlogged rice soils (White and Reddy, 2001; Li et al., 2003). The observed high NO3-N content compared to NH4-N could be because of varying environmental factors during the experiment, like water regime. Sahrawat (2008) explained that mineralization of organic nitrogen in aerobic soils resulting to formation of NO3-N (nitrification) is more sensitive to high temperature than ammonification. However, more studies need to be done to investigate the impact of environmental and agronomic factors to nitrification and ammonification.
Greenhouse Gas Fluxes Under Different Fertilizer Application Scenarios
Greenhouse gas fluxes for CH4 and CO2 were not significantly affected by fertilizer application regimes. N2O fluxes however varied significantly among the three treatments. This suggests that whether there was fertilizer input or not, the wetlands soils had adequate carbon stocks for the production of GHGs, particularly CH4 and CO2. Application of NPK 23:23:0 and CAN at a rate of 50 kg per acre at planting and for top dressing, respectively, promotes release of N2O as opposed to when fertilizer is applied only at planting or no fertilizer used at all.
Methane emissions in flooded paddy rice fields or any waterlogged soils occur due to anoxic conditions (Ma et al., 2010). The emissions of CH4 to the atmosphere from paddy rice fields constitute a predominant source of anthropogenic CH4 (Agnihotris et al., 1998). The three fertilization scenarios did not have an effect on the amount of CH4 emission. This is in consistent with a study done by Linquist et al. (2012), which reported no effect of fertilizer N rate on CH4 emissions. Even though CH4 emission was not affected by the varying fertilization scenarios, the general CH4 emissions from all the treatment plots were high. The consistently high soil moisture content created by the hydrologic modification to suit rice production provided favorable conditions for methanogens which proliferate methanogenesis (Veber et al., 2017). Lu et al. (2000) explained that fertilized larger plants provide more carbon substrate (roots and exudates) for methanogens thus enhances CH4 production. Fertilization also leads to enlarged aerenchyma in rice plants and therefore enhancing the pathway for gas movement through the soil substrate and consequently facilitates CH4 emission (Tang et al., 2018). Nitrogen fertilizer applications however, have been reported to have varying effects on CH4 emissions. Shang et al. (2011) reported stimulation of CH4 emission with N fertilizer application. According to Venterea et al. (2005) CH4 emission is inhibited with N fertilizer application and in certain situations there are no significant effects of different N fertilizer application regimes on CH4 emission (Mosier et al., 2006).
Fertilizer application regime did not affect the CO2 emissions. Since fertilizer application had no direct effect on carbon stocks, therefore under similar humidity conditions, a difference in organic carbon based GHG emission is not expected. Carbon dioxide emissions to the atmosphere occur under oxic conditions which favors microbial decomposition of organic matter (Whiting and Chanton, 2001). The dry incidents experienced during sampling could have led to oxygen supply into the soil, enhancing the aeration, and thus increased CO2 emissions. In rice paddies, apart from drainage, oxic conditions also occur at the soil-water interface and in the roots hence increasing CO2 emissions to the atmosphere (Boateng et al., 2017). A study done by Cheng-Fang et al. (2012) showed no significant effect of N fertilizer application on cumulative CO2 emissions. These results are consistent with the findings of this study where CO2 emissions within the plots treated with different fertilization scenarios did not differ significantly. However, variable results have been reported from different studies where (Xiao et al., 2005; Iqbal et al., 2009) reported increased CO2 emissions with use of N fertilizer from rice paddy farms whereas (Burton et al., 2004) recorded a decrease in CO2 emissions with use of N fertilizer. Long term studies are necessary to improve the understanding of the effect of fertilizer application on carbon stocks and CO2 emissions in rice paddies.
Nitrogen fertilizer application affected the nitrogen stocks and therefore a notable difference in N2O emission from the three treatments. Emission of N2O is influenced by the availability of nitrogen species (NH4-N and NO3-N) in the soil since they are required by microbes for nitrification and denitrification processes (Cowan et al., 2015). Bin-feng et al. (2016) reported that N2O emissions became progressively greater as the quantities of N fertilizer increased. The study noted that N inputs in the range of 52.5–300 kg N ha−1 per season caused a significant increment (average 145%) in N2O emissions. When fertilizer is applied into the soil, there is increased supply of nitrogen substrate for decomposers resulting to enhanced emission of N2O (Chirinda et al., 2018). Linquist et al. (2012) meta-analysis study also reported that N2O emissions increased significantly with increasing N fertilizer application rates, which is in agreement with the findings of this study.
Despite the observed differences in the emission levels of the three treatments, their net N2O emissions were still very low. The low N2O emissions could be attributed to other environmental factors like immobilization and retention of N fertilizer in soil (Fuhrmanna et al., 2018). The low N2O fluxes could also be due to some of the nitrogen being–lost through leaching thus reducing amount of nitrogen substrate available for N2O emissions. Bronson et al. (1997) in their study also observed negligible N2O emissions during rice growing season when the soil is flooded. This is probably because the strictly anoxic conditions in the flooded paddies are suitable for denitrification and the major product of this process is nitrogen gas (N2).
The greenhouse gases have varying residence time in the atmosphere and they all have different radiative force and thus different global warming potential GWP. The global warming potential of each gas is measured over a certain period of time using CO2 as the reference gas. Over a span of 100 years, the GWP for CO2, CH4, and N2O have been found to be 1, 25, and 298, respectively (Solomon et al., 2007). To evaluate the overall effect of GHG production in this study, the GWPs was applied to the fluxes measured and then carbon dioxide equivalent (CO2 Eq) summed up. However, the effect of the three treatments on the overall GWP was not significant. This could be probably because of the short duration of the study and the similar weather conditions experienced in all the treatment plots. Fertilizer application had no effect on the net GWP. This is in contrast with the study by Bin-feng et al. (2016) which noted that response of GWP to N addition was 3-10 folds greater for fertilization of 250–300 kg N ha−1 (266%) than for 50–250 kg N ha−1 (26 to 80%). Methane and nitrous oxide emissions from rice fields are however of great concern due to their radiative effects as well as GWP (IPCC, 1995).
Land use change is the major driver of loss of ecosystem services. Ecosystem services maybe lost or reclaimed through change in land use. Wetlands have various roles to human well-being including; provisioning (food, water, and raw materials, fuel), regulating (floods, climate change through carbon sequestration, and water purification), and cultural (aesthetic, spiritual, educational, and recreational) services (MEMR, 2012). Despite their critical role, wetlands are being degraded rapidly and they suffer the greatest transformations worldwide (Zorrilla-Miras et al., 2014). Globally, wetlands losses due to conversion to arable cropping have been the key drivers to degradation of wetlands and increased emission of greenhouse gases (Tangen et al., 2015). The major wetland function impacted by land use change is loss of ability to sequester carbon. Wetlands accumulate carbon in soil and their expansive canopy litter due to anaerobic conditions which results to slow decomposition rates of organic carbon (Batson et al., 2015). However, during land preparation and cultivation for planting rice, the soil organic matter is exposed to favorable decomposition conditions which enhances loss of soil carbon as CO2. Use of different fertilizers (organic or inorganic) alter the chemical budget adds nutrients into the wetland and; as a result, impair the wetlands ability to purify water (nutrient sink). Cultural value of wetland is also lost when wetlands are cleared for agricultural use.
Conclusion
This study assessed soil organic carbon, soil nutrients stocks and greenhouse gas emissions under different treatments including: control (no fertilizer applied), under-fertilization (involved first and second topdressings fertilizer application only), and standard fertilization (involved basal, first and second fertilizer application). The various fertilization regimes did not significantly affect the soil nitrogen species (ammonium and nitrate), total nitrogen and soil organic carbon stocks. Although the fertilizer application regime did not affect the amount of available ammonium and nitrate, there was a significantly higher N2O emission under standard fertilization compared to no fertilizer application. Fertilizer application regime however, had no effect on CH4 and CO2 emissions in the short time of the study. From this study, even though the effect of the three fertilizer application scenarios was not significant, we can conclude that cultivation and land preparation for planting rice increased the loss of organic carbon in the form of CO2 and therefore the ability of the Anyiko wetland to store carbon was reduced. Use of nitrogenous fertilizer also led to impairment the of climate change regulatory function of the Anyiko wetland. Our findings suggest that the cumulative effects of such changes in the wetland land use may have negative implications on the ecosystem climate change regulating services.
Limitations of the Study
The study was conducted during rice growing period and therefore, only provides limited information on temporal variations of the GHG emissions in the rice fields. A year-round study would provide adequate information on emission levels before planting (when the land is bear), during rice growth and after planting.
The study was only conducted in the rice paddies. A concurrent study on the nutrient and organic carbon stocks, and GHG emissions in the natural wetland would provide useful information on the climate regulating ecosystem service of the wetland.
Data Availability Statement
The datasets generated for this study are available on request to the corresponding author.
Author Contributions
CO designed the study, fabricated the gas chambers, collected the samples, analyzed the data, and wrote the manuscript. NK and JK gave guidance on the study design and assisted on the manuscript write up. RO gave guidance on gas chambers fabrication, study design and assisted on the manuscript write up. All authors contributed to the article and approved the submitted version.
Funding
This research was funded by Rotary Club of Vienna.
Conflict of Interest
The authors declare that the research was conducted in the absence of any commercial or financial relationships that could be construed as a potential conflict of interest.
Acknowledgments
Our gratitude goes to the LWM programme, Department of Biological Sciences and Department of Soil Science Egerton University and International Livestock Research Institute (ILRI), Mazingira Centre, for giving us lab space and equipment to carry out our research work. We appreciate the support from Dr. Lutz Merbold and Mr. Paul Mutuo of ILRI, Mazingira Centre. We are also grateful to Mr. Erick Owino of Egerton University for field assistance.
References
Agnihotris, S., Kulshreshtha, S. A., and Singh, S. N. (1998). Mitigation strategy to contain methane emission from rice-fields. Environ. Monitor. Assessment 58, 95–104.
Arias-Navarro, C., Díaz-Pinés, E., Kiese, R., Rosenstock, T. S., Rufino, M. C., Stern, R. D., et al. (2013). Gas pooling: a sampling technique to overcome spatial heterogeneity of soil carbon dioxide and nitrous oxide fluxes. Soil Biol. Biochem. 67, 20–23. doi: 10.1016/j.soilbio.2013.08.011
Arunrat, N., and Pumijumnong, N. (2017). Practices for reducing greenhouse gas emissions from rice production in northeast Thailand. Agriculture 7, 1–20. doi: 10.3390/agriculture7010004
Balasubramanian, V., Sie, M., Hijmans, R. J., and Otsuka, K. (2007). Increasing rice production in sub-saharan Africa: challenges and opportunities. Adv. Agron. 94, 55–133. doi: 10.1016/S0065-2113(06)94002-4
Batson, J., Noe, G. B., Hupp, C. R., Krauss, K. W., Rybicki, N. B., and Schenk, E. R. (2015). Soil greenhouse gas emissions and carbon Soil greenhouse gas emissions and carbon floodplain wetland. J. Geophys. Res. Biogeosci. 120, 77–95. doi: 10.1002/2014JG002817
Bin-feng, S., Hong, Z., Yi-zhong, L., Fei, L., and Xiao-ke, W. (2016). The effects of nitrogen fertilizer application on methane and nitrous oxide emission/uptake in Chinese croplands. J. Integr. Agric, 15, 440–450. doi: 10.1016/S2095-3119(15)61063-2
Boateng, K. K., Obeng, G. Y., and Mensah, E. (2017). Rice cultivation and greenhouse gas emissions: a review and conceptual framework with reference to ghana. Agriculture 7:7. doi: 10.3390/agriculture7010007
Booth, M. S., Stark, J. M., and Rastetter, E. (2005). Controls on nitrogen cycling in terrestrial ecosystems: a synthetic analysis of literature data. Ecol. Monogr. 75, 139–157. doi: 10.1890/04-0988
Brady, N. C., and Weil, R. R. (2008). The Nature and Properties of Soils, 14th Edn. Columbus, OH: Pearson Prentice-Hall Upper Sadle River.
Bronson, K. F., Singh, U., and Neue, H. U. (1997). Automated chamber measurements of methane and nitrous oxide flux in a flooded rice soil; II fallow period emissions. Soil Sci. Soc. Am. J. 61, 988–993. doi: 10.2136/sssaj1997.03615995006100030039x
Burton, A. J., Pregitzer, K. S., Crawford, J. N., Zogg, G. P., and Zak, D. R. (2004). Simulated chronic NO3-deposition reduces soil respiration in Northern hardwood forests. Glob. Chang. Biol. 10, 1080–1091. doi: 10.1111/j.1365-2486.2004.00737.x
Butterbach-Bahl, K., Ole Sander, B., Pelster, D., and Díaz-Pinés, E. (2016). “Quantifying greenhouse gas emissions from managed and natural soils,” in Methods for Measuring Greenhouse Gas Balances and Evaluating Mitigation Options in Smallholder Agriculture, eds. T. S. Rosenstock, M. C. Rufino, K. Butterbach-Bahl, E. Wollenberg, and M. Richards (Springer Chem), 71–96. doi: 10.1007/978-3-319-29794-1_4
Butterbach-Bahl, K. K., Kiese, R. R., and Liu, C. (2011). Measurements of biosphere atmosphere exchange of CH4 in terrestrial ecosystems. Methods Enzymol. 495, 271–87. doi: 10.1016/B978-0-12-386905-0.00018-8
Cheng-Fang, L., Dan-Na, Z., Zhi-Kui, K., Zhi-Sheng, Z., Jin-Ping, W., Ming-Li, C., et al. (2012). Effects of tillage and nitrogen fertilizers on CH4 and CO2 emissions and soil organic carbon in paddy fields of central China. PLoS ONE 7:e34642. doi: 10.1371/journal.pone.0034642
Chirinda, N., Arenas, L., Katto, M., Loaiza, S., Correa, F., Isthitani, M., et al. (2018). Sustainable and low greenhouse gas emitting rice production in latin america and the caribbean: a review on the transition from ideality to reality. Sustainability 10:671. doi: 10.3390/su10030671
Collier, S. M., Ruark, M. D., Oate, L. G., Jokela, W. E., and Dell, C. J. (2014). Measurement of greenhouse gas flux from agricultural soils using static chambers. J. Visual. Exper. 90:52110. doi: 10.3791/52110
Cowan, N. J., Norman, P., Famulari, D., Levy, P. E., Reay, D. S., and Skiba, U. M. (2015). Spatial variability and hotspots of soil N2O fluxes from intensively grazed grassland. Biogeosciences 12, 1585–1596. doi: 10.5194/bg-12-1585-2015
Crafter, S. A., Njuguna, S. G., and Howard, G. W. (1992). Wetlands of Kenya. Proceedings of the Kenya Wetland Working Group (KWWG) seminar on wetlands of Kenya, National Museum of Kenya, Nairobi, Kenya, 3–5 July 1991. Nairobi: IUCN Library System.
Cubasch, U., Wuebbles, D., Chen, D., Facchini, M. C., Frame, D., Mahowald, N., et al. (2013). “Introduction,” in Climate Change 2013: The Physical Science Basis. Contribution of Working Group I to the Fifth Assessment Report of the Intergovernmental Panel on Climate Change, eds. T. F. Stocker, D. Qin, G. K. Plattner, M. Tignor, J. Boschung, A. Nauels, et al. (Cambridge, New York, NY: Cambridge University Press), 119–158.
FAO (2016). FAOSTAT. Retrieved from: http://www.fao.org/faostat/en/#compare (accessed on July 24, 2019).
FAO (2017). Rice Market Monitors. Retrieved from: http://www.fao.org/fileadmin/templates/est/COMM_MARKETS_MONITORING/Rice/Images/RMM/RMM_APR17_H.pdf (accessed on July 18, 2019).
Fierer, N., and Schimel, J. (2002). Effects of drying-rewetting frequency on soil carbon and nitrogen transformation. Soil Biol. Biochem. 34, 777–787. doi: 10.1016/S0038-0717(02)00007-X
Fuhrmanna, I., He, Y., Lehndorff, E., Brüggemann, N., Amelung, W., Wassmann, R., et al. (2018). Nitrogen fertilizer fate after introducing maize and upland-rice into continuous paddy rice cropping systems. Agric. Ecosyst. Environ. 258, 162–171. doi: 10.1016/j.agee.2018.02.021
Garthorne-Hardy, A. (2013). Greenhouse Gas Emissions From Rice from RGTW Working Paper Number 3. Retrieved from: http://www.southasia.ox.ac.uk/./GHG/%20emissions%20from%20rice%20-%20workin.pdf (accessed on July 2, 2018).
Houghton, R. A., House, J. I., Pongratz, J., Van Der Werf, G. R., Defries, R. S., Hansen, M. C., et al. (2012). Carbon emissions from land use and land-cover change. Biogeosciences 9, 5125–5142. doi: 10.5194/bg-9-5125-2012
IPCC (1995). “The science of climate change: Climate change, impacts, adaptations and mitigation of climate change,” in Scientific Technical Analysis, eds. I. T. Houghton, F. Meira, L. G. Callander, B. A. Harris, A. Kattenberg, and K. Maskell (Cambridge: Cambridge University Press).
Iqbal, J., Hu, R. G., Lin, S., Hatano, R., and Feng, M. L. (2009). CO2 emission in a subtropical red paddy soil (Ultisol) as affected by straw and N fertilizer applications: a case study in Southern China. Agric. Ecosyst. Environ. 131, 292–302. doi: 10.1016/j.agee.2009.02.001
Ishii, S., Ikeda, S., Minamisawa, K., and Senoo, K. (2011). Nitrogen cycling in rice paddy environments: past achievements and future challenges. Microb. Environ. 26, 282–292. doi: 10.1264/jsme2.ME11293
Jain, N., Pathak, H., Mitra, S., and Bhatia, A. (2004). Emission of methane from rice fields. a review. J. Sci. Ind. Res. 63, 101–115. Available online at: http://nopr.niscair.res.in/handle/123456789/17512
Junk, W. J., An, S., Finlayson, C. M., Gopal, B., Květ, J., Mitchell, S. A., et al. (2013). Current state of knowledge regarding the world's wetlands and their future under global climate change: a synthesis. Aquat. Sci. 75, 151–167. doi: 10.1007/s00027-012-0278-z
Kumar, S., Nakajima, T., Mbonimpa, E. G., Gautam, S., Somireddy, U. R., Kadono, A., et al. (2014). Long-term tillage and drainage influences on soil organic carbon dynamics, aggregate stability and corn yield. Soil Sci. Plant Nutr. 60, 108–118. doi: 10.1080/00380768.2013.878643
Li, H., Han, Y., and Cai, Z. (2003). Nitrogen mineralization in paddy soils of the taiho region of China under anaerobic conditions: dynamics and model fiting. Geoderma 115, 161–175. doi: 10.1016/S0016-7061(02)00358-0
Linquist, B. A., Adviento-Borbe, M. A., Pittelkow, C. M., van Groenigen, K. J., and van Kessel, C. (2012). Fertilizer management practices and greenhouse gas emissions from rice systems: a quantitative review and analysis. Field Crops Res. 135, 10–21. doi: 10.1016/j.fcr.2012.06.007
Lu, Y., Wassman, R., Neue, H., and Huang, C. (2000). Dynamics of dissolved organic carbon and methane emissions in a flooded rice soil. Soil Sci. Soc. Am. J. 64, 2011–2017. doi: 10.2136/sssaj2000.6462011x
Ma, K., Liu, J., Balkovič, J., Skalský, R., Azevedo, L. B., and Kraxner, F. (2016). Changes in soil organic carbon stocks of wetlands on China's Zoige plateau from 1980 to 2010. Ecol. Modell. 327, 18–28. doi: 10.1016/j.ecolmodel.2016.01.009
Ma, K., Qiu, Q. F., and Lu, Y. H. (2010). Microbial mechanism for rice variety control on methane emission from rice field soil. Glob. Chang. Biol. 16, 3085–3095. doi: 10.1111/j.1365-2486.2009.02145.x
Ma, Y., Xu, J. Z., Wei, Q., Yang, S. H., Chen, S. Y., and Liao, Q. (2017). Organic carbon content and its liable components in paddy soil under water-saving irrigation. Plant Soil Environ. 63, 125–130. doi: 10.17221/817/2016-PSE
Mironga, J. M. (2005). Effect of farming practices on wetlands of Kisii district, Kenya. Appl. Ecol. Environ. Res. 3, 81–91. doi: 10.15666/aeer/0302_081091
Mitchell, S. A. (2013). The status of wetlands, threats and the predicted effect of global climate change: the situation in Sab-Saharan Africa. Aquat. Sci. 75, 95–112. doi: 10.1007/s00027-012-0259-2
Mitsch, W. J., and Hernandez, M. E. (2013). Landscape and climate change threats to wetlands of North and Central America. Aquat. Sci. 75, 133–149. doi: 10.1007/s00027-012-0262-7
Moomaw, W. R., Chmura, G. L., Davies, G. T., Finlayson, C. M., Middleton, B. A., Natali, S. M., et al. (2018). Wetlands in a changing climate: science, policy and management. Wetlands 38, 183–205. doi: 10.1007/s13157-018-1023-8
Morrison, E. J., Upton, C., Odhiambo-K'oyooh, K., and Harper, D. M. (2012). Managing the natural capital of papyrus within riparian zones of Lake Victoria, Kenya. Hydrobiologia 692, 5–17. doi: 10.1007/s10750-011-0839-5
Mosier, A. R., Halvorson, A. D., and Reule, C. A. (2006). Net global warming potential and greenhouse gas intensity in irrigated cropping systems in northeastern colorado. J. Environ. Qual. 35, 1584–1598. doi: 10.2134/jeq2005.0232
NRC (2010). Advancing the Science of Climate Change, Report in Brief. Washington, DC: National Research Council, National Academies Press.
Oertel, C., Matschullat, J., Zurba, K., Zimmermann, F., and Erasmi, S. (2016). Greenhouse gas emissions from soils—a review. Chemie der Erde –Geochem. 76, 327–352. doi: 10.1016/j.chemer.2016.04.002
Okalebo, R. J., Gathua, K. W., and Woomer, P. L. (2002). Laboratory Methods of Soil and Plant Analysis: A Working Manual. Nairobi, Kenya: Sacred Africa.
Olivier, J. G., and Peters, J. A. (2018). Trends in Global CO2 and Total Greenouse Gas Emissions: 2018 Report. The Hague: PBL Netherlands Environmental Assessment Agency.
Olivier, J. G., Schure, K. M., and Peters, J. A. (2017). Trends in Global CO2 and Total Greenhouse Gas Emissions: 2017 Report. The Hague: PBL Netherlands Environmental Assessment Agency.
Ondiek, R. A., Vuolo, F., Kipkemboi, J., Kitaka, N., Lautsch, E., Hein, T., et al. (2020). Socio-economic determinants of land use/cover change in Wetlands in East Africa: a case study analysis of the anyiko Wetland, Kenya. Front. Environ. Sci. 7:207. doi: 10.3389/fenvs.2019.00207
Owino, A. O., and Ryan, P. G. (2007). Recent papyrus swamp habitat loss and conservation implications in western Kenya. Wetlands Ecol. Manag. 15, 1–12. doi: 10.1007/s11273-006-9001-y
Pelster, D., Rufino, M., Rosenstock, T., Mango, J., Saiz, G., Diaz-Pines, E., et al. (2017). Smallholder farms in eastern African tropical highlands have low soil greenhouse gas fluxes. Biogeosciences 14, 187–202. doi: 10.5194/bg-14-187-2017
Republic of Kenya (2008). National Rice Development Strategy (2008-2018). Ministry of Agriculture: Kenya.
Republic of Kenya (2014). National Rice Development Strategy (2008 – 2018): Revised. Ministry of Agriculture: Kenya.
Rochette, P. (2011). Towards a standard non-steady state chamber methodology for measuring soil N2O emissions. Anim. Feeds Technol. 166, 141–146. doi: 10.1016/j.anifeedsci.2011.04.063
Rochette, P., and Normand, B. (2003). Soil air sample storage and handling using polypropylene syringes and glass vials. Can. J. Soil Sci. 83, 631–637. doi: 10.4141/S03-015
Rosenstock, T. S., Mpanda, M., Pelster, D. E., Butterbach-Bah, K., Rufino, M. C., Thiong'o, M., et al. (2016). Greenhouse gas fluxes from agricultural soils of Kenya and Tanzania. J. Geophys. Res. Biogeosci. 121, 1568–1580. doi: 10.1002/2016JG003341
Sahrawat, K. L. (2008). Factors affecting nitrification in soils. Commun. Soil Sci. Plant Anal. 39, 1436–1446. doi: 10.1080/00103620802004235
Sahrawat, K. L. (2010). Nitrogen mineralization in lowland rice soils: the role of organic matter quantity and quality. Arch. Agron. Soil Sci. 56, 337–353. doi: 10.1080/03650340903093158
Shang, Q. Y., Yang, X. X., Gao, C. M., Wu, P. P., Liu, J. J., Xu, Y. C., et al. (2011). Net annual global warming potential and greenhouse gas intensity in Chinese double rice-cropping systems: a 3-year field measurement in long-term fertilizer experiment. Glob. Chang. Biol. 17, 2196–2210. doi: 10.1111/j.1365-2486.2010.02374.x
Singh, B., and Singh, V. K. (2017). “Fertilizer Management in Rice,” in Rice Production Worldwide, eds. B. S. Chauhan, G. Mahajan, and K. Jabran (Springer International Publishing), 217–253. doi: 10.1007/978-3-319-47516-5_10
Solomon, S., Qin, D., Manning, M., Alley, R. B., Berntsen, T., Bindoff, N. L., et al. (2007). Climate change 2007: the physical science basis. contribution of working group I to the fourth assessment report of the intergovernmental panel on climate change. IPCC Working Groups Reports, Cambridge, New York, NY. 23–78
Tang, J., Wang, J., Li, Z., Wang, S., and Qu, Y. (2018). Effects of irrigation regime and nitrogen fertilizer management on CH4, N2O and CO2 emissions from saline–alkaline paddy fields in northeast China. Sustainability 10:475. doi: 10.3390/su10020475
Tangen, B. A., Finocchiaro, R. G., and Gleason, R. A. (2015). Effects of land use on greenhouse gas fluxes and soil properties of wetland catchments in the prairie pothole region of north America. Sci. Total Environ. 533, 391–409. doi: 10.1016/j.scitotenv.2015.06.148
Toma, Y., and Hatano, R. (2007). Effect of crop residue C:N ratio on N2O emissions from Gray Lowland soil in Mikasa, Hokkaido, Japan. Soil Sci. Plant Nutr. 53, 198–205. doi: 10.1111/j.1747-0765.2007.00125.x
Tully, K. L., Abwanda, S., Thiong'o, M., Mutuo, P. M., and Rosenstock, T. S. (2017). Nitrous oxide and methane fluxes from urine and dung deposited on kenyan pastures. J. Environ. Qual. 46, 921–929. doi: 10.2134/jeq2017.01.0040
VandenBygaart, A. J., Gregorich, E. G., and Angers, D. A. (2003). Influence of agricultural management on soil organic carbon: a compendium and assessment of Canadian studies. Can. J. Soil Sci. 83, 363–380. doi: 10.4141/S03-009
Veber, G., Kull, A., Villa, J. A., Maddison, M., Paal, J., Oja, T., et al. (2017). Greenhouse gas emissions in natural and managed peatlands of America: case studies along a latitudinal gradient. Ecol. Eng. 114, 34–45. doi: 10.1016/j.ecoleng.2017.06.068
Venterea, R. T., Burger, M., and Spokas, K. A. (2005). Nitrogen oxide and methane emissions under varying tillage and fertilizer management. J. Environ. Qual. 34, 1467–1477. doi: 10.2134/jeq2005.0018
Wang, C., Lai, D. Y., Sardans, J., Wang, W., Zeng, C., and Peñuelas, J. (2017). Factors related with CH4 and N2O emissions from a paddy field: clues for management implications. PLoS ONE. 12:e0169254. doi: 10.1371/journal.pone.0169254
White, J. R., and Reddy, K. R. (2001). The effects of select electron acceptors on organic nitrogen mineralization in northern Everglades soils. Soil Sci. Soc. Am. J. 65, 941–948. doi: 10.2136/sssaj2001.653941x
Whiting, G. J., and Chanton, J. P. (2001). Greenhouse carbon balance of wetlands: methane emission versus carbon sequestration. Tellus B Chem. Phys. Meteorol. 53, 521–528. doi: 10.3402/tellusb.v53i5.16628
Xiao, Y., Xie, G., Lu, G., Ding, X., and Lu, Y. (2005). The value of gas exchange as a service by rice paddies in suburban Shanghai, PR China. Agric. Ecosyst. Environ. 109, 273–283. doi: 10.1016/j.agee.2005.03.016
Xi-Liu, Y., and Qing-Xian, G. (2018). Contributions of natural systems and human activity to greenhouse gas emissions. Adv. Clim. Change Res. 9, 243–252. doi: 10.1016/j.accre.2018.12.003
Zhang, L., Song, C., Zheng, X., Wang, D., and Wang, Y. (2007). Effects of nitrogen on the ecosystem respiration, CH4 and N2O emissions to the atmosphere from the freshwater marshes in northeast China. Environ. Geol. 52, 529–539. doi: 10.1007/s00254-006-0485-9
Zhao, C. Y., Zhao, Z. M., Yilihamu, H. Z., and Li, J. (2011). Contribution of root and rhizosphere respiration of haloxylon ammodendron to seasonal variation of soil respiration in the Central Asian desert. Quatern. Int. 244, 304–309. doi: 10.1016/j.quaint.2010.11.004
Keywords: rice paddies, wetland, fertilizer application, GHGs, climate change
Citation: Owino CN, Kitaka N, Kipkemboi J and Ondiek RA (2020) Assessment of Greenhouse Gases Emission in Smallholder Rice Paddies Converted From Anyiko Wetland, Kenya. Front. Environ. Sci. 8:80. doi: 10.3389/fenvs.2020.00080
Received: 12 September 2019; Accepted: 22 May 2020;
Published: 03 July 2020.
Edited by:
John Pascal Simaika, IHE Delft Institute for Water Education, NetherlandsReviewed by:
Nitin Kaushal, World Wide Fund for Nature, IndiaJulius Otieno Manyala, Jaramogi Oginga Odinga University of Science and Technology, Kenya
Copyright © 2020 Owino, Kitaka, Kipkemboi and Ondiek. This is an open-access article distributed under the terms of the Creative Commons Attribution License (CC BY). The use, distribution or reproduction in other forums is permitted, provided the original author(s) and the copyright owner(s) are credited and that the original publication in this journal is cited, in accordance with accepted academic practice. No use, distribution or reproduction is permitted which does not comply with these terms.
*Correspondence: Christine Nyagaya Owino, Y2hyaXN0aW5lbnlhZ2F5YUBnbWFpbC5jb20=