 Kristina Enders
 Alexander S. Tagg
 Matthias Labrenz
- Environmental Microbiology Working Group, Leibniz Institute for Baltic Sea Research Warnemünde, Rostock, Germany
Reliable, easy, cost-effective and reproducible ways of extracting microplastics (MP) from environmental samples remain important requirements for MP research. In this context, electrostatic separation is a new proposition, especially for extracting MP from mineral-rich samples and large sample volumes. However, there is little research evaluating the reliability of the technique. This study has evaluated the effectiveness of the Korona-Walzen-Scheider (KWS) system; a small-scale version of larger machines designed to sort recycling materials. Recovery rates of a variety of sizes of MP, spiked in beach sediments, were found to be highly dependent on the MP size. MP ≥ 2 mm achieved 99 – 100% recovery (with the exception of fibers: ∼80%), MP of 63–450 μm achieved ∼60–95% recovery and MP of 20 μm achieved ∼45% recovery. For particle-based analysis, additional density separation is still inevitable for the analysis of small MP after KWS separation and further reduces the overall recovery rates. Mass reduction rates of beach and commercial reference sand greatly differed, 93 and 17%, respectively. Mineral analysis using SEM-EDX suggested that lower reduction rates found in commercial sand was due to high presence of small (<50 μm) calcite particles. Tests based on environmental soil samples revealed comparatively low mass reduction rates (∼1%), suggesting that KWS treatment was inefficient for soils due to high levels of fine particulates. Sieving to remove fine particles improved mass reduction, though only to ∼15%. To specifically test for influence of fine particulates, recovery rates were determined for sand samples spiked with a defined amount of silicate dust, resulting in a reduction of certain MP recovery rates, especially medium-sized (450 μm) MP. Conclusively, several key influential parameters were identified, such as mineral composition and grain size, that can negatively effect sediment mass reduction as well as MP recovery rates. Given the variability in recovery rates, the use of internal standards is recommended when using the KWS, particularly for smaller MP (<500 μm). For large-volume (beach) sand samples, where interest is mainly in MP > 450 μm, electrostatic separation is a reliable and fast approach for MP extraction from the environment.
Introduction
Current limitations in the field of microplastics (MP) extraction from complex matrices foster the development of, and search for, new approaches. Electrostatic separation is one of the techniques that has recently been proposed by Felsing et al. (2018) for MP purification of different sample matrices, ranging from beach sand to more complex matrices like freshwater suspended particulate matter and freshwater sediments. In their study, a set of six different commodity polymers were tested at four different size ranges (2–5 mm, 0.63–2 mm, 200–630 μm and 63–200 μm) using a Korona-Walzen-Scheider (KWS-XS, Hamos GmbH) and yielded recovery rates of 90–100%.
The intended effect of electrostatic separation is to selectively separate non-MP particulates from MP particles, thereby reducing the non-MP particulate portion. This reduces the amount of material submitted to the subsequent steps and hence allows for preparation of larger initial sample volumes. The subsequent treatment of the electrostatically reduced sample is completed with already-established methods (e.g., density separation and digestion).
Density separation alone is the most widely used reduction method of the inorganic fraction. By using a variety of different density salt solutions (e.g., ZnCl2, NaI, sodium polytungstate) it can reduce bulk particulate material in many samples (Hidalgo-Ruz et al., 2012). However, there is a general lack of efficient separation procedures targeting large sample volumes of several kilos which is often needed when dealing with relatively low MP numbers in order to increase statistical robustness. The Munich Plastic Sediment Separator has been designed to density separate larger volumes, though, it appears to be a rather labor-intensive method (Imhof et al., 2012). Electrostatic separation is not as exhaustive as density separation in eliminating the entire mineral fraction (99.98 ± 0.03%, Enders et al., 2020), although approximately 98% mass could be reduced in previous tests in just 5 h (Felsing et al., 2018). However, due to deviating objectives a direct comparison to other established methods is difficult (though respective reviews exists, see Stock et al., 2019). Most other purification techniques where chemicals (acidic or basic) or mechanical forces (e.g., stirring during density separation) are involved require elaborate testing of MP resistivity (Lenz et al., 2020). Electrostatic separation can be considered a very gently treatment and such tests can be omitted as no effect on the MP integrity is to be expected.
The working principle of electrostatic separation using the KWS is based on the different electrical conductivity of the sample particulates, with mineral particulates being generally more conductive than plastics. As water content fundamentally changes the electrostatic behavior of particles, an initial (freeze) drying step is needed. The dried sample is then entered at the sample-entry funnel of the instrument and transported by a vibrating conveyor plate toward the Corona electrode system. For better visualization of this process, see the KWS-XS schematic in the supporting information (Supplementary Information, Figure S1). The particles become charged in a high-voltage electrical field (max. 35 kV, DC) between the grounded drum and an above-mounted rake-shaped electrode. More conductive mineral particles discharge quicker and jump off the drum with the dividing flap guiding them into the “sediment container.” Less conductive plastics discharge slower and remain adhered to the rotating drum and only detach later into a separate collection container (the herein named “plastic container”). All particles that remained adhering to the drum are mechanically removed by a scraping plate, which lets them fall into the plastic container as well. By recycling the content of the plastic container into the top (i.e., repeated runs), the mineral fraction is further reduced and MP are further refined. According to the prior study, three repetitions were found to be most efficient. As the working principle is already thoroughly explained by Felsing et al. (2018), in the following, the focus is concentrated only on the additional findings of this method e.g., concerning influential factors on the recovery rates as well as on the working steps necessary to allow a replication of the method.
Based on the results by Felsing et al. (2018), the aim of the present study was the validation of the instrument-functionality for current sample matrices and the determination of their standard error to be reported in future studies. The main scope was to use electrostatic separation for beach samples, as they (by experience) often require relatively large initial volumes (up to several kilos) to reach statistically robust MP numbers. Beach sediments are usually on the less complex end (low in organics, relatively homogeneous grain size distribution) of possible environmental matrix compositions and reached highest enrichment rates in the prior study mentioned above. However, more complex matrices (freshwater suspended particulate matter) also appeared to reach reasonable recovery rates and mass reductions. This is why we also report observations on the extraction efficiency of soil samples, a matrix which typically challenges other methods due to their complex compositions (rich in organics, heterogeneous grain size distribution, high levels of aggregation; Möller et al., 2020).
The extraction efficiency was evaluated based on three requirements:
• a reasonable mass reduction of the initial sample mass that allows for a subsequent quick and easy density separation in a separation funnel [as presented in Enders et al. (2020)]
• reasonable and reproducible (i.e., consistent) recovery rates of MP
• low influence of matrix-related variables (i.e., grain size, mineral composition) on recovery rates and mass reduction
As the prior study showed no differences in recovery rates between polymer types, the present study focuses only on different particle sizes with a broader overall size range from 20 μm to 4 mm, as well as with finer steps between each size range compared to prior tests (Felsing et al., 2018).
Materials and Methods
Test Material
Recovery rates were determined using the same model of electrostatic separator (2nd prototype, KWS-XS, Hamos GmbH) as presented in Felsing et al. (2018). Sets of different recovery-test MP of various sizes, polymers and shapes (Table 1 and Supplementary Information, Figure S2) were prepared and the test sediment samples spiked. The smaller the particles, the higher the number of spiked test MP due to the expected lower recovery rates. Spiked MP were counted visually (≥450 μm) aided with a binocular microscope (Zeiss Stemi 2000) and an ultraviolet light source (Tattu U2, 395 nm) where necessary (≤150 μm, fluorescent microspheres, Cospheric LLC).
Table 1. Set of spiked MP of various size (longest dimension), color, polymer type and shape.
Test samples were composed of either:
(a) 100 g (d/w) beach sand from the Baltic Sea (Warnemünde beach, 0–2 cm surface, d50 = 319 μm, 197–530 μm [10, 90 th percentiles], Supplementary Information, Figure S3A)
(b) 100 g (d/w) commercial sand (Aquarienkies, Rosnerski Quarz Verpackungswerk, d50 = 310 μm, 193–512 μm [10, 90th percentiles], Supplementary Information, Figure S3B)
(c) 100 g (d/w) sand as described in (a) added with 30 g micro glass beads with a size range of 40–70 μm (Strahlgut, Samore GmbH)
(d) 500 g w/w (∼440 g d/w) agricultural soils (0–30 cm surface mixed-core soil, from two test fields, one with 10 tons ha–1 of sludge from a waste water treatment plant previously applied in 2014, the other without sludge).
Preparation
Test samples (a)–(c) were baked for 5 h at 500°C to eliminate any MP contamination present in the sample which would potentially hinder a quick determination of the recovery rates. The soil samples (d) were not baked but freeze dried (according to Enders et al., 2020) as both the organic fraction was intended to be preserved and the determination and thus conservation of environmental MP was targeted in addition to the recovery rates of the spiked MP standards.
The test sediments were added together with the spiked MP into the entry-funnel at the top of the KWS and a test run started according to the attached protocol (Supplementary Information, Text S1). The procedures described here were written based on the steps reported by Felsing et al. (2018) and experiences made by the authors of this study. For example, run repetitions were set to five (instead of three) in order to increase the mass reduction. Subsequently, a small-scale density separation was performed according to Enders et al. (2020) to allow unhindered identification of the spiked test-MP. A schematic overview of the separation steps can also be found in Felsing et al. (2018, Figure 3).
Optimal Instrument Settings
At first, optimal instrument settings had to be identified to perform recovery tests. Those initial tests were performed using the test MP between 4 mm and 450 μm in size (Table 1), as they could be quickly visually identified without performing a subsequent density separation. For beach sands (a, c) two different high voltages (20 kV, 22 kV) were tested and the full set of MP recovery rates and mass reduction determined. The voltage optimum was found to be at 22 kV. While higher voltages generally improved the separation efficiency, when further increased (up to 25 kV), smaller particles were strongly dissipated and scattered in an uncontrollable manner. The drum speed was set relatively slow, 5 rpm (4%), as otherwise centrifugal forces and particle-particle interactions prevented independent separation of particles. To ensure the maintenance of a mono-layer of sample material on the drum, the terminal vibration strength of the conveyor plate was set between 60 and 120 rpm (1–2%). Initially, higher vibration strength might be needed as it depends on the sample weight on the conveyor plate which has to be transported. Depending on the sample type, drum speed and vibration strength can be changed but must be configured to ensure mono-layering of particulate matter on the drum. The sample-entry funnel on top of the KWS comes with a relatively large output opening (12 cm), which caused large variations of sample weight present on the conveyor plate and thus a lot of manual adjustment of the required vibration intensity to achieve a mono-layer (as a function of the sample being processed). Since, in this original design, failure in properly adjusting the vibration strength during sample-processing could influence the results (by impacting drum mono-layering), the funnel was modified with additional tapering using an adjustable stainless steel plate. The new opening can be adjusted to approximately 5–10 mm (Supplementary Information, Figure S1). It is further noted that the original particle shield (Polyvinyl chloride) above the vibration plate and drum, built to reduce the loss of particles to the KWS interior, was unmounted due to several reasons. These are: (1) Both sand and MP particles were found adhering to the shield surface and were thus lost from the sample; (2) The PVC shield constitutes a potential source of plastic contamination, and (3) It hindered control of mono-layering. Given these benefits, it is not expected that the shield removal negatively effects results. As an additional modification, a hardboard sheet was added above the sediment container to reduced the loss of sediment to the KWS interior (Supplementary Information, Figure S1). The metal dividing flap that determines the boundary between sediment and plastic container was set to an angle of 19.5°, the optimally determined position where maximum sediment would be separated without any large MP falsely entering the sediment container (standard procedures and parameters in Supplementary Information, Text S1, Figure S4).
Mineral and Grain Size Classification
SEM-EDX analyses were completed at the IOW by the authors using a Zeiss Merlin VP Compact Scanning Electron Microscope (SEM) combined with an Oxford X-Max 80 energy-dispersive x-ray (EDX) spectrometer to analyse mineral content of two exemplary sand samples (software: Oxford AZtec 3.3). Samples were vacuum sputter-coated with elemental carbon to provide good electrical conductivity (Cressington Carbon Coater 108carbon/A, TESCAN GmbH, 10 nm layer thickness). Measurements were taken with an aperture of 30 μm, a working distance of 8.5 mm and a kV of 15.00 using Inca feature 5:04 software. An upper limit of 1000 features (i.e., particulates) were measured per sample. Mineral classification was applied according to the in-house-developed Baltic Sea Standard. Homogenized and freeze dried subsamples were grain size analyzed in two replicates using the laser-sizer Mastersizer 3000 by Malvern (10 s ultrasound applied).
Results
Recovery Rates
Across the different types of sand sediment matrices (a–c), MP recovery rates decreased with MP size (Figure 1, data in Supplementary Information Table S1). The standard deviation increased for smaller MP as well as fibers.
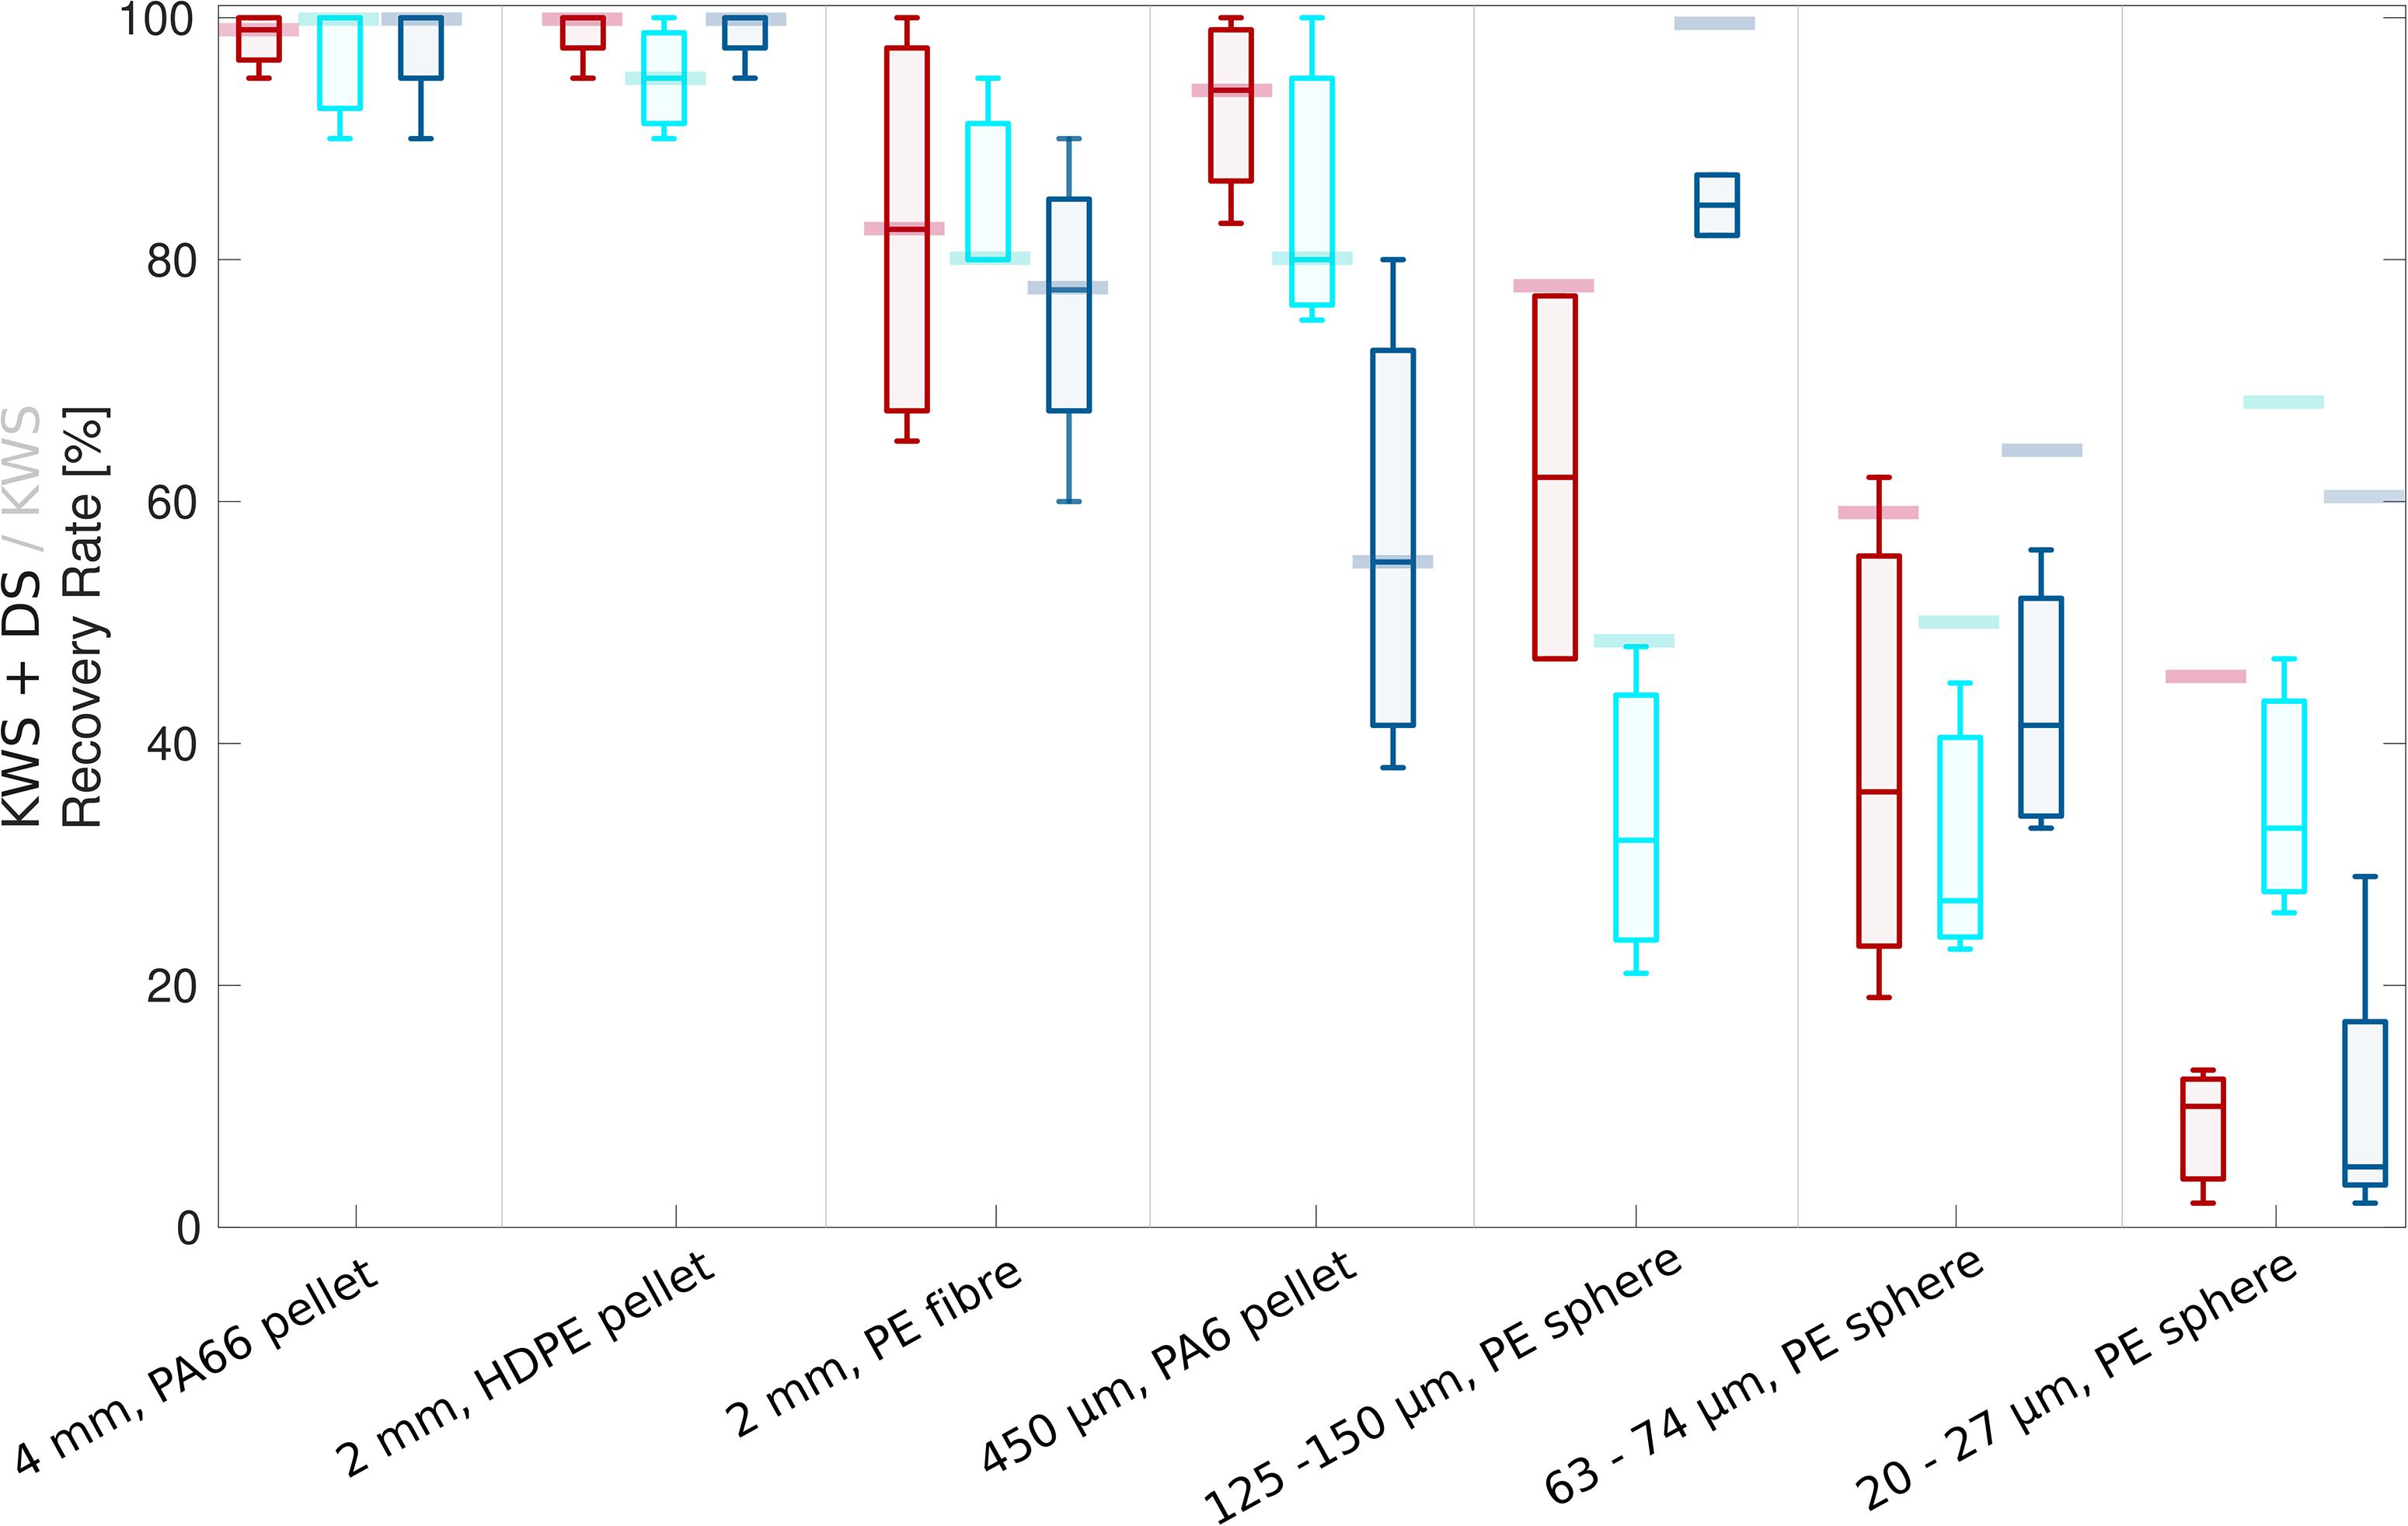
Figure 1. Box plot series showing recovery rates (incl. density separation, DS) of MP of different size classes from beach sand (red), commercial sand (turquoise) and beach sand with additional presence of dust (dark blue). Whiskers represent the 25 and 75 percentiles. KWS-specific median recovery rates of MP of different size classes, mathematically corrected for density separation, are shown as opaque bars behind the box plots.
For beach sand (a), the MP recovery rates decreased from 100 to 10% median recovery, including losses generated during density separation (Figure 1, red box plots; Supplementary Information Tables S1A–D). The recovery rates presented here were determined after the density separation, a necessary procedural step, as otherwise remaining sediment particles hindered a direct analysis, especially of the particles ≤150 μm. To determine KWS specific recovery rates, the recovery rates of the density separation only were determined separately and subtracted from the total (Figure 1, opaque bars; Supplementary Information Tabled S1L–M), resulting in a corrected recovery rate declining from 100 to 45% with size. There was no difference in recovery rates between the two different voltages (20 and 22 kV), thus recovery rates were averaged (Supplementary Information Tables S1A–D).
Median recovery rates for the commercial sand (b) were slightly lower compared to the beach sands (Figure 1, turquoise box plots; Supplementary Information Tables S1E–G), with the exception that the recovery rates of the smallest spiked MP (20–27 μm) were significantly higher (t-test, p = 0.03).
The presence of the fine (40–70 μm) glass beads (c) resembling fine sediment grains or, more generally, dust, partly distorted the previously described recovery-rate pattern for beach sand sediments (Figure 1, dark blue box plots; Supplementary Information Tables S1H–K). While the large particles (>2 mm) were unaffected, the recovery rate of the intermediate size class (450 μm) was significantly reduced (t-test, p = 0.04) by nearly 40%. Spiked MP (125–150 and 63–75 μm) closer to the size spectrum of the added dust particles showed a slightly increased recovery rate compared to the previous test without additional dust. It seems reasonable to assume that the added dust particles cannot sufficiently adhere to MP particles of similar size and thus do not negatively affect the recovery rate. However, larger MP which can be sufficiently surface-coated by dust can obtain a higher net-conductivity and enter the sediment container more frequently. This negative effect on the intermediate size class seems to amplify when using glass beads as sole sample matrix (one observation only; Supplementary Information Table S1O).
Mass Reduction
The main reason of applying the KWS is the selective MP refinement by reduction of the mineral mass fraction. In case no considerable mass-reduction is achieved for a specific sample, electrostatic separation would simply constitute an increase in methodological efforts and resources (as well as an extra step for possible contamination and loss of particles), without any prominent benefit. Therefore, besides MP recovery rates, the mass reduction is the ultimate measure of treatment effectiveness.
The mass reduction of beach sand was influenced by the voltage applied and resulted in 74% at 20 kV and 93% at 22 kV. Comparable numbers were acquired with dust added, 70% at 20 kV and 94% at 22 kV. Thus, a higher voltage generally increases the mass reduction. However, as already mentioned in the above section “Optimal instrument settings,” a further increase strongly affected the smaller particles that scattered in an uncontrollable manner.
The effectiveness of the method in terms of mass reduction for the commercial sand was substantially lower compared to the beach sand, resulting in a 17% average (at 22 kV), MP recovery rates were within the same ranges. The lower mass reduction, and thus a larger remaining volume, of the commercial sand probably explains the higher recovery rates of the smallest spiked MP, which appear not to be actively separated. An increase in voltage (to 25 kV) did not have a measurable effect on the mass reduction of commercial sand, as the majority of the material remained adhered to the drum before being collected into the plastic container by the scraping plate. As the grain size distribution of both sand types (a, b) were very similar, likely mineral compositions (e.g., mineral specific electrical conductivity) plays a larger role.
The mass reduction can also be influenced by the angle of the dividing flap between the sediment and plastic containers. The larger the angle, the more of the mineral fraction will be separated (and ultimately eliminated). However, over-increasing the flap angle comes at the cost of MP recovery rates, as certain (particularly large) MP will start to be eliminated from the sample if the angle is too extreme. As stated above, an optimum angle was determined to be 19.5°; the highest angle where no large MP were lost to the sediment container (runs: n = 3). It has been observed that an initially higher angle (starting at 28°) lead to an increased loss of MP, particularly the 4 mm black pellets and the 2 mm fibers (up to 10%), to the sediment container. The rounded morphology of these MP occasionally initiated rolling movement on the drum which, combined with drum-centrifugal force, likely explains the higher trajectory and loss to the sediment container of these MP. For the sands used in this study, a higher flap angle of 28° did not further increase mass reduction rates. It was observed that the eventual non-separated sediment fraction was adhering to the drum, indicating that further increase of the angle would have a negligible effect. While initial instrument settings, such as the angle of the dividing flap or high voltage, can influence the separation efficiency, the determining factor for the final mass reduction seems to depend on sediment composition.
Sediment Composition
It was not initially clear why beach and commercial sand had different mass reduction rates, since they are expected to be compositionally similar (i.e., mainly quartz(SiO2)-based). However, given there was a clear difference in mass reduction, and that the two sands had a different visual appearance (beach sand brown in color while commercial sand was white, Supplementary Information, Figure S3), it was necessary to further analyse the mineral composition of the sediment to better understand if, and how, mineral composition influences reduction rates. SEM-EDX spectroscopy was applied to the two sand samples. It was apparent that the commercial sand contained higher levels (50.5%) of small (<50 μm) calcite particles in comparison to beach sand (23.5%). A visual demonstration of this difference can be seen in Figure 2. Aside from this, the elemental analysis showed slightly lower levels of certain metal elements (e.g., aluminum, potassium and magnesium) in the commercial sand.
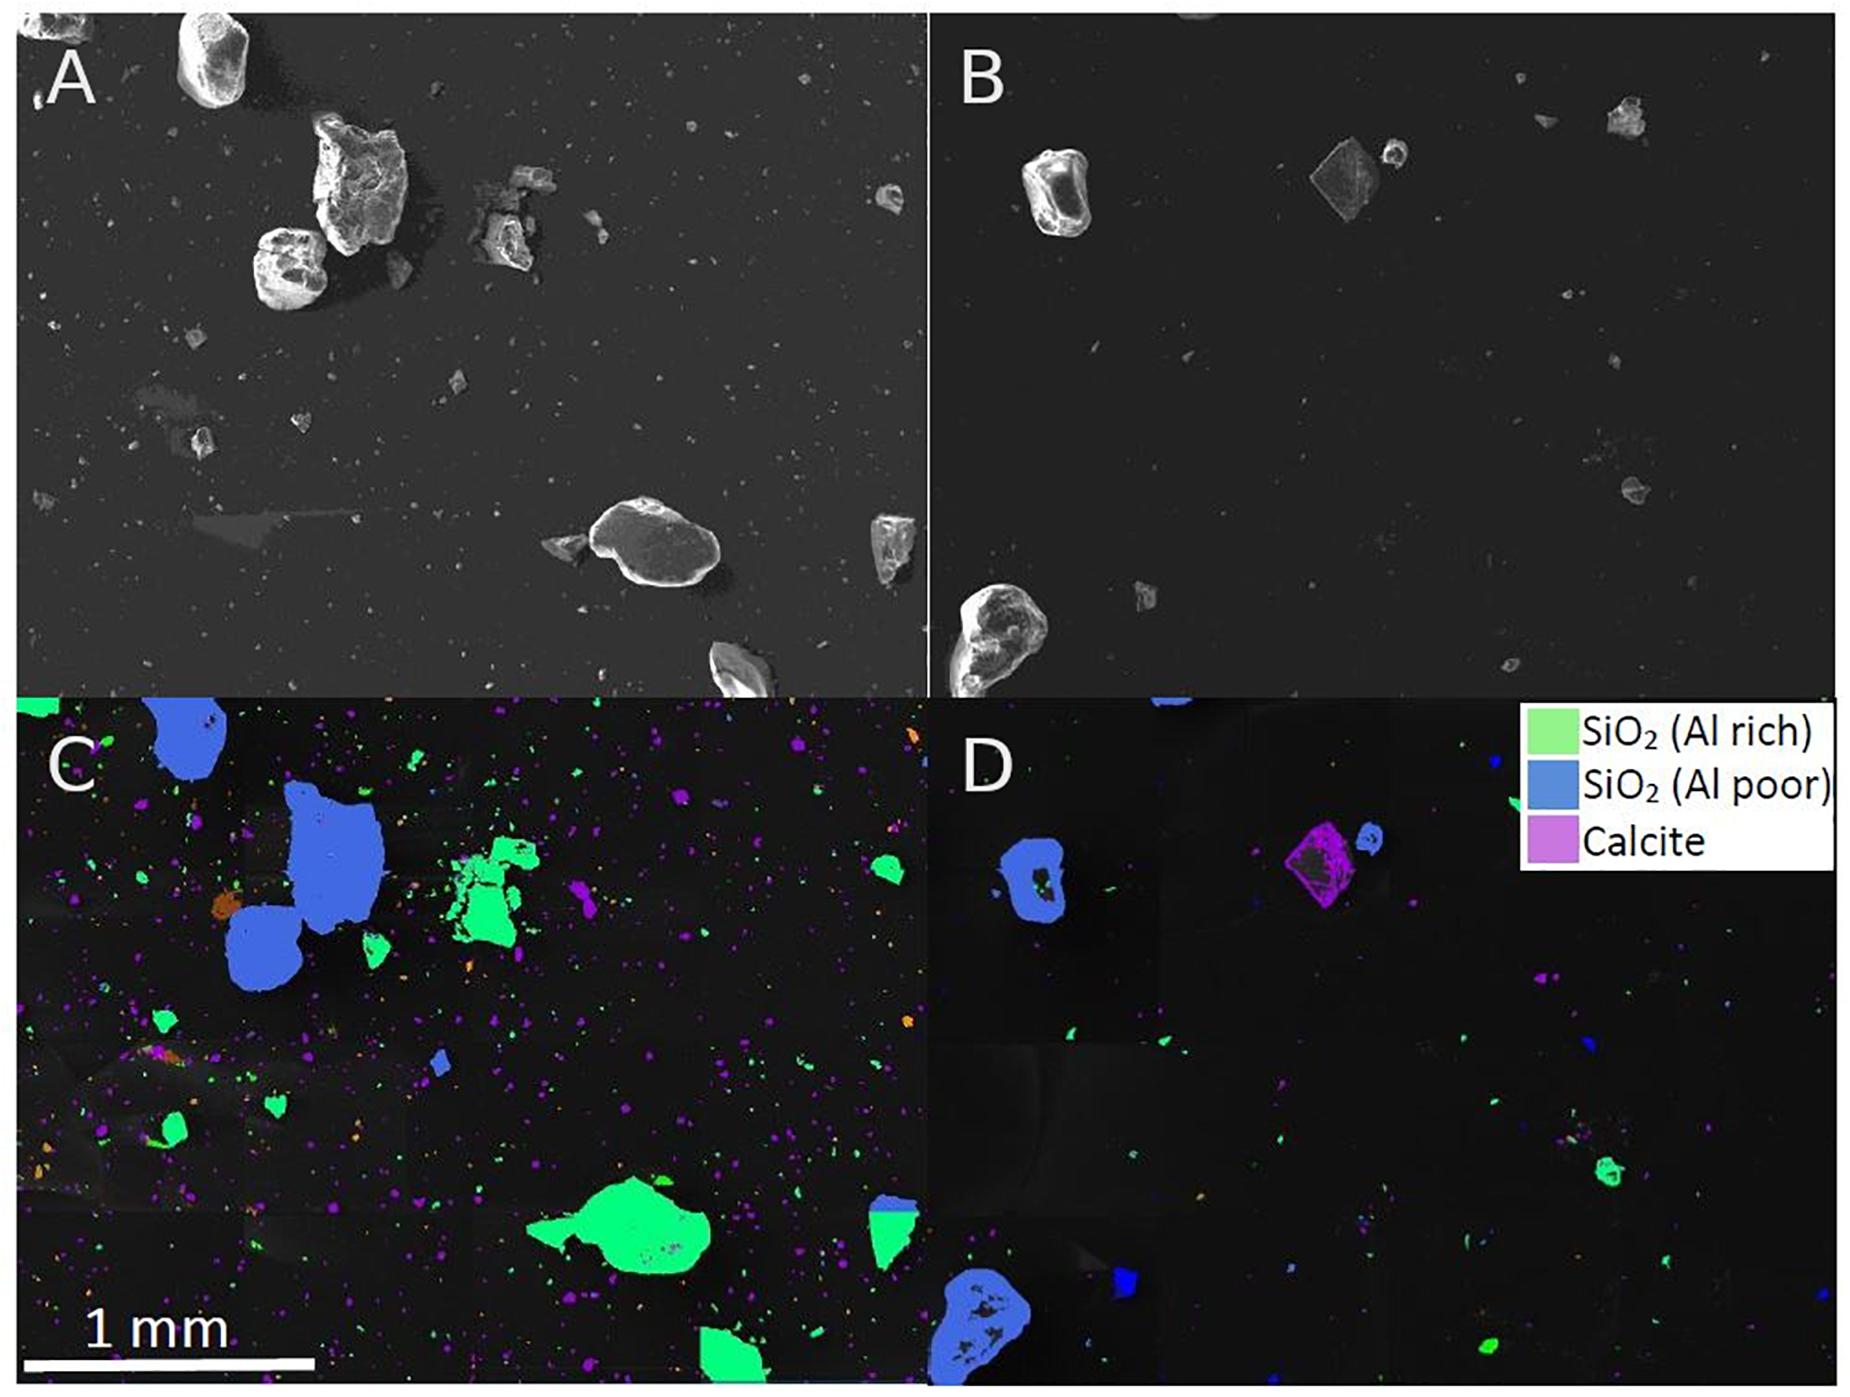
Figure 2. SEM images of (A) commercial sand and (B) beach sand. Mineral classification of sediment particles for (C) commercial sand and (D) beach sand. High amounts of small calcite particles can be seen in the commercial sand samples (purple in C), which are largely absent in the beach sand sample (D).
From the obtained data we can only presume that either the actual mineral composition differences lead to changes in the material conductivity and thus different electrostatic separabilities. Or, that the compositional differences lead to distinct hygroscopic properties that entail varying material humidities at the time of separation. The latter may be tested in a humidity controlled environment, which is, however, beyond the scope of this study.
Soils
Initially, soil samples (d) achieved ∼1% visually estimated reduction after two runs. This ineffectiveness of the KWS was postulated to be due to the high levels of silt and clay particulates present in soils (especially agricultural soils). Therefore, dry-sieving to remove the <100 μm quotient was applied (according to Enders et al., 2020). After a further six runs of the sieved sample, the mass was reduced overall by ∼15% (total eight runs taking ∼7 h per 500g w/w sample, not including reductions of the sieved-out fraction). This indicates that removal of the dust-sized quotient of the soil samples improved the performance considerably (from ∼1 to ∼15% reduction); however, this reduction rate was far below that observed for beach sand. Due to such a comparatively poor reduction, it was considered redundant to test recovery rates for KWS treatment of soil. This is because to enable MP analysis, other methods, such as sieving, and multiple cycles of density separation and H2O2 digestion were required. This makes KWS-specific recovery rates difficult to accurately determine, and ultimately without value, given the lack of usefulness of the KWS approach for these samples going forward.
Discussion
Influential Factors
Microplastics recovery rates for different mineral-rich samples using the KWS scaled with MP size, with generally the highest rates achieved for the largest particles. In consequence, a general standard error for overall MP recovery using the KWS is not useful and thus not determined, suggesting to report a standard error per size range (see Figure 1).
The results demonstrated that, aside from customisable instrument settings, many factors concerning the composition of the sediment matrix can potentially influence MP recovery rates obtained by electrostatic separation. While some of these factors can be easily adjusted, such as sample condition e.g., humidity by prior freeze-drying, factors determining sample composition are more complex to control for. Among those are grain size distribution (especially with respect to the smaller “dust” fraction), mineral composition as well as organic matter content (potentially causing aggregation). This study showed that increased presence of dust of one specific grain size strongly influenced the recovery rate of certain MP sizes. An explanation for this effect could be an increased surface-coating of MP by smaller silicate particles causing a higher net-conductivity and increased loss to the sediment container. SEM-EDX analysis suggested that presumably the high presence of calcite dust (as seen in the commercial sand, Figure 2) or lower presence of metal-rich minerals reduced sediment reduction rates, lowering the usefulness of the approach. It is, however, still unclear which dust sizes or mineral compositions have the greatest impact on size-dependent recovery rates and mass reduction rates. The amount of dust likely negatively scales with the specific recovery rates, as observed when using the dust particles as the sole sample matrix. In contrast to the freshly produced and clean test MP, environmental MP are usually coated with organics and fine dust. Therefore, the actual recovery rates for environmental MP are likely below those presented here.
Soil observation results also suggest that high presence of fine particulates and the presence of agglomerates (as typical for soils) in samples limits KWS applicability. As the primary purpose of implementing electrostatic separation is for the bulk reduction of sample volume, it turned out that KWS treatment, even with a large amount of fine particles being removed by dry-sieving, enabled only a reduction of the original volume of ∼15%. Taken into account that the time taken to perform this reduction was 7 h, the value of the applied method was low for our purpose. Indeed, even after sieving and KWS treatment, an advanced density separation was still required to process the samples. Methods for the refinement of MP in environmental samples benefit from having the least steps necessary, given the problems of particle loss and contamination (Dehaut et al., 2019; Enders et al., 2020). As such, the method applied to soils within this study offers limited promise. However, it should be considered that dry-sieving does not completely remove dust, as conglomerates of fine material and those adhering to larger particles may not pass through the sieve. Wet-sieving (performed before freeze-drying), which uses water to carry material through the sieve, is likely to be more efficient at dust-removal. However, it is unknown how much of a pronounced difference this might have on KWS reduction rates on agricultural soils. Given issues surrounding agglomeration of particulates in soils, reduction rates are still anticipated to be well below those of sand, and progressing directly to a larger-scale density separation is likely to produce better results than wet-sieving combined with KWS.
The material requirements reported by the manufacturer of the KWS (hamos GmbH) are in line with our findings in view of a conservative perspective. The company recommends sizes of 2–12 mm for plastic separation and >100 μm for mineral separation. Ideally, the material is dust-free and completely disintegrated (no composites/agglomerates).
Other Limitations
As already mentioned the KWS has originally been developed for large-scale recycling material separation, focusing on plastic particles of several millimeters to centimeters (Tilmatine et al., 2009; hamos GmbH, 2020). Although the KWS-XS has been downscaled in size which allows an application of smaller samples in a usual scientific lab, certain limitations derive from the design of the instrument and related physics of particles. The KWS has a relatively closed outer hull which prevents contamination from outside. However, when working with particles down to the smaller micrometers in size, the arrangement of the functional inner parts would obviously require a more closed system of higher precision, with less surfaces and corners causing potential particle losses. It has frequently been observed that larger particles, especially fibers and smaller MP, repeatedly remained adhered to the drum as a result of not being dislodged by the scraping plate which is installed to provoke particles, still adhered once passing the sediment (waste) container, to fall into the plastic container. The scraping plate also unintentionally collects particles on the rear side over time, and requires manual opening and scraping to ensure all relevant particles are collected in the MP container. This process is, however, less effective the smaller the MP. In the case of soil samples, clay presence was so high that, given the inefficiency of the scraping plate at consistently removing small particles, after a number of runs the drum was permanently coated in fine particulates. This made mono-layering highly challenging and probably contributed to the lower mass reduction rates. In general, the large surface areas inside the KWS offer small particles plenty of space to stick to due to electrostatic forces of attraction. This effect can be observed after sample runs that contained relatively small grain sizes, after which all surfaces gathered dust. Accordingly, cleaning between sample runs is exhaustive. A size measurement of the dust collected on the inner surfaces of the KWS after a beach sand separation showed an average size of 54 μm, ranging from 33 to 79 μm as the 10 and 90th percentiles, respectively. Occasionally, larger MP (>450 μm) fell to the bottom of the instrument, outside the remit of the collection containers.
The MP container collecting the refined material has to be thoroughly rinsed and the rinse water collected following sample transferral to the density separation (or any other desired next experimental step). In some cases, more than 50% of the spiked MP < 150 μm were found in this rinsate (and included in the results).
Scope of Application
The results of the present study showed that a reduction of MP recovery rates correlated with size, with the smallest fraction (20–27 μm) achieving consistently less than 20% recovery (incl. KWS and density separation) for sands that were sufficiently reduced in mass. In contrast, Felsing et al. (2018) found as high as 100% for all MP size fractions tested, from their largest (2–5 mm) to their lowest size fraction (63–200 μm), in both quartz and beach sand. Although this is a much larger and broader range size category than in the present study, the most comparable size class to their smallest size fraction is 63–74 μm, which achieved less than 60% for beach and commercial sands, when corrected for the density separation (for best comparability as Felsing et al. (2018) counted recovery rates without density separation).
Instrument settings were overall comparable between the two studies. Although drum speed and vibration of the conveyor plate were slightly faster in the prior study, as long as the mono-layering is ensured, no influence on the recovery rate is expected. The angle of the metal flap divider between the collection containers was also in a similar range (20°) in the Felsing et al. (2018) study (Kochleus, 2020). However, in the present study, it has been shown that, rather than the instrument settings, sample matrix variance influences the mass reduction to the greatest degree, as demonstrated by SEM analysis of the two sand samples as well as the ineffectiveness of KWS treatment on the soil samples.
A difference between the designs of the two studies concerns the shape of the spiked MP used. Whereas the prior paper used MP with a flake-like (flat) morphology, the present study used mainly pellet or round MP. Flat particles have a larger surface area-volume ratio which presumably better-adhere to the drum, whereas round MP, due to the relatively small contact area compared to mass, are more likely to fall from the drum prematurely if the electrostatic force is insufficient compared to gravity acting upon the particle. As mentioned above, this fall-off effect was observed especially for the larger MP (>2 mm). However, it is unlikely that shape significantly affects the recovery of the smaller MP. The small MP fraction reported by Felsing et al. (2018) describes particles within a comparatively larger size range (e.g., 63–200 μm) and the actual size distribution of particles within that range is unknown. This makes it difficult to compare to the finer small-MP size ranges used in the present study (125–150, 63–74, and 20–27 μm). The MP sample number was lower in the previous study (n = 10), compared to the present study (n > 20), for the individual spiked MP which increases the risk of statistical outliers.
However, an important factor to consider when comparing studies testing electrostatic separation is that we now know that mineral composition plays an important role. SEM analysis of the two sand samples within the current study showed that both the size and composition of particulate matter can have a marked difference on mass reduction. Therefore, comparing reduction or recovery rates between samples where mineral composition is unknown is a challenge. Yet, the difference in results between the two studies are so pronounced that, even with a difference in mineral composition, it is likely that more unknown factors are in play.
Microplastics samples treated with electrostatic separation require further subsequent treatment steps such as density separation and digestion. Ultimately, the recovery rates of the respective procedural steps add up. The sum of all this can be quite considerable for some size classes, as shown with the example of combined electrostatic and density separation (Figure 1, box plots). The more methodological handling steps, the more errors occur and it is generally recommended to keep the individual treatment pipeline as short and simple (but robust) as possible. Therefore, it has to be evaluated case by case, whether the requirements shown in the present paper fit both the sample type and the research question. Less complex sediment matrices with expectantly low MP content that statistically require larger initial sample volumes (>1 kg) may justify such a first volume reduction step. In any case, the additional financial investment, as well as per-sample time and effort related to electrostatic separation has to be taken into account. A simple density separation (hand-shaking) in a separation funnel is efficient to up to ∼50 g of sediment (lower for organic-rich samples). For samples up to 500 g (or even up to 1 kg if the sample is split), a density separation, combined with advanced stirring, such as the spiral sediment conveyor (Enders et al., 2020) is most-likely more efficient and robust for a greater range of research questions. However, samples significantly larger than this can make density separation too challenging as a first step. In these cases, the KWS approach could be used to reduce the starting volume, especially for sand samples. However, given the variance in recovery rates due to MP size and sample composition, the use of internal standards is highly beneficial, especially for the smallest sizes targeted (something typically determined by analysis limitations). MP that are highly unusual (so as not to be confused with real environmental MP) and easy to distinguish (i.e., brightly colored) are most recommended. UV-fluorescent MP are highly beneficial for this purpose.
Despite the above, open questions still remain from the current state of knowledge, and of particular concern are the recovery rates of environmental (degraded) MP and the influence of MP shape. Larger systematic tests would be needed to better understand these questions, as well as to quantify the impact of the identified key influential parameters of the sediment matrix. As a concise summary of the above findings, advantages and limitations of electrostatic separation (using the KWS) for MP purification from sediments are listed in Table 2.
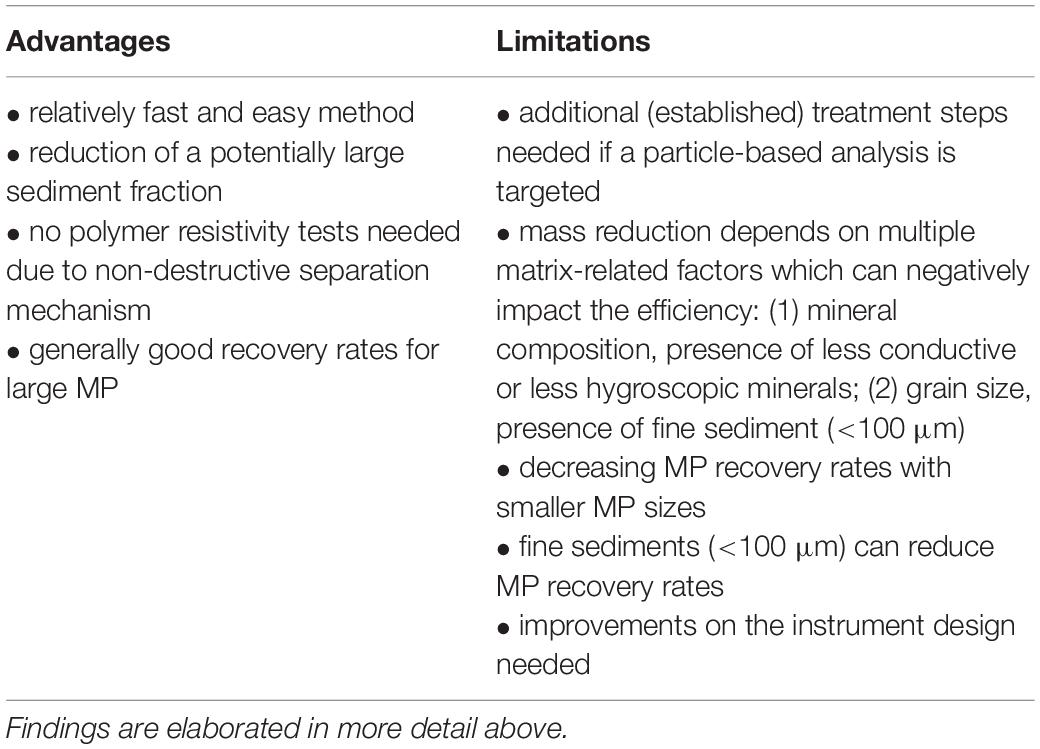
Table 2. Summary of advantages and limitations of electrostatic separation (using the KWS) for MP purification from sediments.
Conclusion
Based on the presented results, the application of the KWS for MP purification can be recommended for sediments of relatively large grain sizes (above 100 μm), in absence of dust and for large MP sizes between 0.5 and 5 mm, especially where large sample volumes (>1 kg) are desired. It should be tested in advance whether the mass reduction of the targeted matrix achieves the required volume for further processing, given that although mineral composition has shown to be of influence, the extent of this influence is unknown. The use of internal standards is highly recommended, especially for small MP, as recovery rates vary with MP size as well as sediment composition.
Data Availability Statement
All datasets presented in this study are included in the article/Supplementary Material.
Author Contributions
KE and ML: study design. KE: data acquisition and analysis (KWS). AT: data acquisition and analysis (SEM). KE and AT: writing—original draft. ML: writing—review and editing, supervision, and project administration. KE: visualization of KWS. AT: visualization (SEM). All authors contributed to the article and approved the submitted version.
Funding
This work resulted from the BONUS MICROPOLL project supported by BONUS (Art 185), funded jointly by the European Union and Federal Ministry of Education and Research (BMBF) (03F0775A), and the BMBF project MicroCatch_Balt (03F0788A).
Conflict of Interest
The authors declare that the research was conducted in the absence of any commercial or financial relationships that could be construed as a potential conflict of interest.
Acknowledgments
We would like to thank Sascha Plewe for his contributions to the SEM and EDX analyses and Friederike Stock, Christian Kochleus and Stefanie Felsing for knowledge exchange on the KWS. We also thank Juliana Ivar do Sul, Friederike Uchtmann and other research assistants for support during lab work and Robin Lenz for helpful comments.
Supplementary Material
The Supplementary Material for this article can be found online at: https://www.frontiersin.org/articles/10.3389/fenvs.2020.00112/full#supplementary-material
References
Dehaut, A., Hermabessiere, L., and Duflos, G. (2019). Current frontiers and recommendations for the study of microplastics in seafood. TrAC Trends Anal. Chem. 116, 346–359. doi: 10.1016/j.trac.2018.11.011
Enders, K., Lenz, R., Ivar do Sul, J. A., Tagg, A. S., and Labrenz, M. (2020). When every particle matters: a QuEChERS approach to extract microplastics from environmental samples. MethodsX 7:100784. doi: 10.1016/j.mex.2020.100784
Felsing, S., Kochleus, C., Buchinger, S., Brennholt, N., Stock, F., and Reifferscheid, G. (2018). A new approach in separating microplastics from environmental samples based on their electrostatic behavior. Environ. Pollut. 234, 20–28. doi: 10.1016/j.envpol.2017.11.013
hamos GmbH (2020). Recycling- and Separation Technology [WWW Document]. Electrostatic Separators. Available at https://www.hamos.com/products/electrostatic-separators,35,eng (accessed February 18, 2020).
Hidalgo-Ruz, V., Gutow, L., Thompson, R. C., and Thiel, M. (2012). Microplastics in the marine environment: a review of the methods used for identification and quantification. Environ. Sci. Technol. 46, 3060–3075. doi: 10.1021/es2031505
Imhof, H. K., Schmid, J., Niessner, R., Ivleva, N. P., and Laforsch, C. (2012). A novel, highly efficient method for the separation and quantification of plastic particles in sediments of aquatic environments. Limnol. Oceanogr. Methods 10, 524–537. doi: 10.4319/lom.2012.10.524
Lenz, R., et al. (2020). A universal concept for microplastic resistance assays. Front. Environ. Sci. (in press).
Möller, J. N., Löder, M. G. J., and Laforsch, C. (2020). Finding microplastics in soils: a review of analytical methods. Environ. Sci. Technol. 54, 2078–2090. doi: 10.1021/acs.est.9b04618
Stock, F., Kochleus, C., Bänsch-Baltruschat, B., Brennholt, N., and Reifferscheid, G. (2019). Sampling techniques and preparation methods for microplastic analyses in the aquatic environment – A review. TrAC Trends Anal. Chem. 113, 84–92. doi: 10.1016/j.trac.2019.01.014
Keywords: electroseparation, method test, protocol, anthropogenic litter, plastic, monitoring, reference material
Citation: Enders K, Tagg AS and Labrenz M (2020) Evaluation of Electrostatic Separation of Microplastics From Mineral-Rich Environmental Samples. Front. Environ. Sci. 8:112. doi: 10.3389/fenvs.2020.00112
Received: 07 April 2020; Accepted: 29 June 2020;
Published: 17 July 2020.
Edited by:
João P. G. L. Frias, Galway-Mayo Institute of Technology, IrelandReviewed by:
Venkatramanan Senapathi, Ton Duc Thang University, VietnamAn Liu, Shenzhen University, China
Copyright © 2020 Enders, Tagg and Labrenz. This is an open-access article distributed under the terms of the Creative Commons Attribution License (CC BY). The use, distribution or reproduction in other forums is permitted, provided the original author(s) and the copyright owner(s) are credited and that the original publication in this journal is cited, in accordance with accepted academic practice. No use, distribution or reproduction is permitted which does not comply with these terms.
*Correspondence: Kristina Enders, a3Jpc3RpbmEuZW5kZXJzQGlvLXdhcm5lbXVlbmRlLmRl; Matthias Labrenz, bWF0dGhpYXMubGFicmVuekBpby13YXJuZW11ZW5kZS5kZQ==