- 1Hydro Technology Institute, Arco Tower, Shimo-meguro, Meguro, Tokyo, Japan
- 2Research and Development Center, Nippon Koei, Tsukuba, Japan
- 3Department of Environmental Science, Saitama University, Saitama, Japan
- 4Department of Agronomy, Bangladesh Agricultural University, Mymensingh, Bangladesh
- 5Ecosystem Management Research Group, University of Antwerp, Wilrijk, Belgium
In recent years, an invasive macrophyte, Egeria densa, has overwhelmingly colonized some midstream reaches of Japanese rivers. This study was designed to determine how E. densa has been able to colonize these areas and to assess the environmental conditions that limit or even prevent colonization. Invasive species (E. densa and Elodea nuttallii), and Japanese native species (Myriophyllum spicatum, Ceratophyllum demersum, and Potamogeton crispuss) were kept in experimental tanks and a flume with different environmental conditions. Tissue hydrogen peroxide (H2O2) concentrations were measured responding to either individual or multiple environmental factors of light intensity, water temperature, and water flow velocity. In addition, plants were sampled in rivers across Japan, and environmental conditions were measured. The H2O2 concentration increased in parallel to the increment of unpreferable levels of each abiotic factor, and the trend was independent of other factors. The total H2O2 concentration is provided by the sum of contribution of each factor. Under increased total H2O2 concentration, plants first started to decrease in chlorophyll concentration, then reduce their growth rate, and subsequently reduce their biomass. The H2O2 concentration threshold, beyond which degradation is initiated, was between 15 and 20 µmol/gFW regardless of the environmental factors. These results highlight the potential efficacy of total H2O2 concentration as a proxy for the overall environmental condition. In Japanese rivers, major environmental factors limiting macrophyte colonization were identified as water temperature, high solar radiation, and flow velocity. The relationship between the unpreferable levels of these factors and H2O2 concentration was empirically obtained for these species. Then a mathematical model was developed to predict the colonization area of these species with environmental conditions. The tissue H2O2 concentration decreases with increasing temperature for E. densa and increases for other species, including native species. Therefore, native species grow intensively in spring; however, they often deteriorate in summer. For E. densa, on the other hand, H2O2 concentration decreases with high water temperature in summer, allowing intensive growth. High solar radiation increases the H2O2 concentration, deteriorating the plant. Although the H2O2 concentration of E. densa increases with low water temperature in winter, it can survive in deep water with low H2O2 concentration due to diffused solar radiation. Currently, river rehabilitation has created a deep zone in the channel, which supports the growth and spreading of E. densa.
Introduction
Macrophyte responses to environmental conditions are species specific, and invasive plants tend to exhibit more tolerance than native species (Zerebecki and Sorte, 2011; Bates et al., 2013). Therefore, invasive species are able to dominate or distribute in areas where native species fail to survive. Among different invasive aquatic macrophytes, Egeria densa is a well-known worldwide species that causes significant ecological issues in freshwater ecosystems. In Japan, E. densa was used as an ornamental aquarium plant in the early 19th century. However, it has escaped into natural freshwater bodies and became naturalized in the 1940s. Although E. densa mainly invaded lakes during the initial spreading stage in the 1970s (Kadono, 2004), this species has been recorded increasingly in many western Japanese rivers over the last two decades (MLIT, 2019). These rivers were originally nearly free of macrophytes and consisted of gravel beds and hyporheic flow (Tanida, 1984; Hauer et al., 2016). Though native species (e.g., Myriophyllum spicatum, Potamogeton crispuss, and Ceratophyllum demersum) were colonized patchily, no large colonies were found in major rivers (Kunii, 1982; Kadono, 2004). Another alien species, Elodea nuttallii, also invaded at nearly the same time in 1961. However, it did not produce large colonies except for lakes and small streams. In contrast, E. densa spread to cover the entire river channel of major rivers. The widespread colonization of E. densa has led to extreme changes in these river ecosystems. After establishment, E. densa behaved as ecological engineers, changing the environment to their benefit (Schoelynck et al., 2012; Schoelynck et al., 2014). They reduced water flow velocity and attenuated wave energy, leading to particle settlement and, consequently, hyporheic flow capacity reduction (Madsen et al., 2001; Boano et al., 2014). It has also caused economic losses. For example, the presence of macrophytes substantially decreases the yield of Ayu (Plecoglossus altivelis altivelis), a grazer of benthic algae (Kawanabe, 1970). Casual monitoring between present-day abiotic conditions and plant traits, such as growth rate and biomass, is the method commonly used to evaluate the preferable habitat for macrophyte species (Barko et al., 1991; Riis et al., 2012; O’Hare et al., 2018). However, environmental conditions frequently change, and there are various types of effective factors in the natural rives. Thus, it is difficult to apply the monitoring system in the field, particularly to derive the most influential factor.
Aquatic macrophytes growing in their natural environment often face an array of unpreferable environmental conditions, for example, too low or too high water temperatures, high flow velocity (Atapaththu and Asaeda, 2015), pollution, or substrate alteration (Asaeda et al., 2013). They can survive and propagate if the conditions remain within the plants’ tolerance levels. When the environmental conditions exceed the tolerance thresholds for a considerable period of time, macrophytes become stressed, lose their colonization capacity, and ultimately decay. However, following a short-term exposure to such conditions, they can recover, depending on the extent of the damage caused and the characteristics of the species (Weerakoon et al., 2018). Thus, the presence of a specific macrophyte species in an area depends on whether environmental factors are within their tolerance levels as well as on the duration of the exposure. When plants are subjected to unpreferable environmental conditions, reactive oxygen species (ROS) are generated in different organelles (Zaman and Asaeda, 2013; Das and Roychoudhury, 2014; Asaeda et al., 2017; Choudhury et al., 2017; Helaly et al., 2017; Parveen et al., 2017; Asaeda et al., 2018; Elsheery et al., 2020a; Elsheery et al., 2020b), which damages the plant body by the oxidative stress. Some ROS are scavenged relatively quickly by antioxidants (Omar et al., 2012), and the homogeneity of ROS in tissues is maintained by balancing the ROS and antioxidants. The balance flips over when oxidative stress surpasses the scavenging capacity of the antioxidants (Naser et al., 2016; El-Sheery, 2017; Dumont and Rivoal, 2019). Among ROS, hydrogen peroxide (H2O2) is widely generated (Asada, 2006; Sharma et al., 2012), relatively stable, and can be easily measured (Satterfield and Bonnell, 1955; Zhou et al., 2006; Asaeda et al., 2020). The concentration of H2O2 in plant tissues does not depend on a particular stress but is subjected to sum magnitude of unpreferable environmental conditions (Suzuki et al., 2014; Asaeda et al., 2020). Thus, H2O2 concentration in the plant tissue can be used as an indicator of the physiological status of a particular macrophyte species (Smirnoff and Arnaud, 2019). The system has been used for E. densa, which has successfully identified the channel slope that it can colonize (Asaeda et al., 2020).
The trend of H2O2 concentration is likely as a result of a long history of acclimatization to the natural condition of a particular area; thus, it may vary widely between native and invasive species. To apply tissue H2O2 concentration as an indicator to elucidate the intensive growth of invasive species, it is necessary to determine the relationship between H2O2 concentration and environmental factors both for native and invasive species. The main objective of the present study is to 1) empirically determine the H2O2 concentration generated by unpreferable conditions of abiotic environmental factors for both native and invasive species, 2) develop the model to predict the environment where these species can colonize, and 3) elucidate the reason for the overwhelming growth of E. densa in rivers of particular areas.
Methodology
Experimental Methodology
In the experiment, invasive macrophyte species (E. densa and E. nuttallii) and major Japanese species (C. demersum, P. crispuss, and M. spicatum) were tested (MLIT, 2019). They were exposed to different types of physical conditions, temperature, irradiance, and water flow velocity, following the range of the rivers where these species were colonized from ∼8°C in winter to 30°C in summer for water temperature, 0–1,200 µmol/m2/s for the irradiance in water, and 0–50 cm/s for flow velocity (MLIT, 2019). For the laboratory experiments, healthy macrophyte stocks were collected from the Saba River (E. densa) and the Moto-Arakawa River near Tokyo (E. nuttallii, C. demersum, P. crispuss, and M. spicatum). Collected plants were cleaned with water to remove debris, and any attached macro-algae were carefully separated with tweezers. The plants were then cultured in a glass tank at 25 ± 2°C under a 12/12 h photoperiod with photosynthetically active radiation (PAR) (∼125 µmol/m2/s using fluorescent lamps) for over 2 months. Commercial sand (D50 < 0.1 mm) was used as a substrate, and 5% Hoagland solution was provided as the nutrient medium (Atapaththu and Asaeda, 2015). Algae were removed weekly, and algae-free plants were used in the experiments. Three types of experiments (triplicate) were conducted in total, each focusing on different combinations of environmental factors.
Experiment 1: Water Temperature and Irradiance
A number of studies have reported that water temperature can significantly affect the abundance of different aquatic plant species (Pip, 1989; Barko et al., 1991; Lougheed et al., 2001; Pandit, 2002). An experiment was conducted to identify the increment of H2O2 concentration of the plant tissue under different water temperatures and irradiance levels, and, thereby, to make empirical relations between these factors. Several light levels (0–1,300 µmol/m2/s of PAR) were tested in small aquaria (dimensions: 50.0 cm × 35.0 cm × 35.0 cm). Temperature level was maintained at 10 ± 2 (E. densa), 15 ± 2 (E. densa), 20 ± 2, 25 ± 2 (E. densa), and 30 ± 2, 35 ± 2°C using a temperature controlling system (Aquarium cooler ZC-100α, Zensui Corporation, Tokyo, Japan). PAR intensity was irradiated under natural solar radiation or using LED lights (Model LT-NLD85L-HN, OHM Electric Inc., Japan) with a 12 h light:12 h dark photoperiod for 3 weeks.
Experiment 2 and 3: Flow Velocity and Irradiance
This experiment was designed to test the effect of water flow velocity on the H2O2 concentration of the plant tissues and the interaction with irradiance (Atapaththu and Asaeda, 2015; Asaeda et al., 2017). Two sets of experiments were conducted. In the first experiment, experimental plants (E. nuttallii, P. crispus, C. demersum) were exposed to two water flow levels (16 and 25 cm/s) using custom-made recirculating flumes (dimensions: 240 cm long × 25 cm width × 28 cm depth) exposed to artificial light intensity by the LED lights, or dark conditions. Pre-aerated tap water was circulated by centrifugal electric motor pumps. Pre-acclimatized potted plants were allocated to a section in the flume where water was introduced though a gradually shrinking entrance section to reduce turbulence. Plants were continuously exposed to low or high mean flow velocities for up to 4 days. During the experiment, mean water flow velocity was detected using an ultrasonic velocimeter (Tokyo Keisoku Co. Ltd., Japan) directly above the plant leaf surface and recorded daily to minimize flow variation. Temperature level was maintained at 15 ± 2°C using an aquarium water temperature controlling system (Aquarium cooler ZC-100α, Zensui Corporation, Tokyo, Japan). Stress assays by means of H2O2 measurements were performed every 3 h from 6:00 to 18:00 after 4 days’ exposure, and each treatment contained three replicate flumes. For another experiment, a flume channel 2.4 m long, 25 cm wide and 22 cm depth was constructed outdoors. Eighteen flat pots with more than three E. densa plants were carefully and randomly installed. Water temperature was kept at 25 ± 2°C throughout the experiment. Flow velocities from stagnant to 40 cm/s were employed under different solar radiation, and after 3 h, three plants were sampled at each time and a stress assay was conducted immediately. PAR intensity in the water was measured with a portable quantum flux meter (Apogee, MQ-200, United States).
Field Observations
Several rivers that are highly colonized by E. densa were selected from the species distribution database in Japan (MLIT, 2019). The selected rivers were assessed to obtain detailed location information pertaining to the colonization of E. densa. Sampling was conducted in the Eno River and its tributary Tajibi River (April, May, and September 2016; April and June 2017); in the Saba River and its tributary Shimaji River (May, June, and September 2016; April and June 2017; August 2018), and in the Hii River (October 2016). At each sampling point, water flow velocity was measured with an ultrasonic velocimeter (Tokyo Keisoku Co. Ltd., Japan) at 20% (reference velocity) and 80% (depth of the colony) of the total water depth (Chow, 2009). PAR intensity in the water was measured with a portable quantum flux meter (Apogee, MQ-200, United States) at 10 cm depth intervals. M. spicatum was sampled in the Moto-Arakawa River near Tokyo in April 2015. The river was approximately 5 m wide and 40 cm deep, and the channel slope was approximately 1/1,000. The bottom surface was patchily covered with M. spicatum, E. nuttallii, C. demersum, and Sparganium spp. PAR, and velocity distributions were measured with a portable quantum flux meter (Apogee, MQ-200, United States) and an ultra-sonic velocimeter, respectively. E. nuttallii was sampled in July and September 2018 from the same river. Sampling was conducted approximately every 3 h in the light-exposed and dark-adapted conditions to remove the effect of solar radiation. The dark treatment involved placing a black plastic sheet (3 m × 3 m) floating over part of the plant colony for 30 min. The 30 min pre-dark period was determined by laboratory experiments, which were specifically conducted to determine the optimum pre-darkness duration (data not shown). In August 2017, a sampling of M. spicatum was conducted in the Sakuradabori of the Imperial Palace Moat, at the center of Tokyo, where M. spicatum made a mono-specific stand. The depth of the sampling site was 0.3 m–2.5 m. Both solar-exposed and dark-adapted samples were taken. Plant biomass was sampled from 50 cm × 50 cm quadrats in all sampling sites. The plant samples were placed in plastic bags and immediately stored in a cooling box containing dry ice for transfer to the laboratory where it was stored at −80°C until an H2O2 assay and chlorophyll estimation were conducted.
Determination of Shoot Growth Rate, H2O2 and Chl-a Concentrations
The length of the plants grown in the experimental units was measured using a millimeter scale at 5–7 day intervals. The shoot growth rate (SGR) was calculated as the difference in shoot length between two observations divided by the duration, and it was expressed in cm/day. At the end of each experiment, fresh plant shoots were extracted (∼500 mg) in an ice-cold phosphate buffer (50 mM, pH 6.0) that contained polyvinylpyrrolidone (PVP), and the extractions were centrifuged at 5,000 × g for 20 min at 4°C. This extraction was used to analyze the H2O2 content spectrophotometrically following the TiSO4 method (Satterfield and Bonnell, 1955) with modifications. The reaction mixture contained 750 µl of enzyme extract and 2.5 ml of 1% TiSO4 in 20% H2SO4 (v/v), which was centrifuged at 5,000 × g for 15 min at 20°C. The optical absorption of the developed yellow color was measured spectrophotometrically at a wavelength of 410 nm. The H2O2 concentration in samples was determined using the prepared standard curve for known concentration series and was expressed in µmol per gram fresh weight (µmol/gFW).
Chlorophyll a (Chl-a) concentrations of experimental plants were determined spectrophotometrically (UV Mini 1210, Shimadzu, Japan) by extracting pigments with N,N-dimethylformamide after keeping them in darkness for 24 h, and they were expressed in terms of fresh weight (FW) (Wellburn, 1994).
Statistical Analysis
Data were tested for normality with the Shapiro–Wilk test before statistical analyses. All results were presented as the mean ± SD of more than three replicates. Data were subjected to a one-way analysis of variance (ANOVA) with Tukey’s post-hoc test for mean separation. The t-test was performed where necessary. Bivariate analysis was used and followed by Pearson’s correlation to evaluate the relationship among parameters. Statistical analyses were performed in IBM SPSS V25.
Development of the Species-Specific Model to Identify the Colonization Zones
Asaeda et al. (2020) proposed the total H2O2 concentration formed in plant tissues for a particular temperature (Temp) by the sum of H2O2 generated by metabolism (H2O2met), flow velocity (H2O2vel), and solar radiation (H2O2rad). If the value is between 15 and 20 µmol/gFW, then E. densa growth deteriorates.
For other species, empirical formulas obtained by experiments and field observation were introduced to H2O2 concentrations generated by each environmental component, solar radiation, H2O2rad (Temp), temperature inclement, H2O2rad(Temp), the basal level of the metabolism, the H2O2met (Temp) (Apel and Hirt, 2004), and the threshold level to deteriorate, H2O2cr.
In rivers flowing with moderate velocity, water is fully mixed. Therefore, the light attenuation coefficient is nearly uniform at all depths, and the light intensity is given by I0exp(−kz), where I0 is the light intensity just below the water surface, k(=0.083 cm−1) is the attenuation constant of light in water, and z is the canopy depth. The intensity of solar radiation, I0 (µmol/m2/s), and water temperature (°C) at the Eno and Saba rivers are empirically given as a function of month, month:
Flow velocity in a river channel “Vel” (cm/s) is estimated by the Manning’s equation, assuming the channel is sufficiently wide compared to the depth and is longitudinally uniform, such that:
where R is the hydraulic radius, approximately given by the depth H (cm), S is the channel bed slope, and n is the Manning’s roughness coefficient, where n is ∼0.090 in the river zones considered in the present study (personal information).
Results
Empirical Relationships of H2O2 Concentration With Abiotic Factors
Combined effects of temperature and light intensity on H2O2 formation in macrophyte tissues showed a species-specific response (Figure 1). The basal H2O2 concentrations were 4.6 µmol/gFW at 20°C for E. densa and E. nuttallii, and 3.0 µmol/gFW at 20°C for other species, respectively, after being exposed to dark conditions. The increment of H2O2 driven by the temperature change were −0.32 µmol/gFW/°C for E. densa (r = −0.985, p < 0.01), 0.39 µmol/gFW/°C for M. spicatum (r = 0.800, p < 0.05), 0.41 µmol/gFW/°C for C. demersum (r = 0.900, p < 0.01), 0.60 µmol/gFW/°C for P. crispuss (r = 0.974, p < 0.01), and 0.48 µmol/gFW/°C for E. nuttallii (r = 0.956, p < 0.01), respectively. H2O2 concentrations of different light intensity groups were plotted nearly in parallel, higher with higher light intensity groups (p < 0.05).
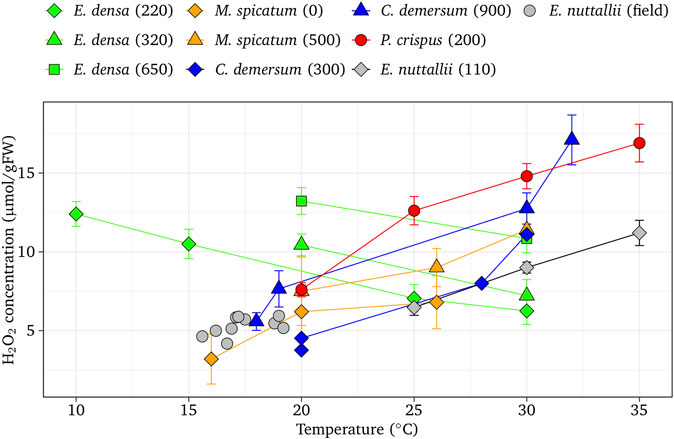
FIGURE 1. Effect of temperature on H2O2 concentration at different light intensities in native aquatic macrophytes (M. spicatum, C. demersum, and P. crispuss) and invasive species (E. densa and E. nuttallii). Vertical bars indicate the standard deviation. The values in parentheses are light intensities (µmol/m2/s).
Water flow velocity and light intensity had significant impacts on the H2O2 metabolism in macrophytes. The tissue H2O2 concentration linearly increased responding to increasing water flow velocity for all these species (Figure 2). The increasing rate of H2O2 concentration with respect to flow velocity showed no significant difference among species with the gradient due to the velocity of 0.09 H2O2/velocity (µmol/gFW/cm/s) (r = 0.921, p < 0.01 for E. densa, 0.878, p < 0.01 for E. nuttallii, r = 0.875, p < 0.01 for P. crispuss, r = 0.700, p < 0.01 for C. demersum and r = 0.957, p < 0.01 for M. spicatum). It was similar to the results of field samples, 0.072 H2O2/velocity (µmol/gFW/cm/s) as shown in the figure. No significant difference was obtained among the sampling seasons. For E. densa, H2O2 concentrations for different light intensity groups were plotted nearly in parallel, higher with higher light intensity groups (p < 0.01). The increments of H2O2 concentrations for the light-exposed samples with respect to the dark-adapted ones are shown in Figure 3. Experimental samples of E. densa had a similar increasing trend with field observation in H2O2 concentration.
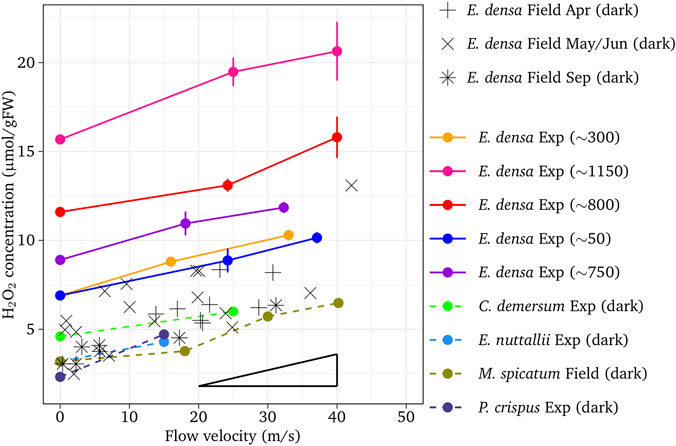
FIGURE 2. Effect of flow velocity on H2O2 concentration with different light intensities or different sampling time. Vertical bars indicate standard deviation. The triangle shows the average gradient. The values in the parentheses are light intensities (µmol/m2/s)
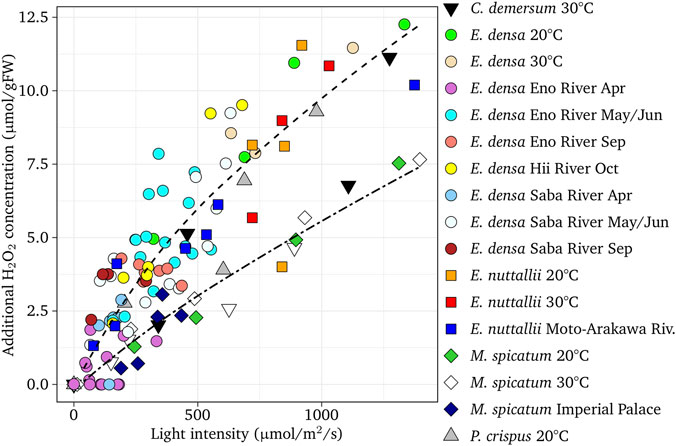
FIGURE 3. Additional H2O2 concentration of light-exposed tissues with respect to dark-adapted ones of different rivers and experiments as a function of the light intensity for different species. The regression curves, H2O2 = [light intensity−40]2/3/10 (upper dotted curve) and H2O2 = [light intensity−40]5/6/55 (lower dotted curve) are presented. Field samples of E. densa (Asaeda et al., 2020) are shown for comparison.
From the field data, Asaeda et al. (2020) derived the following relationship for E. densa:
Figure 3 indicates that a similar relationship is available for E. nuttallii and P. crispuss without a large error (r = 0.97, p < 0.01 for E. nuttallii and r = 0.99, p < 0.01, respectively). For M. spicatum and C. demersum, the increasing rate of H2O2 with respect to solar radiation was slightly lower, decreasing the effect of the solar radiation. Therefore, a different equation was derived for M. spicatum, and C. demersum (r = 0.98, p < 0.01 for M. spicatum, and r = 0.89, p < 0.01 for C. demersum, respectively).
The Threshold H2O2 Concentration for Growth Deterioration
Chl-a concentrations and SGR as functions of H2O2 concentrations at different flow velocities, water temperatures, and light intensities of E. densa are shown in Figure 4A. Regardless of environmental factors, both Chl-a concentrations and SGR decreased with increasing H2O2 concentrations (flow velocity r = −0.944, p < 0.01 for Chl-a and r = −0.964, p < 0.01 for SGR; temperature r = −0.945, p < 0.01 for Chl-a and r = −0.980, p < 0.01 for SGR; light r = −0.924, p < 0.01 for Chl-a and r = −0.965, p < 0.01 for SGR). Figure 4B presents the relationships of H2O2 and Chl-a concentrations for M. spicatum, C. demersum, E. nuttallii, and P. crispuss. Chl-a concentration decreased with the H2O2 concentration (r = −0.896, p < 0.01 for M. spicatum, r = −0.752, p < 0.01 for C. demersum, r = −0.497, p < 0.01 for E. nuttallii, and r = −0.963, p < 0.01 for P. crispuss), and was eliminated at approximately 16–20 µmol/gFW. In the field observation, tissue deterioration occurred when similar H2O2 concentrations continued for a few days.
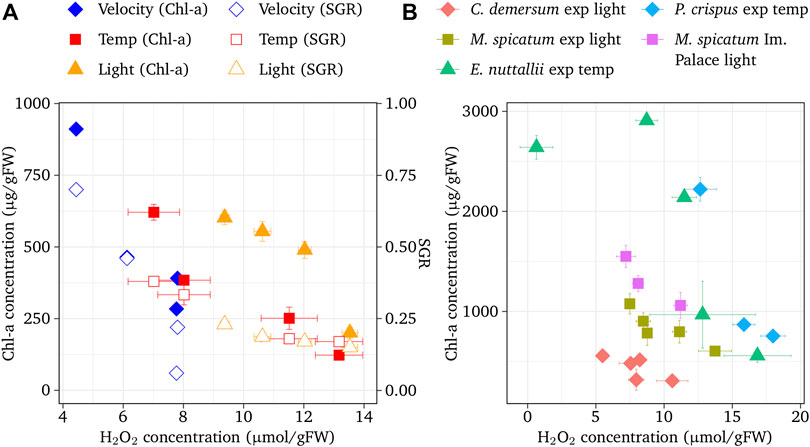
FIGURE 4. (A) Chlorophyll a concentration and shoot growth rate (SGR) of E. geriadensa with respect to H2O2 concentration. Velocity (Ellawala et al., 2011), others: the present experiment. Vertical bars indicate standard deviation. (B) Chlorophyll is a concentration of M. spicatum, C. demersum, E. nuttallii, and P. crispuss with respect to H2O2 concentration. Vertical bars indicate standard deviation.
Simulated Results
The Comparison With the Observed Data
Figure 5 shows the comparison between the observed H2O2 concentration and simulated H2O2 concentration for experimental and observed results. Satisfactory agreement between the simulated and observed values were found in the simulation (r = 0.798, p < 0.01 for E. densa, r = 0.700, r < 0.05 for E. nuttallii, r = 0.919, p < 0.01 for M. spicatum, r = 0.976, p < 0.01 for C. demersum, and r = 0.974, p < 0.05 P. spicatum).
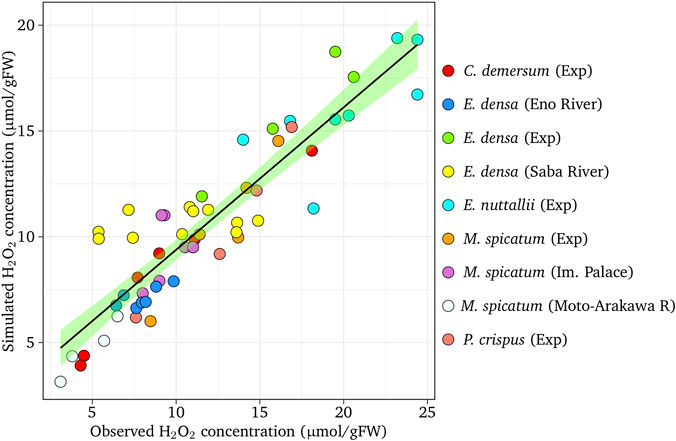
FIGURE 5. The comparison of simulated H2O2 concentration with observed H2O2 concentration. The dashed line indicates the perfect agreement. The shaded band (green) represents the 95% confidence interval on the fitted values.
The Depth-Wise Distribution of H2O2 Concentration of Different Species
The H2O2 concentration of E. densa was simulated for channel slopes of 1/300 at 10, 20, and 30°C, which were close to the condition of the observed reaches of the Eno and the Saba rivers in March, May/June, and October as well as August to September, respectively. Figure 6 shows the simulated results with respect to the depth, observed H2O2, and macrophyte biomass. The threshold H2O2 concentration was assumed as 16 µmol/gFW. The H2O2 concentration was high at the water surface and gradually decreased. With deeper depth, increasing velocity increases the H2O2 concentration. The decreasing or increasing trend with respect to depth depends on the combination of these two factors. The H2O2 concentration of the stagnant water is lower than the sloped channel, as H2O2 generated by the velocity is zero. In the case of E. densa, the H2O2 concentration is higher with lower temperature, and mostly above the threshold value at 10°C, indicating the colonization is limited. The observed H2O2 concentrations were plotted within 2 µmol/gFW from the simulated corresponding temperature line. All the biomass data were plotted in the depth where the H2O2 line of the corresponding temperature was below the threshold value. The simulated results agreed with the field sampling. The H2O2 concentration was simulated for M. spicatum; C. demersum, P. crispus, and E. nuttallii were compared to the observed H2O2 values and biomass in the field (Figures 7–9). Both the H2O2 concentration and the existing biomass range agreed well with observed data (H2O2 concentration: within 2.5 µmol/gFW, all positive biomass range was in the range where the H2O2 values were below the threshold). The H2O2 concentration of these species increases with increasing temperature. The H2O2 concentration is higher at the shallow zone; thus, the total H2O2 concentration exceeds the threshold value.
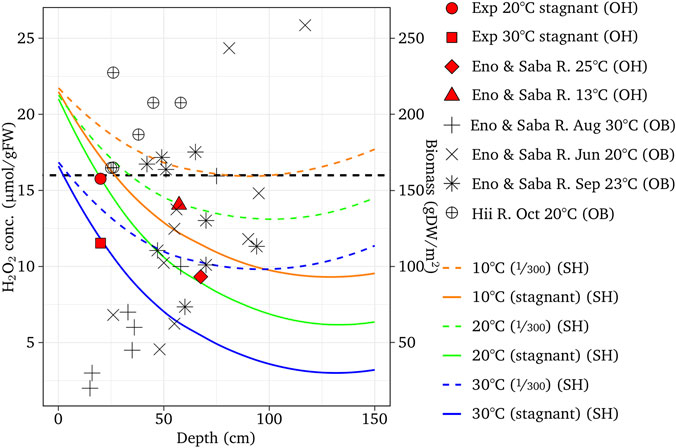
FIGURE 6. Simulated H2O2 concentration with respect to the river depth for the channel slopes of 1/300 or stagnant water condition, and different temperature, compared with the H2O2 concentration and biomass of experiments at the Eno and Saba rivers. ‘OH’, ‘OB’ and ‘SH’ designate observed H2O2, observed biomass, and simulated H2O2, respectively.
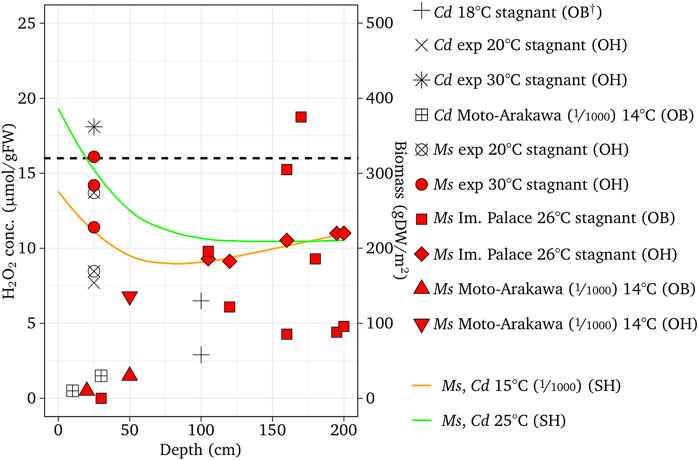
FIGURE 7. Simulated H2O2 concentrations with different temperatures compared with the observed results for M. spicatum (Ms in the legend) and C. demersum (Cd in the legend) compared with observed data. † Represents Fukuhara et al. (1997); ‘OB’, ‘SH’ and ‘SH’ designate observed biomass, observed H2O2 and simulated H2O2, respectively. The fractions in the parentheses are channel slopes.
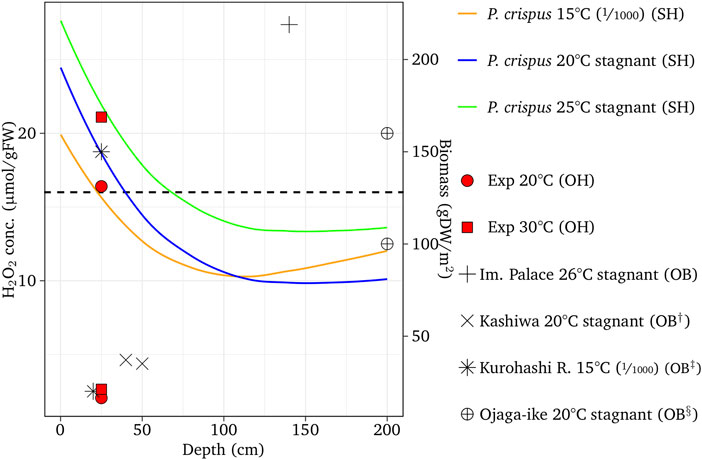
FIGURE 8. Simulated H2O2 concentrations with different temperatures compared with the observed results for P. crispus compared with observed data. ‘OH’, ‘SH’ and ‘OB’ designate observed H2O2, simulated H2O2, and observed biomass, respectively. †, ‡ and § designate Shinohara et al. (2014), Takahashi and Asaeda (2014), and Kunii (1984), respectively. The fractions in the parentheses are channel slopes.
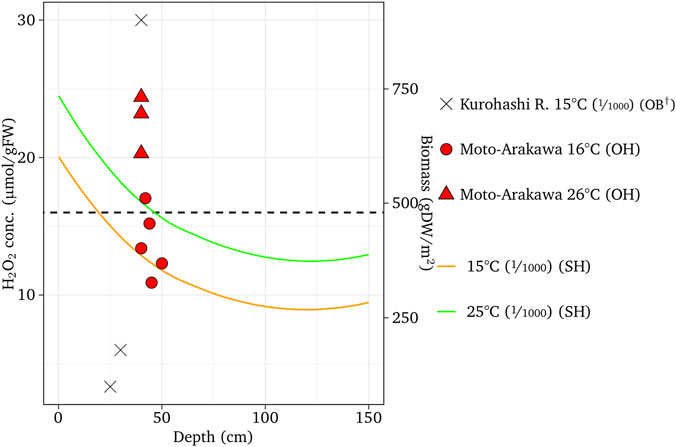
FIGURE 9. Simulated H2O2 concentrations with different temperatures compared with the observed results for E. nuttallii compared with observed data. † = Takahashi et al. (2014); ‘OH’ and ‘SH’ designate observed and simulated H2O2, respectively. The fractions in the parentheses are channel slopes.
The Composition of the H2O2 Component for Different Types of Rivers
Figure 10 presents the simulated results of H2O2 fractions generated by environmental conditions: temperature-dependent metabolism (H2O2met(Temp)), solar radiation (H2O2rad), velocity, H2O2vel, fora 0.4 m deep (E. densa and M. spicatum), and colonized and non-colonized rivers. A 5 year average of monthly temperatures was used for the Eno and the Saba rivers, where E. densa are colonized, and for the Arakawa River and the Tone River in the Tokyo metropolitan area, where no E. densa colonies were recorded while M. spicatum was colonized (MLIT, 2019). The former groups are slightly warmer than the latter. The total H2O2 concentration without a velocity component is available to estimate for stagnant water. At >1 m depth, the H2O2 fraction for the solar radiation was almost nil. The increment of H2O2 concentration due to increasing temperatures after spring has opposite trends between E. densa and M. spicatum; the H2O2 concentration decreased with E. densa and increased with M. spicatum. Temperature was the most effective component to differentiate the annual patterns of the total H2O2 concentration. The fraction of H2O2 due to solar radiation was higher for E. densa than for M. spicatum; thus, E. densa colonization was highly affected by solar radiation. For E. densa, the H2O2 concentration maintained higher than the threshold value until June in the colder group of rivers, but it becomes lower than the threshold from April/May in the warmer group. For M. spicatum, on the other hand, the total H2O2 concentration exceeded the threshold value from April in the warmer group while only in August in the colder group. In the stagnant water, the total H2O2 concentration of M. spicatum exceeded the threshold value in summer.
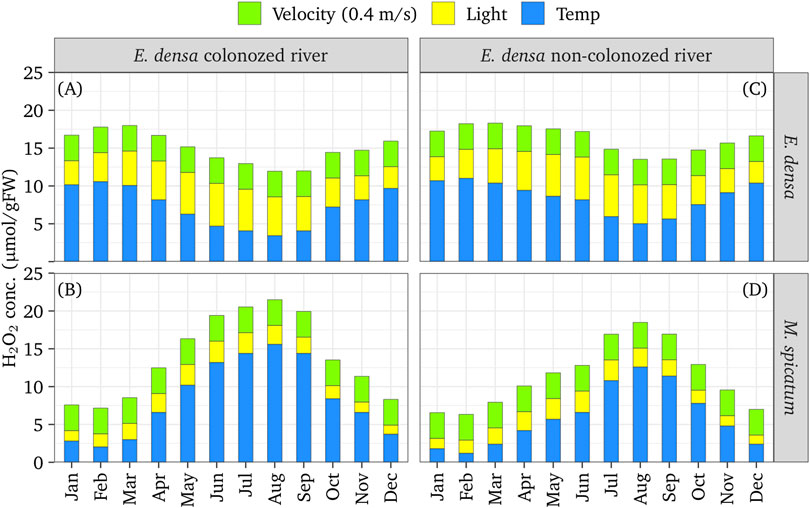
FIGURE 10. Simulated annual H2O2 component generated by each environmental component of a 0.4 m deep colonized [(A,C) for E. densa and M. spicatum] or non-colonized [(B,D) for E. densa and M. spicatum] rivers.
Discussion
Tissue H2O2 Concentration as Affected by Environmental Conditions
Previous studies have shown that H2O2 concentration of the plant tissues increases in unpreferable environmental conditions (Asaeda et al., 2020; Elsheery et al., 2020a; Elsheery et al., 2020b), and it is highly correlated with the intensity of a single environmental factor (Asaeda et al., 2017; Asaeda and Sanjaya, 2017; El-Sheery, 2017; Parveen et al., 2017; Chalanika De Silva and Asaeda, 2018). The present study elucidates that under a combination of different environmental factors, the total H2O2 concentration is provided as the sum of H2O2 generated by individual factors and the amount generated by metabolism (Apel and Hirt, 2004). In addition, the relationship between H2O2 concentration and the intensity of each environmental factor does not vary much between seasons and phenological stages of the plant (Asaeda et al., 2020). Therefore, the H2O2 concentration is considered an indicator of the degree of the unpreferable condition. The Chl-a concentration and the growth parameter decreased with increasing intensity of the total H2O2 concentration (Coleman et al., 1989; French and Moore, 2003; Boustany et al., 2010). Interestingly, when the tissue H2O2 concentration exceeded 16–20 µmol/gFW, the plants became brownish and deteriorated. Therefore, the environmental conditions reflected by H2O2 concentrations below this threshold allows macrophytes to form a large and healthy colony. This system can be applied to elucidate the growth area of macrophyte species, by formulating the H2O2 concentrations and abiotic conditions in the environment.
Environmental Conditions Influencing Macrophyte Colonization in Japanese Rivers
In Japanese rivers, the water quality is relatively good and there is no salinity in the midstream (Luo et al., 2011). Organic matter accumulates on the bottom in stagnant zones, which creates an anoxic zone in the sediment layer. There are such areas in the lowland zones; however, anoxia of the bottom sediment contributed only ∼3 µmol/gFW of H2O2 (Parveen et al., 2017). Chalanika De Silva and Asaeda (2018) showed that the H2O2 concentration differs between mono- and mixed-cultures of species in stagnant water, indicating the effect of species competition. However, the difference was only ∼2 µmol/gFW. In field sampling, Japanese native species, P. crispuss and C. demersum, were often found in thick E. densa colonies due to the reduction of flow velocity inside the colony (20 cm/s inside compared to 50 cm/s outside, according to our own observation). This indicates that the increment of H2O2 concentration due to competition is less than the reduction of velocity-induced H2O2 (∼3 µmol/gFW). In this study, the H2O2 concentrations attributed to water temperature, high solar radiation, and high flow velocities of natural conditions are ∼10, ∼10, and ∼5 µmol/gFW, respectively. Therefore, water temperature, solar radiation and flow velocity are the major dominant environmental factors determining the colonization patterns of macrophytes in the midstream of Japanese rivers.
Species-Specific Trait of H2O2 Concentration in Response to Environmental Conditions
Laboratory and field experiments showed a typical species-specific relationship between H2O2 concentration and the environmental factors of temperature, flow velocity, and solar radiation. With increasing flow velocity, the similar increasing trend of H2O2 concentration was obtained for all tested species. Although flow velocity generates a large amount of H2O2, it does not affect the dominance of a particular species. High solar radiation intensively generates H2O2 (Asada, 2006). Specifically, the H2O2 concentrations of E. densa and E. nuttallii were ∼10 µmol/gFW under the daily highest solar radiation, which were much higher than those of Japanese native species, M. spicatum and C. demersum, which were ∼6 µmol/gFW. This impacts the ability of E. densa to colonize in the shallow zone, where the solar radiation is high; thus, E. densa was found to colonize in relatively deep zones (<30 cm deep). Japanese native species were, on the other hand, often found at shoreline or close to the water surface. There was an opposite trend in H2O2 concentrations for water temperature between E. densa and other species. With E. densa, H2O2 concentration decreased with increasing temperature, while major Japanese native species, M. spicatum, C. demersum, and P. spicatum as well as another invasive species, E. nuttallii, showed an increasing trend of H2O2 concentration with temperature. The different trends between Japanese native species and E. densa are reflected to their phenology and colonization area.
Possible Reason for the Overproduction of E. densa in Japanese Rivers
Low water temperature increases E. densa H2O2 concentration. In rivers where E. densa colonized overwhelmingly, water temperature decreases below 8°C in winter. However, even at that time, H2O2 concentration remains below the threshold value at around 1 m deep in stagnant water. Small patchy colonies were found in the upstream of weirs. With increasing temperatures in spring, they started to grow and form a large summer colony, expanding to a shallow zone in the downstream. The channels were originally covered with gravel bed; the bed morphology easily changed under high flow and pools disappeared. However, river rehabilitation for the flood control has been intensively conducted in the last five decades. The shallow zone of the channels was excavated to deepen the channel, and E. densa can now colonize with low H2O2 concentration. Weirs were constructed frequently, which created deep stagnant water in the upstream. Thus, the H2O2 concentration of E. densa due to velocity and solar radiation may decrease. Gravel mining was conducted, substantially reducing the amount of gravel in the river channel, and there is no longer any sediment transport even at flood time (Asaeda and Sanjaya, 2017). Thus, the modified river morphology does not change even during floods. The artificially created deep zone became a trigger for the overproduction of E. densa in the river channel. In the last three decades, river water temperature has significantly increased due to global warming at approximately 0.1°C/year, often reaching 30°C, particularly in western Japanese rivers (Ministry of Environment, 2013). It seems difficult for Japanese native species and E. nuttallii to grow in these rivers. Particularly, E. densa and E. nuttallii are closely related species and came to Japan at nearly the same time. However, the overwhelming colonization of E. densa and the limitations of E. nuttallii seem to be attributed to the different temperature traits of these species. Local people emphasize the recent reduction of flow rate (personal communication). During the day, in addition to high solar radiation, water temperature is approximately 2°C higher than at night, particularly under a low summer flow rate. Thus, during this time, both solar radiation and temperature increases the H2O2 concentration for Japanese native species. However, their effects are reciprocal and do not affect E. densa very much. It is likely another reason for the overwhelming presence of E. densa.
Conclusion
Under unpreferable environmental conditions, H2O2 concentrations increase in plant tissues and reflect the macrophyte condition fairly accurately. Potentially, this could be a good indicator of submerged macrophyte colonization. This approach will save time by not requiring casual observations and biomass monitoring of macrophytes in ecosystem monitoring. The experimental and field observations indicated a clear positive relationship between the level of unpreferable conditions and H2O2 concentrations, regardless of abiotic factors. The total H2O2 concentration is provided by the sum of H2O2 generated by each environmental factor, and <16–20 µmol/gFW is required for colonization. The relationships of H2O2 concentrations and the contribution of each abiotic factor were obtained for invasive species (E. densa and E. nuttallii) and three major Japanese native species (M. spicatum, C. demersum, and P. crispuss). The system was applied to develop a mathematical model to simulate the colonization area of these species. The tissue H2O2 concentration decreases with increasing temperature for E. densa and increases for other species, including native species. Therefore, native species grow intensively in spring; however, they often deteriorate in summer. For E. densa, on the other hand, H2O2 concentration decreases with high water temperatures in summer, allowing intensive growth. High solar radiation increases the H2O2 concentration, deteriorating the plant. Although the H2O2 concentration of E. densa increases with low water temperatures in winter, it can survive in deep water with low H2O2 concentration due to solar radiation. Currently, river rehabilitation has created a deep zone in the channel, which has supported the growth and spread of E. densa.
Data Availability Statement
The datasets generated for this study are available on request to the corresponding author.
Author Contributions
TA: contributed the conceptualization and field work, and wrote the manuscript together with other members; MR: contributed to field sampling, laboratory and data analyses, and helped write the manuscript; JS: reviewed and commented on the manuscript.
Funding
This work was financially supported by the Grant-in-Aid for Scientific Research (B) (19H02245) and Fund for the Promotion of Joint International Research (18KK0116) of Japan Society for the Promotion of Science (JSPS).
Conflict of Interest
Author TA was employed by Hydro Technology Institute of Japan. The remaining authors declare that the research was conducted in the absence of any commercial or financial relationships that could be construed as a potential conflict of interest.
The handling editor is currently organizing a Research Topic with one of the authors JS, and confirms the absence of any other collaboration.
Acknowledgments
We thank Keerthi Atapaththu, Abner Barnuevo, Lekkala Vamshi Krisha, De Silva Chandani Chalanika, Li-Ping Xia, Akihiko Matsuo, and Viraj Ranawaka for their field sampling and experiments.
References
Apel, K., and Hirt, H. (2004). Reactive oxygen species: metabolism, oxidative stress, and signal transduction. Annu. Rev. Plant Biol. 55, 373–399. doi:10.1146/annurev.arplant.55.031903.141701
Asada, K. (2006). Production and scavenging of reactive oxygen species in chloroplasts and their functions. Plant Physiol. 141, 391. doi:10.1104/pp.106.082040
Asaeda, T., Rashid, M. H., Dong, M., and Uddin, F. (2013). “The most effective factors responsible for increase in the vegetation coverage of river channels,” in Proceedings of the 35th IAHR Biennial Congress, Chengdu, China, September 8–13, 2013, 17.
Asaeda, T., and Sanjaya, K. (2017). The effect of the shortage of gravel sediment in midstream river channels on riparian vegetation cover. River Res. Appl. 33, 1107–1118. doi:10.1002/rra.3166
Asaeda, T., Sanjaya, K., and Kaneko, Y. (2017). Effects of mechanical stressors caused by mean flow and turbulence on aquatic plants with different morphologies. Ecohydrology 10, e1873. doi:10.1002/eco.1873
Asaeda, T., Senavirathna, M. D. H., and Vamsi Krishna, L. (2020). Evaluation of habitat preferences of invasive macrophyte Egeria densa in different channel slopes using hydrogen peroxide as an indicator. Front. Plant. Sci. 11, 422. doi:10.3389/fpls.2020.00422
Asaeda, T., Senavirathna, M. D. H., Xia, L. P., and Barnuevo, A. (2018). Application of hydrogen peroxide as an environmental stress indicator for vegetation management. Engineering 4, 610–616. doi:10.1016/j.eng.2018.09.001
Atapaththu, K. S., Miyagi, A., Atsuzawa, K., Kaneko, Y., Kawai-Yamada, M., and Asaeda, T. (2015). Effects of water turbulence on variations in cell ultrastructure and metabolism of amino acids in the submersed macrophyte, Elodea nuttallii (Planch.) H. St. John. Plant Biol. (Stuttg.) 17, 997–1004. doi:10.1111/plb.12346
Atapaththu, K. S. S., and Asaeda, T. (2015). Growth and stress responses of Nuttall’s waterweed Elodea nuttallii (Planch) St. John to water movements. Hydrobiologia 747, 217–233. doi:10.1007/s10750-014-2141-9
Barko, J. W., Gunnison, D., and Carpenter, S. R. (1991). Sediment interactions with submersed macrophyte growth and community dynamics. Aquat. Bot. 41, 41–65. doi:10.1016/0304-3770(91)90038-7
Bates, A. E., Mckelvie, C. M., Sorte, C. J., Morley, S. A., Jones, N. A., Mondon, J. A., et al. (2013). Geographical range, heat tolerance and invasion success in aquatic species. Proc. Biol. Sci. 280, 20131958. doi:10.1098/rspb.2013.1958
Boano, F., Harvey, J. W., Marion, A., Packman, A. I., Revelli, R., Ridolfi, L., et al. (2014). Hyporheic flow and transport processes: mechanisms, models, and biogeochemical implications. Rev. Geophys. 52, 603–679. doi:10.1002/2012RG000417
Boustany, R. G., Michot, T. C., and Moss, R. F. (2010). Effects of salinity and light on biomass and growth of Vallisneria americana from Lower St. Johns River, FL, USA. Wetl. Ecol. Manag. 18, 203–217. doi:10.1007/s11273-009-9160-8
Chalanika De Silva, H. C., and Asaeda, T. (2018). Stress response and tolerance of the submerged macrophyte Elodea nuttallii (Planch) St. John to heat stress: a comparative study of shock heat stress and gradual heat stress. Plant Biosyst. 152, 787–794. doi:10.1080/11263504.2017.1338628
Choudhury, F. K., Rivero, R. M., Blumwald, E., and Mittler, R. (2017). Reactive oxygen species, abiotic stress and stress combination. Plant J. 90, 856–867. doi:10.1111/tpj.13299
Coleman, J. S., Mooney, H. A., and Gorham, J. N. (1989). Effects of multiple stresses on radish growth and resource allocation: I. Responses of wild radish plants to a combination of SO2 exposure and decreasing nitrate availability. Oecologia 81, 124–131. doi:10.1007/BF00377021
Das, K., and Roychoudhury, A. (2014). Reactive oxygen species (ROS) and response of antioxidants as ROS-scavengers during environmental stress in plants. Front. Environ. Sci. 2, 53. doi:10.3389/fenvs.2014.00053
Dumont, S., and Rivoal, J. (2019). Consequences of oxidative stress on plant glycolytic and respiratory metabolism. Front. Plant Sci. 10, 166. doi:10.3389/fpls.2019.00166
El-Sheery, I. (2017). Effectiveness of potassium silicate in suppression white rot disease and enhancement physiological resistance of onion plants, and its role on the soil microbial community. Middle East J. 6 (2), 376–394. doi:10.1011/s11738-008-0182-x
Ellawala, C., Kankanamge Asaeda, T., and Kawamura, K. (2011). The effect of flow turbulence on plant growth and several growth regulators in Egeria densa Planchon. Flora 206, 1085–1091. doi:10.1016/j.flora.2011.07.014
Elsheery, N. I., Helaly, M. N., El-Hoseiny, H. M., and Alam-Eldein, S. M. (2020a). Zinc oxide and silicone nanoparticles to improve the resistance mechanism and annual productivity of salt-stressed mango trees. Agronomy 10 (4), 558. doi:10.3390/agronomy10040558
Elsheery, N. I., Helaly, M. N., Omar, S. A., John, S. V., Zabochnicka-Swiątek, M., Kalaji, H. M., et al. (2020b). Physiological and molecular mechanisms of salinity tolerance in grafted cucumber. S. Afr. J. Bot. 130, 90–102. doi:10.1016/j.sajb.2019.12.014
French, G. T., and Moore, K. A. (2003). Interactive effects of light and salinity stress on the growth, reproduction, and photosynthetic capabilities of Vallisneria americana (wild celery). Estuaries 26, 1255. doi:10.1007/BF02803628
Fukuhara, H., Tanaka, T., and Izumi, M. (1997). Growth and turion formation of Ceratophyllum demersum in a shallow lake in Japan. Jpn. J. Limnol. 58, 335–347.
Hauer, F. R., Locke, H., Dreitz, V. J., Hebblewhite, M., Lowe, W. H., Muhlfeld, C. C., et al. (2016). Gravel-bed river floodplains are the ecological nexus of glaciated mountain landscapes. Sci. Adv. 2, e1600026. doi:10.1126/sciadv.1600026
Helaly, M. N., El-Hoseiny, H., El-Sheery, N. I., Rastogi, A., and Kalaji, H. M. (2017). Regulation and physiological role of silicon in alleviating drought stress of mango. Plant Physiol. Biochem. 118, 31–44. doi:10.1016/j.plaphy.2017.05.021
Kadono, Y. (2004). Alien aquatic plants naturalized in Japan: history and present status. Glob. Environ. Res. 8, 163–169.
Kawanabe, H. (1970). Social behaviour and production of ayu-fish in the River Ukawa between 1955 and 1969, with reference to the stability of its territoriality. Jap. J. Ecol. 20, 144–151 (in Japanese). doi:10.18960/seitai.20.4_144
Kunii, H. (1982). Life cycle and growth of Potamogeton crispus L. in a shallow pond Ojaga-Ike. Bot. Mag. (Tokyo) 95, 109–124. doi:10.1007/BF02488578
Kunii, H. (1984). Seasonal growth and profile structure development of Elodea nuttallii (Planch.) St. John in pond Ojaga-Ike, Japan. Aquat. Bot. 18, 239–247. doi:10.1016/0304-3770(84)90065-2
Lougheed, V. L., Crosbie, B., and Chow-Fraser, P. (2001). Primary determinants of macrophyte community structure in 62 marshes across the Great Lakes basin: latitude, land use, and water quality effects. Can. J. Fish. Aquat. Sci. 58, 1603–1612. doi:10.1139/cjfas-58-8-1603
Luo, P., He, B., Takara, K., Razafindrabe, B. H., Nover, D., and Yamashiki, Y. (2011). Spatiotemporal trend analysis of recent river water quality conditions in Japan. J. Environ. Monit. 13, 2819–2829. doi:10.1039/c1em10339c
Madsen, J. D., Chambers, P. A., James, W. F., Koch, E. W., and Westlake, D. F. (2001). The interaction between water movement, sediment dynamics and submersed macrophytes. Hydrobiologia 444, 71–84. doi:10.1023/A:1017520800568
Ministry of Environment (2013). Report on the effect of the climate change on the water quality. Tokyo, Japan: Ministry of Environment, 68.
MLIT (2019). Ministry of land infrastructure transportation and tourism in Japan, river environmental database. Available at: http://mizukoku.nilim.go.jp/ksnkankyo/ (Accessed October 2019).
Naser, H. M., Hanan, E. H., Elsheery, N. I., and Kalaji, H. M. (2016). Effect of biofertilizers and putrescine amine on the physiological features and productivity of date palm (Phoenix dactylifera, L.) grown on reclaimed-salinized soil. Trees (Berl.) 30 (4), 1149–1161. doi:10.1007/s00468-016-1353-1
O’Hare, M. T., Baattrup-Pedersen, A., Baumgarte, I., Freeman, A., Gunn, I. D., Lázár, A. N., et al. (2018). Responses of aquatic plants to eutrophication in rivers: a revised conceptual model. Front. Plant Sci. 9, 451. doi:10.3389/fpls.2018.00451
Omar, S. A., Elsheery, N. I., Kalaji, H. M., Xu, Z. F., Song-Quan, S., Carpentier, R., et al. (2012). Dehydroascorbate reductase and glutathione reductase play an important role in scavenging hydrogen peroxide during natural and artificial dehydration of Jatropha curcas seeds. J. Plant Biol. 55 (6), 469–480. doi:10.1007/s12374-012-0276-7
Pandit, A. K. (Editor) (2002). Natural resources of western Himalaya. New Delhi, India: Valley Book House.
Parveen, M., Asaeda, T., and Rashid, M. H. (2017). Hydrogen sulfide induced growth, photosynthesis and biochemical responses in three submerged macrophytes. Flora 230, 1–11. doi:10.1016/j.flora.2017.03.005
Pip, E. (1989). Water temperature and freshwater macrophyte distribution. Aquat. Bot. 34, 367–373. doi:10.1016/0304-3770(89)90079-X
Riis, T., Olesen, B., Clayton, J. S., Lambertini, C., Brix, H., and Sorrell, B. K. (2012). Growth and morphology in relation to temperature and light availability during the establishment of three invasive aquatic plant species. Aquat. Bot. 102, 56–64. doi:10.1016/j.aquabot.2012.05.002
Satterfield, C. N., and Bonnell, A. H. (1955). Interferences in titanium sulfate method for hydrogen peroxide. Anal. Chem. 27, 1174–1175. doi:10.1021/ac60103a042
Schoelynck, J., Bal, K., Verschoren, V., Penning, E., Struyf, E., Bouma, T., et al. (2014). Different morphology of Nuphar lutea in two contrasting aquatic environments and its effect on ecosystem engineering. Earth Surf. Proces. Landf. 39, 2100–2108. doi:10.1002/esp.3607
Schoelynck, J., De Groote, T., Bal, K., Vandenbruwaene, W., Meire, P., and Temmerman, S. (2012). Self-organised patchiness and scale-dependent bio-geomorphic feedbacks in aquatic river vegetation. Ecography 35, 760–768. doi:10.1111/j.1600-0587.2011.07177.x
Sharma, P., Jha, A. B., Dubey, R. S., and Pessarakli, M. (2012). Reactive oxygen species, oxidative damage, and antioxidative defense mechanism in plants under stressful conditions. J. Bot. 26, 2012. doi:10.1155/2012/217037
Shinohara, R., Asaeda, T., and Isobe, M. (2014). Effects of phytoplankton on the distribution of submerged macrophytes in a small canal. Landsc. Ecol. Eng. 10, 115–121. doi:10.1007/s11355-013-0227-6
Smirnoff, N., and Arnaud, D. (2019). Hydrogen peroxide metabolism and functions in plants. New Phytol. 221, 1197–1214. doi:10.1111/nph.15488
Suzuki, N., Rivero, R. M., Shulaev, V., Blumwald, E., and Mittler, R. (2014). Abiotic and biotic stress combinations. New Phytol. 203, 32–43. doi:10.1111/nph.12797
Takahashi, K., and Asaeda, T. (2014). The effect of spring water on the growth of a submerged macrophyte Egeria densa. Landsc. Ecol. Eng. 10, 99–107. doi:10.1007/s11355-012-0191-6
Tanida, K. (1984). Larval microlocation on stone faces of Hydropsyche species (Insecta: Trichoptera), with a general consideration on the relation of systematic groupings to the ecological and geographical distribution among the Japanese Hydropsyche species. Physiol. Ecol. Jpn. 21, 115–130.
Weerakoon, H. P. A. T., Atapaththu, K. S. S., and Asanthi, H. B. (2018). Toxicity evaluation and environmental risk assessment of 2-methyl-4-chlorophenoxy acetic acid (MCPA) on non-target aquatic macrophyte Hydrilla verticillata. Environ. Sci. Pollut. Res. Int. 25, 30463–30474. doi:10.1007/s11356-018-3013-z
Wellburn, A. R. (1994). The spectral determination of chlorophylls a and b, as well as total carotenoids, using various solvents with spectrophotometers of different resolution. J. Plant Physiol. 144, 307–313. doi:10.1016/S0176-1617(11)81192-2
Zaman, T., and Asaeda, T. (2013). Effects of NH4–N concentrations and gradient redox level on growth and allied biochemical parameters of Elodea nuttallii (Planch.). Flora 208, 211–219. doi:10.1016/j.flora.2013.02.009
Zerebecki, R. A., and Sorte, C. J. (2011). Temperature tolerance and stress proteins as mechanisms of invasive species success. PLoS One 6, e14806. doi:10.1371/journal.pone.0014806
Keywords: alien macrophytes, hydrogen peroxide, reactive oxygen species, stress indicator, vegetation management
Citation: Asaeda T, Rashid MH and Schoelynck J (2021) Tissue Hydrogen Peroxide Concentration Can Explain the Invasiveness of Aquatic Macrophytes: A Modeling Perspective. Front. Environ. Sci. 8:516301. doi: 10.3389/fenvs.2020.516301
Received: 30 November 2019; Accepted: 18 December 2020;
Published: 29 January 2021.
Edited by:
Dana M. Infante, Michigan State University, United StatesReviewed by:
Teresa Ferreira, University of Lisbon, PortugalNabil I. Elsheery, Tanta University, Egypt
Copyright © 2021 Asaeda, Rashid and Schoelynck. This is an open-access article distributed under the terms of the Creative Commons Attribution License (CC BY). The use, distribution or reproduction in other forums is permitted, provided the original author(s) and the copyright owner(s) are credited and that the original publication in this journal is cited, in accordance with accepted academic practice. No use, distribution or reproduction is permitted which does not comply with these terms.
*Correspondence: Takashi Asaeda, YXNhZWRhQG1haWwuc2FpdGFtYS11LmFjLmpw
 Takashi Asaeda
 Md Harun Rashid
 Jonas Schoelynck