 Karine Phalyvong1,2
 Yann Sivry1*Hélène Pauwels2
 Alexandre Gélabert1Mickaël Tharaud1Guillaume Wille2Xavier Bourrat2James F. Ranville3
 Marc F. Benedetti1
- 1Université de Paris, Institut de physique du globe de Paris, CNRS, Paris, France
- 2BRGM, Orleans, France
- 3Colorado School of Mines, Golden, CO, United States
Motivation for detecting engineered nanoparticles (ENPs) in the environment comes from a need to understand fate and behavior of these materials in natural matrices. The difficulty lies in the low expected ENP particle number concentration (PNC) and the presence of a large and variable background concentration of natural NPs. We report the PNCs and characteristics of cerium-bearing nanoparticles (Ce-NPs) and titanium-bearing nanoparticles (Ti-NPs) in an aquatic matrix (the Seine River and three of its tributaries) with the use of single particle ICP-MS (spICPMS) and electron microscopy (FEG-SEM). Ce-bearing and Ti-bearing particles were observed in suspended particulate matter collected onto 0.2 μm and 1 kDa filters, using FEG-SEM imaging. At Marnay-sur-Seine, the upstream point, PNCs for Ce-NPs and Ti-NPs were 0.47 ± 0.07 × 10⁶ and 1.35 ± 0.17 × 10⁶ particles as measured by spICPMS. The maximum PNC for both Ce-NPs and Ti-NPs, 1.59 ± 0.10 × 10⁶ particles mL−1 and 5.89 ± 0.10 × 10⁶ particles mL−1, respectively, were found in the Marne River, a major tributary to the Seine. It was shown that downstream of each confluence, an increase in the PNC of the Seine is observed, suggesting a significant contribution of the different tributaries. Mass balance of particles flows and elemental ratios of Ce/La showed that in the Marne and the Oise River, a contribution of natural CeO2 NPs exists. The anthropogenic contribution in TiO2 ENPs for the Marne River was further assessed with Ti/Al, Ti/V, and Ti/Y elemental ratios. Near constant element ratios in the Seine below the Orge River and Paris city suggest neither contribute significantly to Ce or Ti NP concentrations. The study provides further investigation of the strengths and limitations of the application of spICPMS to natural samples and contributes data to the currently highly-limited dataset on natural NP backgrounds in rivers, information that is key to assessing the potential for quantifying the input of ENPs to surface waters. Of the total mass of Ce and Ti, 83 and 90%, respectively, could be detected as particles by spICPMS.
Introduction
Quantifying engineered nanoparticles (ENPs) at relevant analytical concentrations is the key step to assess the fate and behavior of these particles in the environment. Numerous nanotoxicological studies have shown that ENPs can be acutely toxic (Navarro et al., 2008; Kahru and Dubourguier, 2010). However, nearly all toxicological studies utilize concentrations higher than that expected in the environment. Predicted environmental concentrations (PECs), obtained by materials flow analysis, are at ppb or ppt levels (Gottschalk et al., 2013). Even though PECs for most ENPs are low, the flows in the environment are significant (tons per year). For instance, titanium dioxide NPs (TiO2NPs) have been modeled to have a flow from the production, manufacturing and consumption sector to sewage treatment plants of 1,586 tons per year in the United States (Gottschalk et al., 2009). These high flows are mostly due to the important production of ENPs, which keeps increasing over the years because of the industries that incorporate NPs to enhance their products' properties.
While assessing ENP concentrations is the primary driver of research in this area, natural NPs are an important component of earth systems (Hochella et al., 2019). Method development that advances our ability to examine these materials are also useful for better understanding biogeochemical cycles that involve NPs. Quantifying ENPs that exist among natural phases, especially natural NPs, requires analytical tools suitable to the quantification and characterization of NPs in these samples. The use of ICP-MS in single particle counting mode (spICPMS) is one of the most useful and powerful tools for the detection and the characterization of NPs in complex matrices. The theory of spICPMS has been widely described for size analysis of colloids (Degueldre and Favarger, 2003; Degueldre et al., 2006) and more recently for NPs (Laborda et al., 2011; Pace et al., 2011; Mitrano et al., 2012). This technique provides the mass of NP-associated elements, from which a size distribution can be computed, given assumptions about NP shape, composition, and density. Additionally, spICP-MS provides the particle number concentration (PNC) (Pace et al., 2011, 2012; Mitrano et al., 2012; Laborda et al., 2013). These two parameters (i.e., size distribution and PNC) are useful to characterize NPs in environmental matrices. While we report the spICPMS method as providing data on ceria nanoparticles (CeO2NPs) and titanium dioxide nanoparticles (TiO2NPs), the authors recognize that spICPMS does not give direct information on form. Individual NPs, heteroaggregates of NPs with suspended sediments, and suspended sediments containing minor amounts of Ce or Ti cannot be differentiated by the spICPMS method alone. Thus, the reporting of size is in order to follow convention and does not necessarily represent the size of the overall particle with which the Ce or Ti is associated.
The spICPMS technique has been recently applied to environmental samples such as surface waters for the detection of TiO2NPs potentially released from sunscreens (Gondikas et al., 2014; Reed et al., 2017), or to decipher the AgNPs flow according to the land use (Wang et al., 2020). In drinking waters, spICPMS was successfully used to examine the removal of ENPs such as ceria NPs (CeO2NPs) or AgNPs (Donovan et al., 2016a,b; Peters et al., 2018). Biological tissues have been examined by spICP-MS including foods like chicken and beef (Gray et al., 2013; Loeschner et al., 2013; Peters et al., 2014) as well as rice and tomato plants (Dan et al., 2015; Deng et al., 2017) for the study of TiO2 NPs, AgNPs, and AuNPs.
The complexity of these matrices makes the characterization of NPs very challenging, which is why appropriate methods are required.
Ceria nanoparticles (CeO2NPs) and titanium dioxide nanoparticles (TiO2NPs) have beneficial properties (Serpone et al., 2007; Lima et al., 2009; Virkutyte et al., 2012). CeO2 NPs are used as a fuel additive in cars and as an automobile catalyzer (Gómez-Rivera et al., 2012) because they possess a low redox potential (Van Hoecke et al., 2009) and a high oxygen storage capacity (Imagawa et al., 2011; Zhang et al., 2011). Regarding TiO2NPs, they can be anticorrosive, stable in solution and photocatalytic (Hashimoto et al., 2005) so they are incorporated into paints, sunscreens and cosmetics. Engineered TiO2NPs are often coated with a layer of alumina, with the aim of inhibiting their photocatalytic properties (Serpone et al., 2007; Virkutyte et al., 2012). They are some of the most studied NPs because they are wide-spread in the world (Keller and Lazareva, 2014). For example, mass flow modeling (using the highest estimate) predicts that 89 and 4,055 tons per year CeO2NPs and TiO2NPs are released into European River waters.
Relatively few studies have examined TiO2NPs in aquatic systems. TiO2NPs in a Danube recreational lake was examined over a year period and elevated summer levels (1.7 × 10⁴ particles mL−1) may indicate release of these NPs from sunscreens (Gondikas et al., 2014). In a similar study by Reed et al. (2017) Ti-containing particles were elevated during bathing hours in a stream that is used for recreation, with sediment resuspension by bathers being a likely cause. Additionally, Westerhoff et al. (2011) have indicated the presence of TiO2 NPs between 4 and 30 nm in diameter in WWTP effluents that are particularly released into lakes, rivers, and streams. Particle characterization of surface waters by spICP-MS was recently performed in our group for samples of the Loire River around two sites of interest (wastewater treatment plant outlet and an outdoor activity center) (Phalyvong et al., 2020).
In this previous work, the studied CeO2NPs in river water were shown to be potentially insoluble and probably aggregated with sizes higher than 100 nm. In addition to TiO2, ZnO, and CeO2NPs aggregates were also shown to be stabilized at 300 nm with the occurrence of NOM in mesocosm freshwater (Keller et al., 2010) and natural surface waters (Peters et al., 2018). In another study, NOM stabilized CeO2NPs (from 2.2 mgC L−1 in an algal medium) and prevented the formation of larger aggregation of the NPs (>1 mm; Van Hoecke et al., 2011; Oriekhova and Stoll, 2019). Moreover, CeO2NPs are supposed to be insoluble at pH higher than 7 (Dahle et al., 2015).
The objective of the study presented herein is three-fold. First the results of the study will contribute to the very few studies conducted on NP concentrations in surface waters. Specifically, the study applies the spICPMS technique to the detection and quantification of CeO2NPs and TiO2NPs in the Seine River, France, one of the major rivers of Europe that is impacted by both agricultural and industrial activities. Secondly, the study investigates the spatial variability around a major capital (Paris) by assessing the possible contribution of both the city and three different tributaries. Finally, it evaluates the ability of some tools such as the elemental ratios of Ce/La and of Ti/Al, to discriminate the origin (natural or anthropogenic) of these NPs. Both Ce and La are known to exist in a relatively fixed ratio in suspended sediments and changes to this ratio may indicate anthropogenic contributions of Ce. Similarly, release of engineered TiO2 could perturb its ratio to naturally-occuring elements such as Al.
Materials and Methods
Field Settings
The study area is the Seine River in the vicinity of Paris, France, and includes the confluence with one minor (Orge River) and two major (Marne River, Oise Rivers) tributaries. The Seine is one of the longest rivers in Europe (780 km) flowing from the “Plateau de Langres” in the east of France to the English Channel. The Seine basin mainly drains sedimentary rocks, with the predominant rock types being 78% and 15% carbonates and silicates, respectively (Roy et al., 1999). Extensive farming and natural vegetation (forest) dominate most of the Seine River basin except near Paris city, where industrial and urban activities provide an important contribution to land use.
Sampling of the Seine River and three of its tributaries (Figure 1) was carried out on May 11th, 2015 during a high water level in order to optimize the chances to observe particles leached from surface runoff. Seven sampling sites on the Seine River (from SR1 to SR7) and three tributaries (TR1 for the Orge River, TR2 for the Marne River and TR3 for the Oise River) were selected for this field investigation. Several moderate water inputs to the Seine River exist between SR1 and TR1 but were not sampled in this study. Approximately one liter of water was collected per site for analysis by spICPMS and the FEG-SEM. Water sampled at Marnay-sur-Seine (SR1), 96 km upstream Paris, represents the Seine with the least influence of industrial, and urban activities. Thus, SR1 should have low ENP contributions to the total suspended particulate matter. Water samples collected at Alfortville city (SR2), Paris city (SR3), Argenteuil city (SR4), Bougival city (SR5), and at Conflans-Sainte-Honorine city (SR6) have greater potential for ENP inputs. A wastewater treatment plant (WWTP), discharges to the Seine River near Achères city (not sampled), between the SR5 and SR6 sampling locations. The most downstream sampling location is at Triel-sur-Seine (SR7). The first (TR1), second (TR2), and third tributary (TR3) are located between SR1 and SR2, SR2 and SR3, and SR6 and SR7 sampling points, respectively.
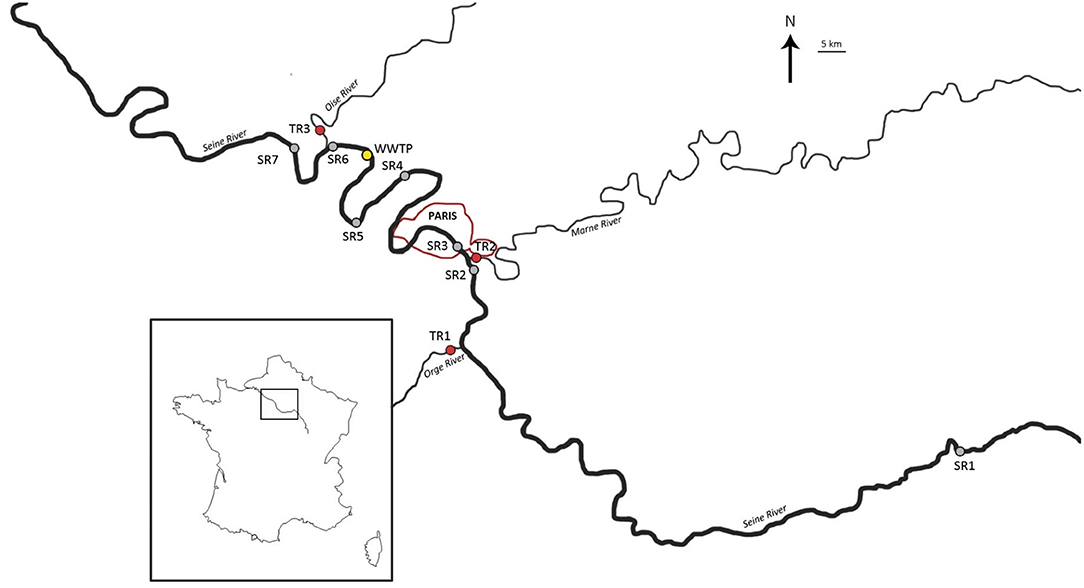
Figure 1. Field investigation on the Seine River starting from Marnay-sur-Seine (SR1) through Paris city (SR3) to Triel-sur-Seine (SR7), where WWTP refers to a wastewater treatment plant (this point was not sampled). Also sampled were the three tributaries of the Seine River: Orge River (TR1), Marne River (TR2), and Oise River (TR3).
Water Chemistry, Major, and Trace Elements
Measurements of pH, dissolved oxygen, conductivity, and temperature were performed on site immediately after sampling, using a WTW 3410 Set 2 multiparameter field probe. To separate the conventional dissolved fraction from the Suspended Particulate Matter (SPM), filtration of 1 L of water sample was also performed on site with an Amicon filtration cell and 0.2 μm polyethersulfone (PES) filters, previously cleaned in the lab with MilliQ water and dried in an oven at 105°C. Laboratory measurements of non-acidified, filtered samples for anions and alkalinity utilized a ThermoScientific ICS 1100 and a Metrohm Titrando 809, respectively. The filtered waters were acidified with 16 N HNO3 and dissolved major cations and trace elements were measured with an ICP-OES (ThermoScientific iCAP 6200) and a HR-ICP-MS (ThermoScientific ELEMENT II), respectively. Suspended particulate matter (SPM) on the 0.2 μm filters were collected for analysis by Field Emission Gun Scanning Electron Microscopy (FEG-SEM) analyses. Filtration at 0.7 μm with glass microfiber filters, followed by acidification with 85% H3PO4 was also done for non-purgeable carbon (NPOC) analysis using a Shimadzu Total Organic Carbon Analyzer.
For the total metal concentrations, non-filtered water samples were evaporated in a Savillex Teflon bomb using an oven operated at 80°C, before being acid digested with 1:1 ratio of distilled 27 N HF and distilled 16 N HNO3 at 90°C. The samples were re-dried and 1 mL of distilled 16 N HNO3 added. Sample was heated at 90°C for 15 min before dilution with MilliQ water. Element concentrations were determined in the digested samples with a ThermoScientific ELEMENT II and the data were processed with the uFreasi software (Tharaud et al., 2015). If the solution's concentration was expected to exceed 10 ppb, analysis used a ThermoScientific iCAP 6200.
Principal Component Analysis (PCA) were performed on the data set with the XLSTAT free software (https://www.xlstat.com/fr/). The overall objective of the method was to reduce the dimensionality of the data set, by its transformation into a smaller one that still contains most of the initial information and helps highlighting the correlation between the parameters. The specific aim was here to assess the link between Ti and Ce concentrations and the water chemistry (including the alkalinity, the ionic strength, the dissolved oxygen, the NPOC, the pH, and the Temperature), of Ce concentrations and the Rare Earth Elements (REEs) concentrations and of Ti concentrations and the others trace elements.
spICPMS
A sector-field ICP-MS (ThermoScientific ELEMENT II) was operated in single particle counting mode using a 1 ms dwell time, a 1 ms settling time, and a measured flow rate of 0.2 mL min−1. Over 10,000 readings were collected for each of the triplicate analyses. Because of the occurrence of calcium in the rivers samples (48Ca), 47Ti was used to avoid the isobaric interference. 140Ce was measured in low resolution and 47Ti, in medium resolution. To determine particle number concentration and particle size, 197Au was measured in both low and medium resolutions and the mass-based method for computing transport efficiency was used (Pace et al., 2011). We used 15 nm AuNPs from BBInternational at 10 ppt and dissolved Au standards (SCP science) to measure the transport efficiency at each resolution. Transport efficiency of 2.5% was estimated. Dissolved gold (Au), cerium (Ce), and titanium (Ti) (from SCP Science) were used for the calibration curves (from 50 to 1,000 ppt). To take into account matrix effects on instrument sensitivity, dissolved standards were freshly-prepared in ultrafiltered Seine River water to which dilutions from a 10 ppm stock solutions were made. A few days before the field investigation, Seine River water from Paris city near the “quai Saint Bernard,” was collected and ultrafiltered at 1 kDa with a regenerated cellulose (RC) membrane filter, which was cleaned with DI water prior to use. The water chemistry, including major elements concentrations, of this sample was found to be consistent to the one of the Seine River samples collected on 11th May (Supplementary Tables S1, S2). This water sample was used for both the dissolved calibration curves and for a 10-fold dilution of the Seine River bulk samples. This approach presumably maintained the chemical equilibrium of the solutions so as not to change the aggregation state and NPs distribution. In addition, SR1 and each tributary (TR1, TR2, and TR3) were also ultrafiltered at 1 kDa for standard ICP-MS analysis of dissolved constituents. The surface of the 1 kDa filters were also analyzed by FEG-SEM to examine the particle morphology.
Results of time-resolved spICPMS analysis are particle-generated pulses of ions over a constant background level of counts, which is a result of both the dissolved element concentration and the inherent instrumental noise. The count intensity that differentiated between the dissolved elements and the NPs was determined by comparing the spICPMS results of the diluted ultrafiltered water to that of the associated diluted non-filtered samples. The mass concentrations of Ti and Ce were also determined from spICPMS data by integrating the signal over the entire sample analysis and comparing to the dissolved Ti and Ce calibration data.
FEG-SEM
Field Emission Gun—Scanning Electron Microscopy (FEG-SEM) imaging was applied with a MIRA 3 XMU from TESCAN. A secondary electron detector (Everhart–Thornley detector) and a YAG-doped scintillator backscattered electron detector (Autrata type detector) were used to highlight the occurrence of the particles in the samples. Particles bearing a higher averaged atomic number appear brighter with the backscattered electrons detector, allowing distinguishing Ce-bearing particles and Ti-bearing particles from other particles. For the investigation, at first, the backscattered electrons detector was applied on the samples to detect Ce and Ti-bearing particles. An Energy Dispersive X-ray Spectroscopy using an EDAX team system (ApolloXPP silicon drift detector) was then applied to the targeted particles for the elemental analyses to confirm the occurrence of Ce or of Ti. A secondary electron detector was applied to image the shape of the analyzed particles. The sample preparation was to filter ~1 L of river water to collect suspended particulate matter (SPM). Parallel filtrations were performed using 0.2 μm PES membrane filters and 1 kDa RC membrane filters: assuming that the sickness of SPM deposited on the 0.22 μm pore size membrane will provide a significant chance to retain, simultaneously with coarser particles, and some particles on the nanosize range. Meanwhile, it appeared necessary to also look for single NPs deposited onto 1 kDa filters, in case the first hypothesis was wrong. The filters were dried at room temperature. Each Al stub was covered with a double-faced adhesive made of carbon. The carbon adhesives were then tapped gently onto the surface of the filters to retrieve a sufficient quantity of particles to analyze. This technique prevents having any drying artifacts after the particle dispersion. A 1.5 nm layer of platinum-palladium was coated onto the surface of the samples using a Cressington 208 HR sputter coater, to avoid a charge accumulation during the analyses. The stubs were put into the FEG-SEM for particle analysis with an accelerating voltage set at 25 kV and with a working distance of 15 mm. Between 4 and 10 particles containing Ce or Ti were detected over 20–30 particles analyzed in each sample. All the 0.2 μm filters and one of the five 1 kDa filters were analyzed by FEG-SEM.
Results
Water Chemistry of the Seine River and Its Tributaries
The water chemistry along the Seine River varied little from locations SR1 to SR7 (Supplementary Table 1). The average pH value, conductivity, and dissolved oxygen are measured to be 8.11 ± 0.2, at 522 ± 9 μS cm−1, and at 9.4 ± 0.4 mg L−1, respectively. The major cations and anions were calcium and hydrogenocarbonates, with 2,240 ± 123 μmol L−1 for Ca and 8.54 ± 0.54 meq L−1 for alkalinity, in average (Supplementary Tables S1, S2). The ionic strength was calculated at 5.8 ± 0.2 mmol L−1, based on cations and anions concentrations. NPOC concentration was measured at 3.65 ± 0.51 mg L−1.
TR1 and TR3 samples, collected from two Seine River tributaries, present higher conductivity and ionic strength. Conductivity values are 724 and at 610 μS cm−1 for TR1 and TR3 points, respectively. Ionic strength is calculated at 9.1 mmol L−1 for TR1 and at 7.1 mmol L−1 for TR3. Alkalinity is also higher in the TR3 sample (9.10 meq L−1), as well as Ca concentrations, with 2,585 and 2,433 μmol L−1, respectively, in TR1 and TR3 samples. The NPOC concentration was also higher in TR1 (5.20 mg L−1) compared to the Seine River water. The other tributary, TR2, is characterized by a higher alkalinity value (9.14 meq L−1), but a lower NPOC concentration (2.61 mg L−1) compared to the Seine river.
NP Number Concentrations Quantified by spICPMS
Due to the isobaric interference of 48Ca on 48Ti and the subsequent use of 47Ti for spICPMS detection, only Ti-NPs having a mass larger than an equivalent of a 60 nm TiO2 particle could be observed as a pulse, and thus be counted. In the case of Ce-NPs, the smallest equivalent CeO2NP that can be counted were on the order of 5 nm. Making the assumption that particles were spherical and in oxidized states, spICPMS analysis for all sampling sites gave a CeO2NPs equivalent size for sphere distributions ranging from 5 to 80 nm, with an average of 24 nm. For TiO2NPs, the equivalent size for sphere distributions ranged between 60 and 300 nm with an average of 160 nm for all sampling sites. As explained above, individual NPs cannot be differentiated, with spICPMS, from NPs heteroaggregates and SPM containing minor amounts of Ce or Ti. Thus, the reporting of “equivalent size for sphere distribution” is not the most relevant parameter for environmental studies. Therefore, the choice was made to display the Ti-bearing- and Ce-bearing PNCs (Particle Number Concentrations) as well as the Ti/Ce ratio of PNCs measured at the different sampling sites (Figure 2). It shows that in all samples, both Ce-bearing and Ti-bearing particles were detected, at concentrations of millions of particles per mL. Along the Seine River, a slight increase in the Ce-bearing PNC, and a significant Ti-bearing PNC variability are observed. The upstream SR1 sampling point exhibits 0.47 ± 0.07 × 10⁶ of Ce-bearing particles per mL and 1.35 ± 0.17 × 10⁶ of Ti-bearing particles per mL, the lowest PNCs over the studied area. The highest concentrations are measured at the SR3 sampling point, downtown Paris, for both Ce and Ti, with PNCs of 1.36 ± 0.13 × 10⁶ and of 4.68 ± 0.25 × 10⁶ part mL−1, respectively. Finally, at the downstream location SR7, a decrease in PNCs is observed with 0.86 ± 0.08 × 10⁶ part mL−1 and 3.14 ± 0.34 × 10⁶ part mL−1 for Ce and Ti, respectively.
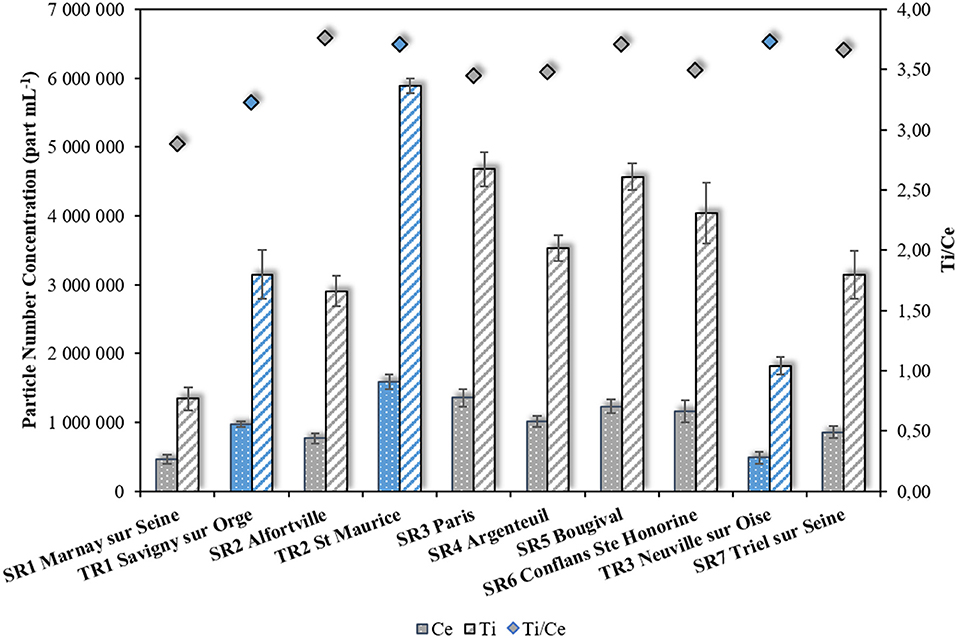
Figure 2. Particle number concentration (left-hand side axis) determined by spICPMS for Ce- and Ti-bearing particles along the Seine River. In gray are the sampling points located in the Seine River and in red, in the tributaries. Also shown is the Ti/Ce particle number on the secondary y-axis.
At the first tributary point (TR1), the PNC is high compared to the upstream location SR1, with 0.98 ± 0.04 × 10⁶ Ce-containing and 3.15 ± 0.35 ×10⁶ Ti-containing part mL−1.
Similarly, the second tributary (TR2) exhibits high particles concentrations compared to the Seine River location at SR2, with 1.59 ± 0.10 ×10⁶ Ce-bearing part mL−1 and 5.89 ± 0.10 ×10⁶ Ti-bearing part mL−1 for TR2, and 0.77 ± 0.07 ×10⁶ particles per mL containing Ce and 2.91 ± 0.22 ×10⁶ particles per mL containing Ti for SR2.
Upstream of the confluence with the third tributary, the Seine river (SR6) exhibits PNCs of 1.16 ± 0.16 ×10⁶ part mL−1 and at 4.04 ± 0.44 ×10⁶ part mL−1 for Ce and Ti, respectively. These values are higher than the concentrations measured in the last tributary (TR3), with 0.49 ± 0.09 ×10⁶ Ce-bearing part mL−1 and at 1.82 ± 0.13 ×10⁶ Ti-bearing part mL−1. As a comparison, these values are 2 orders of magnitude higher than those measured in the Danube recreational lake for Ti (Gondikas et al., 2014), and in the Loire River for both Ce and Ti (Phalyvong et al., 2020).
Total Mass Concentrations From spICPMS and From Acid Digestion
Unlike the Ce PNC, which had a maximum Seine River value at SR3, Ce mass concentration (nmol L−1) shows a monotonic, nearly 10-fold increase in mass concentration proceeding downstream (Figure 3). This increase is also seen in La, resulting in a nearly constant Ce/La ratio.
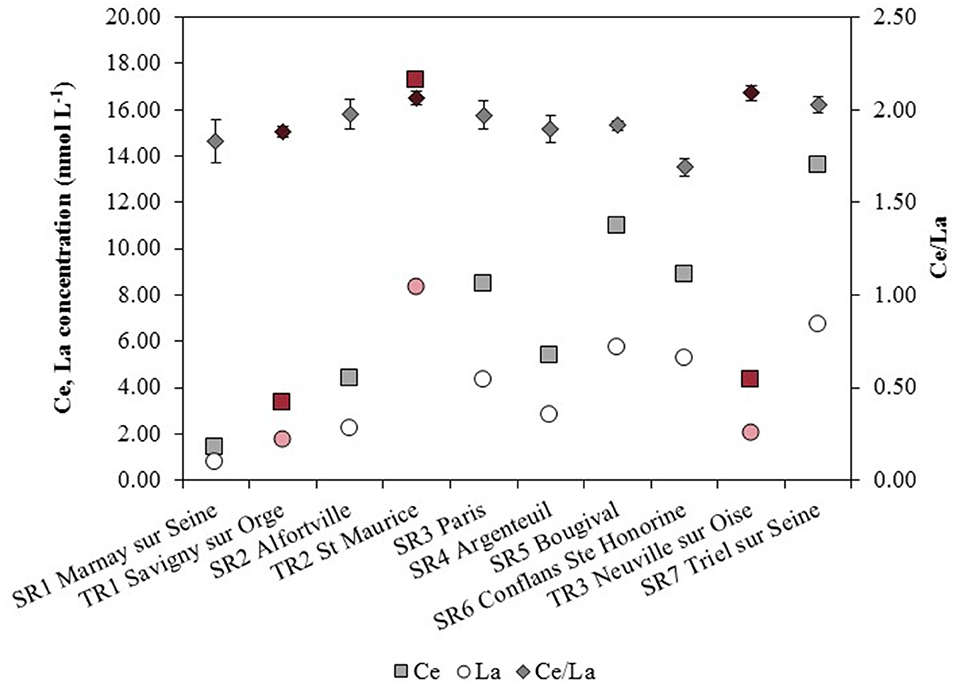
Figure 3. Ce and La total concentrations (left-hand side axis) and Ce/La elemental ratios (right-hand side axis) as a function of the different sampling sites from SR1 to SR7 (in gray), with the three different tributaries (in red).
The total Ce and La mass concentrations at SR-1 were 1.40 ± 0.07 nmol L−1 for Ce, and 0.76 ± 0.03 nmol L−1 for La, representing the lowest Ce and La total concentrations of the Seine River. The highest Ce and La concentrations in the Seine River are measured at SR7 with 13.61 ± 0.17 nmol L−1 for Ce and 6.71 ± 0.12 nmol L−1 for La. Compared to the Seine river upstream of the confluences, the first tributary contains Ce and La at a similar concentration range (TR1: 3.35 ± 0.01 nmol L−1 in Ce and 1.78 ± 0.02 nmol L−1 in La). The second tributary had substantially higher levels of both elements (TR2: 17.27 ± 0.25 nmol L−1 for Ce and 8.37 ± 0.07 nmol L−1, for La), representing the highest found in the study area for both Ce and La. The third tributary is largely depleted (TR3: 4.30 ± 0.02 nmol L−1 for Ce and 2.06 ± 0.04 nmol L−1 for La) relative to all sites downstream of SR-2.
Compared to the upstream sampling point (SR1), the three concentrations of Ce (total, spICPMS, and dissolved) increase along the Seine River (Supplementary Figure 1). After SR3 sampling point, the dissolved Ce concentration stayed constant in the Seine River with an average of 0.14 ± 0.01 nmol L−1. The dissolved concentrations in TR2 and TR3 were slightly lower than the one found in the Seine River with 0.07 ± 0.01 nmol L−1 and 0.10 ± 0.01 nmol L−1 for TR2 and TR3, respectively. The mass concentrations obtained by spICPMS show Ce considerably above the dissolved value, demonstrating a significant contribution of Ce by particles. However, the spICPMS value remains smaller than the total obtained by acid digestion/ICPMS analysis, which is consistent. This result suggests that although spICPMS gives mass concentration data for some particles, not all were measured by spICPMS. According to the sampling points, only 6–34% of the total Ce concentration was detected as “nano” with spICPMS, with an averaged value of 16%.
Figure 4 displays the total mass concentrations of Ti and Al in the bulk water samples. Previous works on TiO2 released by sunscreens into surface waters plotted the Ti/Al elemental ratio to attempt differentiation of anthropogenic Ti from geogenic Ti (Gondikas et al., 2014; Reed et al., 2017; Phalyvong et al., 2020), as most of engineered TiO2NPs are alumina coated (Serpone et al., 2007; Virkutyte et al., 2012). Using this approach in the present study, the Ti/Al elemental ratios have also been plotted on Figure 4. In SR1 sample, the total concentrations of 0.15 ± 0.01 μmol L−1 and of 5.69 ± 0.06 μmol L−1 were measured for Ti and Al, respectively. From that point, the concentrations increase and reach 1.78 ± 0.04 μmol L−1 for Ti and 58.29 ± 0.66 μmol L−1 for Al at the last sampling point. The concentration in TR2 sample from the second tributary (2.28 ± 0.03 μmol L−1 and 72.14 ± 0.32 μmol L−1 for Ti and Al, respectively) greatly exceeds the concentration in the Seine River but the third tributary appears to be largely depleted in both Ti and Al (0.49 ± 0.01 μmol L−1 and of 15.40 ± 0.26 μmol L−1, for Ti and Al, respectively).
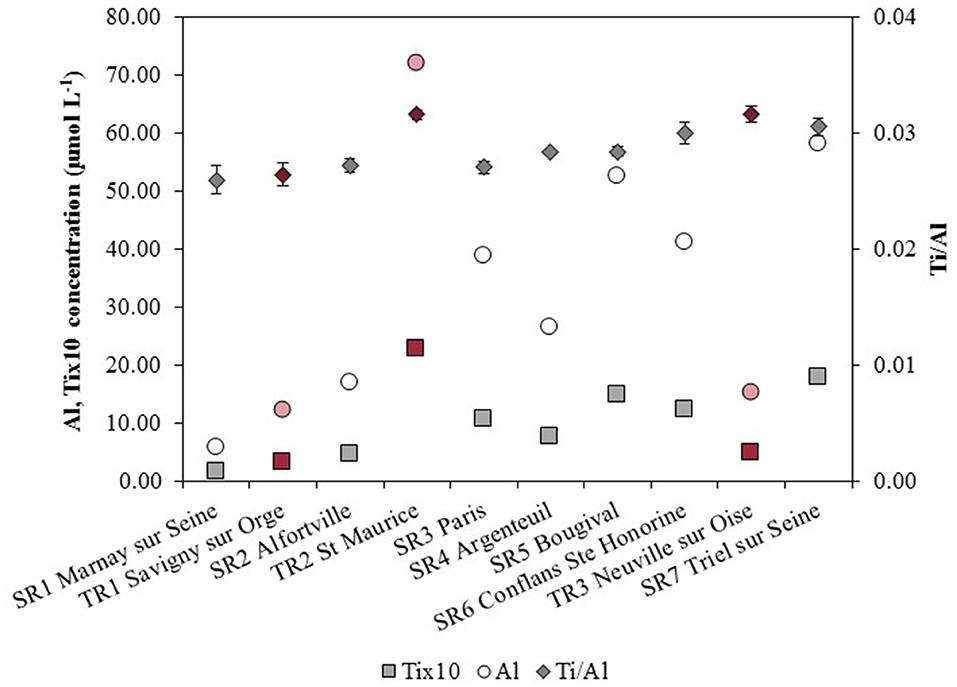
Figure 4. Ti and Al total concentrations (left-hand side axis) and Ti/Al elemental ratios (right-hand side axis) for the different sampling sites from SR1 to SR7 (in gray), with the three different tributaries (in red).
The three concentrations of Ti (total, derived from spICPMS and dissolved) in the first sampling point (SR1) were low but the concentrations increased along the Seine River (Supplementary Figure 2). The dissolved concentration of Ti was one hundred times lower than that from the spICPMS and the total concentrations. The lowest dissolved concentrations is measured in SR1 water sample (1.00 ± 0.10 nmol L−1), and it increases along the Seine River to reach the maximum value at SR6 sampling point where 3.37 ± 0.40 nmol L−1 were quantified. The first tributary (TR1) had also a higher dissolved concentration than the SR1 sample with 2.33 ± 0.18 nmol L−1. TR2 and TR3 water samples had lower dissolved concentrations than TR1, with 1.12 ± 0.06 nmol L−1 and 1.66 ± 0.17 nmol L−1, respectively. As for Ce, the spICPMS concentration of Ti were lower than the total concentrations measured after acid digestion. However, the balance is reduced for Ti comparatively to Ce, as 25–100% of the total Ti concentration was detected as “nano” with spICPMS according to the sampling points, with an average of 67% in the present field study.
Imaging of NPs
Among all the observations made, the Figure 5 illustrates a selection of 10 observations from FEG-SEM and subsequent analyses performed on SPM collected on 0.2 μm and on 1 kDa filters. The elements detected by EDS include those from the particle itself but also those from the matrix around the particle, since the volume of material analyzed by the EDS is larger than the particles bearing Ce and La, as well as those bearing Ti, that were found in all samples. These particles had a range of different sizes and shapes. Figure 5 illustrates Ce and La bearing particles observed in TR1, SR2, SR5, SR6, and SR7 suspended matter having a dimensions in the range 0.2–4 μm, larger than the nano-size. Ti-containing particles are also shown in Figure 5 from SR1, SR3, SR4, TR2, and TR3 sampling points where particles ranging from 100 nm to 1 μm could be found. The SR1 sample retentate filtered at 1 kDa (Figure 5) shows three different sized particles: the size of these particles vary from (150 nm ×190 nm) in the upper-right corner to (280 nm ×190 nm) in the center and even (620 nm ×680 nm) at the bottom-left of the picture. No individual particles were detected: they were all embedded in a matrix made of larger structures (e.g., mineral phases) suggesting that particles are heteroaggregated, the best example being the TR3 sample (Figure 5).
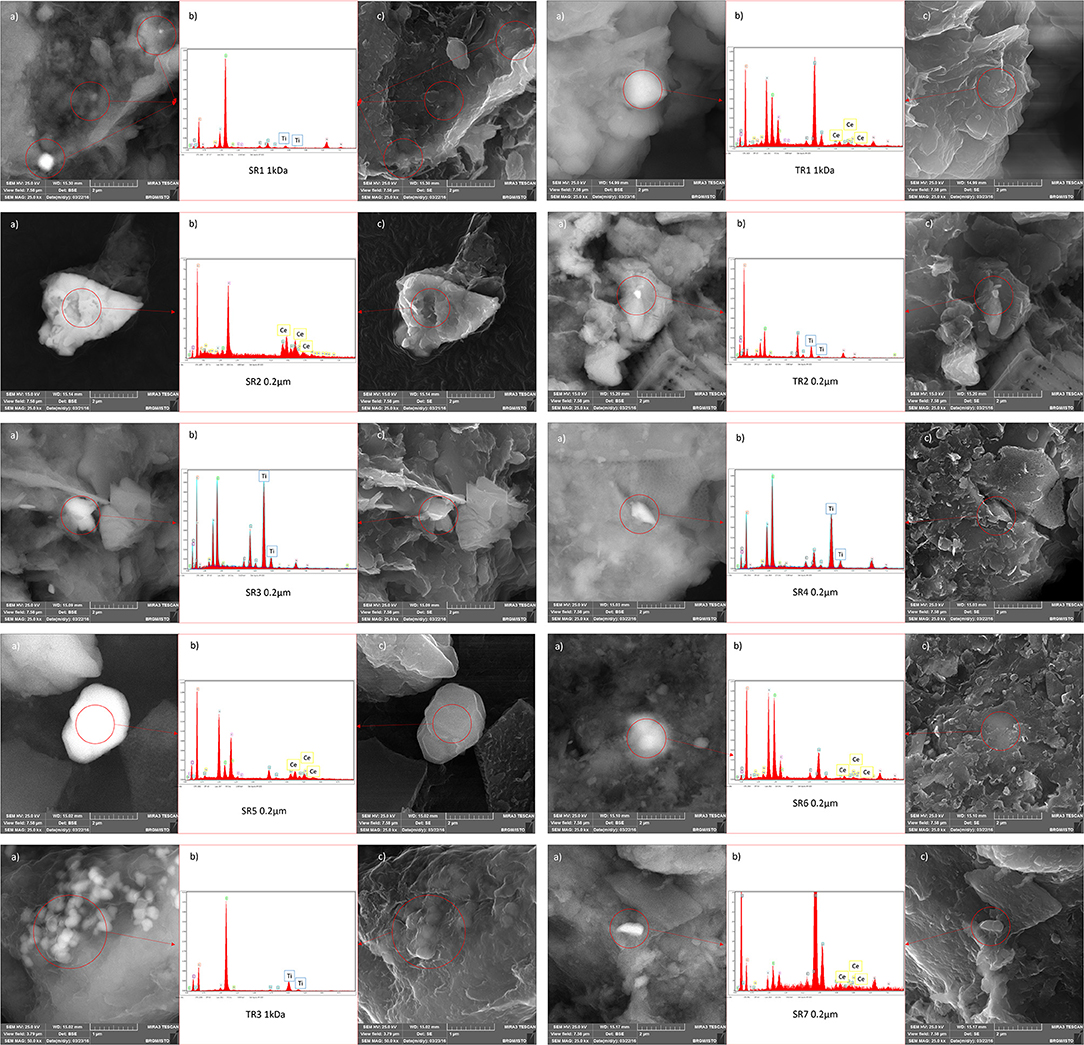
Figure 5. FEG-SEM analyses on either 0.2 micron filter or 1 kDa filter for each of the 10 SPM samples collected; (a) are pictures obtained with BSE detector, (b) represent the corresponding EDS analysis of the target particle(s), and (c) the corresponding SE picture.
Discussion
Quantifying NPs in the Seine River
The spICPMS method quantified the occurrence of CeO2NPs and TiO2NPs in the Seine River and its tributaries (Figure 2). When compared to the Loire River results (Phalyvong et al., 2020), the quantity of particles detected in the Seine River is two order of magnitude higher, which may be either related to (i) the different substratum of both watersheds; (ii) the different climatic conditions of the sampling; or (iii) the different anthropic contributions.
In spite of these relatively high PNCs, one has to notice that these values are probably underestimated due to the isobaric interference of 48Ca on 48Ti and the subsequent use of 47Ti for spICPMS detection, that prevent the detection of the Ti-NPs smaller than 60 nm. The detection limit in size of spICPMS (Dmin) depends on several factors such as the instrument sensitivity or the background noise level. Indeed, a chart proposed by Lee et al. (2014) summarizes the detection size limit of quadrupolar ICPMS for 40 elements including Ce and Ti where the minimum size for 140Ce is around 10 nm, and for 49Ti, around 80 nm. Among the several approaches tested by Tharaud et al. (2017) to reduce the Ca interference while measuring TiO2 in solutions, we decided to use a High-Resolution ICPMS). FEG-SEM analyses detected particles containing both Ce and Ti only in particles larger than 100 nm (Figure 5), and thus by definition, not NPs. The lack of observations of NPs is mostly due to the complexity of the SPM and to the abundance of natural phases that could hide the Ce-bearing and Ti-bearing particles. NP can also be embedded in heteroaggregates that would hide their presence.
The lack of correspondence in the relationship between particle number and mass also suggests changes in NP size or Ce and Ti content that could be related to heteroaggregation: an increase in mass concentration along the river flow, yet a decrease in PNC, is consistent with two analytical competing particle size effects. In one case the Ce (respectively, Ti) content of the particles may be becoming too low to separate them from the background signal. Conversely, an input of suspended sediment particles >5–10 micron could also explain this observation, as these particles are likely too large to be transported and ionized by the ICP-MS. The increase in Ce and La mass concentration is also in contrast to the constant values of conductivity and ionic strength seen at nearly all Seine River locations (Supplementary Table 1, Supplementary Figure 1). The processes that introduce NPs into the river system do not seem to increase or decrease the concentration of dissolved constituents in the river water. The lack of correlation of PNC or mass concentration with stream discharge (Supplementary Table 3) suggests that simple velocity-driven suspension and transport does not explain NP abundance, but rather other factors within the watersheds are important.
When compared with the total concentrations, only 6–25% of the total Ce that were in a particulate state could be detected by spICPMS. For Ti-containing particles, the discrepancy is smaller (from 25 to 100% of total Ti) and both dissolved values for Ce and for Ti were at least one hundred times lower than the total concentrations. Larger Ce bearing particles that are not likely to be fully transported and ablated by the ICP could explain the difference between the total and the spICPMS concentrations. For instance, natural Ce particles can be found in the form of monazites [(Ce, La, Nd, and Th) (PO4)] (Dahle and Arai, 2015) which are natural particles with a typical range of size from 150 nm to >1 μm. The good correlations observed between the SPM concentrations and the Ti and Ce total concentrations (R2 = 0.88 and 0.84, respectively, Supplementary Table 3) highlight the fact that the biggest loss of particles would induce the biggest Ti and Ce loss if these particles are not fully ionized in the plasma.
Our findings demonstrated that the observations made with the water chemistry was in good agreement with the principal component analyses (PCA) made with XLSTAT (Supplementary Figures 3, 4). CeO2NPs are insoluble in water when the pH is superior to 7 (Dahle et al., 2015), which is the case of the Seine River and of the studied tributaries. Moreover, the occurrence of Natural Organic Matter (NOM) as well as the ionic strength are parameters that will partly control the aggregation state of TiO2NPs and CeO2NPs (Van Hoecke et al., 2011; Oriekhova and Stoll, 2019). The aggregation of the NPs are dependent of the ionic strength with a commonly observed increase of aggregation when the ionic strength increases (Thio et al., 2011). In the Seine River field investigation, the ionic strength is calculated, in average, at 5.8 ± 0.2 mmol L−1. For the Orge River (TR1), the ionic strength is calculated at 9.1 mmol L−1 while natural organic matter concentration is higher (5.20 vs. 2.72 mg L−1), suggesting that the aggregation state would be strongly different than in the Seine River. Therefore, the water chemistry suggests that the Orge River may not significantly contribute in TiO2NPs in the Seine River (PCA, Supplementary Figure 4). On the contrary, the ionic strength and NPOC concentration of TR2 water sample are closer to the ones found in the Seine River (Supplementary Table 1), indicating that in both the Marne and the Seine rivers, the aggregation rate may be similar.
In the studied rivers, the particles could undergo heteroaggregation with mineral phases (Topuz et al., 2014; Labille et al., 2015; Topuz and Talinli, 2015). This was directly seen with the FEG-SEM results and also indirectly with the spICPMS results, for which the occurrence of poorly ionized (and detected) particles >5 μm is consistent with heteroaggregation. Besides, in the FEG-SEM analyses, no individual particle nor aggregate are detected, and only particles embedded in mineral matrix were observed. This embedment of NPs in mineral matrix which can occur either in the environment or during the filtration and drying of SPM deposited on the 0.2 μm pore size filter, at least indicates that heteroaggregation is predominant over homoaggregation of TiO2NPs in the river waters studied here. Contrary to the Danube River water study (Gondikas et al., 2014) where the authors suggest that TiO2NPs from the sunscreen underwent fast homoaggregation favored by the hydrochemistry, this specific behavior does not seem to happen in river waters of the present study, probably because of the different hydrochemical parameters (pH, ionic strength, NOM quality, and quantity) that here favors heteroaggregation.
Mass Balance of PNC
After the confluence between SR1 and TR1 sampling points, an increase of the PNC is observed for Ce and Ti. The Ti/Ce ratio also significantly increases from 3 to 3.75 in SR1 and SR2, respectively (Figure 2), suggesting a relative contribution in Ti bearing particles. Then, the Ti/Ce ratios remains constant at 3.62 ± 0.12 up to SR7, including the Marne and Oise rivers tributaries. Therefore, a good way to assess the contribution at each tributary is the study of the mass balance of particle flows.
Multiplying the PNC of Ce and of Ti with the water flow (Supplementary Table 3), conservative or non-conservative mixing can be checked at each confluence between the Seine River and its tributaries (Figure 6). The theoretical mix corresponds to the sum (conservative behavior) of the flow of particles of the Seine River with the associated tributary. Given the uncertainties in the replicate PNC, the mass balance was conservative at the confluence between the Seine and the Marne (TR2) Rivers, and also at the confluence between the Seine and the Oise (TR3) Rivers. However, for the mass balance at the confluence between the Seine and the Orge (TR1) Rivers, the downstream measurement value was higher than the theoretical mix. The difference in the water flow between the Orge River (2.87 m3/s) and the Seine River (184 m3 s−1) also make the mixing calculation unreliable. More importantly, at the site downstream of the confluence between the Orge and the Seine Rivers, the water flow was equal to 474 m3 s−1, showing significant sources of water to the Seine that were not measured for discharge or PNC.
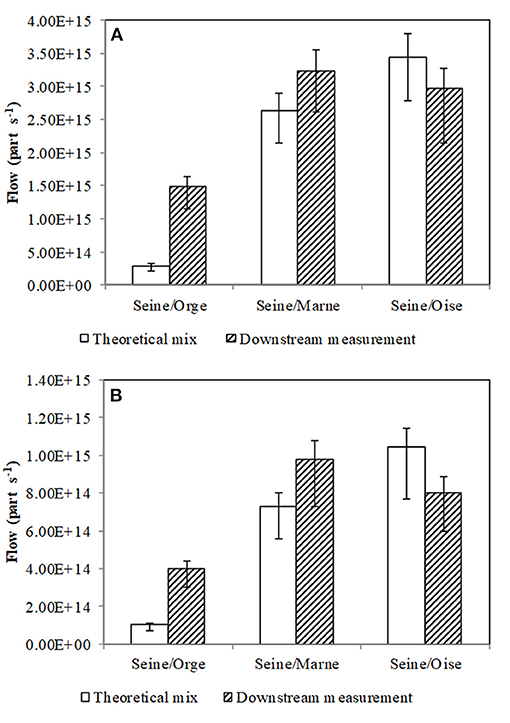
Figure 6. Mass balance for the PNC of Ce (A) and of Ti (B).
Paris city does not seem to have a contribution in CeO2NPs since its Ce/La elemental ratio (Figure 3) was equal to the one found in the upstream point of the field investigated (SR3: 1.97 ± 0.08 vs. SR1: 1.83 ± 0.12). At the Paris city sampling point, the Ti/Al elemental ratio was also equal to the ratio calculated in SR1 water sample (0.027 ± 0.001) (Figure 4), consistent with the assumption made for CeO2NPs of a non-significant contribution to TiO2NPs in the Seine River from Paris city at the time of the sampling campaign.
However, a drop in Ce total concentration profile (Figure 3) was observed in SR6 water sample, which had a consequence on the Ce/La elemental ratio. The Ce/La ratio was estimated at 1.69 ± 0.05 in SR6 water sample, which was lower than the elemental ratio measured in SR1 sampling point. This low ratio could be explained by the occurrence of the WWTP between the sampling points SR5 and SR6 that potentially act as an artificial tributary that plays a role: the average WWTP flow is 60 m3/s vs. a Seine River flow of 400–500 m3/s on the day of sampling and Ce/La elemental ratio in SPM from this WWTP effluent has been previously reported to 1.65 by Chen et al. (2014). Besides, contrary to CeO2NPs, the WWTP effluent measured at Ti/Al = 0.078 by the these authors did not seemed to significantly impact the TiO2NPs removal (Figure 4) since both Ti and Al diminished before SR6 sampling point and Ti/Al stayed constant.
Attempt to Discriminate the Origins of CeO2NPs
The relative abundance of the Rare Earth Elements (REEs), and particularly their fractionation during geochemical processes make them powerful tracers of weathering and a means of examining the origin of elements in waters (Braun et al., 1990, 1993; Elderfield et al., 1990). Any significant contribution of CeO2 ENPs in waters should result in a Ce anomaly in the REE patterns. Thus, the ratio of concentration of Ce with respect to that of another REE appears to be a potential tracer of CeO2 ENPs occurrence. In the Seine River, Ce/La values vary from 1.72 to 2.12, very close to the natural background determined for stream waters over France at 1.96 (Salminen et al., 2005). Only the last point on the Seine River (SR7 with Ce/La = 2.12), and the Marne and the Oise Rivers present Ce/La ratios significantly above 2.00, with 2.06 ± 0.03 and 2.09 ± 0.04 for TR2 and TR3 respectively, suggesting a potential contribution of CeO2NPS. The constant elemental ratios suggest a contribution in natural NPs of the Marne and of the Oise Rivers. In both samples, results of elemental ratios and of FEG-SEM show a contribution in Ce-bearing particles, coming from natural phases, since the elemental ratios are not significantly different in the tributaries with regard to the Seine river. In general, REE are correlated and it is the case of this study (Supplementary Figure 5). The PCA results show also that the REE are correlated with an important relation of Ce with La, Nd, and Sc for TR2 sampling point, in the upper-right corner of the PCA (which corresponds to the Marne River).
Attempt of Determination of TiO2NPs Sources
The Ti/Al elemental ratio measured on engineered NPs varies from 4.08 ± 0.11 to 8.01 ± 0.11 (acid digestion realized on different TiO2 ENPs, see Supplementary Table 4). This contrasts with the ratios measured in river waters in the present study, ranging from 0.026 to 0.032 (Figure 4). The typical Ti/Al elemental ratio measured in SPM from the Seine river over a 3-year period by Chen et al. (2014) corroborates these results (Ti/Al = 0.033 ± 0.003, n = 50, Chen et al., 2014). The most upstream point sampled on the Seine river in the present study displays the lowest Ti/Al elemental ratio (0.026 ± 0.001, SR1, Figure 4) as well as the lowest concentrations for both elements. Therefore, one could assume this point being relevant of the local background, in adequacy to the value of 0.02 proposed by Salminen et al. (2005) for the natural background of French streams. Both elements were correlated in several samples (especially, TR2, SR5, and SR6 sampling points) which was shown with the PCA (Supplementary Figure 6). The Ti/Al ratio in TR1 sample was close to the one found previously in SR1 water meaning that the Orge River did not had, during the field campaign, a significant contribution in TiO2NPs coming from anthropogenic activities. Besides, in TR2 sampling point, an increase of Ti/Al elemental ratio was observed (0.032 ± 0.000). This indicates an addition in NPs from a different origin than SR1 point, probably from anthropogenic activities before the confluence between the Marne and the Seine Rivers. The Ti/Al value was high in TR3 sampling point with 0.032 ± 0.001, suggesting here again an anthropogenic origin of NPs in the tributary (the Oise River); but due to the low PNC in TR3 the contribution to the Seine river remains insignificant, lower than TR2 contribution. The low elemental ratio, in this study, was due to the high proportion of Al in the water samples. This low elemental ratio has been observed in the Danube recreational lake (Gondikas et al., 2014) and also in the Loire River (Phalyvong et al., 2020) and complicates the use of Ti/Al to determine the speciation of Ti particularly to highlight the presence of TiO2NPs.
Therefore, other elements like V or Y were also used, as suggested by Gondikas et al. (2014), in order to distinguish the signal of engineered TiO2NPs from natural Ti-containing particles that may also contain these elements, as a good correlation was also obtained between these elements and the SPM concentration (Supplementary Table 3). As for Ti/Al, a significant increase of the Ti/V and Ti/Y elemental ratios (Figure 7) was observed in the Marne River, with values of 30.99 ± 0.44 and 236.98 ± 3.39 for Ti/V and Ti/Y, respectively. After the confluence between the Seine and the Marne rivers, the mass balance is checked for these elements. Hence, this increase suggests a contribution of an enriched TiO2 phase, potentially anthropogenic, from this tributary in the Seine River. The other tributaries do not display similar trends for Ti/V and Ti/Y compared to Ti/Al. Whereas, the latter was slightly higher in the Orge River and the Oise River before their respective confluences with the Seine river, Ti/V and Ti/Y are significantly lower in these tributaries compared to the Seine river. One can assume that the chemical signature of particles from these catchments are controlled by anthropogenic and geogenic contributions significantly different than in the Seine River watershed. The study of smaller area should be done to assess the local contribution of NPs coming from natural or anthropogenic process, as it was recently proposed for AgNPs by our group (Wang et al., 2020).
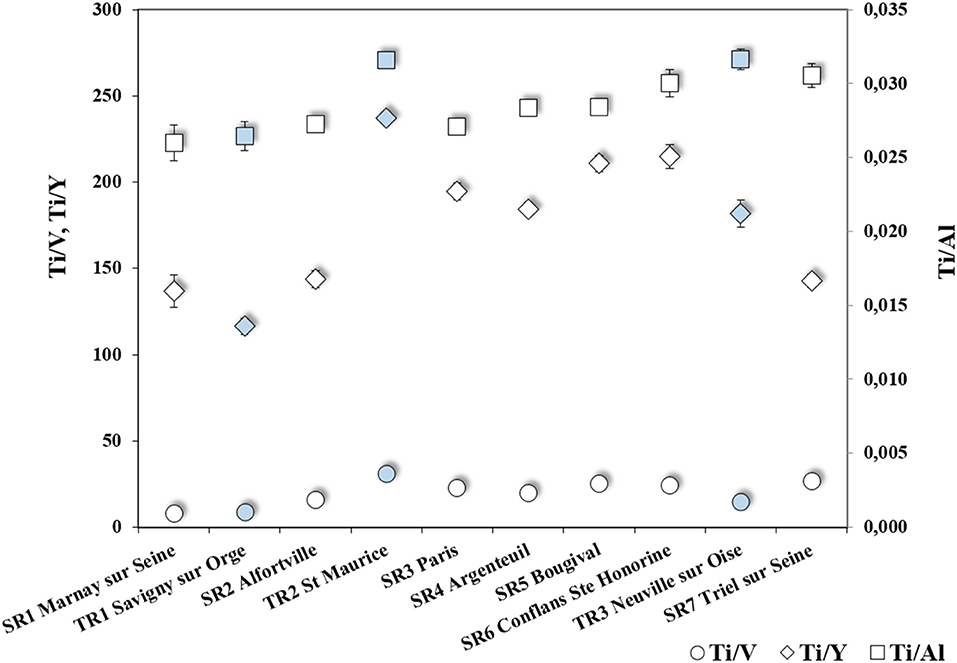
Figure 7. Ti/V and Ti/Y elemental ratios (left-hand axis) as regard to Ti/Al elemental ratios (right-hand axis) evolution for the different sampling sties from SR1 to SR7 (in white), with the three different tributaries (in blue).
Conclusion
The occurrence of CeO2NPs and TiO2NPs were assessed with the use of spICPMS showing that millions of particles per milliliter containing Ce and Ti could be measured with this technique with the adequate dilution. In all suspended particulate matters, Ce-bearing and Ti-bearing particles were also detected with FEG-SEM imaging. After the confluence between the Seine River and its tributaries, an increase in the particle number concentration was determined, suggesting a contribution in NPs from all tributaries. However, the results of the elemental ratios and of the mass balance showed that only the Marne River and the Oise River had a significant contribution in natural CeO2NPs. For TiO2NPs, an anthropogenic origin was determined for the Marne River but the use of Ti/Al elemental ratios brings uncertainties since the concentration of Al in the rivers is very important and other elemental ratios (as Ti/V and Ti/Y) should be used to estimate the NPs origins. Besides, the contribution in NPs of the Orge River and the Paris city were not highlighted in this study, since the relative elemental ratios were constant. Hence, we conclude that this one-shot sampling campaign did not allowed to provide evidence of any significant contribution of the Paris city and the Orge River to the release of TiO2NPs and CeO2NPs in the Seine River. This emphasizes the need for more local and highly time-resolved studies that would allow to address the question of the potential impacts of diurnal (Reed et al., 2017) or seasonal changes in hydrological conditions and land use, as recently proposed by Wang et al. (2020) and Peters et al. (2018). spICPMS technique is a powerful tool but it also needs to be completed with other ones such as imaging with FEG-SEM and/or the use of elemental ratios to have a full investigation of the NPs origins in the river water. The detection of ENPs in environmental samples remains one of the biggest challenges for their monitoring and the assessment of the related risk. In order to distinguish the engineered from the natural NPs, groundbreaking analytical effort must be performed. The most promising solution to meet this challenge is probably the one recently developed by Praetorius et al. (2017) to distinguish engineered from natural CeO2NPs in soils: the use of an inductively-coupled plasma time-of-flight mass spectrometer (ICP-TOFMS) in single-particle mode allows to simultaneously analyze all the elements in a given particle and thus to establish intrinsic elemental ratios.
Data Availability Statement
The raw data supporting the conclusions of this article will be made available by the authors, without undue reservation.
Author Contributions
KP was in charge of the sampling, analyses and writing. She was supervised and guided by MT and GW for spICPMS and MEB-FEG, respectively. YS conceived the presented idea, coordinated, and supervised the whole work with the help of MB, HP, and JR. XB and AG helped them supervising the project on the MEB-FEG and natural systems, respectively. All authors discussed and wrote the final manuscript.
Funding
This research project QUANTINANO was fully supported by the Bureau de Recherche Géologique et Minière (BRGM) and Institut de Physique du Globe de Paris (IPGP) under the convention No. DAF/JAC/JUR/AS/no. 2013/422. Part of this work was supported by the IPGP multidisciplinary program PARI and by Paris-IdF Region SESAME Grant No. 12015908, the ANR-18-IDEX-0001, IdEx Université de Paris, and the PIREN Seine program.
Conflict of Interest
The authors declare that the research was conducted in the absence of any commercial or financial relationships that could be construed as a potential conflict of interest.
Acknowledgments
Our thanks go to Ms. Laure Cordier for the assistance she provided during various multi-elemental analyses. Two reviewers as well as the associate editor are thanks for their critical comments.
Supplementary Material
The Supplementary Material for this article can be found online at: https://www.frontiersin.org/articles/10.3389/fenvs.2020.549896/full#supplementary-material
References
Braun, J.-J., Pagel, M., Muller, J.-P., Bilong, P., Michard, A., and Guillet, B. (1990). Cerium anomalies in lateritic profiles. Geochim. Cosmochim. Acta 54, 781–795. doi: 10.1016/0016-7037(90)90373-S
Braun, J. J., Pagel, M., Herbillon, A., and Rosen, C. (1993). Mobilization and redistribution of REEs and thorium in a syenitic lateritic profile: a mass balance study Geochim. Cosmochim. Acta 57, 4419–4434. doi: 10.1016/0016-7037(93)90492-F
Chen, J.-B, Gaillardet, J., Bouchez, J., Louvat, P., and Wang, Y. N. (2014). Anthropophile elements in river sediments: overview from the seine river, France. G Cube 15, 4526–4546. doi: 10.1002/2014GC005516
Dahle, J., and Arai, Y. (2015). Environmental geochemistry of cerium: applications and toxicology of cerium oxide nanoparticles. Int. J. Environ. Res. Public Health 12, 1253–1278. doi: 10.3390/ijerph120201253
Dahle, J. T., Livi, K., and Arai, Y. (2015). Effects of pH and phosphate on CeO2 nanoparticle dissolution. Chemosphere 119, 1365–1371. doi: 10.1016/j.chemosphere.2014.02.027
Dan, Y., Zhang, W., Xue, R., Ma, X., Stephan, C., and Shi, H. (2015). Characterization of gold nanoparticle uptake by tomato plants using enzymatic extraction followed by single-particle inductively coupled plasma-mass spectrometry analysis. Environ. Sci. Technol. 49, 3007–3014. doi: 10.1021/es506179e
Degueldre, C., and Favarger, P. Y. (2003). Colloid analysis by single particle inductively coupled plasma-mass spectroscopy: a feasibility study. Colloids Surf. A Physicochem. Eng. Aspects 217, 137–142. doi: 10.1016/S0927-7757(02)00568-X
Degueldre, C., Favarger, P. Y., and Wold, S. (2006). Gold colloid analysis by inductively coupled plasma-mass spectrometry in a single particle mode. Anal. Chim. Acta 555, 263–268. doi: 10.1016/j.aca.2005.09.021
Deng, Y., Petersen, E. J., Challis, K. E., Rabb, S. A., Holbrook, R. D., Ranville, J. F., et al. (2017). Multiple method analysis of TiO2 nanoparticle uptake in rice (Oryza sativa L.) plants. Environ. Sci. Technol. 51, 10615–10623. doi: 10.1021/acs.est.7b01364
Donovan, A. R., Adams, C. D., Ma, Y., Stephan, C., Eichholz, T., and Shi, H. (2016a). Detection of zinc oxide and cerium dioxide nanoparticles during drinking water treatment by rapid single particle ICP-MS methods. Anal. Bioanal. Chem. 408, 5137–5145. doi: 10.1007/s00216-016-9432-0
Donovan, A. R., Adams, C. D., Ma, Y., Stephan, C., Eichholz, T., and Shi, H. (2016b). Single particle ICP-MS characterization of titanium dioxide, silver, and gold nanoparticles during drinking water treatment. Chemosphere 144, 148–153. doi: 10.1016/j.chemosphere.2015.07.081
Elderfield, H., Upstill-Goddard, R., and Sholkovitz, E. R.. (1990). The rare earth elements in rivers, estuaries, and coastal seas and their significance to the composition of ocean waters. Geochim. Cosmochim. Acta 54, 971–991 doi: 10.1016/0016-7037(90)90432-K
Gómez-Rivera, F., Field, J. A., Brown, D., and Sierra-Alvarez, R. (2012). Fate of cerium dioxide (CeO2) nanoparticles in municipal wastewater during activated sludge treatment. Bioresour. Technol. 108, 300–304. doi: 10.1016/j.biortech.2011.12.113
Gondikas, A. P., von der Kammer, F., Reed, R. B., Wagner, S., Ranville, J. F., and Hofmann, T. (2014). Release of TiO2 nanoparticles from sunscreens into surface waters: a one-year survey at the Old Danube recreational lake. Environ. Sci. Technol. 48, 5415–5422. doi: 10.1021/es405596y
Gottschalk, F., Sonderer, T., Scholz, R. W., and Nowack, B. (2009). Modeled environmental concentrations of engineered nanomaterials (TiO2, ZnO, Ag, CNT, Fullerenes) for different regions. Environ. Sci. Technol. 43, 9216–9222. doi: 10.1021/es9015553
Gottschalk, F., Sun, T., and Nowack, B. (2013). Environmental concentrations of engineered nanomaterials: review of modeling and analytical studies. Environ. Pollut. 181, 287–300. doi: 10.1016/j.envpol.2013.06.003
Gray, E. P., Coleman, J. G., Bednar, A. J., Kennedy, A. J., Ranville, J. F., and Higgins, C. P. (2013). Extraction and analysis of silver and gold nanoparticles from biological tissues using single particle inductively coupled plasma mass spectrometry. Environ. Sci. Technol. 47, 14315–14323. doi: 10.1021/es403558c
Hashimoto, K., Irie, H., and Fujishima, A. (2005). TiO2 photocatalysis: a historical overview and future prospects. Jpn. J. Appl. Phys. 44, 8269–8285. doi: 10.1143/JJAP.44.8269
Hochella, M. F. Jr., Mogk, D. W., Ranville, J., Allen, I. C., Luther, G. W., Marr, L. C., et al. (2019). Natural, incidental, and engineered nanomaterials and their impacts on the Earth system. Science 363:eaau8299. doi: 10.1126/science.aau8299
Imagawa, H., Suda, A., Yamamura, K., and Sun, S. (2011). Monodisperse CeO2 nanoparticles and their oxygen storage and release properties. J. Phys. Chem. C. 115, 1740–1745. doi: 10.1021/jp109878j
Kahru, A., and Dubourguier, H.-C. (2010). From ecotoxicology to nanoecotoxicology. Toxicology. 269, 105–119. doi: 10.1016/j.tox.2009.08.016
Keller, A. A., and Lazareva, A. (2014). Predicted releases of engineered nanomaterials: from global to regional to local. Environ. Sci. Technol. Lett. 1, 65–70. doi: 10.1021/ez400106t
Keller, A. A., Wang, H., Zhou, D., Lenihan, H. S., Cherr, G., Cardinale, B. J., et al. (2010). Stability and aggregation of metal oxide nanoparticles in natural aqueous matrices. Environ. Sci. Technol. 44, 1962–1967. doi: 10.1021/es902987d
Labille, J., Harns, C., Bottero, J.-Y., and Brant, J. (2015). Heteroaggregation of titanium dioxide nanoparticles with natural clay colloids. Environ. Sci. Technol. 49, 6608–6616. doi: 10.1021/acs.est.5b00357
Laborda, F., Jiménez-Lamana, J., Bolea, E., and Castillo, J. R. (2011). Selective identification, characterization and determination of dissolved silver(I) and silver nanoparticles based on single particle detection by inductively coupled plasma mass spectrometry. J. Anal. At. Spectrom. 26, 1362–1371. doi: 10.1039/c0ja00098a
Laborda, F., Jiménez-Lamana, J., Bolea, E., and Castillo, J. R. (2013). Critical considerations for the determination of nanoparticle number concentrations, size and number size distributions by single particle ICP-MS. J. Anal. At. Spectrom. 28, 1220–1232. doi: 10.1039/c3ja50100k
Lee, B. X., Reed, R. B., Ranville, J. F., Herckes, P., and Westerhoff, P. (2014). Nanoparticle size detection limits by single particle ICP-MS for 40 elements sungyun. Environ. Sci. Technol. 48, 10291–10300. doi: 10.1021/es502422v
Lima, J. F.d, Martins, R. F., Neri, C. R., and Serra, O. A. (2009). ZnO:CeO2-based nanopowders with low catalytic activity as UV absorbers. Appl. Surf. Sci. 255, 9006–9009. doi: 10.1016/j.apsusc.2009.06.071
Loeschner, K., Navratilova, J., Kobler, C., Molhave, K., Wagner, S., von der Kammer, F., et al. (2013). Detection and characterization of silver nanoparticles in chicken meat by asymmetric flow field flow fractionation with detection by conventional or single particle ICP-MS. Anal. Bioanal. Chem. 405, 8185–8195. doi: 10.1007/s00216-013-7228-z
Mitrano, D. M., Lesher, E. K., Bednar, A., Monserud, J., Higgins, C. P., and Ranville, J. F. (2012). Detecting nanoparticulate silver using single-particle inductively coupled plasma-mass spectrometry. Environ. Toxicol. Chem. 31, 115–121. doi: 10.1002/etc.719
Navarro, E., Baun, A., Behra, R., Hartmann, N. B., Filser, J., Miao, A.-J., et al. (2008). Environmental behavior and ecotoxicity of engineered nanoparticles to algae, plants, and fungi. Ecotoxicology 17, 372–386. doi: 10.1007/s10646-008-0214-0
Oriekhova, O., and Stoll, S. (2019). Heteroaggregation of CeO2 nanoparticles in presence of alginate and iron(III) oxide. Sci. Total Environ. 648, 1171–1178. doi: 10.1016/j.scitotenv.2018.08.176
Pace, H. E., Rogers, N. J., Jarolimek, C., Coleman, V. A., Gray, E. P., Higgins, C. P., et al. (2012). Single particle inductively coupled plasma-mass spectrometry: a performance evaluation and method comparison in the determination of nanoparticle size. Environ. Sci. Technol. 46, 12272–12280. doi: 10.1021/es301787d
Pace, H. E., Rogers, N. J., Jarolimek, C., Coleman, V. A., Higgins, C. P., and Ranville, J. F. (2011). Determining transport efficiency for the purpose of counting and sizing nanoparticles via single particle inductively coupled plasma mass spectrometry. Anal. Chem. 83, 9361–9369. doi: 10.1021/ac201952t
Peters, R. J. B., Rivera, Z. H., van Bemmel, G., Marvin, H. J. P., Weigel, S., and Bouwmeester, H. (2014). Development and validation of single particle ICP-MS for sizing and quantitative determination of nano-silver in chicken meat. Anal. Bioanal. Chem. 406, 3875–3885. doi: 10.1007/s00216-013-7571-0
Peters, R. J. B., van Bemmel, G., Milani, N. B. L., den Hertog, G. C. T., Undas, A. K., van der Lee, M., et al. (2018). Detection of nanoparticles in Dutch surface waters. Sci. Total Environ. 621, 210-218. doi: 10.1016/j.scitotenv.2017.11.238
Phalyvong, K., Sivry, Y., Pauwels, H., Gélabert, A., Tharaud, M., Wille, G., et al. (2020). Occurrence and origins of cerium dioxide and titanium dioxide nanoparticles in the Loire River (France) by single particle ICP-MS and FEG-SEM imaging. Front. Environ. Sci. 8:141. doi: 10.3389/fenvs.2020.00141
Praetorius, A., Gundlach-Graham, A., Goldberg, E., Fabienke, W., Navratilova, J., Gondikas, A., et al. (2017). Single-particle multi-element fingerprinting (spMEF) using inductively-coupled plasma time-of-flight mass spectrometry (ICP-TOFMS) to identify engineered nanoparticles against the elevated natural background in soils. Environ. Sci. Nano 4, 307. doi: 10.1039/C6EN00455E
Reed, R. B., Martin, D. P., Bednar, A. J., Montaño, M. D., Westerhoff, P., and Ranville, J. F. (2017). Multi-day diurnal measurements of Ti-containing nanoparticle and organic sunscreen chemical release during recreational use of a natural surface water. Environ. Sci. Nano 4, 69. doi: 10.1039/C6EN00283H
Roy, S., Gaillardet, J., and Allègre, C. J. (1999). Geochemistry of dissolved and suspended loads of the Seine River, France: anthropogenic impact, carbonate and silicate weathering. Geochim. Cosmochim. Acta 63, 1277–1292. doi: 10.1016/S0016-7037(99)00099-X
Salminen, R., Batista, M. J., Bidovec, M., Demetriades, A., De Vivo, B., De Vos, W., et al. (2005). Geochemical Atlas of Europe. Part 1: Background Information, Methodology and Maps. Espoo: Geological Survey of Finland.
Serpone, N., Dondi, D., and Albini, A. (2007). Inorganic and organic UV filters: their role and efficacy in sunscreens and suncare products. Inorganica Chim. Acta 360, 794–802. doi: 10.1016/j.ica.2005.12.057
Tharaud, M., Gardoll, S., Khelifi, O., Benedetti, M. F., and Sivry, Y. (2015). UFREASI: user friendly elemental data processing. A free and easy-to-use tool for elemental data treatment. Microchem. J. 121, 32–40. doi: 10.1016/j.microc.2015.01.011
Tharaud, M., Gondikas, A. P., Benedetti, M. F., von der Kammer, F., Hofmann, T., and Cornelis, G. (2017). TiO2 nanomaterials detection in calcium rich matrices by spICPMS. A matter of resolution and treatment. J. Anal. At. Spectrom. 32, 1400–1411. doi: 10.1039/C7JA00060J
Thio, B. J., Zhou, D., and Keller, A. A. (2011). Influence of natural organic matter on the aggregation and deposition of titanium dioxide nanoparticles. J. Hazard. Mater. 189, 556–563. doi: 10.1016/j.jhazmat.2011.02.072
Topuz, E., Sigg, L., and Talinli, I. (2014). A systematic evaluation of agglomeration of Ag and TiO2 nanoparticles under freshwater relevant conditions. Environ. Pollut. 193, 37–44. doi: 10.1016/j.envpol.2014.05.029
Topuz, E., and Talinli, I. (2015). Agglomeration of Ag and TiO2 nanoparticles in surface and wastewater: role of calcium ions and of organic carbon fractions. Environ. Pollut. 204, 313–323. doi: 10.1016/j.envpol.2015.05.034
Van Hoecke, K., De Schamphelaere, K. A. C., Van der Meeren, P., Smagghe, G., and Janssen, C. R. (2011). Aggregation and ecotoxicity of CeO2 nanoparticles in synthetic and natural waters with variable pH, organic matter concentration and ionic strength. Environ. Pollut. 159, 970–976. doi: 10.1016/j.envpol.2010.12.010
Van Hoecke, K., Quik, J. T. K., Mankiewicz-Boczek, J., De Schamphelaere, K. A., Elsaesser, A., Van der Meeren, P., et al. (2009). Fate and effects of CeO2 nanoparticles in aquatic ecotoxicity tests. Environ. Sci. Technol. 43, 4537–4546. doi: 10.1021/es9002444
Virkutyte, J., Al-Abed, S. R., and Dionysiou, D. D. (2012). Depletion of the protective aluminum hydroxide coating in TiO2-based sunscreens by swimming pool water ingredients. Chem. Eng. J. 191, 95–103. doi: 10.1016/j.cej.2012.02.074
Wang, J.-L., Alasonati, E., Tharaud, M., Gelabert, A., Fisicaro, P., and Benedetti, M. F. (2020). Flow and fate of silver nanoparticles in small French catchments under different land-uses: the first one-year study. Water Res. 176, 115722. doi: 10.1016/j.watres.2020.115722
Westerhoff, P., Song, G., Hristovski, K., and Kiser, M. A. (2011). Occurrence and removal of titanium at full scale wastewater treatment plants: implications for TiO2 nanomaterials. J. Environ. Monit. 13, 1195–1203. doi: 10.1039/c1em10017c
Keywords: engineered (nano)-particles, suspended particulate matter (SPM), TiO2, CeO2, FEG-SEM, elemental ratio, single-particle ICPMS, natural river water
Citation: Phalyvong K, Sivry Y, Pauwels H, Gélabert A, Tharaud M, Wille G, Bourrat X, Ranville JF and Benedetti MF (2021) Assessing CeO2 and TiO2 Nanoparticle Concentrations in the Seine River and Its Tributaries Near Paris. Front. Environ. Sci. 8:549896. doi: 10.3389/fenvs.2020.549896
Received: 07 April 2020; Accepted: 02 December 2020;
Published: 11 February 2021.
Edited by:
Denise M. Mitrano, ETH Zürich, SwitzerlandReviewed by:
Danielle Slomberg, UMR7330 Center Européen de Recherche et d'enseignement de Géosciences de l'environnement (CEREGE), FranceJerome Labille, Aix-Marseille Université, France
Copyright © 2021 Phalyvong, Sivry, Pauwels, Gélabert, Tharaud, Wille, Bourrat, Ranville and Benedetti. This is an open-access article distributed under the terms of the Creative Commons Attribution License (CC BY). The use, distribution or reproduction in other forums is permitted, provided the original author(s) and the copyright owner(s) are credited and that the original publication in this journal is cited, in accordance with accepted academic practice. No use, distribution or reproduction is permitted which does not comply with these terms.
*Correspondence: Yann Sivry, c2l2cnlAaXBncC5mcg==