 Anna Murgatroyd*
 Jim W. Hall†
- Environmental Change Institute, University of Oxford, Oxford, United Kingdom
Faced with the prospect of climate change and growing demands for water, water resources managers are increasingly examining the potential for inter-basin water transfers to alleviate water shortages. However, water transfers are vulnerable to large-scale spatially coherent droughts which may lead to water shortages in neighboring river basins at the same time. Under climate change, increasingly severe droughts are also expected to have greater spatial extent. We have integrated climate, hydrological and water resource modeling to explore the resilience of new transfer schemes between two neighboring water companies in Southern England. An extended historical record of river flows and large ensemble of future flows derived from climate simulations were used to explore the effects of spatial and temporal drought variability. The analysis examines meteorological, hydrological and water resource drought events and how the spatial characteristics of these droughts may change with different transfer arrangements. Results indicate that all drought types examined are expected to increase in frequency and intensity throughout the twenty-first century, but a new transfer has the capability to increase the resilience of water supplies. The analysis also highlights the importance of testing new water infrastructure against drought events that are more extreme and have different spatial patterns to those in historical records, demonstrating the value of scenario-based approaches to adaptive water resource planning.
Key Points
• Methodology to test resilience and performance of transfer infrastructure to meteorological and hydrological drought events in future climates.
• Without adaptation, probability of severe water restrictions on any given day is projected to increase by 266% in the receiving region by 2099.
• Some transfer infrastructure alleviates the impact of climate change, but this depends upon available storage in the receiving region.
Introduction
The changing climate and growth in water consumption poses new threats to water resource systems (Intergovernmental Panel on Climate Change, 2013), affecting the management of water resources (Ehsani et al., 2017) and increasing the risk of water shortages (Borgomeo et al., 2014). Notwithstanding large uncertainties in climate models, climate change is projected to alter the global hydrological cycle and transform the balance between evapotranspiration, runoff and precipitation (Liu et al., 2012). Precipitation trends and interannual variability have been shown to strongly control the water-balance (Ukkola and Prentice, 2013). Changes in precipitation patterns are therefore likely to impact the amount of water available for human use, with the potential to exacerbate droughts and associated water scarcity in water stressed areas throughout the twenty-first century (Connell-Buck et al., 2011). Previous studies suggest that drought frequency and severity are important for water supply (Marsh et al., 2007), but that historical droughts provide a poor basis for future planning because the historical record is restricted to a handful of drought events with specific spatial and temporal characteristics (Watts et al., 2015). Feedbacks between water management operations and drought are also considered important for maintaining reliable water supplies (He et al., 2017), with studies revealing that human activities influence the probability of extreme hydrological drought (van Loon et al., 2016), and manipulate the characteristics of drought along river networks (Tijdeman et al., 2018; van Oel et al., 2018; Wu et al., 2018). However, these studies are also limited to drought periods that exist in the historical record.
To ensure the resilience of water supply systems in an uncertain future, it is necessary to test the performance of water systems against a range of climatological, hydrological and socio-economic scenarios. This is particularly important for inter-basin water transfers, which rely on a reliable supply of water from one region to another. Inter-basin transfers are defined as the “transfer of water from one geographically distinct river catchment, or basin to another, or from one river reach to another” (Davies et al., 1992), and have been widely used in an attempt to artificially improve water security in water scarce areas. In 2008, ~14% of global water withdrawals were transported via transfers; a statistic which is estimated to increase to 25% by 2025 (Gupta and van der Zaag, 2008). The design of water transfers can vary considerably depending on the needs of the importing and exporting regions, with the principal transfer types classified as permanent, short-term, temporary, reclaimed, water bank, or “wheeled” (Lund and Israel, 1995b). The focus of this study is on system capacity expansion through permanent inter-basin transfers, which are designed with the aim to (i) increase capability to meet demands, and (ii) improve long-term water system reliability.
Several efforts have been made to understand the value of inter-basin water management in alleviating water supply shortages during historical drought events. Cooperative transboundary management of water resources in the Blue Nile Basin has been shown to improve water security during drought events, but careful coordination is required to avoid harmful impacts to downstream water users (Wheeler et al., 2018). In the western US, transfers have played an important role in managing water resources, with short-term emergency water transfers providing rapid response to emergency conditions during the 1991 and 1992 Californian droughts (Lund and Israel, 1995b), and cost-effective spot-market water transfers contributing to California's pool of traditional water supplies (Lund and Israel, 1995a). At a continental scale, India's National River Linking Plan aims to resolve national water scarcity issues by creating an interconnected water grid that transfers water between 37 rivers (Purvis and Dinar, 2020). The ambitious plan has received mixed reviews, with concerns raised regarding the geomorphological response to infrastructural changes and forced displacement of local communities (Gupta and van der Zaag, 2008). As with other capacity expansion options, large scale transfers offer trade-offs between cost, revenue and reliability for the water managers (Zeff et al., 2014), with different inter-utility transfer agreement mechanisms offering risk reduction for both the water buyer and seller (Lund and Israel, 1995b; Caldwell and Characklis, 2013). Careful consideration of the impact of contractual transfer agreements on the environment is also key, with licensing agreements potentially benefiting consumers at the expense of increased risk to riverine habitats (O'Keeffe and De Moor, 1988; Wildlife Countryside Link, 2016; San-Martín et al., 2020).
Permanent inter-basin water transfers incur costs and benefits, the balance of which differs for the water exporter and the water importer (Gupta and van der Zaag, 2008). As indicated above, these can include large financial costs incurred from construction and operation of transfer infrastructure, adverse ecological impacts, sustainability issues, and uncertain economic efficiencies afflicting existing transfer schemes (Purvis and Dinar, 2020). Whilst they are designed to improve security of supply, there are inevitable limits to the reliability of water transfers as well as potentially negative impacts. For this reason, water planners must test proposed transfer infrastructure and operating policies against a wide range of water supply, demand and socio-economic scenarios that contain conditions beyond what has been observed within historical records.
When designing transfer schemes, it is imperative that water planners understand the spatial coherence and intensity of drought events in neighboring basins, ensuring that adaptation in one region does not lead to water shortages in another. This is important because transfers from a source location vulnerable to the same extreme drought events as the receiving location are more likely to fail than transfers between locations that have a low probability of coincident drought (Rahiz and New, 2012). For example, analysis of climatic-hydrological relationships in the headwaters of the Tagus River in central Spain revealed that over-use of the Tagus-Segura Water Transfer in periods containing severe climatic droughts resulted in declined natural flow and lower reservoir levels in the transfer source region (Lorenzo-Lacruz et al., 2010). Further mismanagement of the transfer during critical periods affected economic activities in the transfer source region (Hernández-Mora and Del Moral, 2015), altered the downstream river environment through reduced hydraulic connectivity, and fuelled socio-political conflicts between the donor and recipient basins (San-Martín et al., 2020).
Previous work has examined the reliability of small treated transfers in the eastern United States against (i) historical observations (Palmer and Characklis, 2009) and (ii) stochastic streamflow data created using historical records (Kirsch et al., 2013; Zeff et al., 2016). For the purpose of exploratory modeling, artificial streamflow time series with increased frequency and intensity of droughts have also been used, generated by modifying streamflow generators (Herman et al., 2016). This research incorporates some aspects of potential future climates into transfer reliability assessments, relying on extreme events in the historical record to “stress test” adaptation options. More recent work examined the influence of within-basin raw water transfer (RWT) schemes on reliability and financial objectives when simulated against the future hydrologic conditions, with analysis revealing that RWT can reduce requirements for demand management interventions and inter-basin treated transfers, and contribute to lower regional financial risk (Gorelick et al., 2018). However, the eastern US-based studies do not fully account for spatial characteristics of drought types that may help to explain the ways in which transfers can prevent (or aggravate) water resource droughts during periods of extreme climate conditions and increased demand pressures. As Gorelick et al. (2018) hypothesize, the utility of raw water transfers are likely to depend on many features of the transfer regions, including available water storage, infrastructure, demand growth rates, and spatial correlation of hydrologic events. Furthermore, the studies only investigate transfers that move small volumes (<100 Ml/d) of water, the conclusions of which may not be scalable to larger, inter-basin untreated water transfers. There is therefore considerable scope to investigate the operation of high-volume inter-basin transfers under future scenarios of change, and the impact these transfers have on water system performance in both exporting and importing regions.
The new large ensembles of climate model simulations used in this study, along with extended series of historical observations and demand growth scenarios, provide the opportunity to test the joint probability of coincident droughts more thoroughly than has hitherto been the case. We combine this with simulation modeling of the operation of water transfers, including a variety of strategies for how risks may be shared between neighboring water utilities. This study aims to (i) explore the resilience of new high-volume inter-basin water transfer infrastructure with different operating agreements to severe meteorological and hydrological drought events, and; (ii) evaluate the level of risk and reliability of a given version of transfer infrastructure during drought events and water demand pressures not present in the historical record. The novel methodology proposed here demonstrates the importance of using large climate ensembles containing a wide range of climatological extremes in long term water resource planning, providing a mechanism to explore the joint occurrence of different types of drought events and associated consequences on transfer operation, cooperation and reliability.
The following analysis focuses on new unidirectional transfer infrastructure in south east England, connecting two private water companies, Severn Trent Water and Thames Water, who together supply more than 18 million people a year (Severn Trent, 2019; Thames Water, 2019a).
Study Area, Data, and Modeling Framework
Study Area
This study investigates the spatial characteristics of meteorological, hydrological and water resource drought in Southern England (Figure 1). Meteorological and hydrological drought are calculated for the Severn to Deerhurst and Thames to Kingston catchments and are consistent with the basins used in the UKCP09 climate projections (UKCP09, 2009) and the Severn Thames Transfer Study area (Rudd et al., 2018).
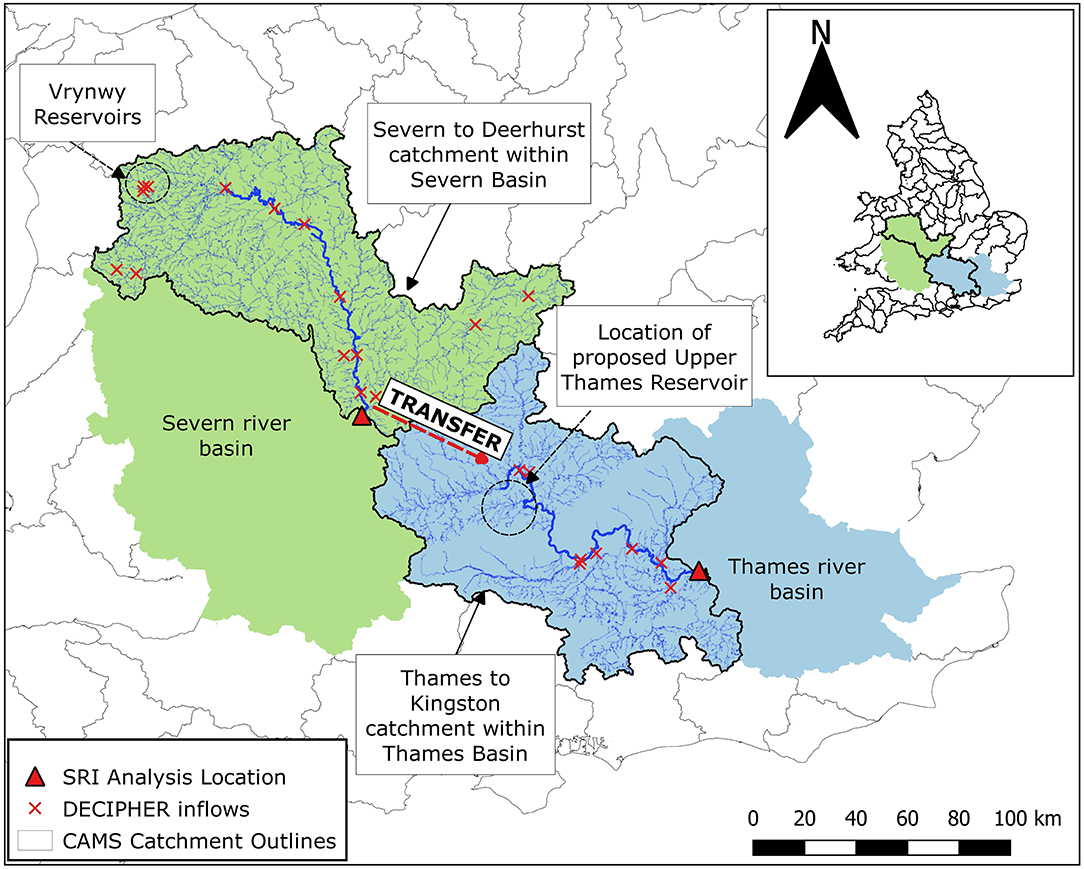
Figure 1. Study area.
Climate characteristics in southern England vary between regions, with a gradient of precipitation from west to east caused by prevailing westerly weather systems (Fleig et al., 2011). This is reflected in observations of average annual precipitation, which was 724 mm in the Thames catchment to Kingston and 793 mm in the Severn catchment to Deerhurst from 1961 to 1990 (NERC CEH Wallingford, 2018). Historical precipitation records reveal that meteorological droughts commonly occur in both the Severn and Thames basins, but the impact of droughts vary depending on the duration, severity and management of the event (Vidal and Wade, 2009). In south east England, drought events are attributed to southerly weather fronts bringing warm air from continental Europe (Fleig et al., 2011). Droughts in the west can be explained by severe rainfall deficiencies (Marsh, 2007; Marsh et al., 2007) and circulation anomalies in the North Atlantic Oscillation (Rahiz and New, 2012).
Several studies have explored the spatial and temporal patterns of projected twenty-first century meteorological droughts in the UK (Fowler et al., 2007; Vidal and Wade, 2009; Burke et al., 2010; Rahiz and New, 2013). Whilst estimations of future precipitation at regional scale are considerably uncertain (Hawkins and Sutton, 2011), general patterns of change can be inferred from ensembles of climate projections. For example, the UK Climate Projections 2009 (UKCP09; Murphy et al., 2009) ensemble estimate median decreases in summer precipitation in southern England of −40% (confidence interval of −65–6%). Likewise, results from the Weather@Home modeling experiment by Guillod et al. (2018) reveal large decreases in summer precipitation across the UK for time periods in the middle and end of the twenty-first century. Rahiz and New (2013) present an analysis of twenty-first century droughts in the UK using monthly precipitation projections from the perturbed-physics ensemble, HadRM3-PPE-UK, to estimate a drought severity index. Results show an ensemble-mean increase in drought intensity, drought covariance and frequency of drought months for the Severn and Thames regions in the second half of the twenty-first century. The findings support earlier work by Vidal and Wade (2009), Fowler et al. (2007), and Fowler and Kilsby (2004) who also report increased drought risk in south east England. Overall, future projections suggest that by the end of the century droughts could be more spatially coherent, with large meteorological droughts in south east England affecting multiple catchments and threatening both existing and proposed water supply infrastructure.
Analysis of historical flow records reveal few changes in the pattern of hydrological drought and low flows in the UK in the twentieth century (Hannaford and Buys, 2012; Watts et al., 2015; Rudd et al., 2017). Streamflow records from the Severn and Thames basins document historic hydrological drought events, with 15 major droughts in the Thames at Kingston and 17 in the Severn at Deerhurst between 1963 and 2015 (Rudd et al., 2018). These droughts varied in duration, severity and intensity, and had wide ranging impacts on the water sector. The 2004–2006 drought, for instance, impacted water supplies to over 13 million water consumers in south east England. Regional spring failures, low river flows, decreased stream connectivity and depleted groundwater levels resulted in increased stress in riverine environments and widespread implementation of drought mitigation measures. In the period between November 2004 and August 2006, total river flow in the Thames Basin fell to 56% of the long term average, while flows in the Severn dipped to only 74% of the long term average (Marsh et al., 2007). With careful management, water transferred from the Severn (or other less stressed areas) may have helped to alleviate environmental and demand pressures in the Thames Basin during this period.
Multiple methods exist to investigate future changes to streamflow and hydrological drought. For example, Hannaford et al. (2011), developed a “drought from drought” forecasting methodology to identify streamflow droughts in Europe based on drought developing in neighboring regions. Other studies have looked into the effects of climate change on groundwater resources in southern England (Jackson et al., 2011), evaluated the use of perturbed physics ensemble of climate models on water resource planning in south west England (Lopez et al., 2009), explored uncertain changes in low flows in the River Thames using statistical downscaling techniques and hydrological modeling (Wilby and Harris, 2006), and conducted multi-model assessments of water resources in the Thames catchment (Manning et al., 2009). A significant study of future changes to hydrology in Great Britain was conducted by Prudhomme et al. (2013), who developed a set of 11 transient daily river flow projections from 1951 to 2098 for 282 river sites using the HadRM3-PPE ensemble and a single hydrological model. Results indicate that spring and summer flows may decrease by −40 to −80% for most of the UK by the 2050's, whilst in autumn river flow may experience up to −80% decreases in the south and east of the country. Changes to mean annual flow were projected to be greatest in the west, with a reduction of up to −40%. However, the baseline simulations showed large deviations from observations in the pre-2000 reference period, due to climate modeling uncertainty and difficulties in validating naturalized flows in highly regulated systems, particularly during periods of low flow (Prudhomme et al., 2013). Moreover, 11 flow series were not a sufficiently large sample to robustly characterize the spatial statistical properties of extreme droughts. The more recent study by Rudd et al. (2019) uses ensembles of twenty-first century emissions driven climate model data to investigate future changes in river flow and soil moisture droughts in catchments across Britain. Results from the threshold based approach indicate increased peak intensity, severity, duration and spatial extent of hydrological droughts in the south east by the end of the century, attributed to overall drying and increased potential evapotranspiration (Rudd et al., 2019).
Recent work has also projected increases in the frequency and intensity of coincident hydrological droughts—the likelihood of drought events occurring simultaneously in neighboring basins (Rahiz and New, 2012)—in the Severn and Thames, with the likelihood of droughts in the Thames affecting conditions in the Severn increasing into the future (Rudd et al., 2018). Correspondingly, the likelihood of non-coincident drought (when the Thames is in drought, but the Severn is not) is projected to decrease. The results emphasize the importance of evaluating future transfer infrastructure relying on water supply from the Severn to the Thames, as periods when the Thames is water stressed are more likely to coincide with periods when the Severn may not be able to spare water via the transfer scheme.
Management of water resources in the Severn and Thames Regions are overseen by the privately owned water companies, Severn Trent Water and Thames Water. Thames Water primarily supplies water from off-line raised reservoirs near population centers that are filled directly from the River Thames and from groundwater sources. Severn Trent's water supply is regulated by upstream on-line storage reservoirs. Operation of the reservoirs and river abstractions are regulated by operating agreements, as described in Section water resource drought analysis. The companies must report periodically to the economic and environmental regulators, OFWAT and the Environment Agency, respectively, submitting investment plans outlining how supply to water customers will be secured into the future. In 2013, Thames Water was classified as being under serious water stress due to climate change and increasing population pressures. In contrast, Severn Trent Water was only moderately stressed (Environment Agency and DEFRA, 2013). For this reason, a strategic water transfer option between the Severn and Thames basins is under review, with evaluations ongoing of its feasibility to provide reliable water supply for Thames Water customers and the wider south east region during periods of high water stress (Thames Water, 2019b).
Data and Models
This section provides an overview of the data and models used in this study. As parts of the data and modeling framework have been previously been applied elsewhere (Guillod et al., 2017, 2018; Coxon et al., 2019; Dobson et al., 2020), Sections historical precipitation to modeled flows provide abbreviated descriptions of the climatological and hydrological modeling framework. Sections water resource modeling, groundwater flows, and water demand and water transfer strategies describe the water system model and infrastructure strategies to be simulated using historical and projected scenarios.
Historical Precipitation
Historical precipitation time series used in this study were obtained from the Center for Ecology and Hydrology (CEH) GEAR 5 km resolution historical monthly areal rainfall dataset for the United Kingdom (1890–2017) (Tanguy et al., 2019). Grid points for analysis were selected if they fell within the Thames to Kingston and Severn to Deerhurst catchment boundaries (Figure 1). Total precipitation for each month in the 127-years period was calculated by adding the precipitation at each grid point within the two catchment boundaries. This resulted in two aggregated catchment time series of monthly precipitation.
Modeled Precipitation
A large set of weather sequences from the Weather@Home (W@H) platform are used in this study (Massey et al., 2015; Guillod et al., 2017, 2018), which are generated using a Global Circulation Model (HadAM3P) downscaled with the Met Office Regional Climate Model, HadRM3p, and driven with historic (HasISST) and projected (CMIP5) sea surface temperatures (SST) and sea ice. W@H is a “citizen science” project that benefits from the unused computing power of thousands of participants to generate large ensembles of climate model runs. HadAM3P is suited to the W@H platform, representing atmospheric dynamics in the mid-latitudes well-compared to other GCMs (Mitchell et al., 2017). HadRM3p is also appropriate for the current application, having reproduced accurate distributions of daily mean temperature and precipitation over Europe (Massey et al., 2015). In recent years the Weather@Home modeling platform has been used to study the impact sea surface temperature driven extreme weather events in England (Haustein et al., 2016), heat related mortality in London and Paris (Mitchell et al., 2016), flood damage in southern England (Schaller et al., 2016), and national scale drought severity and intensity (Rudd et al., 2019; Dobson et al., 2020). The Weather@Home climate sequences have also been used successfully in a risk-based planning framework in the Thames Basin, reproducing historical weather observations well (Borgomeo et al., 2018).
The Weather@Home dataset contains precipitation (P) and evapotranspiration (PET) time series at a 25 km resolution, which is then downscaled to 5 km resolution. Precipitation sequences are bias corrected using a linear approach with monthly bias correction factors. The small biases in temperature were not corrected. A complete description of the bias-correction methodology, validation process and resulting data is presented in Guillod et al. (2017, 2018). In summary, the bias correction offers correction for seasonal biases in mean precipitation, but does not affect higher-order moments of the rainfall distribution (Guillod et al., 2018).
This study uses modeled P and PET for the Severn and Thames catchments from the Weather@Home dataset, grouped into three ensembles:
• 100 realizations of the Baseline period (1975–2000), generated using different initial atmospheric conditions, and historic SST and sea ice records from HasISST (Rayner et al., 2003; Titchner and Rayner, 2014);
• 100 realizations of the Near Future period (2020–2049), generated using 50th percentile SST and sea ice projections [CMIP5, (Taylor et al., 2012)] under Representative Concentration Pathway (RCP) 8.5 (Meinshausen et al., 2011);
• 100 realizations of the Far Future period (2070–2099), generated using 50th percentile SST and sea ice projections under RCP8.5.
As with the historical precipitation time series, total precipitation for each catchment is calculated by summing individual precipitation at grid points within the catchment boundaries. The future ensembles are used here to examine the impact of climate change on meteorological, hydrological and water resources drought. Because RCP8.5 represents the upper bound of projected global emissions scenarios, it is appropriate for climate impact assessments focussing on extreme conditions.
Modeled Flows
Rainfall-runoff modeling was performed using the DECIPHeR (Dynamic fluxEs and ConnectIvity for Predictions of HydRology) model, developed by Coxon et al. (2019). DECIPHeR is a hydrological modeling framework developed to simulate and predict flows for catchments across multiple spatial scales with different hydrological characteristics. The hydrological model consists of sub-catchment-based hydrological response units (HRUs) which group hydrologically similar areas according to landscape attributes and spatial variability of climatic inputs. HRUs reduce model run time (see Appendix 1 in Supplementary Information), thus allowing for extensive simulations driven by large ensembles of climate conditions.
The DECIPHeR modeling framework was first used by Coxon et al. (2019) to simulate historic flows at 1,366 catchments across Great Britain, performing acceptably against four metrics of model performance. To calibrate the model, historic daily observed P (Tanguy et al., 2019) and PET (Robinson et al., 2016) were used to run 10,000 model simulations with Monte Carlo sampled parameter sets. Evaluation of the 10,000 simulations showed good model performance across the 1,366 flow locations, with 92% of catchments achieving a Nash-Sutcliffe efficiency score > zero (Coxon et al., 2019).
DECIPHeR has since been used to generate ensembles of historical and future naturalized flows for 338 catchments across England and Wales (Dobson et al., 2020). The flows were generated using historic daily observed P (Tanguy et al., 2019), PET (Robinson et al., 2016), and the 10,000 parameter sets from Coxon et al. (2019), and were evaluated against daily naturalized flows supplied by England's Environment Agency. The best parameter sets for each catchment were identified according to NSE and logNSE scores, and used to simulate daily flows for the 338 catchments under historic and future climate change projections. This study follows the same hydrological modeling framework outlined by Dobson et al. (2020), using the best DECIPHeR parameter set for the Thames and Severn basins to simulate historic and future flows. Daily historic flows were simulated using CEH GEAR daily observed P (Tanguy et al., 2019) and PET (Robinson et al., 2016), whilst daily flows for the Baseline (1975–2000), Near future (2020–2049) and Far Future scenarios were simulated using the Weather@Home projections described in Section modeled precipitation. Appendix 1 lists the NSE and logNSE of the calibrated historic DECIPHeR flows for the Thames at Teddington (station 39001) and Severn at Saxons Lode (station 54032; Severn at Deerhurst was not included in the model evaluation).
Water Resource Modeling, Groundwater Flows, and Water Demand
The water system model used in this study of the Severn Trent and Thames Water supply systems has been extracted and adapted from the national water resource model, WREW, presented in Dobson et al. (2020). The Severn Trent Water and Thames Water water resource systems are represented by a series of nodes and arcs in the minimum cost capacitated network flow program model, WATHNET-5 (Kuczera, 1992). The arcs represent flow pathways (rivers and pipes) that connect stream, reservoir, groundwater, demand, and waste nodes. In simulation, the model solves a mass balance optimization problem at each time-step, moving water along arcs within the network to minimize demand shortfalls. Each arc is assigned a positive, neutral (zero) or negative cost, which influences the likelihood of flow through an arc. For example, if one water source is more preferable than another it will be assigned a negative cost. Environmental flow arcs are assigned a negative cost to increase the likelihood of a minimum required flow (MRF) being met. Demand shortfall arcs are assigned a very high positive cost, as an incentive for the network flow program to ensure demand is satisfied. In some scenarios a trade-off between demand shortfalls and MRF may emerge. The assumptions made regarding arc cost influence the movement of water throughout the system network. The sensitivity to changes in arc cost assignments are not explored in this study; a notable limitation of the modeling experiment. However, the water system model is a product of collaboration between the University of Oxford and key stakeholders in the UK water industry. Previous work has shown that the model is capable of producing outputs similar to those achieved using water company models (Dobson et al., 2020). It is therefore well-suited to climate impact studies such as the one presented in this paper.
The river flows generated by DECIPHeR are used as stream inflows, represented by the crosses in Figure 1. Groundwater inflows are set at the license abstraction limit, defined by the Environment Agency (Environment Agency, 2013). The reservoirs can directly store stream inflows or by pumped abstractions from rivers, depending on the nature of the infrastructure. The demand nodes act as sinks in the network and represent the demand required from municipal, industrial and agricultural water users. Between 1999 and 2014, agriculture used 3.8% of total surface water abstractions in the Thames, and 2.0% in the Severn. In the same period, public water supply accounted for 88.0% of abstractions in the Thames, and 68.0% in the Severn. The remaining water was used by industry or other abstractors (Environment Agency, 2013). Historical demand is estimated using dry year annual average distribution input at water resource zone level and annual demand profiles, and paired with the historic CEH GEAR-DECIPHeR flow scenario. Ten scenarios of future municipal water demand for each water company are estimated from the dry year annual average distribution input at water resource zone level and scaled according to Severn Trent and Thames Water water resource planning tables and demand profiles (Severn Trent, 2019; Thames Water, 2019a). Differences in projected demand scenarios typically result from (i) different rates of population growth and (ii) changes in per capita consumption (Beh et al., 2014). The range of projected demand is presented in Appendix 2. Each future demand scenario is coupled with the 100 Baseline, Near Future and Far Future DECIPHeR flow scenarios, to create a library of 3,000 scenarios (total of 85,000 simulation years). WATHNET-5 is used to simulate the water resource system at a daily time-step under different climate and demand scenarios. Simulation output can include demand deficits, end of step reservoir storage and frequency of water restrictions imposed on customers.
Water Transfer Strategies
The main infrastructure option to be evaluated is the proposed raw water transfer from Deerhurst on the River Severn to a location in the Upper Thames catchment. Five transfer capacities are evaluated. The first four tested [300, 500, 700, and 900 mega liters per day (Ml/d)] are limited by the infrastructure capacity to move the water (i.e., the size of the pipe). The 300 and 500 Ml/d transfers are based on the Water Resource Management Plan 2019 (WRMP19) planning options (Thames Water, 2019a), with the larger 500 Ml/d capacity transfer being supported by redeployment of 200 Ml/d of water from the Vyrnwy Reservoir in the Severn headwaters. The 700 and 900 Ml/d transfers are evaluated to assess the impact of larger capacity transfers during future drought scenarios, though these larger transfers are not currently being considered by Thames Water or Severn Trent Water due to environmental challenges. Transfer capacities of this size are uncommon, although not unheard of in water resource planning assessments. For example, following the 2004–2006 drought an investigation was launched into large-scale water transfers in the UK, assessing the feasibility of a multi-pipe 1,100 Ml/d transfer from the northern Pennines (north west England) to London. Findings indicated that the financial cost of large-scale transfers would greatly exceed costs of regional capacity expansion options, but transfers of this scale may be necessary if water companies' existing resource management plans prove inadequate in the face of future water supply and demand pressures (Environment Agency, 2006). For context, 900 Ml equates to (i) ~0.3% of the combined volume of reservoirs in the Severn water supply system, and 0.41% of the combined reservoirs in Thames Water, and (ii) ~71% of historical daily demand in Severn Trent and 35% in Thames Water (estimated from simulation of the water system model from 1962 to 2015 using historic CEH GEAR climate sequences).
The final transfer option assumes unlimited capacity, so all flows above the 1,800 Ml/d MRF (Environment Agency, 2014) in the Severn at Deerhurst can be transferred to the Thames Basin. This option is included in the analysis (i) to identify the volumes of water that would be taken for use in the Thames Water system if no infrastructural, financial or environmental constraints existed, and (ii) to explore the impact this would have on hydrology and customer service in the Severn. Importantly, the strategy is purposefully experimental in design and bears no resemblance to real world transfers. The operation is coded to minimize the frequency with which the flows at Deerhurst fall below the MRF, and as a consequence may result in some days when flow fails to meet the MRF.
We also test strategies in which there is a new reservoir situated in the Upper Thames Basin, to explore the value of additional storage in the Thames Water system working in tandem with the transfer scheme. This reservoir (South East Strategic Reservoir) is also being considered by Thames Water as a feasible planning option to manage future climate change and demand side pressures (Thames Water, 2019a). The new reservoir has an initial storage of 75,000 Ml and the operating rules governing inflow into the reservoir and releases from the reservoir are based on rules used for the London reservoirs.
Three transfer operating rules are investigated. The first rule (unconditional) allows Thames Water to use the volume of water equivalent to total capacity of the transfer as frequently as is needed, limited only by water availability in the Severn basin. This rule ignores the consequences of taking water that could otherwise be used by Severn Trent Water and is consistent with Lund and Israel's definition of a permanent transfer, which “involves the acquisition of water rights and a change in ownership of the right” (Lund and Israel, 1995b). The second rule (conditional) only allows transfer of water left over in the Severn at Deerhurst, after all of the water requirements in Severn Trent have been satisfied. This rule is aligned with common riparian water rights, as Severn Trent does not need guarantee water availability for Thames Water, but should ensure that the flow and quality of transferred water remains acceptable (regardless of volume or timing). Rule two is designed to ensure that Severn Trent Water customers are not subject to decreased water supply in order to provide for Thames Water. The third rule (shared risk) follows the same principles of rule one, but also assumes that whenever Thames Water experience a severe water restriction, Severn Trent must impose an equivalent water restriction. This is to encourage full cooperation (i.e., maximum transfer deployment) between the two companies during periods of high drought risk in the Thames. Rule three does not follow traditional riparian rights doctrine and, like the unlimited transfer strategy, is experimentally designed to investigate the impact of this management style on water system performance under drought.
The transfer strategies are outlined in Table 1. In the water system model, the transfer arc connecting the Severn and Thames water resource systems is assigned a positive cost to ensure that water is only transferred when it is beneficial for the receiving region.
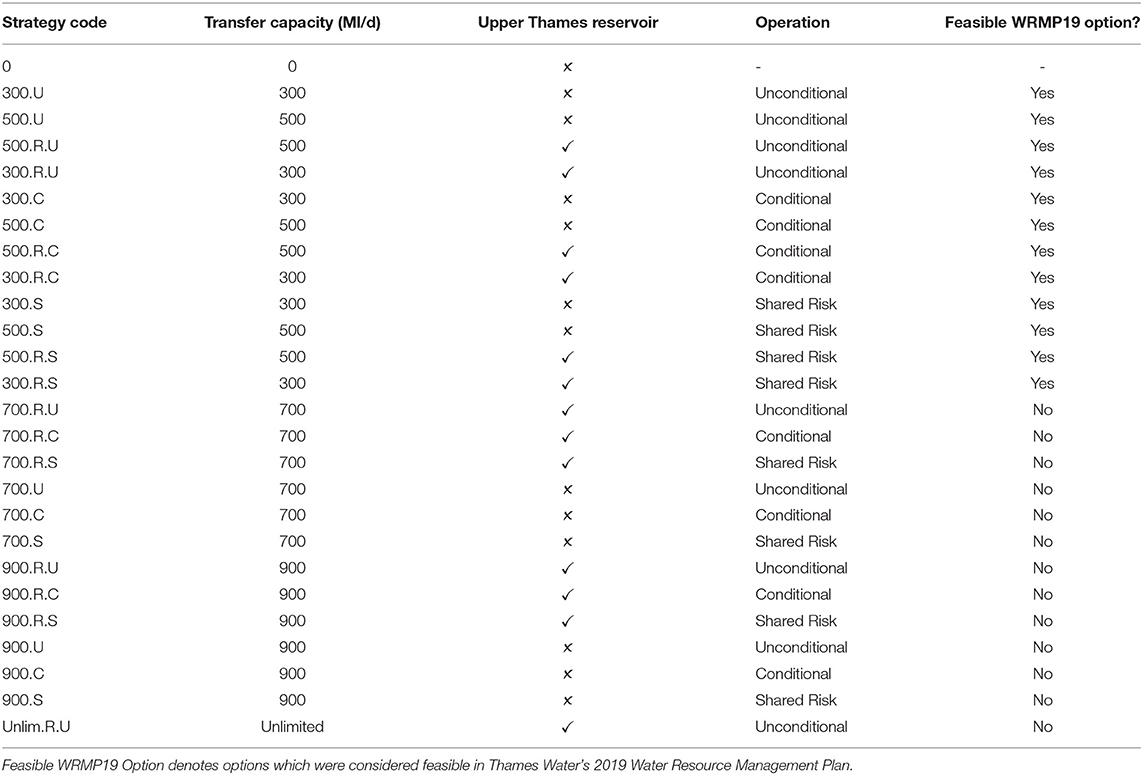
Table 1. Transfer strategies to simulate under flow and demand scenarios.
Methodology
Overview of Workflow
Figure 2 provides an overview of the workflow used in this study. The framework uses a large ensemble of climate scenarios containing a wide array of drought events and multiple demand scenarios. The workflow provides a mechanism to explore drought impacts on transfer reliability, water supply and water use restrictions. The methodology is also designed to investigate how spatial patterns of drought may change throughout the twenty-first century, and how this may impact cooperation between water companies operating in neighboring basins.
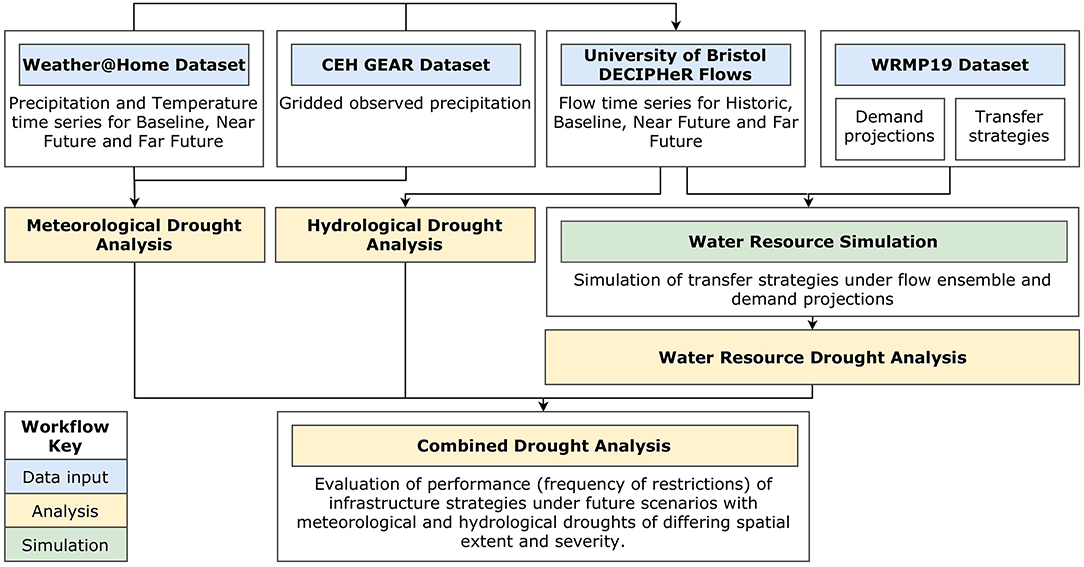
Figure 2. Workflow with data sources, scenarios, and model outputs.
Meteorological Drought Analysis
Standardized Precipitation Index (SPI) is used to classify meteorological drought within the two study catchments. The index identifies the relative departures of precipitation from normality for a given location, and has been widely used to identify drought events (Hannaford et al., 2011; Bayissa et al., 2018) and analyse the spatial patterns of drought (Vicente-Serrano, 2006; Fleig et al., 2011). The index is calculated following the sequence outlined by McKee et al. (1993), using a monthly precipitation time series (Appendix 3). Calculated SPI values are scale-independent, fluctuating between negative (dry periods) and positive (wet periods) values. This makes SPI ideal for spatial analyses of drought in across multiple locations.
SPI is commonly used as an indicator of drought intensity over a specific time period. Here, intensity is represented by the degree of precipitation deficit (i.e., the value when the index is below zero). The values can be classified to represent different categories of meteorological drought, as shown in Table 2. For short time-scales (1–6 months) the index is expected to fluctuate at a high frequency and is suitable for identifying soil moisture deficits and agricultural droughts. SPI fluctuates at a lower frequency for longer time-scales and is more indicative of changes to surface water resources (Edwards and Mckee, 1997). In the context of the framework presented here, we are interested in choosing an index time-scale that reflects the state of water resource supplies in the study area(s). This study therefore uses 12-months observation periods to classify meteorological drought. As Dobson et al. (2020) demonstrate in their spatial analyses of drought and water scarcity, a 12-months observation period is well-suited to identifying meteorological and hydrological droughts that impact water resource supplies in England and Wales (Dobson et al., 2020). In addition to this, 12-months lags are commonly used in drought analyses by water industry practitioners (e.g., Hunt and Wade, 2016). However, the proposed framework lends itself to additional investigation into the relationship between water system state and drought indices of a shorter period. For instance, shorter time-scales may be more relevant for regions without significant water supply storage infrastructure, as short-term rainfall will be more relevant for the planning issues faced by water managers.
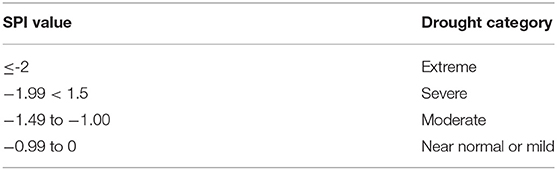
Table 2. Drought categories as defined by SPI value (McKee et al., 1993).
To calculate SPI, aggregated monthly precipitation series from the historic CEH GEAR and W@H data sets are first formatted for the two catchments. The GEAR dataset is used to define Gamma parameter estimates for averaging periods in both catchments, which are then used to calculate the cumulative distribution of the precipitation datasets and subsequently standardized precipitation indexes. The resulting dataset contains catchment specific SPI time series for the historic record and the W@H ensemble (total of 301 time series per catchment).
The method outlined by Rahiz and New (2012) is used here to examine the coincidence of major droughts in the Severn and Thames. This approach identifies scenarios within the ensemble containing meteorological droughts occurring simultaneously in both catchments that are equal to or worse than the 5, 10, and 25th percentile drought intensities in the Baseline ensemble. The library of coincident drought events is analyzed to provide an estimate of the probability of coincident drought for the Baseline, Near Future and Far Future ensembles and indicate how the spatial patterns of meteorological drought with different intensities may change into the future.
Hydrological Drought Analysis
Twelve-months Standardized Runoff-discharge Index (SRI) is used to identify hydrological drought events in the historical and future DECIPHeR flow ensembles. The process to calculate SRI is akin to the SPI calculation using a distribution to fit observed or modeled flow data. Research has shown that parameter distributions should well-represent seasonal streamflow regimes and extreme flows (Vicente-Serrano et al., 2012). This is especially important for studies using short-term drought indices (1-, 3-, and 6- months), which are more susceptible to seasonal changes. As this study examines 12-months lag SRI, it is not necessary to vary the distribution intra-annually to take into account seasonality.
In line with the process described in Section meteorological drought analysis, we use a Gamma distribution to calculate SRI. Previous research has used a Gamma distribution to define streamflow in the Feather River Basin in California (Shukla and Wood, 2008), and for multiple catchments across England and Wales (Dobson et al., 2020). Here, SRI is calculated at a 12-months lag for the Severn at Deerhurst (NRFA station 54110) and the Thames at Kingston (NRFA station 39001), which are the most downstream locations in each basin that can be represented in the DECIPHeR model. To obtain flows for the Severn at Deerhurst we aggregate data from two inflow points upstream of Deerhurst (Severn Bewdley incremental and Avon Incremental); for the Thames at Kingston we use the data from the Teddington Weir inflow point. A one-sample Kolmogorov-Smirnov (KS) test is used to ensure that a Gamma distribution is suitable to define streamflow and precipitation in the two study regions. The KS test evaluates the hypothesis that the calculated historic SRI and SPI time series come from a standard normal distribution (Appendix 3).
We use the historic CEH GEAR driven DECIPHeR flows (1962–2015) to define the Gamma parameter estimates used in the SRI calculation. This is because the recorded observed flow at Deerhurst gauging station contains only 17 years of flow (1995–2012) and has two extended periods of missing data in 2007 and 2011 (NERC CEH Wallingford, 2018). The resulting dataset contains catchment specific SRI time series for the historic record and the W@H ensemble (total of 301 time series per catchment).
Water Resource Drought Analysis
When reservoir levels are low, water companies can impose restrictions on water use as part of their drought plans. The frequency of water use restrictions of given levels of severity imposed upon customers is used as a metric of water shortages in the Severn Trent and Thames Water regions (Table 3). Level 1 and 2 restrictions are fairly modest and do not represent a significant hardship or economic loss to most water users, but Level 3 restrictions are more severe and Level 4 restrictions are considered to be extreme. Restrictions are imposed based on the current storage of key reservoirs within the water system (Figure 3) In Severn Trent Water, restriction level is determined by water levels of the Elan Valley and Derwent Water reservoirs; in Thames Water it is dependent on the combined water levels of the London Storage reservoirs. To avoid imposing unnecessary restrictions to their customers, Severn Trent Water can draw water from other reservoirs in the Severn system (Blithfield, Draycote, Clywedog, Carsington and Ogston, Melbourne, Cropston, and Thornton) before the Elan and Derwent reservoirs are allowed to fall below the thresholds for water restrictions. This is in contrast to the Thames system, which contains no other regulating reservoirs (Thames Water's Oxfordshire reservoir, Farmoor, cannot be used to alleviate water restrictions in London). We use the WATHNET-5 model to calculate the frequency of water restrictions being imposed in the two regions. The simulation results are then used to identify transfer strategies that reduce the probability of restrictions.
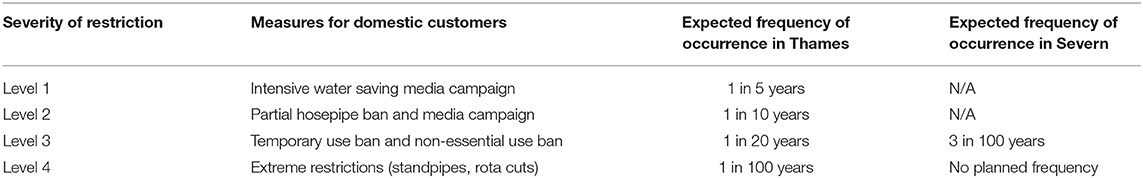
Table 3. Example of levels of water use restrictions to customers in Thames Water and Severn Trent Water (Severn Trent, 2019; Thames Water, 2019a).
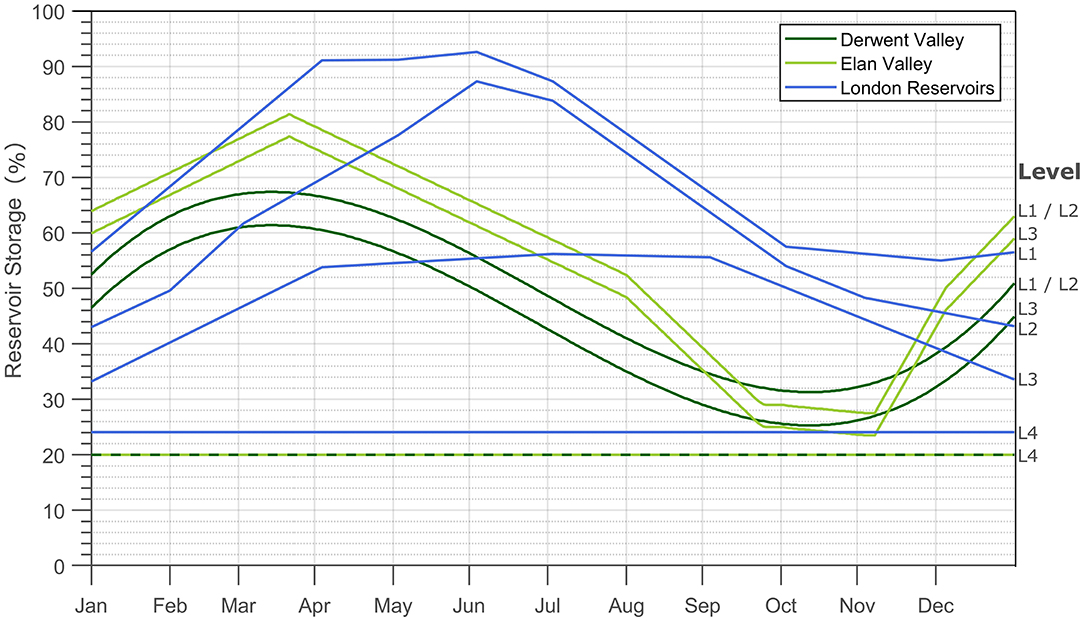
Figure 3. Control diagram for Derwent Valley, Elan Valley, and London Reservoirs showing reservoir levels resulting in water restrictions to public water customers.
Coincident water resource drought is calculated using a similar methodology as hydrological and meteorological coincident drought, identifying periods within the simulation when Severn Trent and Thames Water are exposed to water restrictions in the same month. Simulation will reveal how the occurrence of coincident water resource drought change with different transfer strategies through time.
Results
Meteorological Drought
Table 4 depicts the probability of drought months in the CEH GEAR and W@H ensembles with an SPI value equal to or worse than the 5, 10, and 25th percentiles in the W@H Baseline ensemble for each catchment. Here, values below the 5th percentile represent severe and extreme droughts, below the 10th percentile represent moderate drought (or worse), and below the 25th percentile represent mild drought (or worse). For the Severn to Deerhurst this includes drought months with an intensity equal to or < -1.84,−1.42, and−0.74, respectively, and in the Thames to Kingston months ≤ -1.57,−1.18, and−0.56, respectively. The results indicate that the number of months with SPI values worse than the Baseline ensemble will increase into the future for both catchments, more so for the Severn to Deerhurst than the Thames to Kingston. The results also suggest that the W@H Baseline ensemble contains fewer mild, moderate and severe meteorological drought events in the Severn than the CEH GEAR dataset (historic), but more in the Thames catchment.
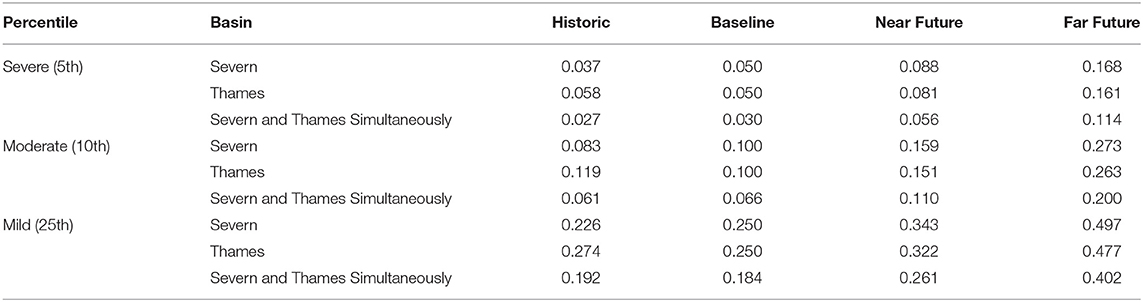
Table 4. Probability of months in historic (CEH GEAR), Baseline, Near Future, and Far Future ensembles with 12-months SPI values <W@H Baseline 5, 10, and 25th percentiles for Thames and Severn study areas, individually and simultaneously.
Table 4 also lists the probability of months in the W@H ensembles with an SPI value less than the W@H Baseline 5, 10, and 25th percentiles in both catchments in the same month. Coincident drought occurrence also increases into the future, with over 1 in 10 months in the Far Future ensemble experiencing a severe drought simultaneously in the Thames and Severn catchments. The frequency of mild droughts also increases into the future, with roughly 40% of all months in the Far Future ensemble experiencing SPI values worse than the historic 25th percentile. This means that 2 in 5 months experienced SPI values < -0.74 in the Severn to Deerhurst catchment and−0.56 in the Thames to Kingston catchment simultaneously. Figures 4A,C,E show that the changing spatial dependence of meteorological droughts across both basins is the main driver for increased drought frequency. The area under the curve gives the probability of any given month in each W@H ensemble experiencing a severe (4a), moderate (4c), or mild (4e) meteorological drought in only one or both catchments. The area is divided into three segments: the top segment (light green) represents the probability of any given month in each ensemble experiencing a drought of given severity in the Severn, but not in the Thames catchment; the middle segment (blue) represents the probability of any given month in each ensemble experiencing a drought of given severity in the Thames, but not in the Severn catchment; the bottom segment (orange) shows the probability of a coincident drought of the same severity occurring. The complete set of results from the non-coincidental meteorological drought analysis is presented in Appendix 4. The plots show that, for all drought severities, the increase in drought occurrence is caused by a large growth in the probability of coincident droughts. This suggests that meteorological droughts will become more spatially coherent throughout the twenty-first century.
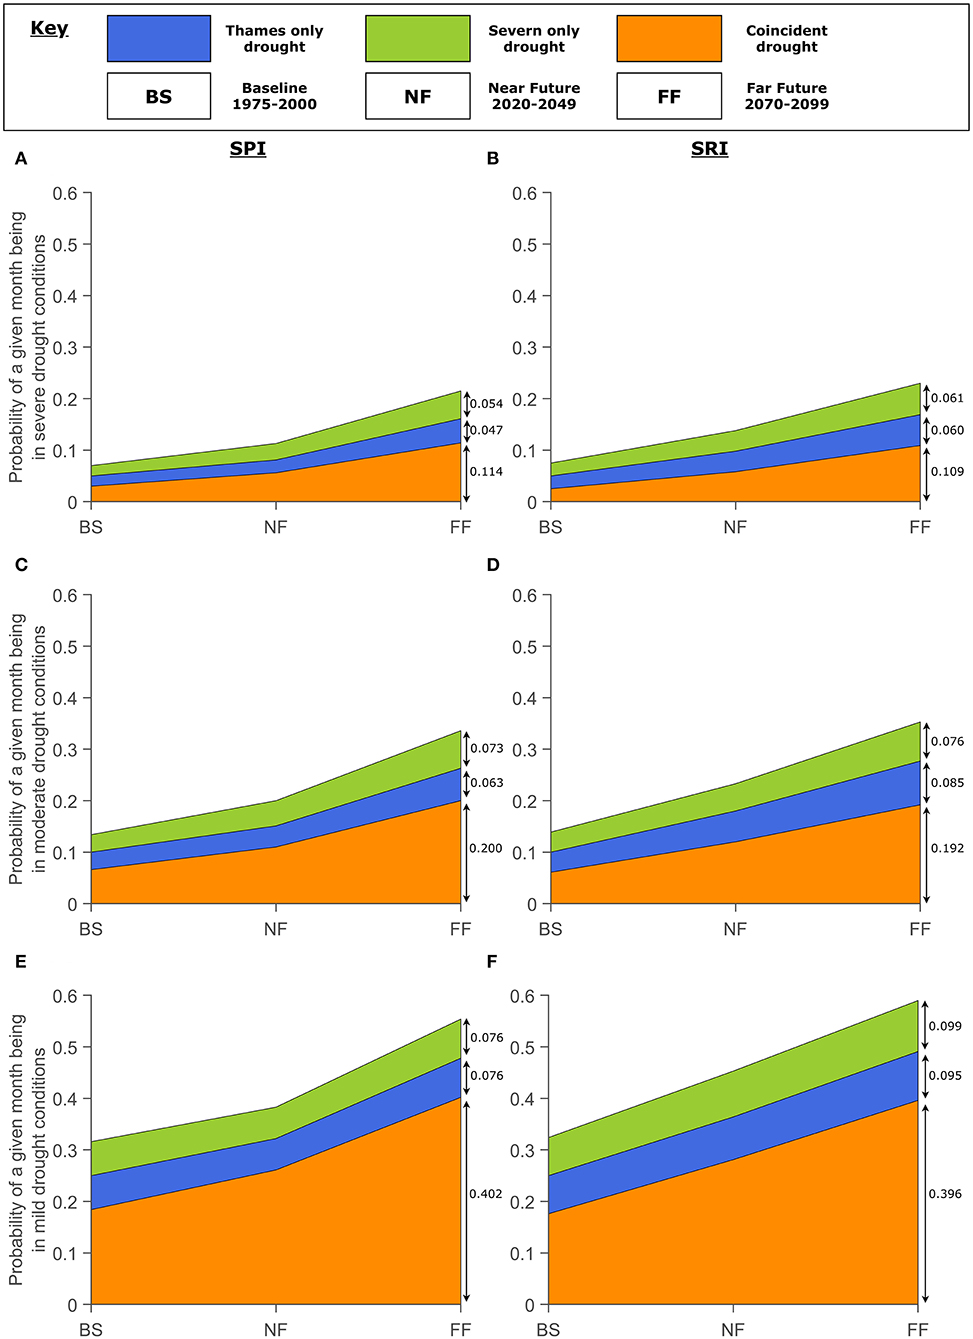
Figure 4. Stacked bar graph showing probability of coincidental and non-coincidental metrological (A,C,E) and hydrological (B,D,F) drought events of different severities occurring throughout the W@H future.
Hydrological Drought
Twelve-months SRI time series were calculated using DECIPHeR flows for the Thames at Kingston and Severn at Deerhurst. The SRI values generated with the CEH GEAR DECIPHeR flow time series are compared to the W@H ensemble driven DECIPHeR flows. Table 5 shows the probability of hydrological drought months in the flow ensembles with an intensity equal to or worse than the 5, 10, and 25th percentiles in the Baseline flows. In both catchments 12-months SRI values increase at a similar degree as 12-months SPI, which suggests that projected changes in precipitation and streamflow are closely related. However, unlike SPI, all severities of SRI drought events in the CEH GEAR time series (historic) are less probable than the W@H Baseline, a likely consequence of parameterisation in the hydrological modeling. Future work could explore the sensitivity of hydrological drought severity and frequency to parameter set choice.
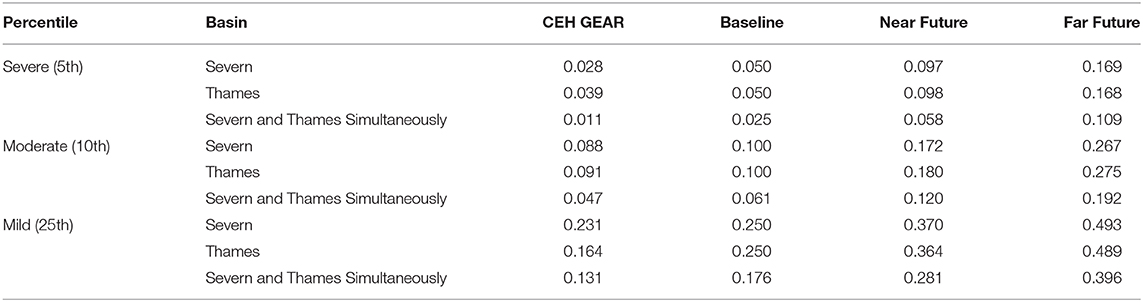
Table 5. Probability of months in Historic, Baseline, Near Future, and Far Future flow ensembles with 12-months SRI values <W@H Baseline 5, 10, and 25th percentiles for Thames and Severn study areas, individually and simultaneously.
The similar values of coincident drought listed in Table 5 for the historical and Baseline ensemble indicate that the DECIPHeR flows reproduce both independent and cross catchment features of the two regions well. Consistent with the SPI analysis presented in Section meteorological drought, these results suggest an increase in severe coincident hydrological drought throughout the twenty-first century, with coincident drought in the Near Future ensemble occurring more than double the frequency than coincident drought in the Baseline ensemble, and over four times more often in the Far Future. Moreover, mild coincident hydrological drought (25th percentile) occurs nearly once every 3 months in the Near Future ensemble and every 2 in 5 months in the Far Future ensemble. This will likely have a drastic impact on water supply and service to customers.
Figures 4B,D,F support the hypothesis that an increased spatial coherence of hydrological droughts is the main driver for the increase in drought frequency throughout the twenty-first century. The complete set of results from non-coincident hydrological drought analysis is presented in Appendix 5. The plots show that for all drought severities the increase in probability of hydrological droughts is caused by a large rise in coincident droughts. The results suggest that the likelihood of droughts occurring in one basin but not the other will remain fairly constant throughout the twenty-first century, whilst droughts affecting both catchments simultaneously will become more common. Again, this will impact the operation and success of inter-basin transfers reliant on movement of water during high stress periods.
Water Resource Drought
The 26 transfer strategies were simulated in WATHNET-5 at a daily time-step against the library of DECIPHeR flows and demand scenarios. The level of water restrictions in Severn Trent Water and Thames Water is recorded at the end of each time-step and results are aggregated to a monthly time-scale in post-processing.
Figure 5 shows the probability of a month with water restrictions (any level and severe), for both companies and for the different transfer strategies. A complete set of restriction analysis results and visualization of transfer strategy impact can be found in Appendix 6. In the absence of any interventions by Thames Water, the probability of water restrictions increases considerably from the Historic and Baseline scenarios to the Near Future and Far Future scenarios, unlike in Severn Trent where the increase in the frequency of restrictions is projected to be less.
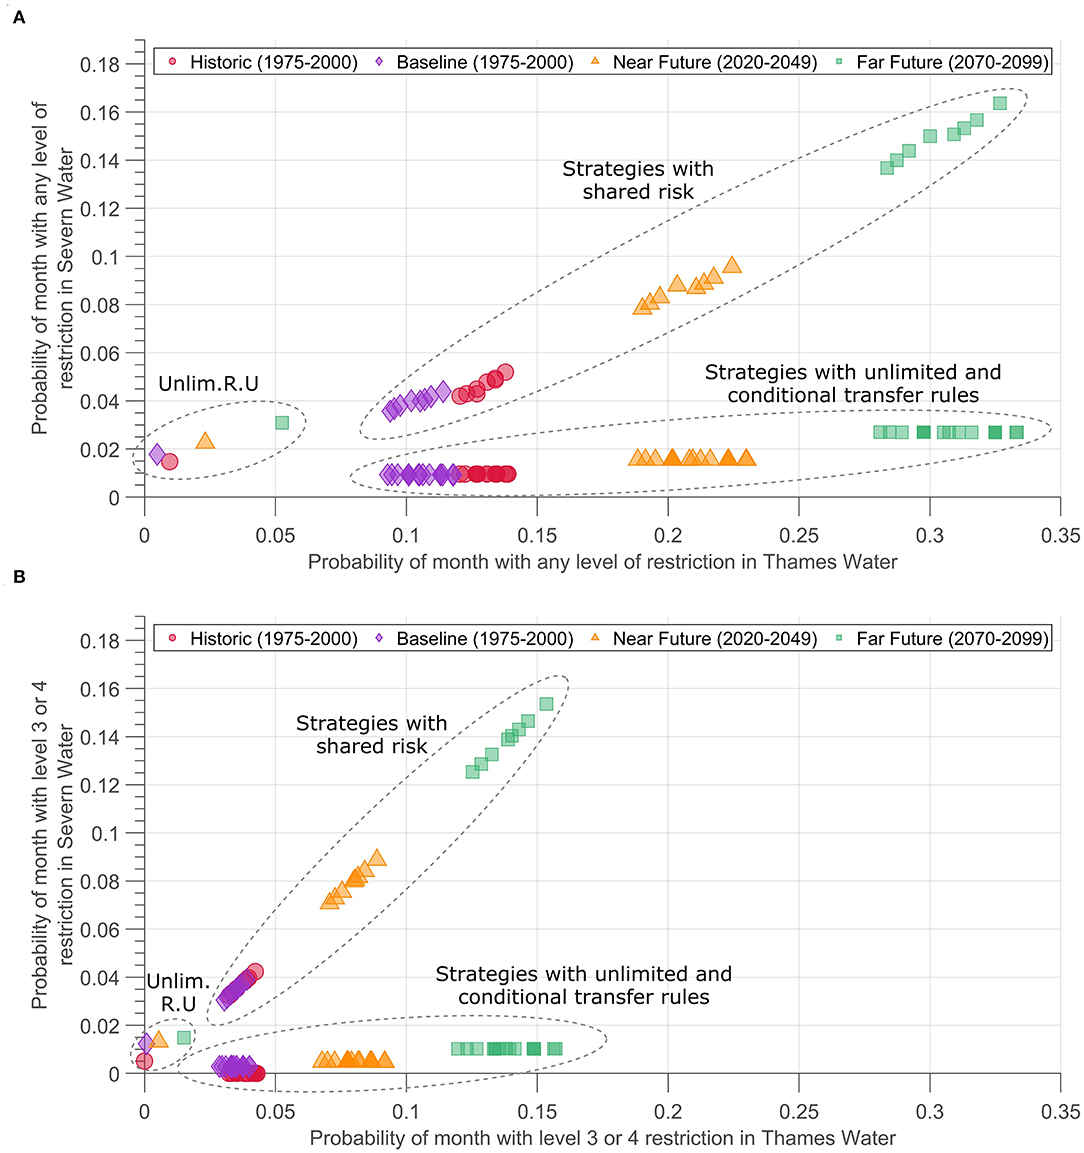
Figure 5. Probability of Thames and Severn experiencing any level of water restriction (A) and severe / level 3 and level 4 water restrictions (B) in any given month for each infrastructure strategy in Historic (circular markers, red), Baseline (diamond markers, purple), Near Future (triangular markers, orange), and Far Future (square markers, green).
The introduction of transfer infrastructure has varying effects on the frequency of restrictions. Strategies operated with the conditional and unconditional rules show little impact to restriction frequency in Severn Trent, which suggests that the loss of water in the Severn water system to Thames Water is not large enough to impact the overall reliability of water supplies. Surprisingly, even the largest capped capacity transfer (900 Ml/d) fails to influence the frequency of water shortages in the Severn water system. This is likely due to the large headwater reservoirs in the Upper Severn catchment, which can release flows to balance demand further downstream. The greatest variation in impact to Severn Trent under the conditional and unconditional rules is observed in the Far Future ensemble, although this is on the magnitude of 0.0001 probability. In contrast, transfer infrastructure significantly benefits the reliability of water supplies in Thames Water, with improvements in all strategies compared to no transfer. The strategies that produce the greatest decreases in probability of restrictions are a product of greater connectivity of supply between the two river basins and increased capacity to store the transferred water in the new Upper Thames reservoir. Strategy 300.C is the least successful strategy for Thames Water, producing similar probabilities of restrictions to Strategy 0. This suggests that the small capacity of water available to Thames Water via the conditional transfer is ineffective during high drought risk periods.
Because the “shared risk” (e.g., 300.S) strategies impose restrictions on Severn Trent when restrictions are required in the Thames, these strategies increase probability of restrictions 4-fold for Severn Trent. The frequency of these restrictions is sensitive to the size of the transfer simply because larger transfers result in less frequent restrictions in the Thames. This “shared risk” strategy does not improve performance in Thames Water as the benefit is governed by the size of the transfer infrastructure and storage reservoir, rather than water availability in the Severn.
Figure 6 illustrates the probability of severe restrictions occurring simultaneously in both water companies. Note that due to the logarithmic scale on the y-axis, probabilities of zero are not plotted. Therefore, strategies in the historic simulation with no severe restrictions are not shown on the plot. Complete results of water resource drought coincidence analysis can be found in Appendix 7. As with SPI and SRI, probability of coincident water resource drought increases into the W@H future. Consistent with the results presented in Figure 5, the shared risk strategies (e.g., 300.S) result in high probabilities of coincident restrictions compared to conditional (e.g., 300.C) and unconditional (e.g., 300.U) transfers.
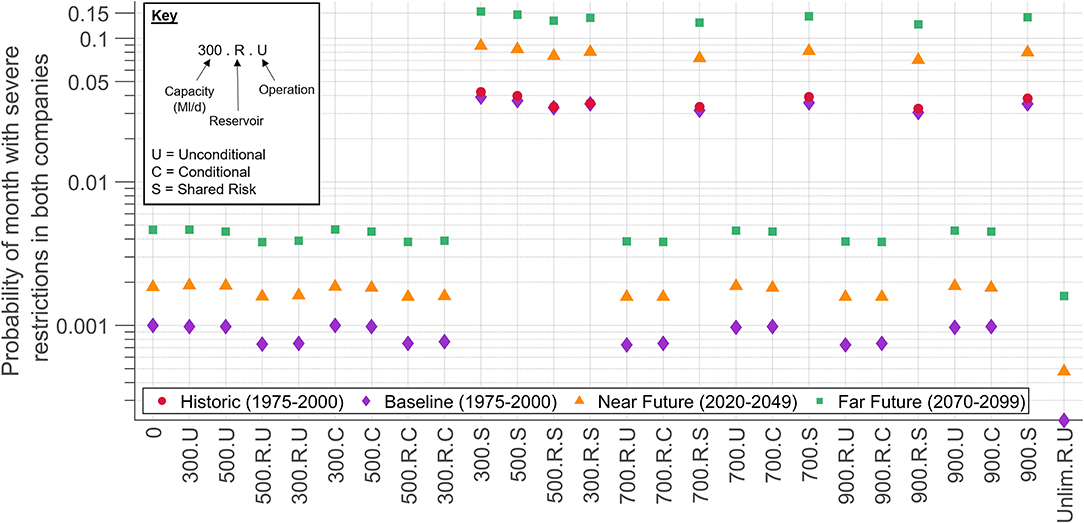
Figure 6. Probability of Thames and Severn water resource regions experiencing a severe water restriction simultaneously in any given month in the Historic (circular markers, red), Baseline (diamond markers, purple), Near Future (triangular markers, orange), and Far Future (square markers, green) ensembles.
For the unconditional and conditional transfers, the probability of severe restriction based coincident drought is proportionally less than the other drought indicators; an artifact of the methodology (fewer severe restrictions being imposed in Severn Trent). Measures of coincidence show less variance between transfer strategies, particularly for the historic and Baseline ensembles. The inclusion of the Upper Thames reservoir decreases the probability of coincident restrictions in all three W@H ensembles, again consistent with Figure 5. This suggests that the increased storage in the Thames Water supply system helps to reduce the frequency of restrictions, and therefore reduces the overall likelihood of restrictions occurring coincidently with Severn Trent. The results also suggest that both transfer agreements without additional capacity and reservoir storage provide little additional benefit in reducing coincident water restrictions.
To explore the maximum potential benefit of a transfer to Thames Water, the Unlim.R.U strategy was also simulated against the library of flow and demand ensembles. This strategy simulates an unlimited capacity transfer, which allows the transfer of all flows above the MRF in the Severn at Deerhurst to the Upper Thames catchment, and occasionally flows below the MRF. The exceedance curves and statistics for the volume of water transferred under Unlim.R.U are shown in Figure 7. The curves represent volume transfer across the full ensemble; cdfs for individual scenarios are presented in Appendix 8. Note volumes equal to zero (days when no water is transferred) are omitted on the graph; a consequence of the logarithmic scale on the y-axis. The plot suggests that the mean volume of water transferred will decrease into the future, a likely consequence of the increased frequency of hydrological droughts, whilst maximum single transfers will increase by the end of the century. These massive transfers at the upper end of the curve occur during high flow periods in the Severn, with 99% of the transfers in the Far Future ensemble equal to or >10,000 Ml/d taking place when flow upstream of the MRF at Deerhurst is higher than 20,000 Ml/d. Indeed, transfers of this size could significantly alter the hydrology and, depending on the timing of the transfer, increase the risk of flooding in the receiving region. This reason, in addition to environmental constraints, makes the unlimited transfer is an infeasible solution for the supply and demand side pressures faced by Thames Water.
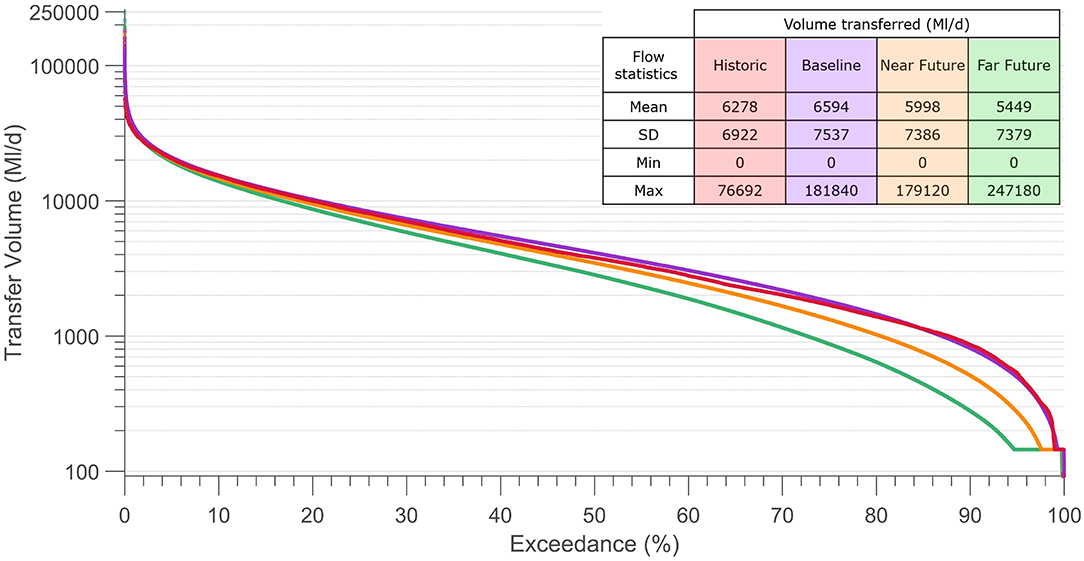
Figure 7. Exceedance curves and statistics for volume of transferred water under Unlim.R.U. for each flow ensemble (Historic—red, Baseline—purple, Near Future—orange, Far Future—green).
Each curve features a distinct plateau between 100 and 200 Ml/d, which is caused by the MRF at Deerhurst. In nearly all scenarios, the MRF is met because environmental flows at Deerhurst are prioritized in the water allocation, so water is allocated to meet the environmental flows before any is transferred. However, in the most extreme low flow scenarios, the MRF is not met. Figure 7 shows that there is a very low probability of the transfer continuing to transport water to the Upper Thames catchment despite the MRF at Deerhurst not being met, and that the likelihood of this occurring increases with time. This happens only in a limited number of scenarios under exceptional circumstances when a severe drought order permits the violation. Under these scenarios, the network flow optimisation in WATHNET-5 has to balance between the penalty incurred during an extreme demand shortfall in the Thames system and the penalty incurred for violating the environmental flow requirement at Deerhurst. This trade-off reflects the situation that water managers face during droughts when they may be permitted to violate environmental flow requirements but are reluctant to do so. As the simulations show, the probability of this is very low, but is possible in extremely dry, high demand scenarios.
Figure 8 displays the exceedance curves of the flow at Deerhurst after the transfer abstraction point for the Baseline, Near Future and Far Future simulations. The plots illustrate the impact of an unlimited capacity transfer on minimum flows at Deerhurst. For 0.002% of the time in the Baseline, 0.039% in the Near Future and 0.145% in the Far Future ensembles the flow would be equal to or less than the MRF, compared to 0.001, 0.014, and 0.101% under Strategy 0 (respectively). Consistent with Figure 7 the curves plateau at the MRF, again a consequence of the minimum flow requirement at Deerhurst, which prioritizes the environmental flow below the transfer abstraction point over demand in all but a few scenarios. The curves reiterate the increasing likelihood of the MRF at Deerhurst not being met with time, and that this becomes more likely under the unlimited transfer strategy. Future changes to environmental regulation or river abstraction allowances (Environment Agency, 2019a) could limit the projected impacts on flow below Deerhurst, although this is not explored in the modeling framework used here.
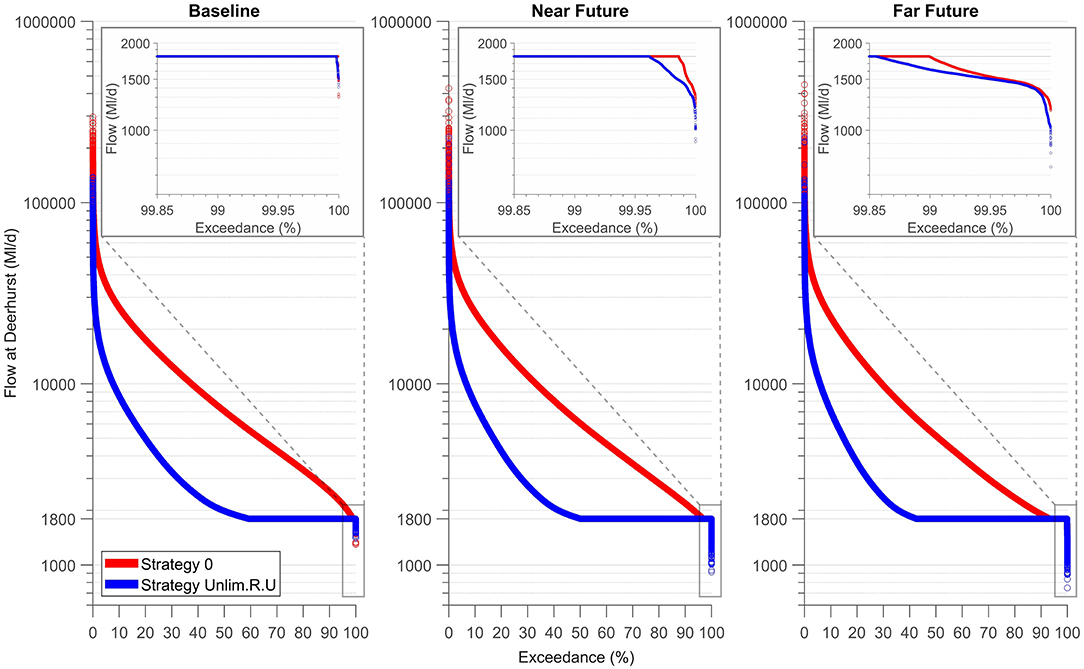
Figure 8. Exceedance curves of flow at Deerhurst below transfer abstraction point for Strategy 0 and Strategy Unlim.R.U when simulated against W@H flow ensembles and demand projections in WATHNET-5. Minimum required flow (1800 Ml/d) at Deerhurst is marked on the maximized plots of the lower end of the exceedance curve.
Simulations using the Far Future ensemble indicate that probability of severe restrictions in Thames Water could reduce from 0.157 under Strategy 0 to 0.0151 under Unlim.R.U. This is in contrast to severe restrictions in Severn Trent, which see an increase in likelihood from 0.0102 (Strategy 0) to 0.0149 (Unlim.R.U). This trade-off in risk is due to the unconditional transfer operating rule in Unlim.R.U, which does not prioritize supply to Severn Trent demand centers (nodes in the simulation model) over Thames Water. Whenever possible, the network optimisation in WATHNET-5 aims to equally distribute the demand shortfall experienced by each demand center. In reality this is equivalent to water managers ensuring that customer exposure to water shortages is equally shared among individuals throughout the basin. This equitable risk is achieved under Unlim.R.U, but not in the strategies with smaller transfer volumes that result in little impact on service in the Severn. In addition to this, the probability of severe coincident drought restrictions in the Far Future ensemble under Unlim.R.U are roughly three times less likely than the equivalent measure under Strategy 0 due to the decreased frequency of severe restrictions in the Thames. Indeed, this strategy produces the lowest record of coincident water restrictions across all infrastructure strategies simulated.
These results suggest that transferring upwards of 5,000 Ml/d from the Severn to the Thames would be successful in reducing the likelihood of severe water restrictions occurring in Thames Water by 2100. That being said, transferring upwards of 5,000 Ml/d will cause unacceptable adverse environmental effects in the River Thames and violate environmental flows in the Severn. The size of the pipeline currently being investigated as part of the feasibility work for the Severn Thames Transfer is <600 Ml/d and is a direct reflection of the environmental effects on the hydroecology in the River Thames from imported water. The larger transfers modeled demonstrate the theoretical benefits of high volume transfers in increasing water supply system resilience to severe meteorological and hydrological droughts, even though they are not appropriate to the real-world Severn-Thames example.
Strategy Performance During Combined Events
The final stage of the drought analysis framework explores the performance of transfer strategies during different types of drought event. “Combined drought” is used to indicate a period when two drought types occur simultaneously. Strategies that prevent water restrictions occurring during a period with a hydrological and/or meteorological drought are preferable over those with little to no improvement in restriction occurrence. Figure 9 visualizes individual time series of SPI, SRI, projected monthly demand, and severe restriction implementation for the Severn and Thames study areas when simulated against one Far Future scenario under Strategies 0, 900.R.U, 900.R.C, 900.R.S, and Unlim.R.U These strategies are illustrated as they provide the largest benefit to Thames Water's risk of restriction, and have the largest impact to Severn Trent's exposure to restrictions. This future scenario is chosen as it contains the highest frequency of severe meteorological and hydrological droughts in both catchments, the highest frequency of severe coincident drought months, and the greatest projected increase in water demand. Note that Figure 9 visualizes projected water demand, rather than simulated water demand. This means that decreases in demand as a consequence of water restrictions are not reflected in the time series.
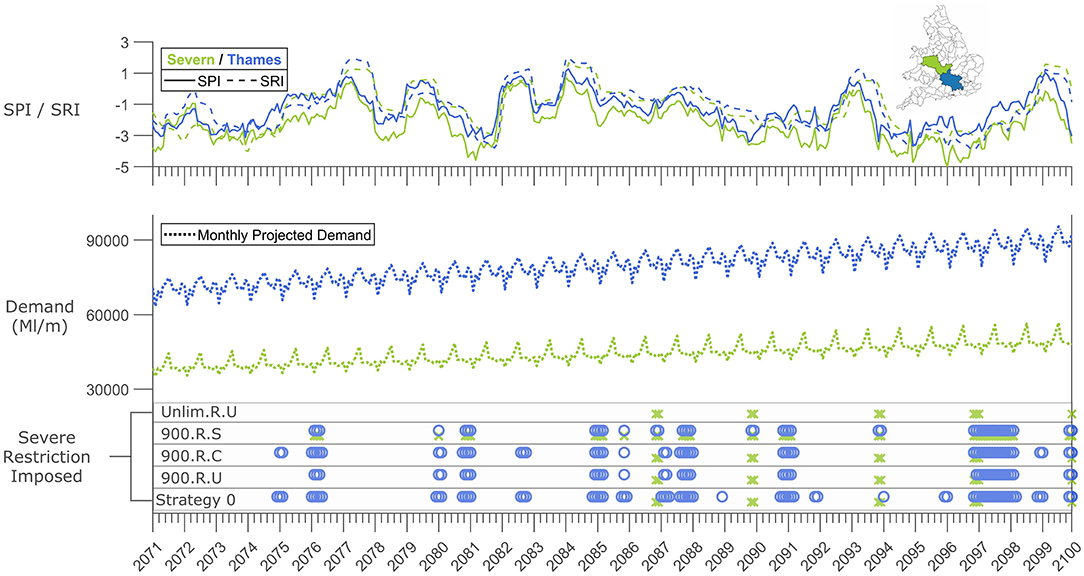
Figure 9. Time series of SPI, SRI, projected water demand, and severe restrictions for the Severn (green) and Thames (blue) study areas when simulated under one Far Future scenario with Strategies 0, 900.R.U, 900.R.C, 900.R.S, and Unlim.R.U. Each marker represents a severe restriction imposed to Severn Trent (×) or Thames Water (◦) customers.
The visualization further validates the importance of testing different infrastructure strategies against severe spatially coherent drought events. Unsurprisingly, the frequency of restrictions imposed in each water company varies depending on strategy. In the Thames, all transfer strategies improve restriction frequency in 2080, 2086, 2089, 2092, and 2096, compared to Strategy 0. Unlim.R.U, 900.R.U and 900.R.S also reduce drought impact on water supply in 2075, 2082, and 2099. 900.R.S proves the most damaging to service in the Severn, with the largest frequency of restrictions in Severn Trent occurring under this strategy. Restriction frequency consistently increases following sequences of years with decreasing SPI and SRI values, as seen between the years of 2085 and 2088. The frequency of restrictions also increases over time, a consequence of greater demand pressures and recurring drought events that gradually lower water levels in the system over a yearly to decadal timescale. Water planners might consider introducing additional supply infrastructure later in the planning horizon to combat this increase in likelihood of water restrictions.
Complete results from analysis of the probability of combined drought is presented in Appendix 9. If a strategy causes a decrease in simultaneous drought occurrence, we infer that strategy increases the resilience of the water supply system to meteorological and/ or hydrological drought. Consistent with the results presented so far, the likelihood of multiple drought types occurring increases into the future for all strategies. This measure is lower in the Severn region, a consequence of the low frequency with which Severn Trent imposes severe restrictions. In the Thames region, water resource drought and hydrological droughts are more likely to coincide than water resource droughts and meteorological droughts, which suggests that hydrological drought events are more closely linked to water restrictions than meteorological droughts. This relationship could be improved by increasing the time-scale of the meteorological drought (here 12-months SPI) to 18- or 24-months, to better correspond with the hydrological response of the catchment.
Transfer strategies including the Upper Thames reservoir have the greatest influence on the probability of combined drought incidence in the Thames area, improving resilience of the water supply system to meteorological and hydrological drought events. Strategy 300.C showed little or no improvement in resilience. Again, strategies designed to “share risk” produce higher levels of combined drought occurrence in the Severn region, due to the increased frequency of restrictions and therefore worsened resilience. Overall, the results suggest that the new transfer only increases drought resilience when it has a volume >300 Ml/d and is supported by additional infrastructure such as the Upper Thames reservoir which provides extra storage for the transferred water, or the Vyrnwy Redeployment which redirects flows in the Severn to replace water lost to the transfer.
Discussion and Conclusions
This paper presents a framework for evaluating the resilience of new transfer schemes between neighboring water companies when simulated against an extended historical record and large ensemble of climate change driven future flows, and demand growth projections. The proposed methodology allows water planners to analyse changing characteristics of meteorological and hydrological drought over time and identify adaptation infrastructure that increases the resilience of water supply systems to future drought events.
The approach is applied to a case study in southern England, using a large ensemble of climate change weather sequences, a library of future flows, demand projections, and simulation-based water resource model. Results show that the probability and intensity of all drought types increase into the future, but that the magnitude at which the occurrence of drought increases varies between the two study catchments. The analysis also identifies the probability of coincident drought between the neighboring catchments, revealing how drought dynamics change with time and adaptation. Results indicate that all drought types will become more spatially coherent into the future, with increases in simultaneous severe streamflow and precipitation drought events in both catchments by the mid-twenty-first century. The results are consistent with previous studies of drought in southern England, which suggest that major hydrological droughts are more likely to affect multiple catchments into the future (Rudd et al., 2018) and that meteorological drought intensity and stress will likely increase by the 2050's in south east and south west England (Rahiz and New, 2013). Likewise, in the absence of interventions the probability of imposing water restrictions on customers increases throughout the simulation period as water stress increases (Borgomeo et al., 2014). This is more apparent in Thames Water where, in the absence of any of the adaptation actions that Thames Water are planning, the probability of severe water restrictions in any given month in the Far Future may exceed 0.157 (15.7%). The probability of multiple drought events occurring in the same month could also increase into the future, with 18.1% of all months in the Thames study area in the Far Future ensemble simultaneously experiencing a Level 3 or 4 water restriction, severe meteorological drought and severe hydrological drought (without adaptation).
In line with the suggestions made by Watts et al. (2015), to understand how planning decisions are affected by uncertain changes in the climate and hydrological system, this analysis demonstrates the importance of testing competing versions of infrastructure against climate sequences containing drought events of varying spatial coherence and intensity. The analysis differs from previous studies that rely on historical records to test new infrastructure (Palmer and Characklis, 2009; Kirsch et al., 2013; Zeff et al., 2016), instead comparing the performance of infrastructure simulated under climate change driven scenarios to historical records. Here, the Weather@Home and DECIPHeR ensembles contain more frequent, spatially coherent and intense drought events not present in the historic record, enabling extensive exploration of many possible drought conditions. The ensembles stress test proposed transfer infrastructure between Severn Trent Water and Thames Water, revealing how different management approaches may impact the probability of water restrictions in the transfer source and receiving regions. In general, the most effective strategies include increased storage capacity in the receiving region (Upper Thames reservoir), which provides additional storage for transferred water that can be used in periods of high water stress.
The combined drought analysis explores the probabilities of meteorological and/ or hydrological drought occurring in the same month as water resource drought. The analysis also addresses the role adaptation plays in building resilience to drought. Results indicate that combined drought coincidence decreases in strategies with additional storage capacity, whilst strategies without supporting infrastructure are less successful in building resilience. Unsurprisingly, this suggests that water resource drought resilience to severe climate events improves with greater levels of adaptation. Future strategies should therefore focus on increasing water supply to high risk regions and developing supporting infrastructure to store unused water during periods of low drought risk.
This work also aimed to explore the importance of cooperation between neighboring companies during drought events, evaluating the trade-off between customer service in the transfer supply region with increased resilience to water restrictions in the receiving region. The results suggest that the new transfer will not increase the exposure of Severn Trent customers to water restrictions, unless it is (i) operated under the “shared risk” agreement which imposes water restrictions to Severn Trent customers whenever Thames Water customers are charged with a water restriction, or (ii) if the transfer capacity is unfeasibly large. Regarding point (i), the impact of a shared risk policy on restriction frequency in Severn Trent is exaggerated by the modeling framework used here. In simulation, decisions concerning water transfer and allocation are made at every time-step and are informed by present conditions and regulatory constraints. This is a highly simplified version of decision making in the real world, which also uses trend analysis and weather forecasting to inform future decisions about water system operation. The water resource supply model used here therefore lacks important foresight about changing conditions and the risk of future water shortages. A more dynamic representation of water system operation in simulation experiments would provide a better platform to evaluate the complex decision making required to improve cooperation between water companies during periods of heightened drought risk. Regarding point (ii), the low impact observed in Severn Trent in strategies with unconditional and conditional transfer operation is a consequence of the transfer capacities evaluated here, which are not large enough to disrupt service in Severn Trent. In most instances, the reservoirs in the Severn system (Blithfield, Draycote, Clywedog, Carsington and Ogston, Melbourne, Cropston, and Thornton) can be drawn from before Elan and Derwent reservoirs are allowed to fall below the thresholds for water restrictions (hence the low number of restrictions imposed in Severn Trent). This is in contrast to the Thames system, which contains no upstream regulatory reservoirs for offline water storage.
The authors acknowledge that multiple factors, other than meteorological and hydrological drought, will influence the success of inter-basin transfers. These factors include, but are not limited to: existing water supply infrastructure, such as reservoir storage volume, pipeline connectivity and levels of leakage; unforeseen changes to spatial and temporal patterns of water consumption; land-use change and altered catchment characteristics, and; new demand management schemes. For example, Dobson et al. (2020) reveal that the success of water transfers may be dependent on the proximity of reservoir locations between exporting and importing catchments. Results from their UK-based case study indicate a 40% likelihood of reservoirs in neighboring catchments being in their first percentile of total storage volumes simultaneously, implying that longer distance transfers (>100 km) may prove more resilient to drought conditions. The results presented in this study further highlight the importance of exploring different driving forces of large-scale transfer success.
Whilst there is a growing literature on droughts in the UK, few studies have compared different drought types and their changing characteristics throughout the twenty-first century. It is hoped that the results from this study will encourage decision makers in the water sector to incorporate multi-dimensional drought analysis in future planning tasks, especially in instances where water resources are shared across basin boundaries and may be vulnerable to changing spatial drought patterns.
Data Availability Statement
Publicly available datasets were analyzed in this study. This data can be found here: The Weather@Home sequences can be downloaded from the Centre for Environmental Data Analysis repository (https://catalogue.ceda.ac.uk/uuid/4eb66be638e04d759939a7af571f18ad). CEH Gridded rainfall estimates can be found in the CEH data repository (https://catalogue.ceh.ac.uk/documents/ee9ab43d-a4fe-4e73-afd5-cd4fc4c82556). The DECIPHeR model code is available at https://github.com/uob-hydrology/DECIPHeR and corresponding flow series at https://doi.org/10.5523/bris.2pkv9oxgfzvts235zrui7xz00g. Monthly water demand profile has been published by Dobson and Mijic (2020) and accessed via https://zenodo.org/record/3764678#.Xs0JNmhKhPY. Demand projections at company level have been published by the Environment Agency (2019b), accessed at https://data.gov.uk/dataset/fb38a40c-ebc1-4e6e-912c-bb47a76f6149/revised-draft-water-resources-management-plan-2019-supply-demand-data-at-company-level-2020-21-to-2044-45#licence-info.
Author Contributions
AM conducted the research, analysis, and wrote the paper. JH supervised the research and provided feedback on paper drafts. All authors contributed to the article and approved the submitted version.
Funding
AM was funded by the Engineering and Physical Sciences Research Council (science project 1788712), Thames Water, and the Environment Agency.
Conflict of Interest
The authors declare that the research was conducted in the absence of any commercial or financial relationships that could be construed as a potential conflict of interest.
Acknowledgments
We thank Chris Lambert, Peter Blair, and Katherine Woollard from Thames Water for providing feedback on a draft of the paper. Additional thanks to Barnaby Dobson for help in the early stages of the project. The authors would like to acknowledge the use of the University of Oxford Advanced Research Computing (ARC) facility in carrying out this work (Richards, 2015).
Supplementary Material
The Supplementary Material for this article can be found online at: https://www.frontiersin.org/articles/10.3389/fenvs.2020.571647/full#supplementary-material
References
Bayissa, Y., Maskey, S., Tadesse, T., van Andel, S., Moges, S., van Griensven, A., et al. (2018). Comparison of the performance of six drought indices in characterizing historical drought for the upper blue Nile Basin, Ethiopia. Geosciences 8:81. doi: 10.3390/geosciences8030081
Beh, E. H. Y., Dandy, G. C., Maier, H. R., and Paton, F. L. (2014). Optimal sequencing of water supply options at the regional scale incorporating alternative water supply sources and multiple objectives. Environ. Modell. Softw. 53, 137–153. doi: 10.1016/j.envsoft.2013.11.004
Borgomeo, E., Hall, J. W., Fung, F., Watts, G., Colquhoun, K., and Lambert, C. (2014). Risk-based water resources planning: incorporating probabilistic non-stationary climate uncertainties. Water Resour. Res. 50, 6850–6873. doi: 10.1002/2014WR015558
Borgomeo, E., Mortazavi-Naeini, M., Hall, J. W., and Guillod, B. P. (2018). Risk, robustness and water resources planning under uncertainty. Earth's Fut. 6, 468–487. doi: 10.1002/2017EF000730
Burke, E. J., Perry, R. H. J., and Brown, S. J. (2010). An extreme value analysis of UK drought and projections of change in the future. J. Hydrol. 388, 131–143. doi: 10.1016/j.jhydrol.2010.04.035
Caldwell, C., and Characklis, G. W. (2013). Impact of contract structure and risk aversion on interutility water transfer agreements. J. Water Res. Plann. Manag. 140, 100–111. doi: 10.1061/(asce)wr.1943-5452.0000317
Connell-Buck, C. R., Medellín-Azuara, J., Lund, J. R., and Madani, K. (2011). Adapting California's water system to warm vs. dry climates. Clim. Change 109, 133–149. doi: 10.1007/s10584-011-0302-7
Coxon, G., Freer, J., Lane, R., Dunne, T., Knoben, W. J. M., Howden, N. J. K., et al. (2019). DECIPHeR v1: dynamic fluxes and connectivity for predictions of hydrology. Geosci. Model Dev. 12, 2285–2306. doi: 10.5194/gmd-12-2285-2019
Davies, B. R., Thoms, M., and Meador, M. (1992). An assessment of the ecological impacts of inter-basin water transfers, and their threats to river basin integrity and conservation. Aquat. Conserv. 2, 325–349. doi: 10.1002/aqc.3270020404
Dobson, B., Coxon, G., Freer, J., Gavin, H., Mortazavi-Naeini, M., and Hall, J. W. (2020). The Spatial dynamics of droughts and water scarcity in england and wales. Water Resour. Res. 56:27187. doi: 10.1029/2020wr027187
Dobson, B., and Mijic, A. (2020). Protecting rivers by integrating supply-wastewater infrastructure planning and coordinating operational decisions. EarthArXiv. doi: 10.31223/osf.io/64cvn%0A
Edwards, D. C., and Mckee, T. B. (1997). Characteristics of 20th century drought in the united states at multiple time scales. Climatol. Rep. 97–2.
Ehsani, N., Vörösmarty, C. J., Fekete, B. M., and Stakhiv, E. Z. (2017). Reservoir operations under climate change: storage capacity options to mitigate risk. J. Hydrol. 555, 435–446. doi: 10.1016/j.jhydrol.2017.09.008
Environment Agency (2013). National Abstraction License Database Returns. Available online at: https://data.gov.uk/dataset/f484a9be-bfd1-4461-a8ff-95640bf6bc3d/national-abstraction-license-database-returns
Environment Agency (2006). Do We Need Large-Scale Water Transfers for South East England? Available online at: https://delta.bipsolutions.com/docstore/pdf/14342.pdf (accessed November, 2020).
Environment Agency and DEFRA (2013). Water Stressed Areas – Final Classification. Available online at: https://www.gov.uk/government/publications/water-stressed-areas-2013-classification (accessed November, 2020).
Environment Agency (2014). Abstraction Licensing Strategies (CAMS process). Available online at: https://www.gov.uk/government/collections/water-abstraction-licensing-strategies-cams-process#history (accessed June, 2020).
Environment Agency (2019a). Abstraction Reform Report. Available online at: https://assets.publishing.service.gov.uk/government/uploads/system/uploads/attachment_data/file/801495/abstraction-reform-report.pdf (accessed June, 2020).
Environment Agency (2019b). Revised Draft Water Resources Management Plan 2019 Supply-Demand Data at Company Level 2020/21 to 2044/45. Available online at: https://data.gov.uk/dataset/fb38a40c-ebc1-4e6e-912c-bb47a76f6149/revised-draft-water-resources-management-plan-2019-supply-demand-data-at-company-level-2020-21-to-2044-45#licence-info (accessed June, 2020).
Fleig, A. K., Tallaksen, L. M., Hisdal, H., and Hannah, D. M. (2011). Regional hydrological drought in north-western Europe: linking a new regional drought area index with weather types. Hydrol. Process. 25, 1163–1179. doi: 10.1002/hyp.7644
Fowler, H. J., Blenkinsop, S., and Tebaldi, C. (2007). Linking climate change modelling to impact studies: rcent advances in downscaling techniques for hydrological modelling. Int. J. Climatol. 27, 1547–1578. doi: 10.1002/joc
Fowler, H. J., and Kilsby, C. G. (2004). Future increase in UK water resource drought projected by a regional climate model of the BHS International Conference on, I, 15–21. Available online at: http://www.hydrology.org.uk/Publications/imperial/1_03.pdf (accessed November, 2020).
Gorelick, D. E., Zeff, H. B., Characklis, G. W., and Reed, P. M. (2018). Integrating raw water transfers into an Eastern United States management context. J. Water Res. Plann. Manag. 144:05018012. doi: 10.1061/(asce)wr.1943-5452.0000966
Guillod, B. P., Jones, R. G., Bowery, A., Haustein, K., Massey, N. R., Mitchell, D. M., et al. (2017). weather@home 2: validation of an improved global-regional climate modelling system. Geosci. Model Dev. 10, 1849–1872. doi: 10.5194/gmd-10-1849-2017
Guillod, B. P., Jones, R. G., Dadson, S. J., Coxon, G., Bussi, G., Freer, J., et al. (2018). A large set of potential past, present and future hydro-meteorological time series for the UK. Hydrol. Earth Syst. Sci. 22, 611–634. doi: 10.5194/hess-2017-246
Gupta, J., and van der Zaag, P. (2008). Interbasin water transfers and integrated water resources management: where engineering, science and politics interlock. Phys. Chem. Earth 33, 28–40. doi: 10.1016/j.pce.2007.04.003
Hannaford, J., and Buys, G. (2012). Trends in seasonal river flow regimes in the UK. J. Hydrol. 475, 158–174. doi: 10.1016/j.jhydrol.2012.09.044
Hannaford, J., Lloyd-Hughes, B., Keef, C., Parry, S., and Prudhomme, C. (2011). Examining the large-scale spatial coherence of European drought using regional indicators of precipitation and streamflow deficit. Hydrol. Process. 25, 1146–1162. doi: 10.1002/hyp.7725
Haustein, K., Otto, F. E. L., Uhe, P., Schaller, N., Allen, M. R., Hermanson, L., et al. (2016). Real-time extreme weather event attribution with forecast seasonal SSTs. Environ. Res. Lett. 11:064006. doi: 10.1088/1748-9326/11/6/064006
Hawkins, E., and Sutton, R. (2011). The potential to narrow uncertainty in projections of regional precipitation change. Clim. Dyn. 37, 407–418. doi: 10.1007/s00382-010-0810-6
He, X., Wada, Y., Wanders, N., and Sheffield, J. (2017). Intensification of hydrological drought in California by human water management. Geophys. Res. Lett. 44, 1777–1785. doi: 10.1002/2016GL071665
Herman, J. D., Zeff, H. B., Lamontagne, J. R., Reed, P. M., and Characklis, G. W. (2016). Synthetic drought scenario generation to support bottom-up water supply vulnerability assessments. J. Water Res. Plann. Manag. 142:04016050. doi: 10.1061/(ASCE)WR.1943-5452.0000701
Hernández-Mora, N., and Del Moral, L. (2015). Developing markets for water reallocation: Revisiting the experience of Spanish water mercantilización. Geoforum 62, 143–155. doi: 10.1016/j.geoforum.2015.04.011
Hunt, D., and Wade, S. (2016). WRMP 2019 Methods – Risk Based Planning. Available online at: https://www.ukwir.org/146387?object=151120 (accessed June, 2020).
Intergovernmental Panel on Climate Change (2013). “Climate change 2013: the physical science basis,” in Contribution of Working Group I to the Fifth Assessment Report of the Intergovernmental Panel on Climate Change. (Cambridge; New York, NY: Cambridge University Press).
Jackson, C. R., Meister, R., and Prudhomme, C. (2011). Modelling the effects of climate change and its uncertainty on UK Chalk groundwater resources from an ensemble of global climate model projections. J. Hydrol. 399, 12–28. doi: 10.1016/j.jhydrol.2010.12.028
Kirsch, B. R., Characklis, G. W., and Zeff, H. B. (2013). Evaluating the impact of alternative hydro-climate scenarios on transfer agreements: practical improvement for generating synthetic streamflows. J. Water Res. Plann. Manag. 139, 396–406. doi: 10.1061/(ASCE)WR.1943-5452.0000287
Kuczera, G. (1992). Water supply headworks simulation using network linear programming. Adv. Eng. Softw. 14, 55–60. doi: 10.1016/0965-9978(92)90084-S
Liu, Y., Zhang, J., Wang, G., Liu, J., He, R., Wang, H., et al. (2012). Quantifying uncertainty in catchment-scale runoff modeling under climate change (case of the Huaihe River, China). Quarter. Int. 282, 130–136. doi: 10.1016/j.quaint.2012.04.029
Lopez, A., Fung, F., New, M., Watts, G., Weston, A., and Wilby, R. L. (2009). From climate model ensembles to climate change impacts and adaptation: a case study of water resource management in the southwest of England. Water Resour. Res. 45:7499. doi: 10.1029/2008WR007499
Lorenzo-Lacruz, J., Vicente-Serrano, S. M., López-Moreno, J. I., Beguería, S., García-Ruiz, J. M., and Cuadrat, J. M. (2010). The impact of droughts and water management on various hydrological systems in the headwaters of the Tagus River (central Spain). J. Hydrol. 386, 13–26. doi: 10.1016/j.jhydrol.2010.01.001
Lund, J. R., and Israel, M. (1995a). Optimization of transfers in urban water supply planning. J. Water Res. Plann. Manag. 121, 41–48. doi: 10.1061/(ASCE)0733-9496(1995)121:1(41)
Lund, J. R., and Israel, M. (1995b). Water transfers in water resource systems. J. Water Res. Plann. Manag. 121, 193–204. doi: 10.1061/(ASCE)0733-9496(1995)121:2(193)
Manning, L. J., Hall, J. W., Fowler, H. J., Kilsby, C. G., and Tebaldi, C. (2009). Using probabilistic climate change information from a multimodel ensemble for water resources assessment. Water Resour. Res. 45:6674. doi: 10.1029/2007WR006674
Marsh, T. (2007). The 2004–2006 drought in southern Britain. Weather 62, 191–196. doi: 10.1002/wea.99
Marsh, T., Cole, G., and Wilby, R. (2007). Major droughts in England and Wales. 1800-2006. Weather 62, 87–93. doi: 10.1002/wea.67
Massey, N., Jones, R., Otto, F. E. L., Aina, T., Wilson, S., Murphy, J. M., et al. (2015). weather@home-development and validation of a very large ensemble modelling system for probabilistic event attribution. Q. J. R. Meteorol. Soc. 141, 1528–1545. doi: 10.1002/qj.2455
McKee, T., Doesken, N., and Kleist, J. (1993). “The relationship of drought frequency and duration to time scales,”in Eigth Conference on Applied Climatology (Anaheim, CA).
Meinshausen, M., Smith, S. J., Calvin, K., Daniel, J. S., Kainuma, M. L. T., Lamarque, J., et al. (2011). The RCP greenhouse gas concentrations and their extensions from 1765 to 2300. Clim. Change 109, 213–241. doi: 10.1007/s10584-011-0156-z
Mitchell, D., Davini, P., Harvey, B., Massey, N., Haustein, K., Woollings, T., et al. (2017). Assessing mid-latitude dynamics in extreme event attribution systems. Clim. Dyn. 48, 3889–3901. doi: 10.1007/s00382-016-3308-z
Mitchell, D., Heaviside, C., Vardoulakis, S., Huntingford, C., Masato, G. P., et al. (2016). Attributing human mortality during extreme heat waves to anthropogenic climate change. Environ. Res. Lett. 11:74006. doi: 10.1088/1748-9326/11/7/074006
Murphy, J., Jenkins, G., Sexton, D., Lowe, J., Jones, P., and Kilsby, C. (2009). UKCP09 Briefing report. (Exeter, UK: Met Office Hadley Centre). Available online at: http://ukclimateprojections.defra.gov.uk/media.jsp?mediaid=87852&filetype=pdf (accessed June, 2020).
NERC CEH Wallingford (2018). National River Flow Archive. Available online at: https://nrfa.ceh.ac.uk/daily-flow-data (accessed November, 2020).
O'Keeffe, J. H., and De Moor, F. C. (1988). Changes in the physico-chemistry and benthic invertebrates of the great fish river, South Africa, following an interbasin transfer of water. Regulated Rivers Res. Manag. 2, 39–55. doi: 10.1002/rrr.3450020105
Palmer, R. N., and Characklis, G. W. (2009). Reducing the costs of meeting regional water demand through risk-based transfer agreements. J. Environ. Manage. 90, 1703–1714. doi: 10.1016/j.jenvman.2008.11.003
Prudhomme, C., Haxton, T., Crooks, S., Jackson, C., Barkwith, A., Williamson, J., et al. (2013). Future flows hydrology: an ensemble of daily river flow and monthly groundwater levels for use for climate change impact assessment across Great Britain. Earth Syst. Sci. Data. 5, 101–107. doi: 10.5194/essd-5-101-2013
Purvis, L., and Dinar, A. (2020). Are intra- and inter-basin water transfers a sustainable policy intervention for addressing water scarcity? Water Security. 9:100058. doi: 10.1016/j.wasec.2019.100058
Rahiz, M., and New, M. (2012). Spatial coherence of meteorological droughts in the UK since 1914 Spatial coherence of meteorological droughts in the UK since 1914. Area 44, 400–410. doi: 10.1111/j.1475-4762.2012.01131.x
Rahiz, M., and New, M. (2013). 21st century drought scenarios for the UK. Water Res. Manag. 27, 1039–1061. doi: 10.1007/s11269-012-0183-1
Rayner, N. A., Parker, D. E., Horton, E. B., Folland, C. K., Alexander, L. V., Rowell, D. P., et al. (2003). Global analyses of sea surface temperature, sea ice, and night marine air temperature since the late nineteenth century. J. Geophys. Res. Atmosph. 108:2670. doi: 10.1029/2002jd002670
Richards, A. (2015). Technical Note on ARC Facility and Service Deployment for Publication Reference. Oxford: University of Oxford Advanced Research Computing Facility. doi: 10.5281/zenodo.22558
Robinson, E. L., Blyth, E. M., Clark, D. B., Comyn-Platt, E., Rudd, A. C., Finch, J., et al. (2016). Climate Hydrology and Ecology Research Support System Potential Evapotranspiration Dataset for Great Britain (1961-2017) [CHESS-PE]. Wallingford: NERC Environmental Information Data Centre.
Rudd, A. C., Bell, V. A., and Kay, A. L. (2017). National-scale analysis of simulated hydrological droughts (1891–2015). J. Hydrol. 550, 368–385. doi: 10.1016/j.jhydrol.2017.05.018
Rudd, A. C., Bell, V. A., Kay, A. L., and Davies, H. N. (2018). Severn Thames Transfer Study. Available online at: https://corporate.thameswater.co.uk/-/media/Site-Content/Thames-Water/Corporate/AboutUs/Our-strategies-and-plans/Water-resources/Document-library/Water-reports/Severn-Thames-Transfer-Study-Centre-for-Ecology-and-Hydrology-July-2018.pdf (accessed November, 2020).
Rudd, A. C., Kay, A. L., and Bell, V. A. (2019). National-scale analysis of future river flow and soil moisture droughts: potential changes in drought characteristics. Clim. Change 156, 323–340. doi: 10.1007/s10584-019-02528-0
San-Martín, E., Larraz, B., and Gallego, M. S. (2020). When the river does not naturally flow: a case study of unsustainable management in the Tagus River (Spain). Water Int. 45, 189–221. doi: 10.1080/02508060.2020.1753395
Schaller, N., Kay, A. L., Lamb, R., Massey, N. R., Van Oldenborgh, G. J., Otto, F. E. L., et al. (2016). Human influence on climate in the 2014 southern England winter floods and their impacts. Nat. Clim. Chang. 6, 627–634. doi: 10.1038/nclimate2927
Shukla, S., and Wood, A. W. (2008). Use of a standardized runoff index for characterizing hydrologic drought. Geophys. Res. Lett. 35:32487. doi: 10.1029/2007GL032487
Tanguy, M., Dixon, H., Prosdocimi, I., Morris, D. G., and Keller, V. D. J. (2019). Gridded estimates of daily and monthly areal rainfall for the United Kingdom (1890–2017). CEH-GEAR. Wallingford.
Taylor, K. E., Stouffer, R. J., and Meehl, G. A. (2012). An overview of CMIP5 and the experiment design. Bull. Am. Meteorol. Soc. 93, 485–498. doi: 10.1175/BAMS-D-11-00094.1
Thames Water (2019a). Our updated revised draft water resources management plan 2019 - Executive summary. Reading: Thames Water.
Thames Water (2019b). Thames Water Revised Draft Water Resources Management Plan 2019 - Statement of response. (Technical Appendices - Appendix J). Available online at: https://corporate.thameswater.co.uk/about-us/our-strategies-and-plans/water-resources (accessed November, 2020).
Tijdeman, E., Hannaford, J., and Stahl, K. (2018). Human influences on streamflow drought characteristics in England and Wales. Hydrol. Earth Syst. Sci. 22, 1051–1064. doi: 10.5194/hess-22-1051-2018
Titchner, H. A., and Rayner, N. A. (2014). The met office hadley centre sea ice and sea surface temperature data set, version 2, 1. sea ice concentrations. J. Geophys. Res. 119, 2864–2889. doi: 10.1002/2013JD020316
Ukkola, A. M., and Prentice, I. C. (2013). A worldwide analysis of trends in water-balance evapotranspiration. Hydrol. Earth Syst. Sci. 17, 4177–4187. doi: 10.5194/hess-17-4177-2013
van Loon, A. F., Gleeson, T., Clark, J., van Dijk, A. I. J. M., Stahl, K., Hannaford, J., et al. (2016). Drought in the anthropocene. Nat. Geosci. 9, 89–91. doi: 10.1038/ngeo2646
van Oel, P. R., Martins, E. S. P. R., Costa, A. C., Wanders, N., and van Lanen, H. A. J. (2018). Diagnosing drought using the downstreamness concept: the effect of reservoir networks on drought evolution. Hydrol. Sci. J. 63, 979–990. doi: 10.1080/02626667.2018.1470632
Vicente-Serrano, S. M. (2006). Differences in spatial patterns of drought on different time scales: an analysis of the Iberian Peninsula. Water Res. Manag. 20, 37–60. doi: 10.1007/s11269-006-2974-8
Vicente-Serrano, S. M., López-Moreno, J. I., Beguería, S., Lorenzo-Lacruz, J., Azorin-Molina, C., and Morán-Tejeda, E. (2012). Accurate computation of a streamflow drought index. J. Hydrol. Eng. 17, 318–332. doi: 10.1061/(ASCE)HE.1943-5584.0000433
Vidal, J.-P., and Wade, S. (2009). A multimodel assessment of future climatological droughts in the United Kingdom. Int. J. Climatol. 29, 2056–2071. doi: 10.1002/joc.1843
Watts, G., Battarbee, R. W., Bloomfield, J. P., Crossman, J., Daccache, A., Durance, I., et al. (2015). Climate change and water in the UK – past changes and future prospects. Progr. Phys. Geogr. Earth Environ. 39, 6–28. doi: 10.1177/0309133314542957
Wheeler, K. G., Hall, J. W., Abdo, G. M., Dadson, S. J., Kasprzyk, J. R., Smith, R., et al. (2018). Exploring cooperative transboundary river management strategies for the Eastern Nile Basin. Water Res. Res. 54, 9224–9254. doi: 10.1029/2017WR022149
Wilby, R. L., and Harris, I. (2006). A framework for assessing uncertainties in climate change impacts: low-flow scenarios for the River Thames, UK. Water Resour. Res. 42:4065. doi: 10.1029/2005WR004065
Wildlife and Countryside Link (2016). Invaders, Water Quality and Large Scale Water Transfers. Available online at: https://www.wcl.org.uk/invaders-water-quality-and-large-scale-water-transfers.asp (accessed June 4, 2020).
Wu, J., Liu, Z., Yao, H., Chen, X., Chen, X., Zheng, Y., et al. (2018). Impacts of reservoir operations on multi-scale correlations between hydrological drought and meteorological drought. J. Hydrol. 563, 726–736. doi: 10.1016/j.jhydrol.2018.06.053
Zeff, H. B., Herman, J. D., Reed, P. M., and Characklis, G. W. (2016). Cooperative drought adaptation: integrating infrastructure development, conservation, and water transfers into adaptive policy pathways. Water Resour. Res. 52, 7327–7346. doi: 10.1002/2016WR018771
Keywords: drought, water management, hydrology, water transfers, climate resilience
Citation: Murgatroyd A and Hall JW (2020) The Resilience of Inter-basin Transfers to Severe Droughts With Changing Spatial Characteristics. Front. Environ. Sci. 8:571647. doi: 10.3389/fenvs.2020.571647
Received: 11 June 2020; Accepted: 20 November 2020;
Published: 08 December 2020.
Edited by:
Jamie Hannaford, UK Centre for Ecology and Hydrology (UKCEH), United KingdomReviewed by:
Elena Bresci, University of Florence, ItalyGregory Characklis, University of North Carolina at Chapel Hill, United States
Sergio M. Vicente-Serrano, Consejo Superior de Investigaciones Científicas (CSIC), Spain
David Gorelick, University of North Carolina at Chapel Hill, United States, in collaboration with reviewer GC
Copyright © 2020 Murgatroyd and Hall. This is an open-access article distributed under the terms of the Creative Commons Attribution License (CC BY). The use, distribution or reproduction in other forums is permitted, provided the original author(s) and the copyright owner(s) are credited and that the original publication in this journal is cited, in accordance with accepted academic practice. No use, distribution or reproduction is permitted which does not comply with these terms.
*Correspondence: Anna Murgatroyd, YW5uYS5tdXJnYXRyb3lkQGNoY2gub3guYWMudWs=
†ORCID: Jim W. Hall orcid.org/0000-0002-2024-9191