 Gongqi Sun
 Guangchun Lei1*
- 1School of Ecology and Nature Conservation, Beijing Forestry University, Beijing, China
- 2Nature and Ecology Institute of Heilongjiang Academy of Sciences, Harbin, China
The operation of the Three Gorges Dam (TGD) has significantly impact on downstream wetland ecosystems. This study applied 3S technology, landscape ecology, and computational models to investigate impact of the TGD on downstream spatial dynamics of floodplains in future. Results revealed the relationship between siltation patterns and wetland types transformation after the operation of the TGD, which are critically important to understand ecological characters dynamics in new environmental setting, and provide science-based conservation and restoration recommendation. After the operation of the TGD, changes between water surface and floodplains areas were spatial heterogeneity. With the increase of distance to the TGD, floodplain erosion force declining gradually. The most important finding is the asymmetric erosion between main river course and its associated floodplain lakes, e.g., Dongting lake. This has significant implications for dam operation in autumn and habitat management. After the operation of the TGD, floodplain in the estuary is driven by both the Yangtze river and ocean currents. The strong hydrological force and reduced sediments of Yangtze river drive erosion of the southern river course in the estuary, whereas, the weakened hydrological force in the northern river course attracts sedimentation.
Introduction
Global wetland changes are affected by climate change and human activities (Vörösmarty et al., 2000; Ramsar Convention on Wetlands, 2018), in particularly, river diversion or damming (Postel et al., 1996; United Nations Department of Economic and Social Affairs, 2015; Jean-François et al., 2016), which have been identified as global aquatic stressors (Etienne et al., 2020), or regional level, such as the Curuai floodplain in the lower Amazon River (Park et al., 2020), West Bengal (India) (Das et al., 2020). Human activities have altered the flow regimes of many rivers, with negative impacts on biodiversity, water quality, and ecological processes (Margaret and Albert, 2019).
The Yangtze River is the third-largest river in the world, and it supports a great amount of biodiversity from 6300 meters above sea level in the Tibetan Plateau to the Eastern China Sea in Shanghai. Its upstream reaches have been identified as global biodiversity hotspots, namely, the Himalayan Mountains and River Valley of the Yangtze River, the Global 200 Ecoregion (Zhao et al., 2000; Barter et al., 2006), the Ecoregion of the Central Yangtze River and Lakes, as well as the Yellow River Ecoregion (including the Yangtze River delta and estuary) (Oslon and Dinerstein, 2002).
Since the Three Gorges Dam (TGD) became operational in 2003, worldwide attention has been focused on dam’s impact on environment in the middle-lower Yangtze River (Wang, 2010; Pan and Hu, 2015; Zhang et al., 2020). The operation of the TGD changed hydrological regime downstream (Zhang et al., 2016; Tian et al., 2019), through storing water in autumn, and releasing of clear water that disturb balance between riverbed erosion and siltation (Li, 2009; Jiang et al., 2014; Han and Huang, 2018), leading to asymmetric erosion on riverbed and lake (Lu et al., 2018). Such disturbance has significant impact on waterbird habitat (Cao et al., 2008; Guan et al., 2014; Liu et al., 2015), as well as fish populations (Xie et al., 2016).
To date, major research efforts have focused on impact of the TGD on hydrology, or biodiversity based on data from a limited number of hydrological stations (Jiang et al., 2014; Yang et al., 2017; Liu et al., 2018); few studies have focused on hydrological changes and their relationship with siltation patterns and habitat transformation, which are critically important to understand ecological characters dynamics in new environmental setting after the operation of the TGD, and provide science-based conservation and restoration recommendation. This study applied 3S technology, landscape ecology, and computational models to investigate impact of the TGD on downstream spatial dynamics of floodplains in future.
Materials and Methods
Study Area
Study area covers main river course and its floodplains along the Yangtze River between the TGD in Yichang City and estuary in Shanghai, with a total length of 1771 km (Figure 1). On basis of hydrological station data and impact of river flow downstream, study area was divided into four sections, i.e., Yichang Station-Chenglingji Station (Y-C), Chenglingji Station-Hukou Station (C-H), Hukou Station-Nantong Station (H-N), and Nantong Station-Estuary (N-E).
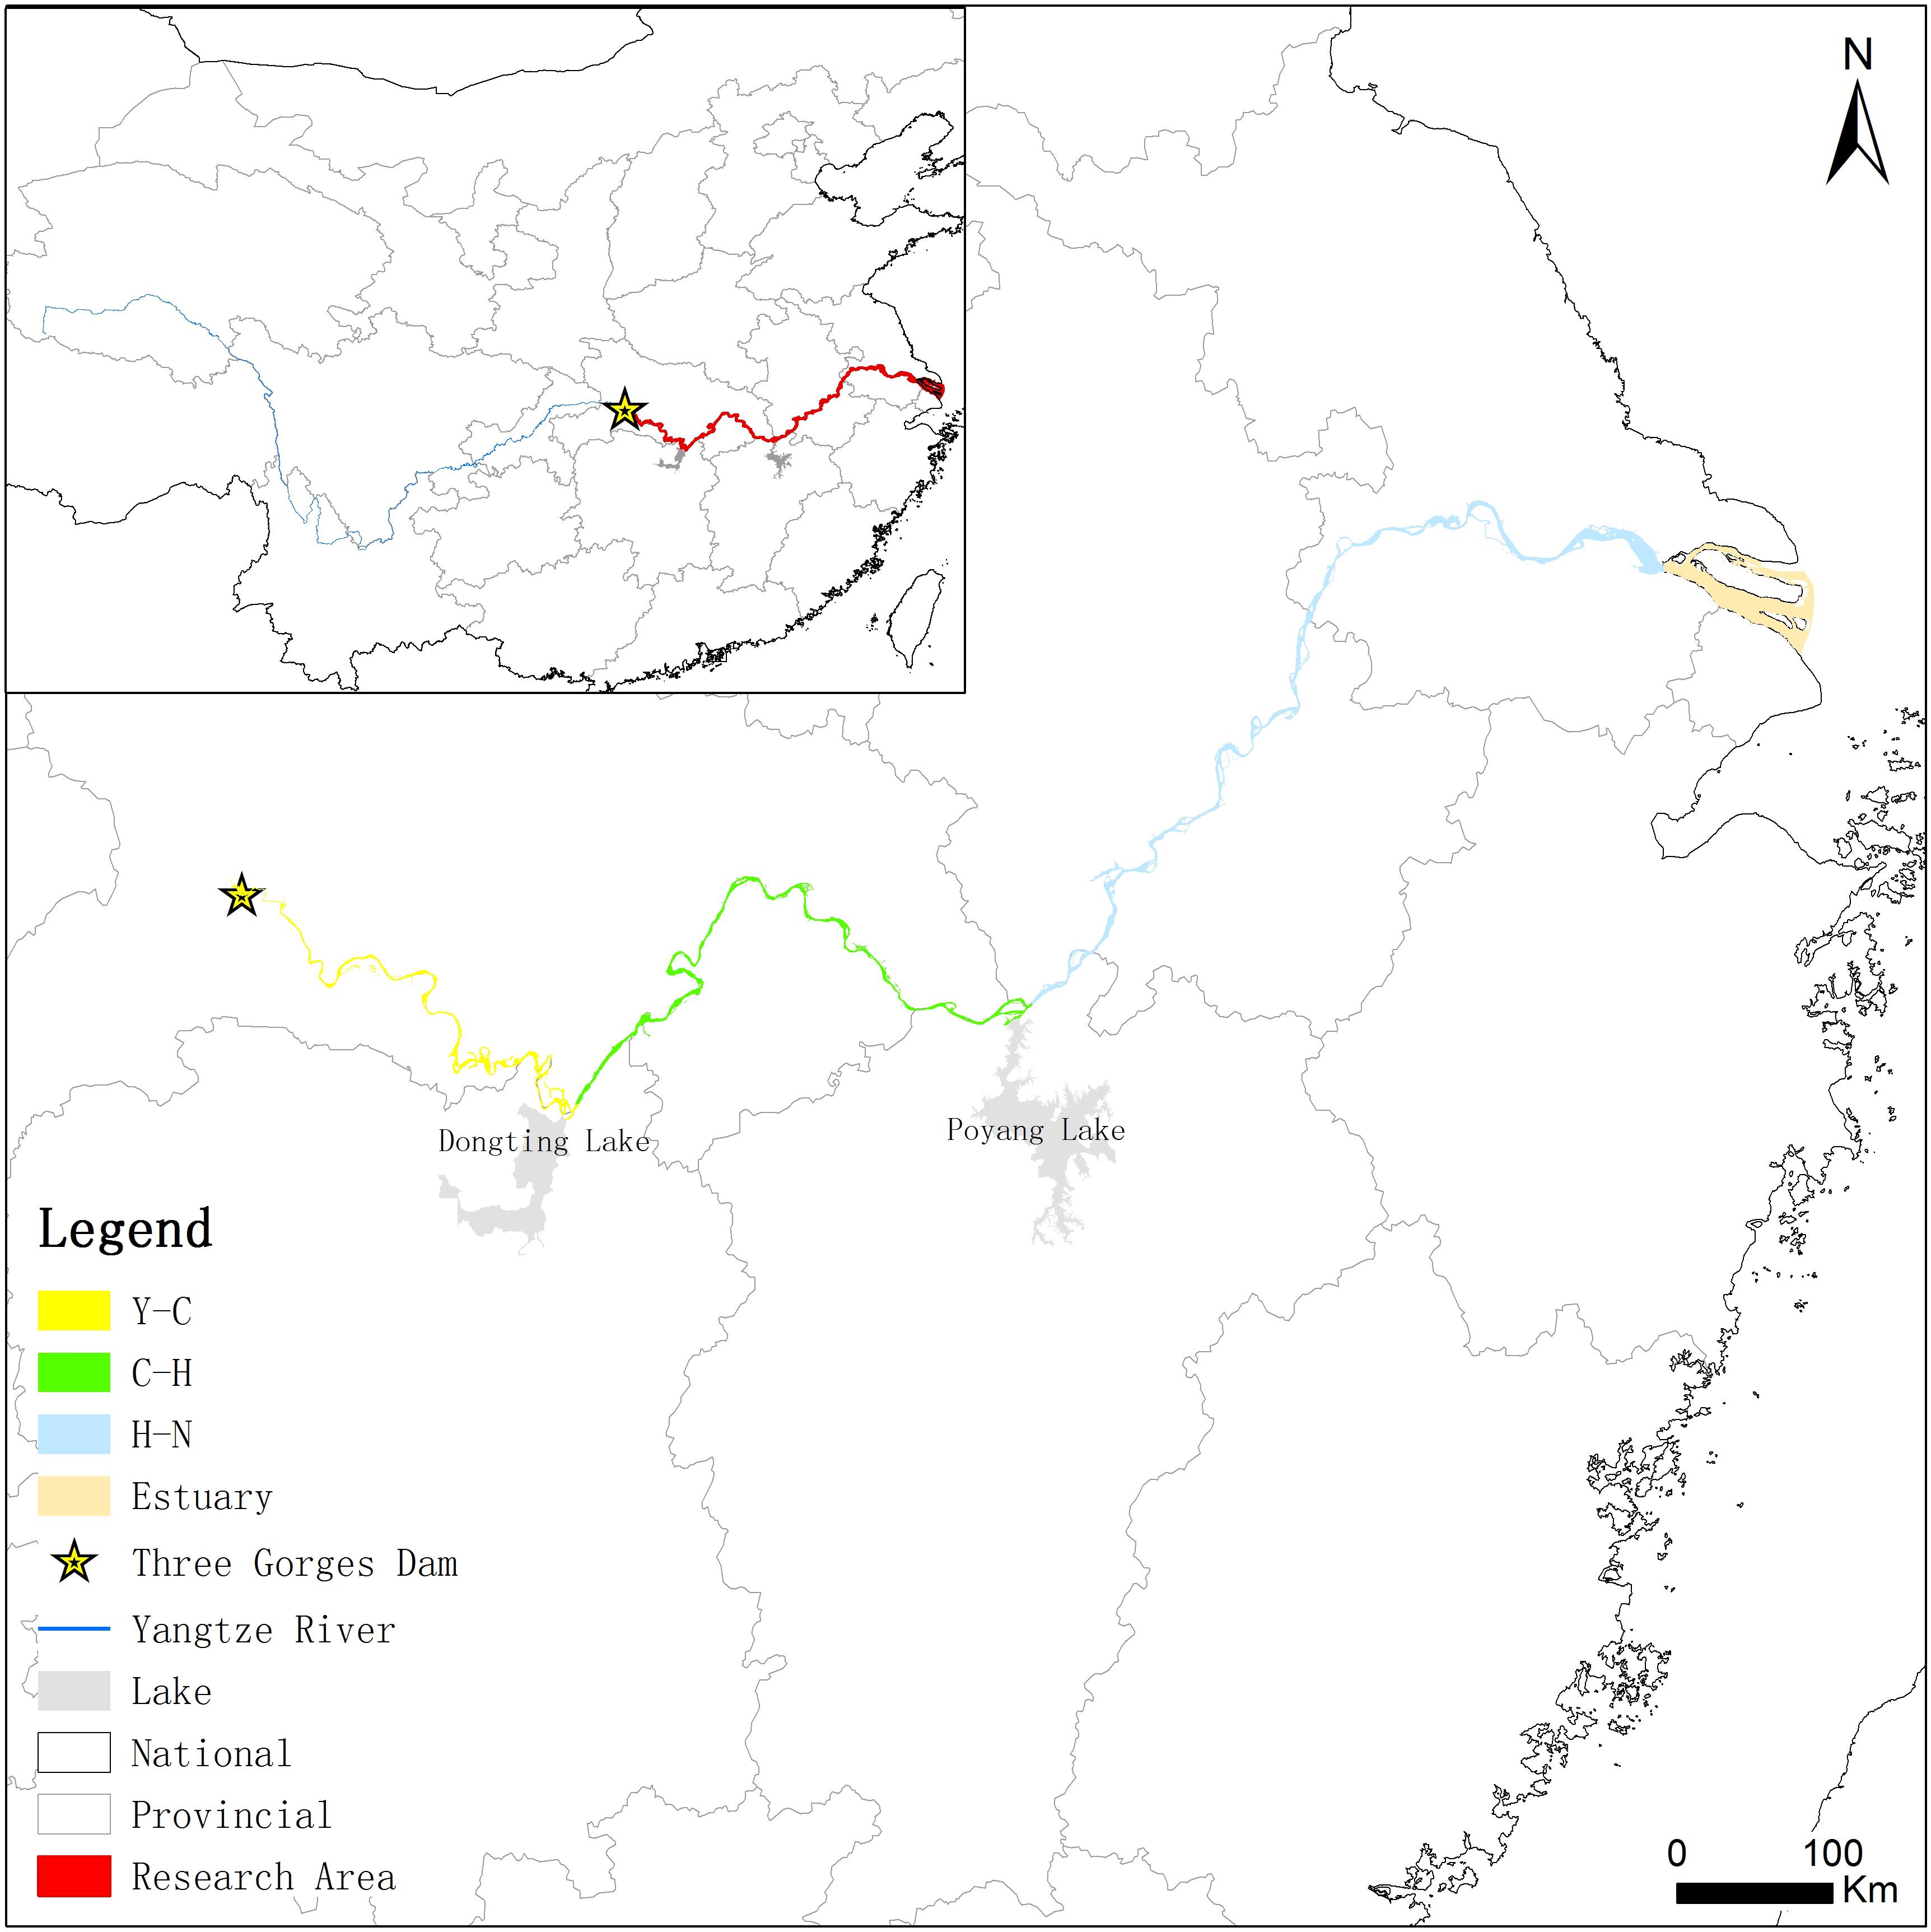
Figure 1. Study area.
Data Collection
Wetland datasets in 1990, 2000, 2005, 2010, and 2015 were produced by extracting floodplain areas from land-use maps obtained from the Resource and Environment Data Cloud Platform1. Land-use maps were generated by human-computer interactive software, using Landsat TM/ETM remote sensing images of each period as main data source. Images in early March or late October when water level is stable were selected to avoid influence of water level fluctuation on image interpretation. All selected images were projected in the Conical Projection of Albers Orthogonal Axis with Equal Area and Double Standard Latitude Lines. The reliability of these datasets and monitoring data was verified and firmly quality controlled before their release. The locations of stations are shown in Figure 1.
Data Analysis
According to ecological characteristics of the study area, we applied CNLUCC method to generate maps based on a unified land-use and plant classification system and to connect individual remote images. All data analysis was conducted with interactive QGIS software. We first constructed maps within laboratory and then verified them on-site to minimize errors in computer interpretation. Remote sensing data analysis included data collection, false color composite generation, image data correction, image data cutting, and establishment of info-source of remote database.
For standard false color composites, the TM images used bands 4, 3, and 2; MSS4-5 used bands 4, 2, and 1; and MSS1-3 used bands 7, 5, and 42. Since the TGD began operations in 2003, remote sensing data from 1990, 2000, 2005, 2010, and 2015 were used for the interpretation. According to characteristics of wetlands in the middle and lower reaches of the Yangtze River, we divided wetlands into two types, i.e., water surface and floodplains.
Transition matrix were built to characterize impact of the TGD on spatial distribution of wetlands using four periods of remote sensing data and dividing them into time before (1990–2000) and after (2005–2015) TGD operations.
Firstly, we applied transition matrix analysis to identify how wetlands changed after the TGD operation. Then, we conducted a comparative analysis to determine the differences in transition periods and analyze impact of the TGD operation on spatial distribution of wetlands. We calculated two kinds of transition rates, PS–F and PF–S:
where AS–TF is total area of water surface that is converted into floodplains, and AS is area covered in water surface;
where AF–TS is total area of floodplain that is converted into all types of water surface, and AF is area classified as floodplains.
According to characteristics of different parameters, we chose class and landscape metrics as main parameters to analyze impacts of the TGD on landscape, and we utilized land-use data from 2000 and 2015 for data before and after the operation of the TGD, respectively. We used FRAGSTATS to calculate Percentage of Landscape (PLAND), Number of Patches (NP), Patch Density (PD), and Mean Patch Areas (AREA_MN) to analyze impacts of the TGD operation on wetland fragmentation.
To predict impact of the TGD operation on spatial distribution of wetlands in the middle and lower reaches of the Yangtze River, we applied a Cellular Automata_Markov chain (CA_Markov) model to predict trend of floodplain changes caused by operation of the TGD. This model is a long-term forecasting method based on a Markov chain procedure, which predicts change in every future moment (or period), according to situation and probability of an event at a certain time. Key is to determine probability of event occurrence and transitions (Anderson and Goodman, 1957). CA is a grid dynamic model with discrete time, space, and state variables that has ability to simulate spatiotemporal evolution process of complex systems. The CA_Markov model is a combination of the Markov chain and CA models in IDRISI software. It makes full use of advantages of the Markov chain to make long-term predictions and ability of CA to simulate spatial variations in complex systems, thereby forecasting future changes based on existing land-use patterns.
Test of predictive power of CA-Markov model: We used cross tabulation method to calculate Kappa index for model test, using 1990 and 1995 data in N-E to predict spatial distribution of wetlands in 2000. Then we did cross tabulation between predictive and real spatial distribution of the N-E wetlands in 2000, with the Kappa index 0.97 which confirm model is reliable (Li et al., 2020; Lu et al., 2020; Wang et al., 2020). Figure 2 shows comparison results of predictive and real spatial distribution of wetlands in 2000.
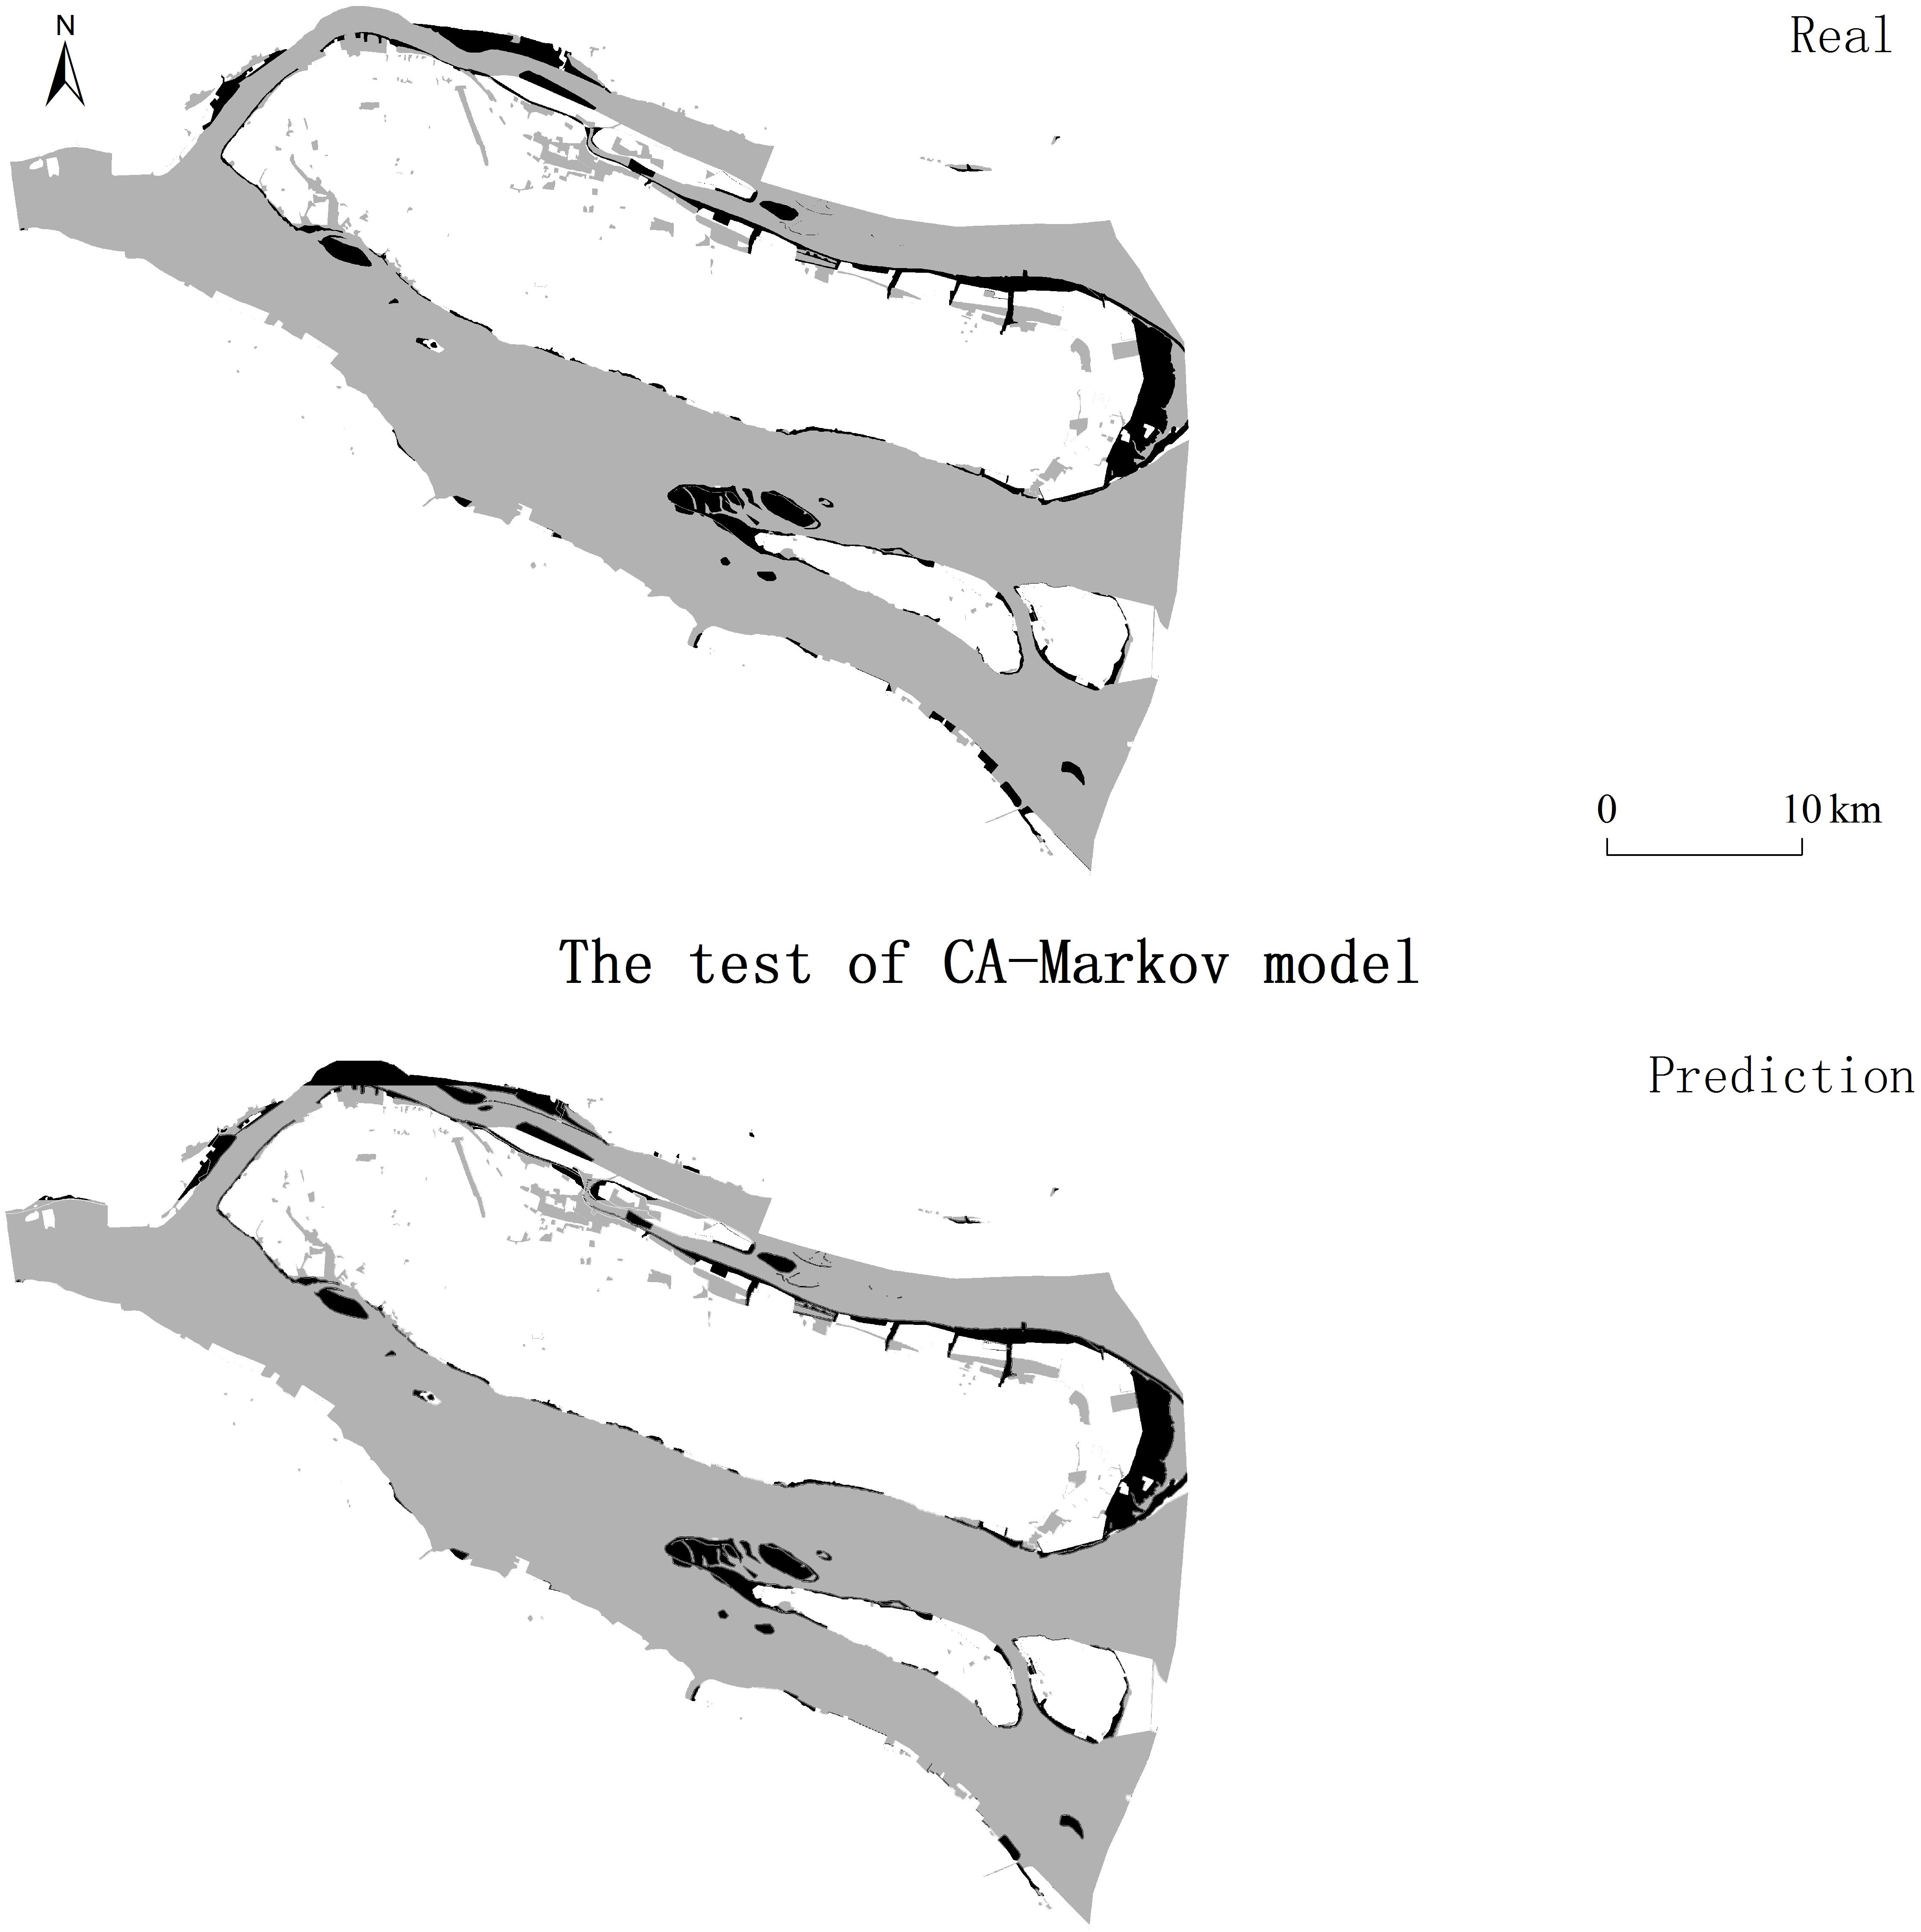
Figure 2. Test of CA-Markov model.
1990 and 2000 interpretation data were used to predict spatial distribution of wetlands in 2010 and 2030 under assumption of no TGD. We also used 2005 and 2015 data to predict distribution of wetlands in 2030 under assumption of the TGD operation.
We calculated areas of floodplains and compared distribution of wetlands in simulated and actual 2010 scenarios. We then calculated floodplain area in 2030 under both scenarios and siltation rate (Ps) difference from 2010 to 2030:
where Ps is siltation rate, A2030 is area of floodplain in 2030, and A2010 is area of floodplain in 2010.
Results
Changes in Wetland Spatial Structure After the TGD Operation
Yichang-Chenglingji Section
In Yichang-Chenglingji section (Y-C), before the operation of the TGD, the floodplain areas increased by 1613.86 ha from 1990 to 2000, due to increased transition rate from water surface to floodplains (W-F), and reduced transition rate from floodplains to water surface (F-W) (Table 1). However, after the operation of the TGD, floodplain area decreased by 1,738.2 ha, due to increased transition rate from floodplains to water surface (Table 1). We performed spatial overlay analysis on change in spatial structure between water surface and floodplains during (1990–2000) and (2005–2015). Results showed that floodplain areas decreased in upstream section of Y-C and increased with more red-color areas in downstream region of Y-C (Figure 3).
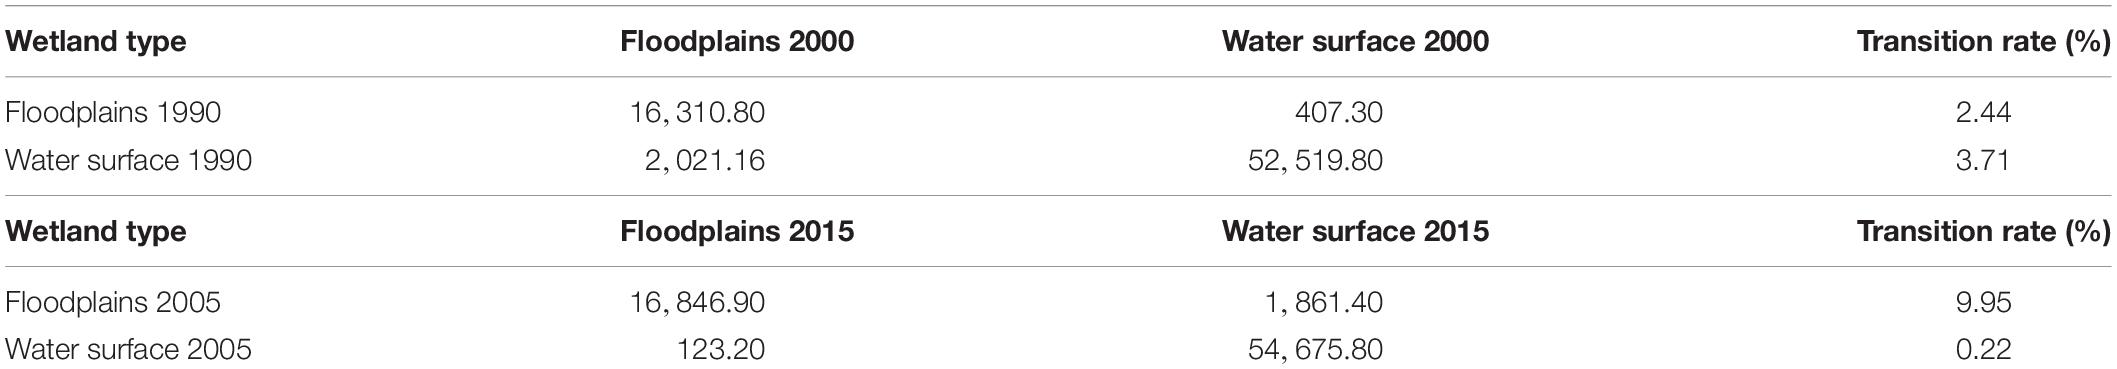
Table 1. Wetland transition in the Yichang-Chenglingji section between 1990–2000 and 2005–2015 (area unit: ha).
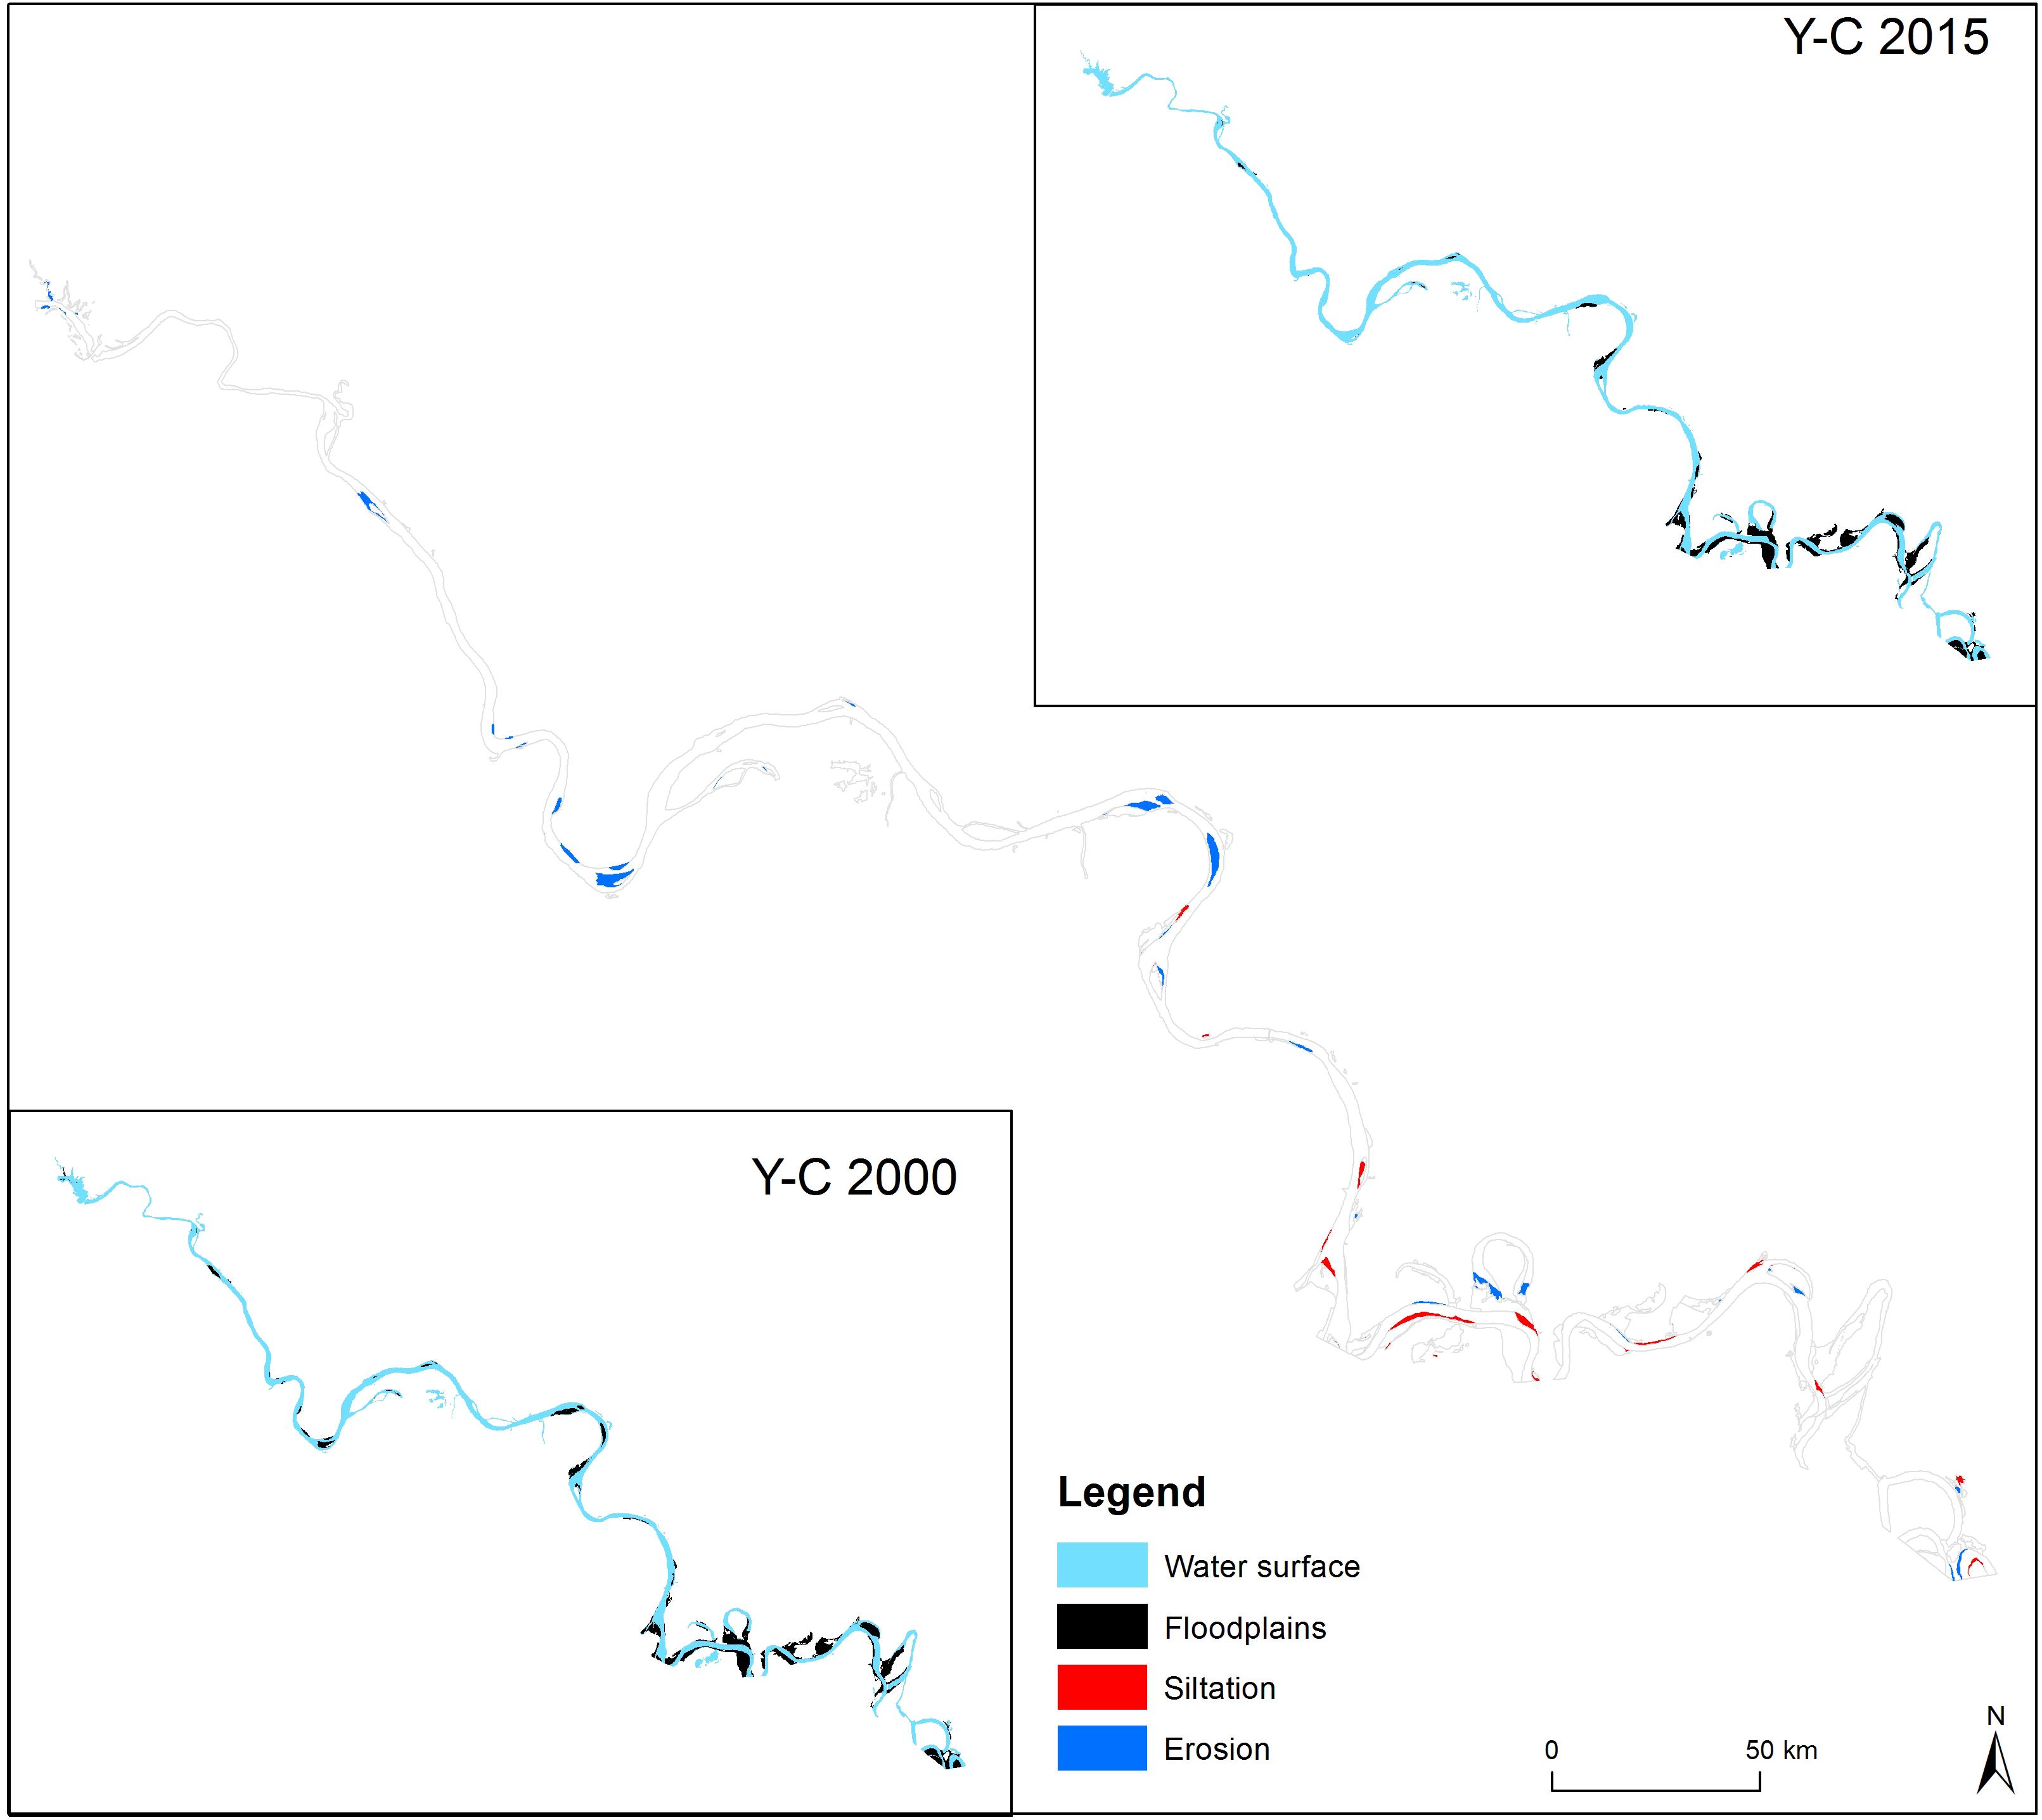
Figure 3. Comparison of spatial transition with and without dam in Y-C.
Chenglingji-Hhukou Section
In Chenglingji-Hhukou section (C-H), transition rate from water surface to floodplains maintained as same (1.67%) both before and after the operation of the TGD, whereas transition rate from floodplains to water surface showed increase from 1.38 to 3.77% (Table 2). However, overlay analysis between 2000 and 2015 indicated no clear pattern of spatial transition from floodplains to water surface (Figure 4).
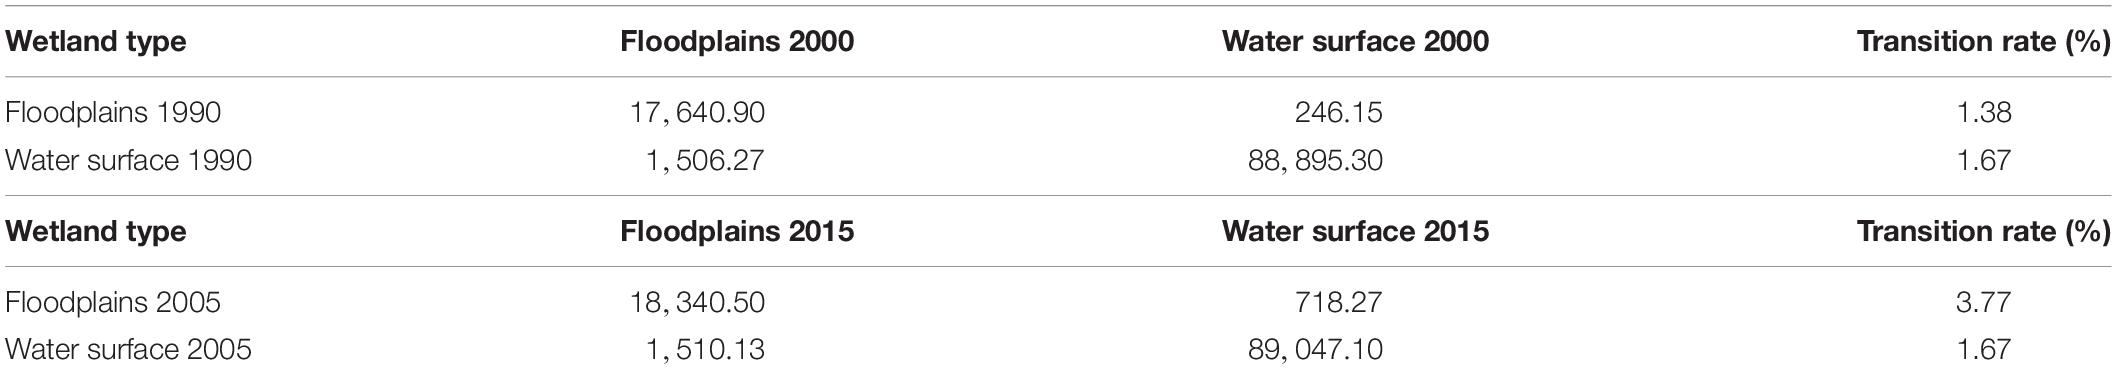
Table 2. Wetland transition in the Chenglingji-Hukou section between 1990–2000 and 2005–2015 (area unit: ha).
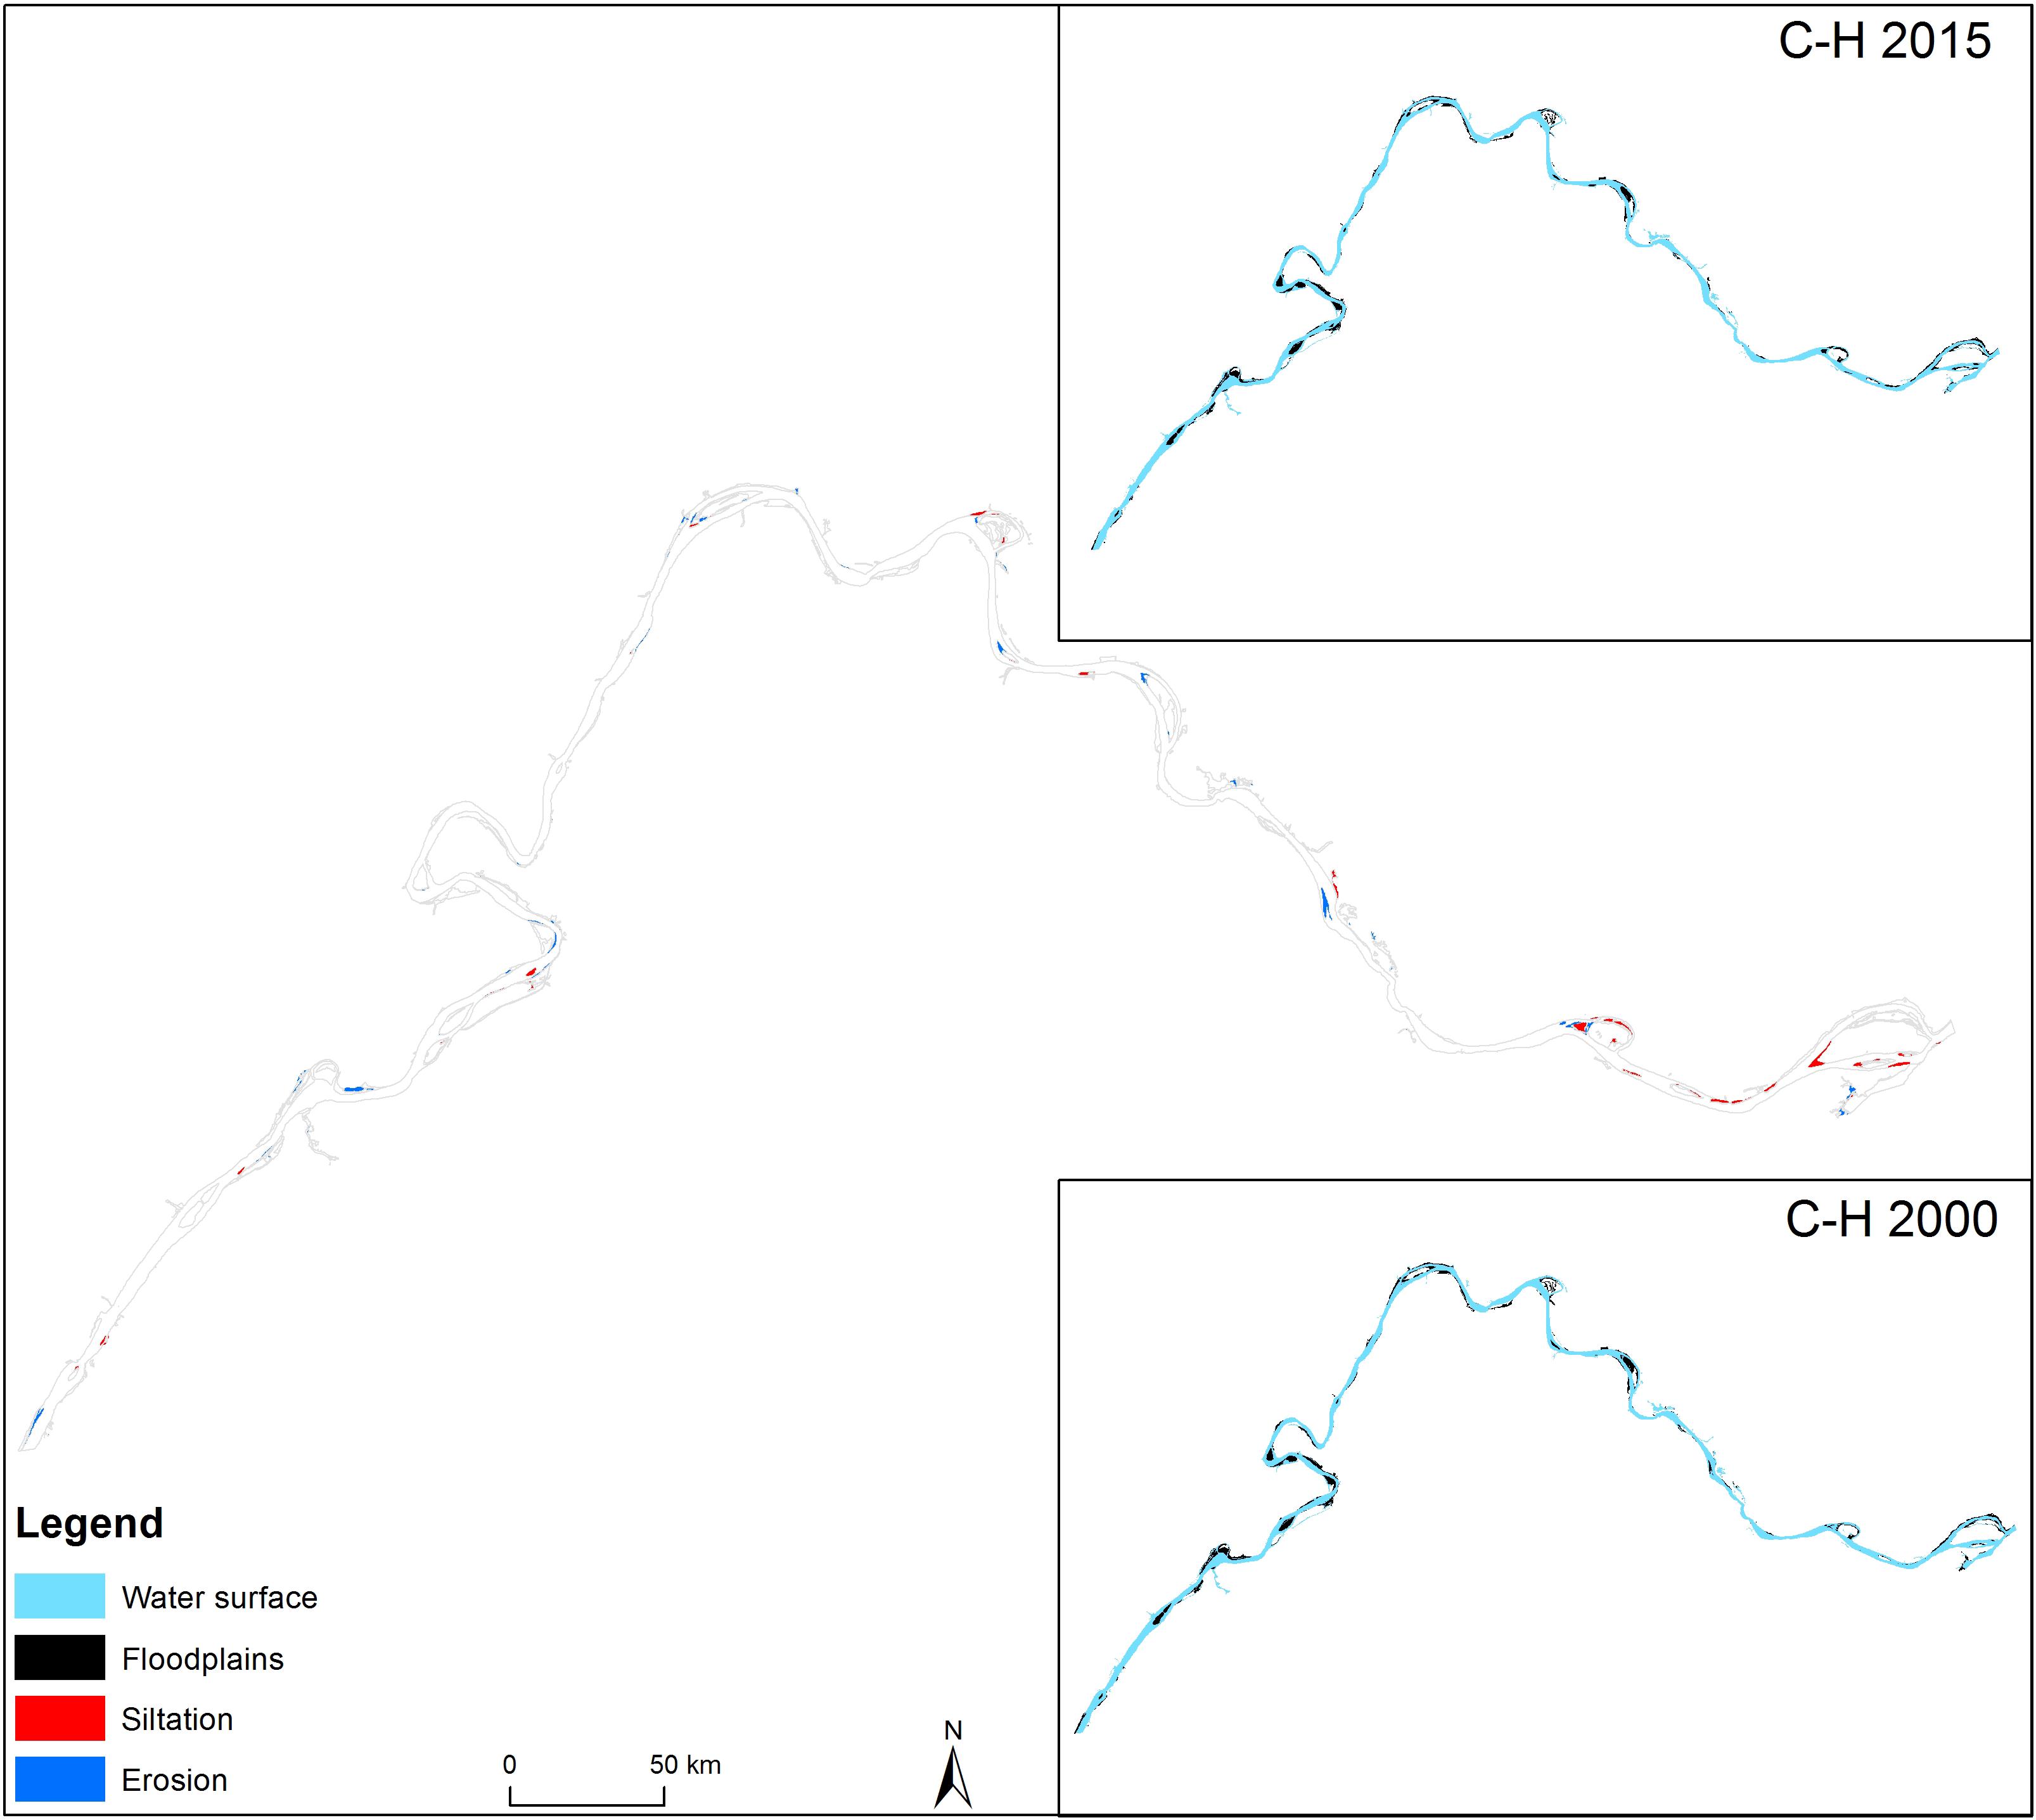
Figure 4. Comparison of spatial transition with and without dam in C-H.
Hukou-Nantong Section
In Hukou-Nantong section (H-N), the floodplain areas increased by 4,547.97 ha transition rate from water surface to floodplains was 0.33% before and it increased to 2.72% after. Transition of water surface to floodplain were 635.85 ha before the operation of the TGD and increased to 5,183.82 ha afterward (Table 3). Based on spatial overlay analysis of water surface and floodplains in H-N section, the added floodplain area extended around original floodplain patches, and they were mainly distributed in downstream region of H-N section, close to estuary (Figure 5).
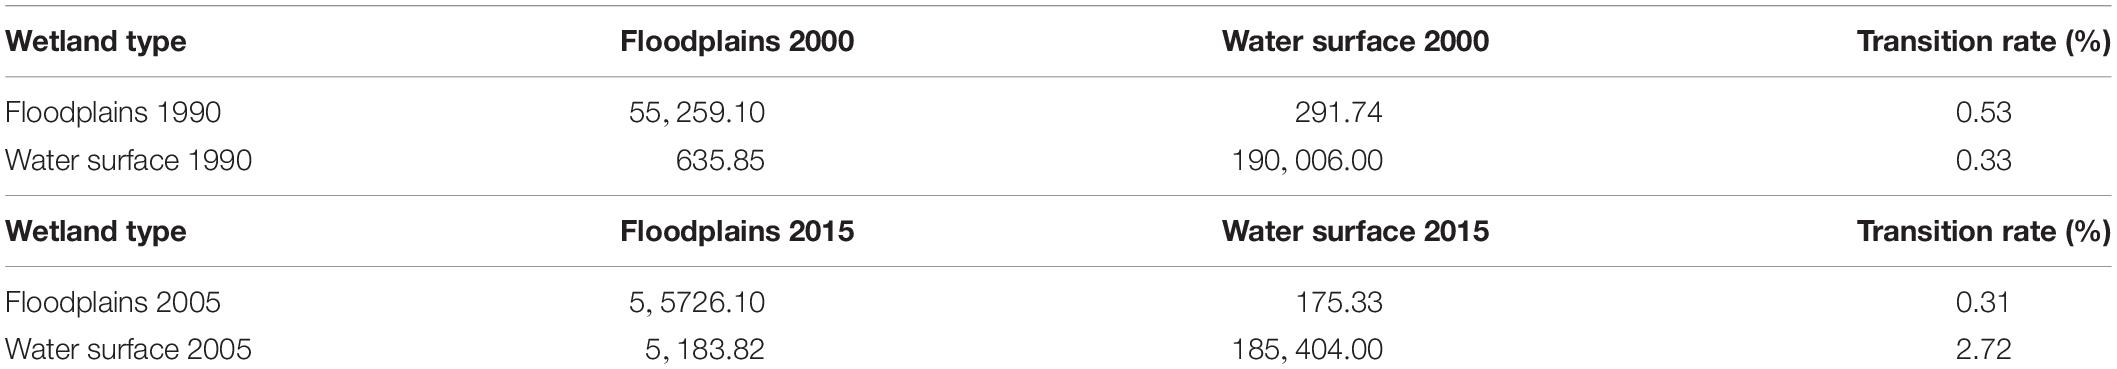
Table 3. Wetland transition in Hukou-Nantong section between 1990–2000 and 2005–2015 (area unit: ha).
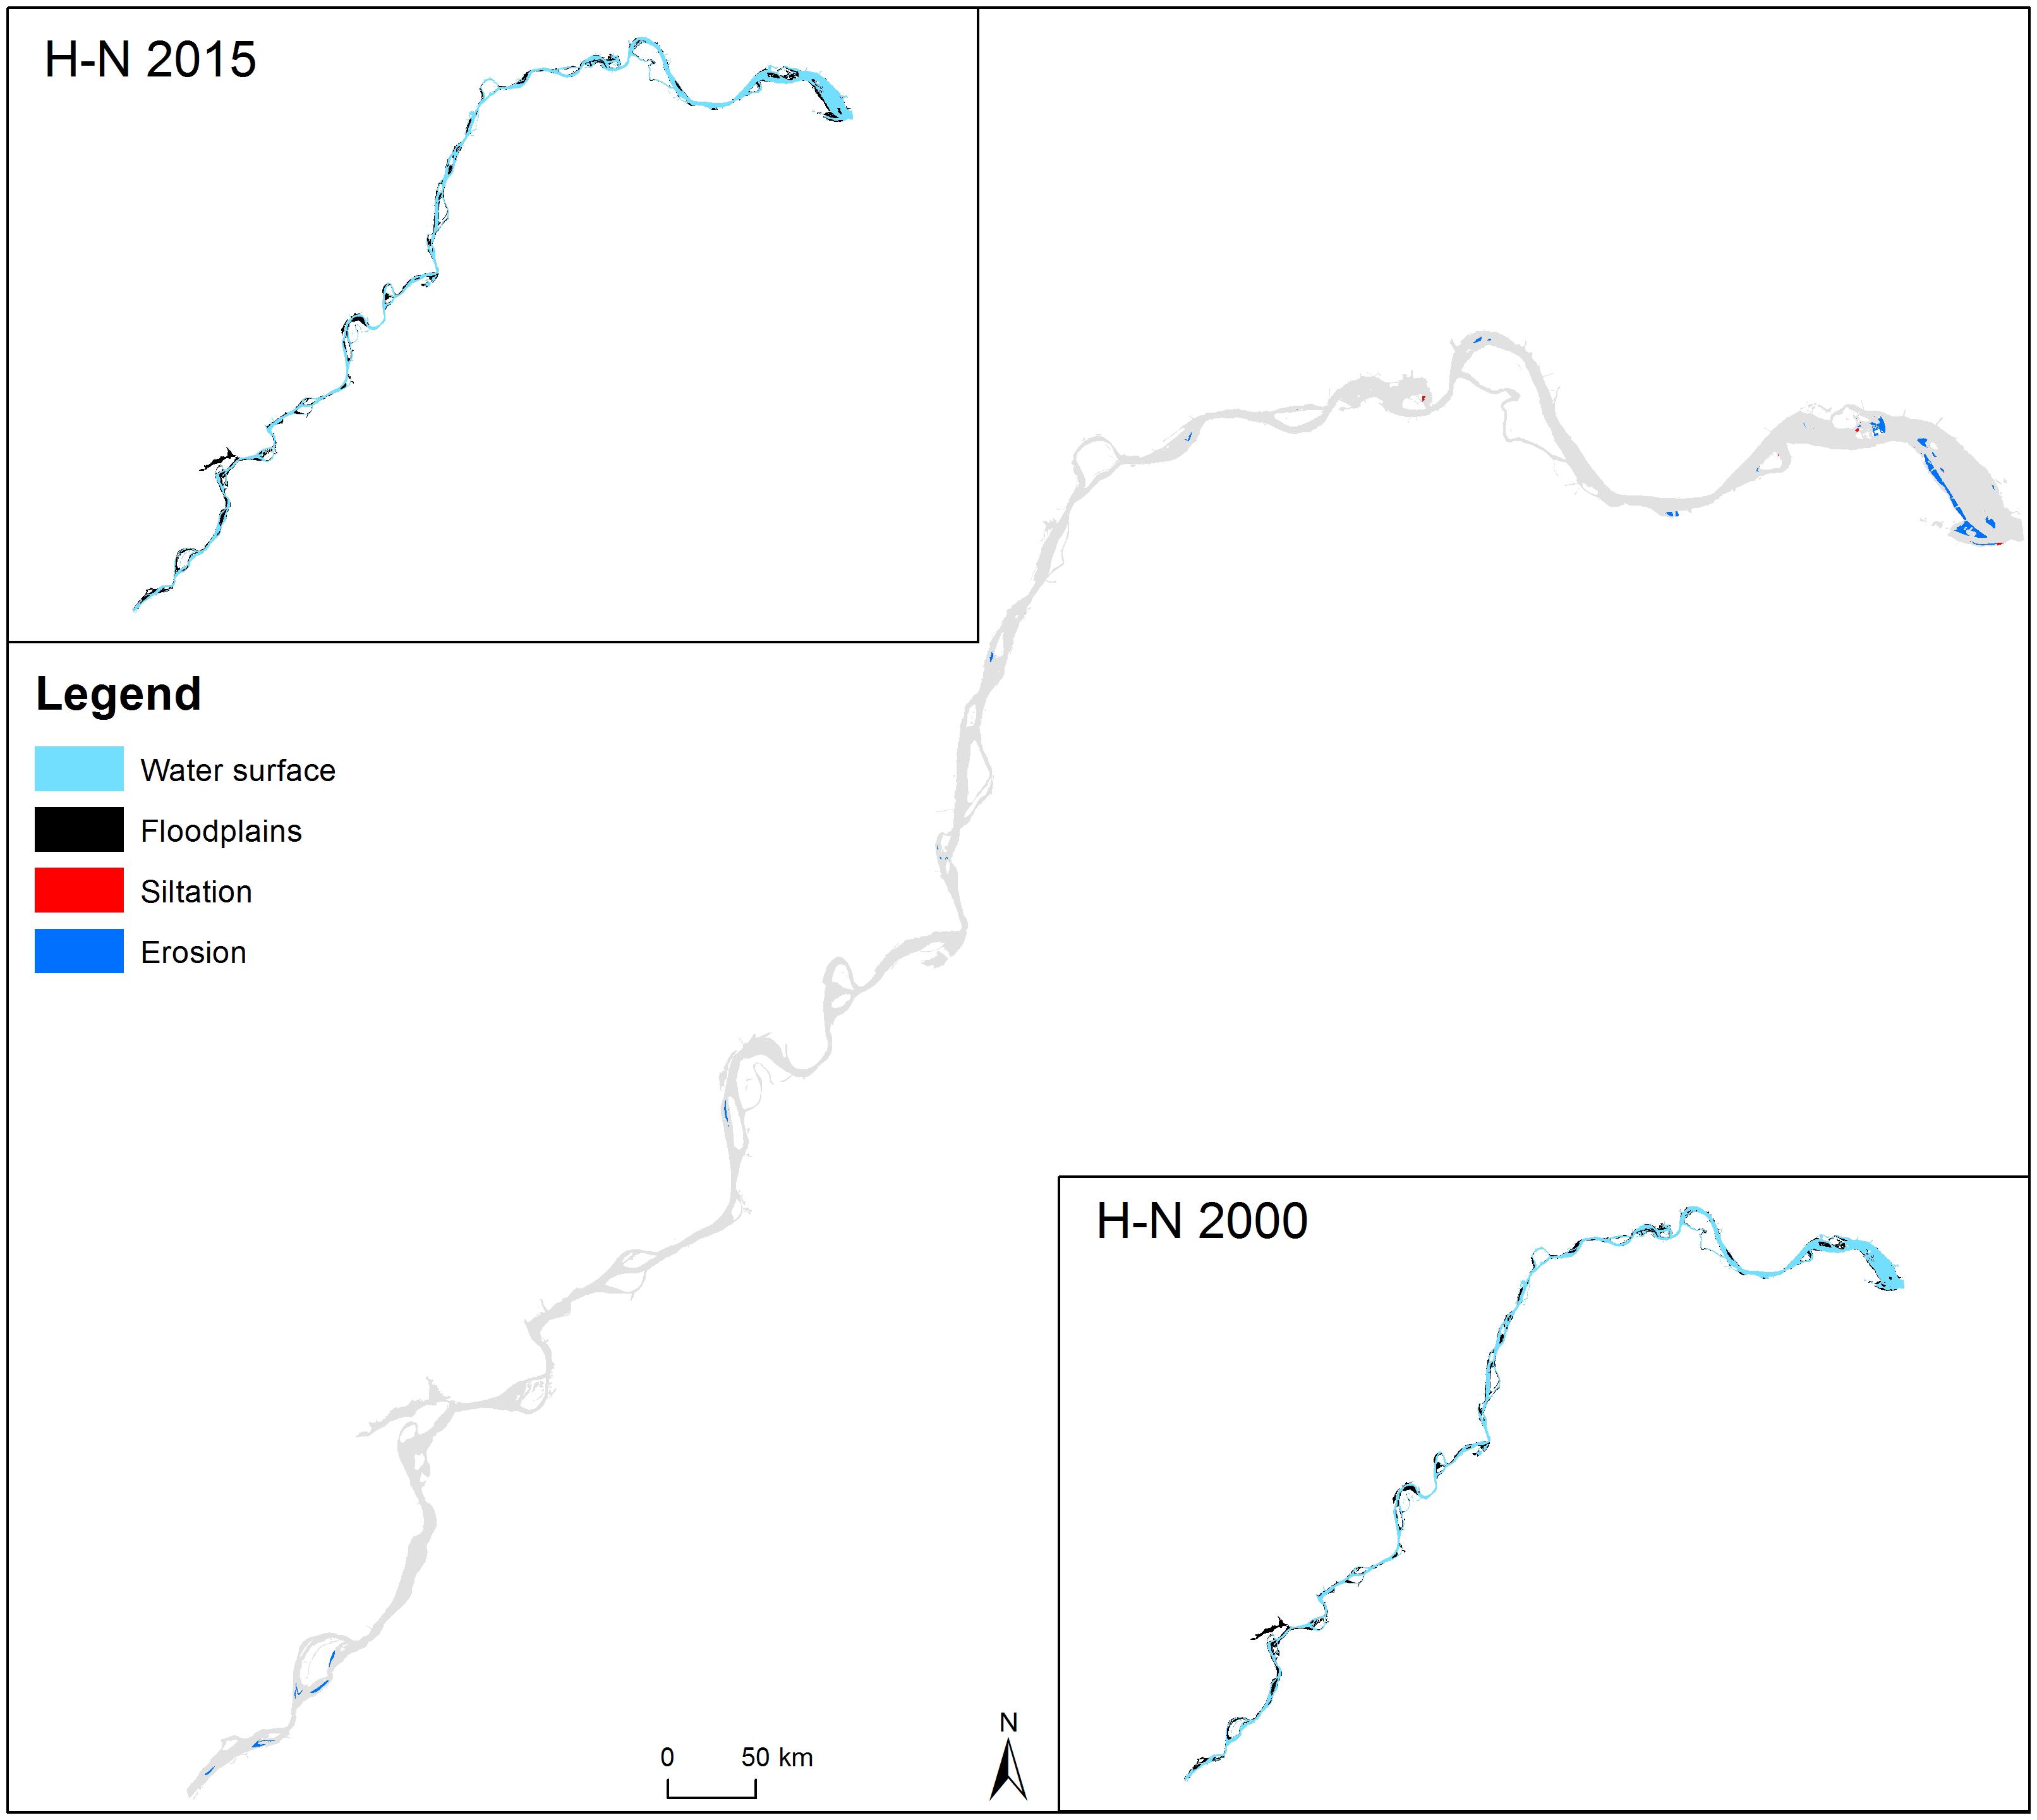
Figure 5. Comparison of spatial transition with and without dam in H-N.
Impact of the TGD on Wetland Landscapes in the Middle and Lower Reaches of the Yangtze River
Yichang-Chenglingji Section
After the operation of the TGD, fragmentation of the water surface and floodplain reduced. Results of FRAGSTATS analysis showed that number of patches (NP) and patch density (PD) indexes of water surface and floodplains decreased in Y-C. Further, percentage of landscape (PLAND) index of water surface increased and that of the floodplain decreased. Mean patch areas (AREA_MN) index of water surface increased from 138.05 to 404.72 ha, while floodplain increased from 57.69 to 137.99 ha (Table 4).
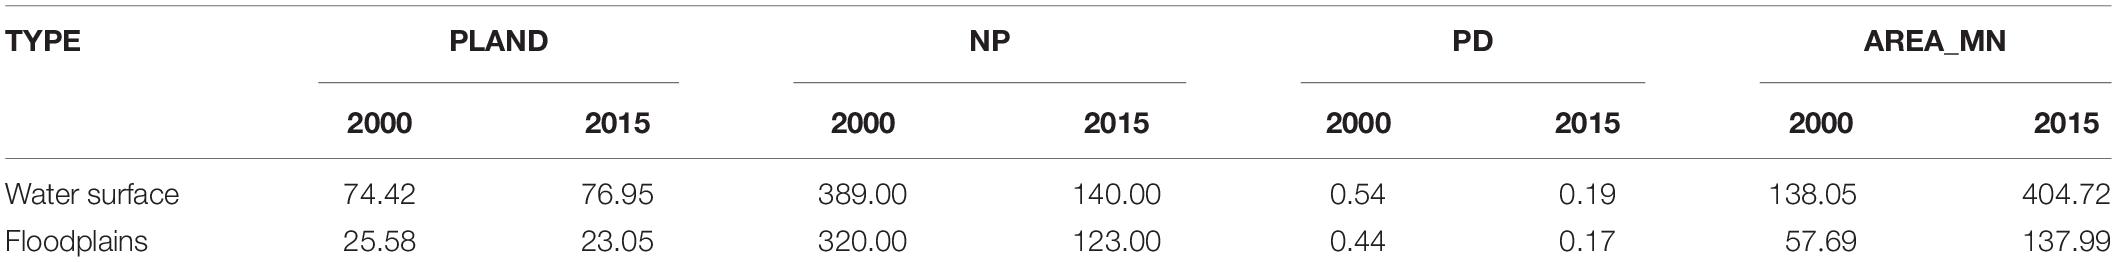
Table 4. Wetland landscape of Yibin-Chenglingji section in 2000 and 2015.
Chenglingji-Hukou Section
After the operation of the TGD, fragmentation of water surface and floodplain reduced, siltation was not significant in Chenglingji-Hukou section. Results show that NP index of water surface decrease from 517 to 130, the index of floodplains decreased from 565 to 251. PLAND index of water surface decreased, and that of floodplains increased. AREA_MN index of floodplains and water surface increased, but increasing was relatively small from 34.3 to 79.18 ha (Table 5).
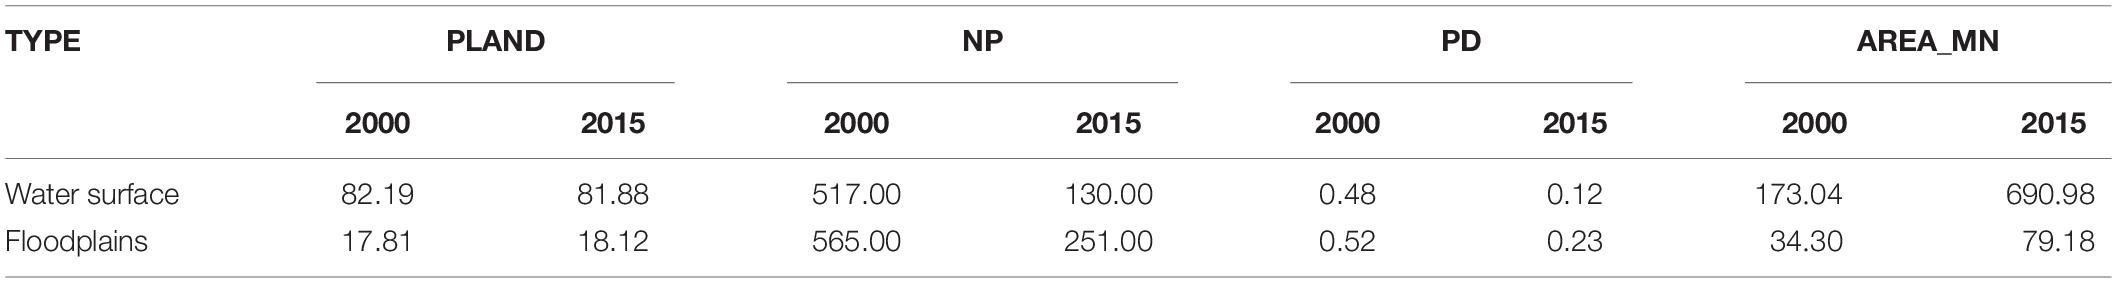
Table 5. Wetland landscape of the Chenglingji-Hukou in 2000 and 2015.
Hukou-Nantong Section
After the operation of the TGD, fragmentation of water surface area increased and floodplains decreased. NP index of surface water increased from 286 to 346, and PD index of the water surface increased from 0.12 to 0.14. NP index of floodplains decreased from 511 to 435, and PD index decreased from 0.21 to 0.18. PLAND index of water surface decreased, and that of floodplain increased. AREA_MN index of water surface decreased from 665.9 to 537.72 ha, meanwhile floodplain increased from 109.39 to 140.78 ha, after the operation of the TGD (Table 6).
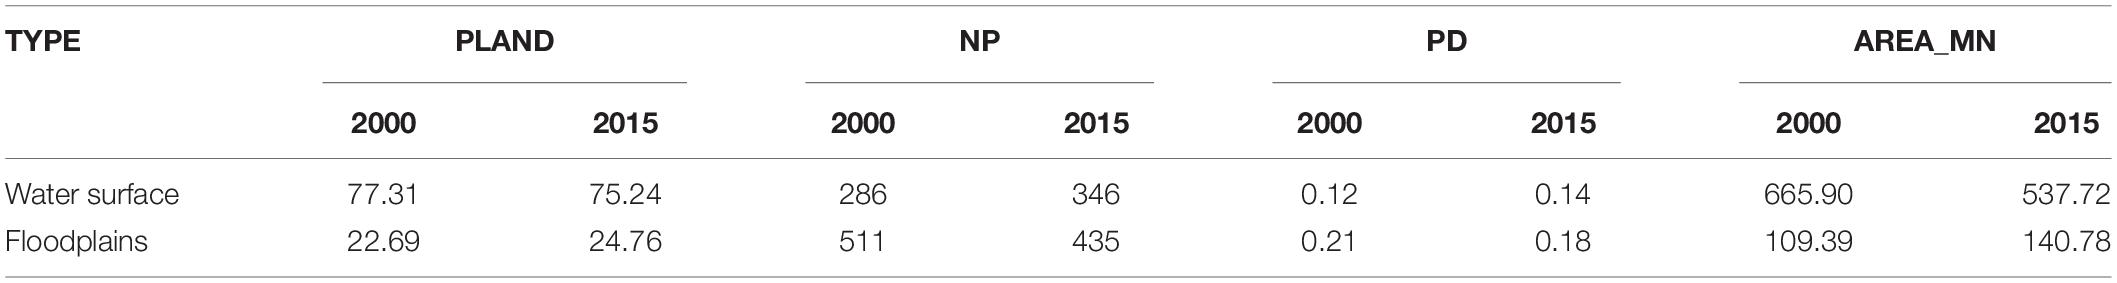
Table 6. Wetland landscape of the Hukou-Nantong in 2000 and 2015.
Predictions of Wetland Changes Along Main Stream of the Yangtze River
CA_Markov model prediction for 2030 indicates (Figure 6), under the operation of the TGD, immediate downstream, Yichang-Chenglingji section will become more eroded (from 0.0021 to 0.1790), in Chenglingji-Hukou section, siltation rate will be lowered from 0.14 to 0.11, whereas in Hukou-Nantong section, siltation rate will be increased from 0.05 to 0.15 (Table 7).
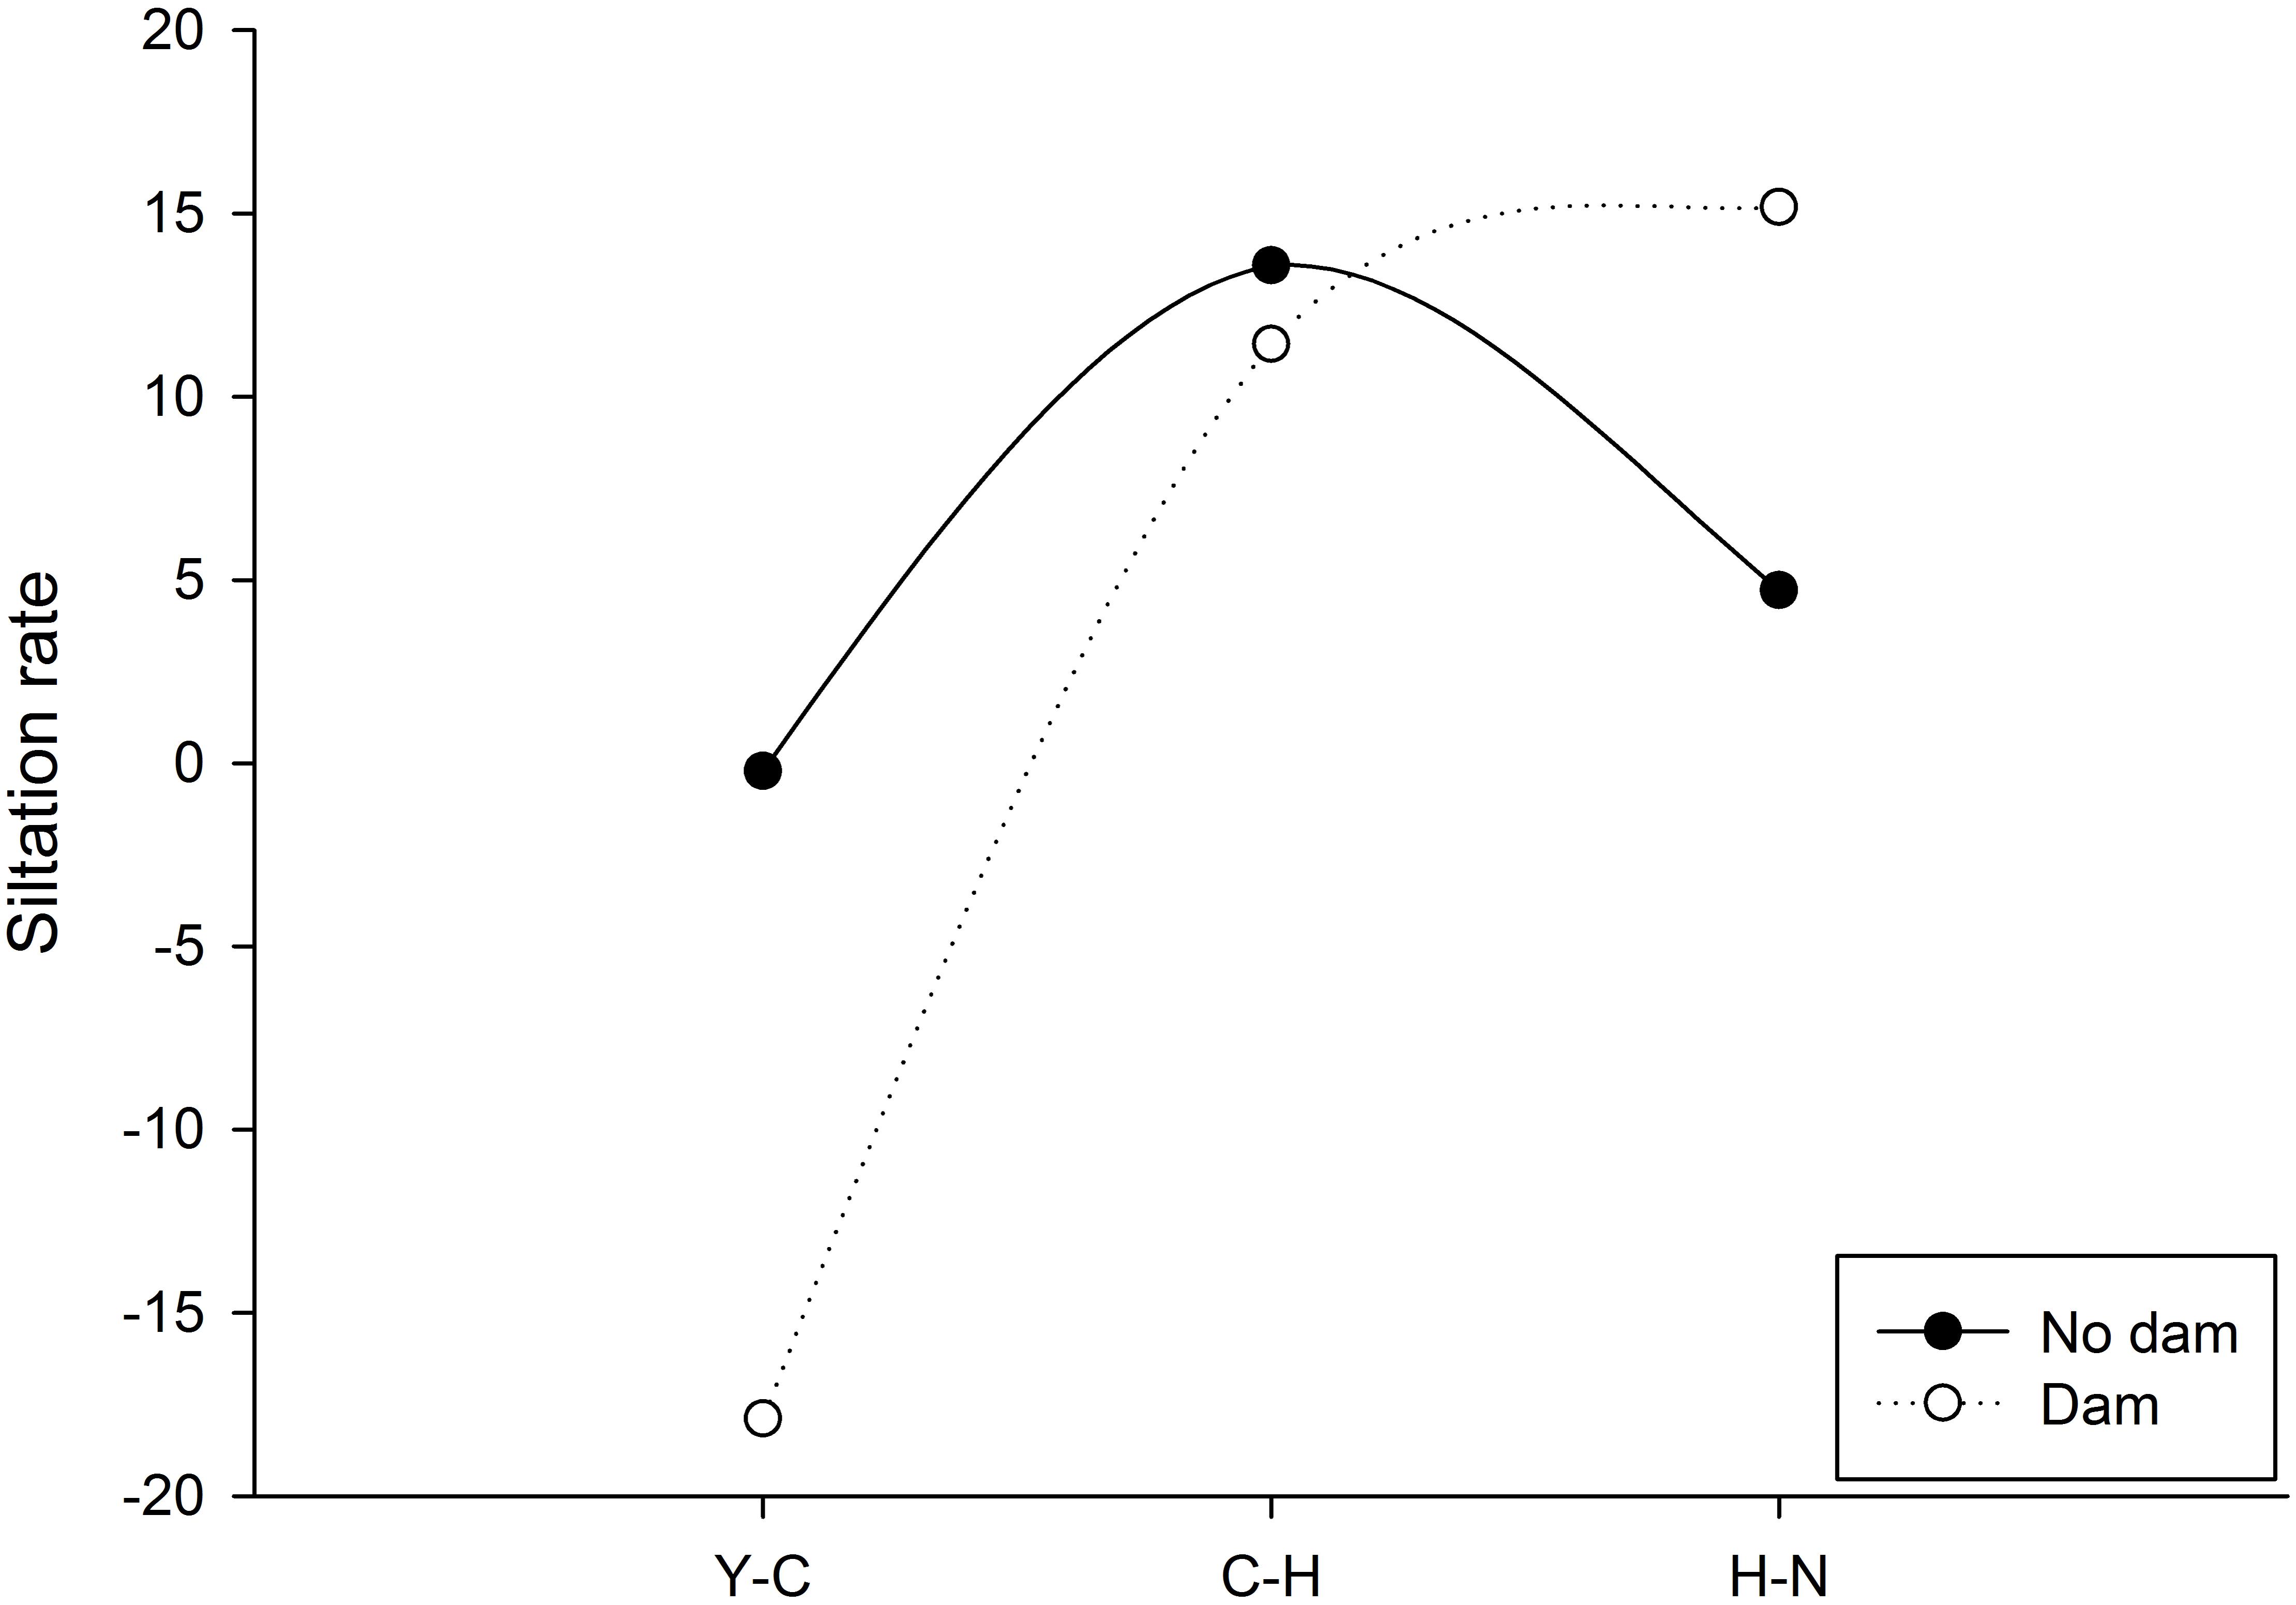
Figure 6. Siltation index trends with and without dam.
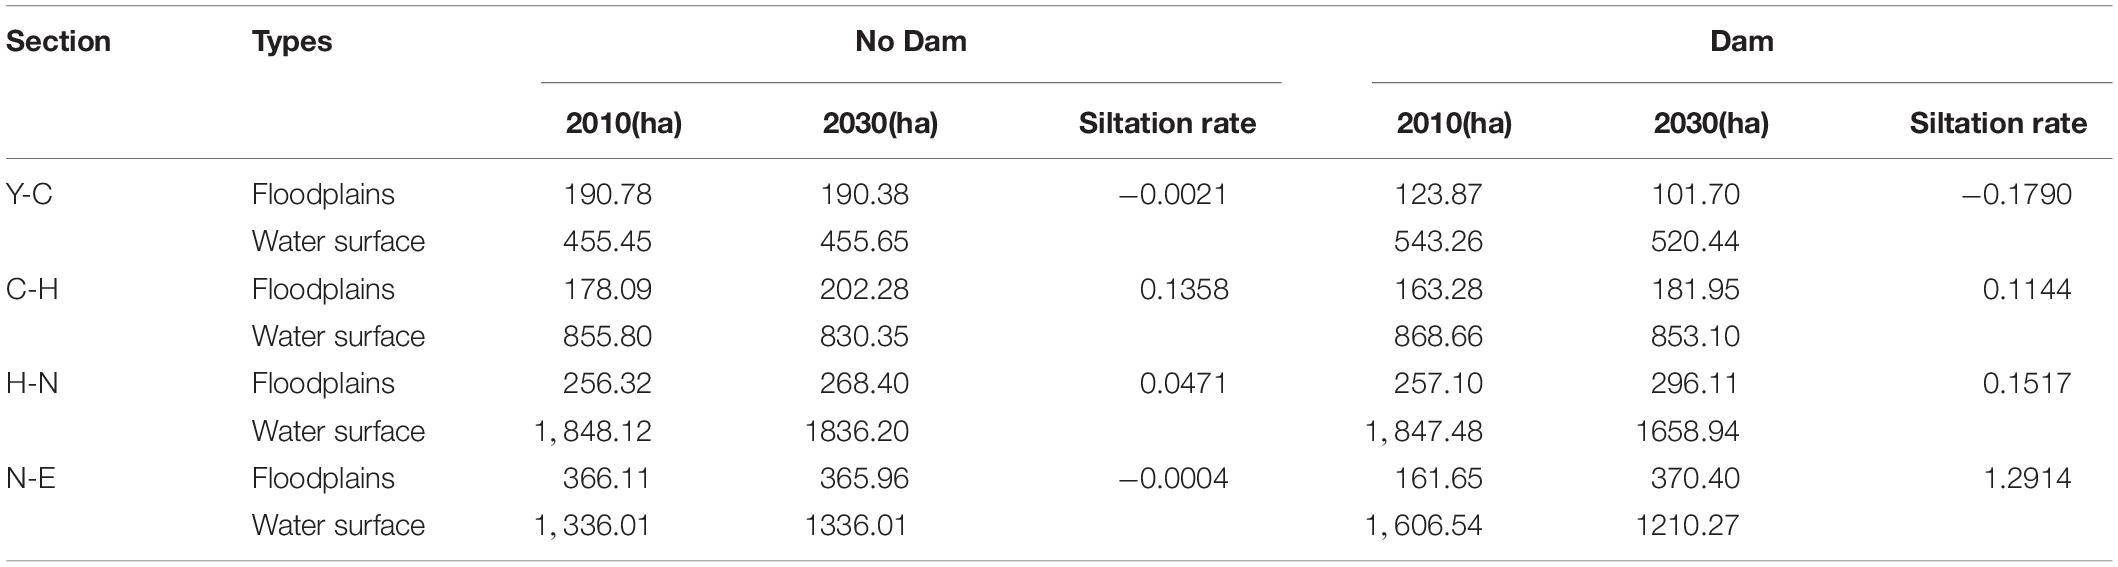
Table 7. No dam and dam siltation areas and rate in the middle and lower reaches of the Yangtze river.
Estuary Wetland Spatial Distribution and Landscape Pattern Changes
Estuary Wetland Spatial Structure Changes
Before the operation of the TGD, estuary experienced erosion, as transition rate from floodplains to water surface was 12.91%, and rate of water surface to floodplains was 0.74%. After the operation of the TGD, transition rate from floodplains to water surface decreased to 12.77%, and water surface to floodplains transition rate increased to 3.83%. Overlay analysis indicated that change in floodplains displayed greater spatial heterogeneity, with the floodplains increased in the north but decreased in the south of Chongming Island. On the other hand, water surface areas increased around edges of floodplains and islands (Figure 7). Under no dam scenario, floodplains and water surface areas reached balance in 2010, and the floodplain areas reached 36,611 ha in 2010, and 36,596 ha in 2030. However, with the operation of the TGD, floodplains will increase from 16,165 ha in 2010 to 37,040 ha (Table 7).
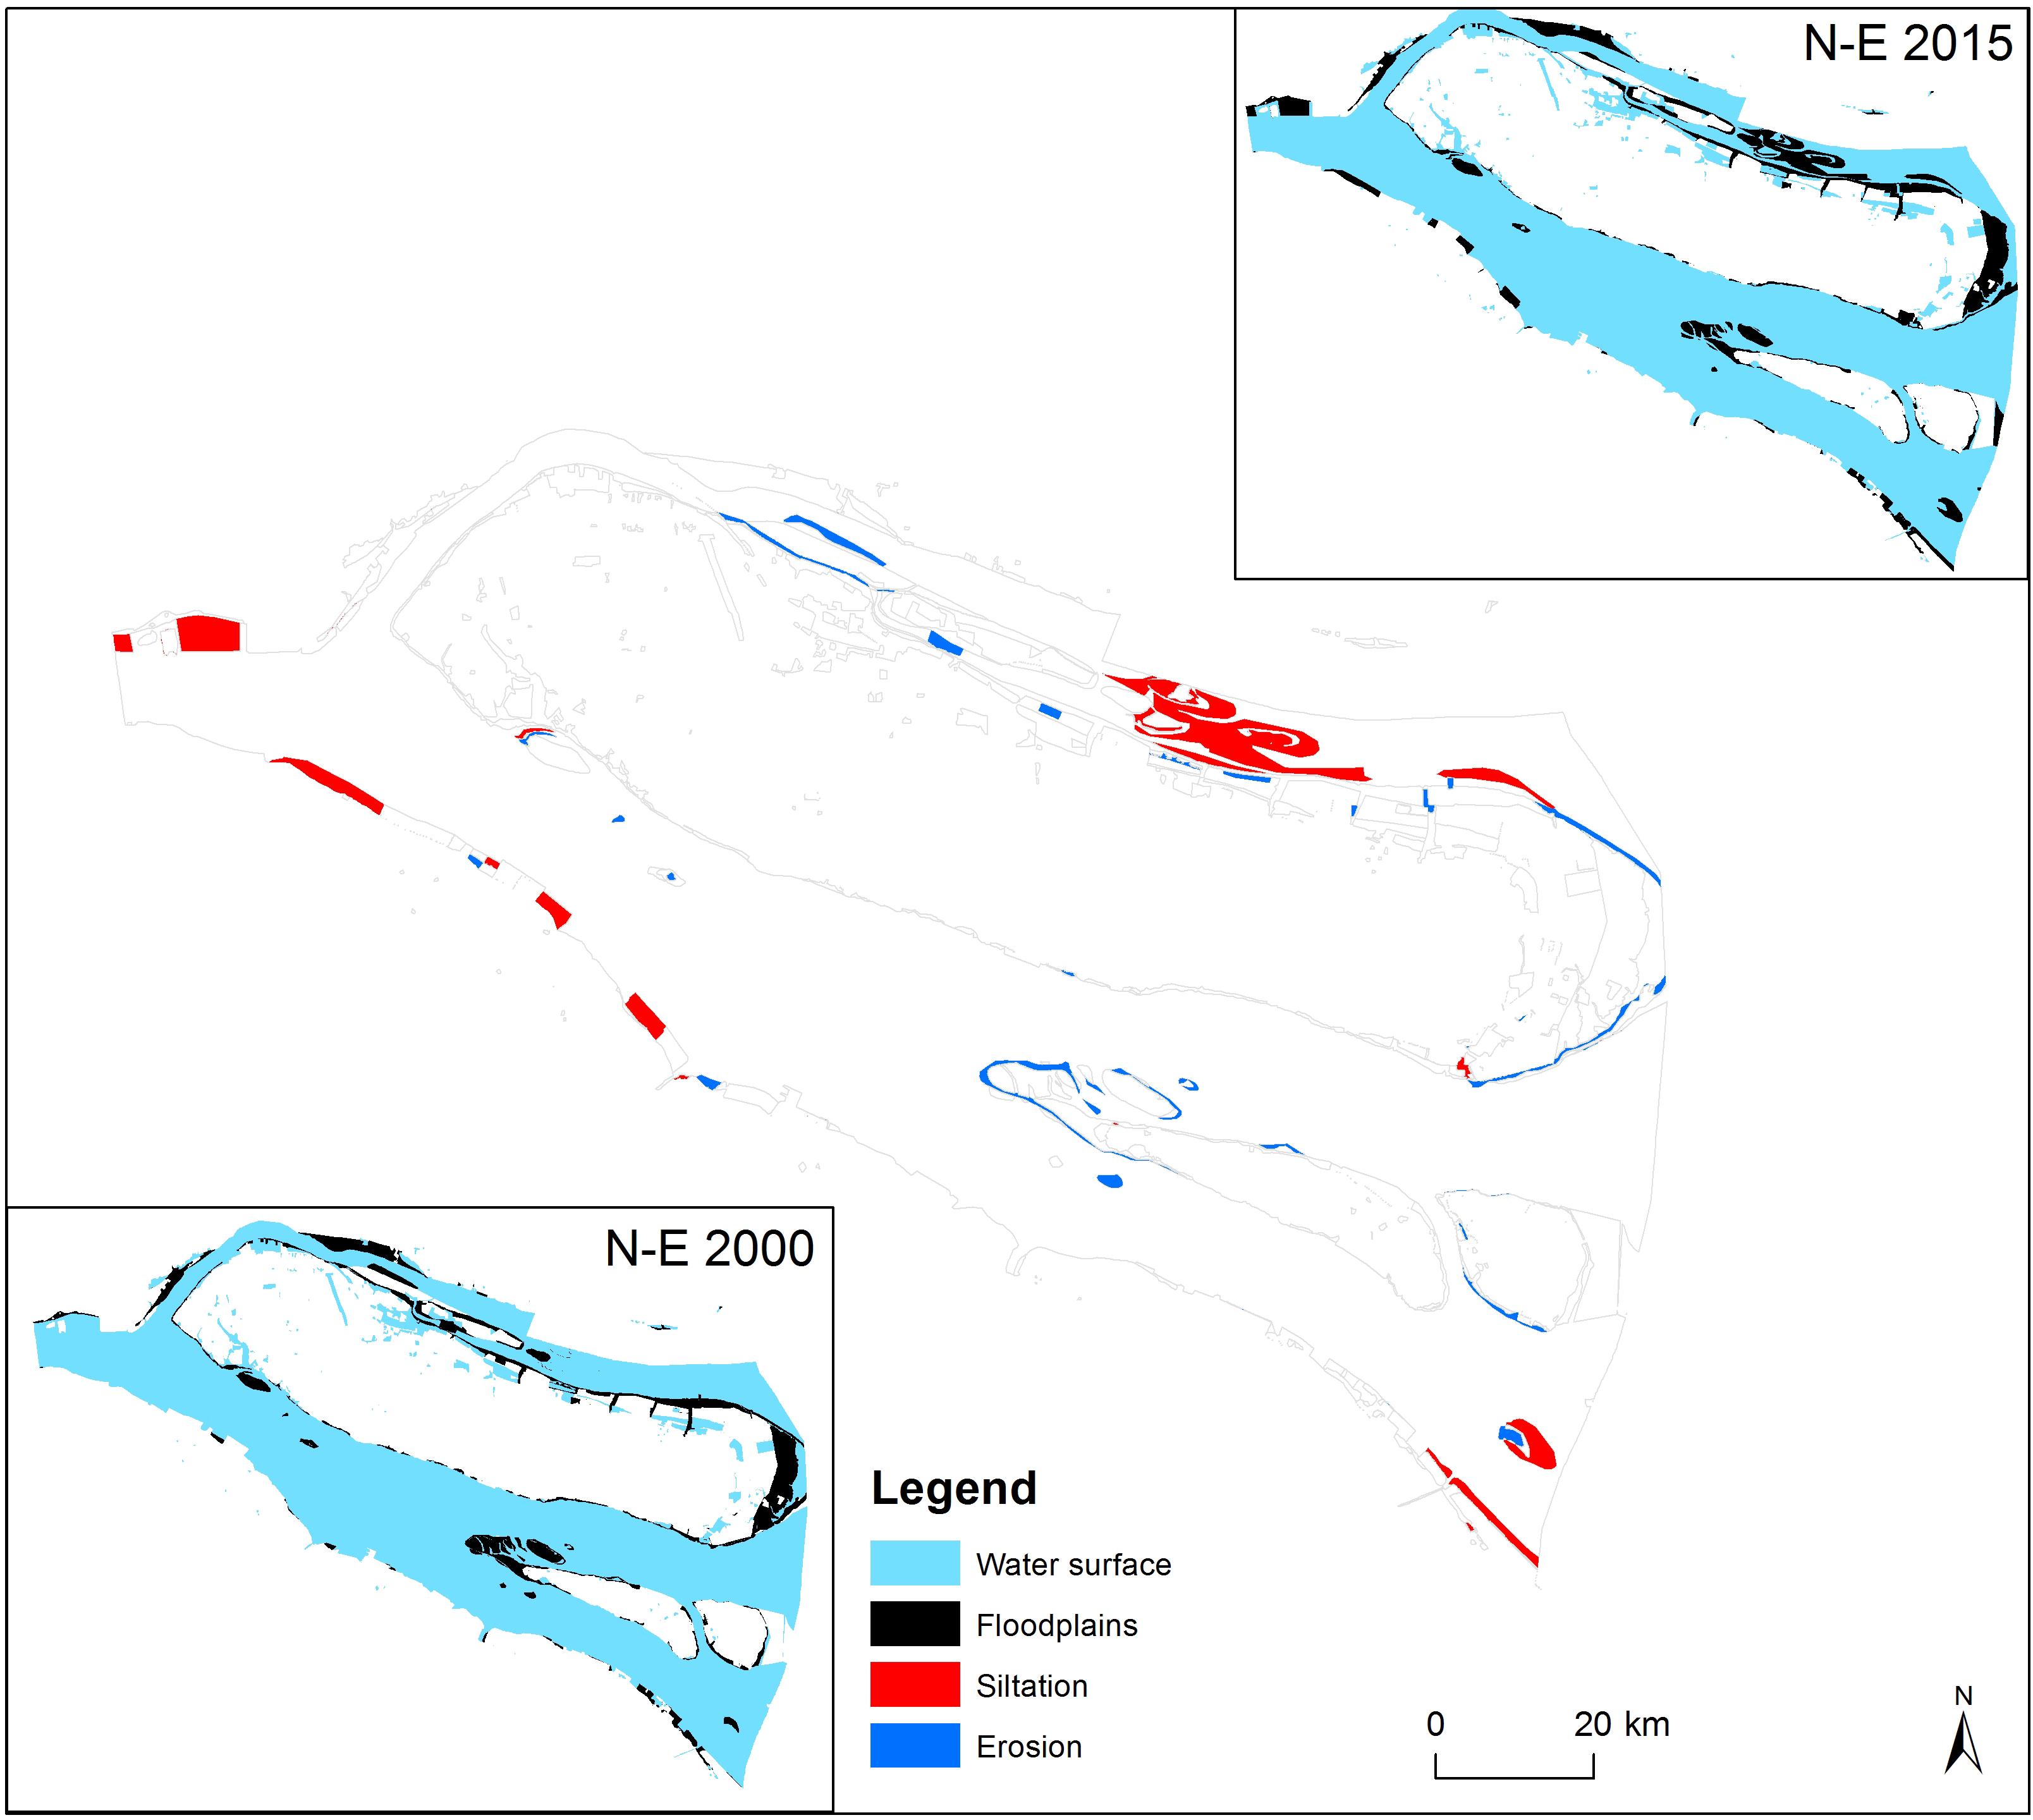
Figure 7. Comparison of spatial transition with and without dam in N-E.
Estuary Wetland Landscape Changes
After the operation of the TGD, NP index of water surface decreased slightly from 537 to 523, NP index of floodplain increased from 359 to 520, and PD index of water surface and floodplain showed the same trend. AREA_MN index of water surface increased from 317.20 to 319.28 ha, and index of floodplains decreased from 57.28 to 47.31 ha.
Discussion
Spatial Heterogeneity of Wetland Changes and Driver
After the operation of the TGD, changes of wetland in the middle and lower reaches of the Yantze river displayed typical spatial heterogeneity, e.g., erosion at the immediate section downstream (Y-C section), relative stable river section between Dongting Lake and Poyang Lake (C-H section), siltation river section at the lower reaches of Yangtze river. The estuary displayed a complex pattern featured by erosion. Main driver was clear water releasing from the TGD which led to Y-C section erosion, confirms Yang et al. (2017) and Yuan (2014) findings, as well as the turning point between Dongting Lake and Jingjiang River in hydrological regim shift (Lu et al., 2018). The relative stable status in floodplains and water surface areas between Chenglingji and Hukou may be the consequences of water and sediments dynamics of mainstream Yangtze and Dongting Lake, such stable status may continue for a period of time depending the speed of river bed erosion of the lower part of Y-C section. Siltation at H-N section remains similar to the period before the operation of the TGD, which is a continue processes and combination of Poyang Lake (Duan, 1993; Li, 2009; Su et al., 2019).
Asymmetric Erosion Between Mainstream and Two Lakes
Dongting Lake is one of the largest freshwater lakes in China, and has been listed as one of the most important wetland biodiversity region. It has been fed by four rivers and three major waterways from Yichang-Chenglingji section of Yangtze River (which is also called Jingjiang River), among which water inflow from Jingjiang River accounts for 50%. However, since the operation of the TGD, clear water released from the dam scoures river bed at Yichang-Chenglingji section, led to decrease of river water level, and shifted permanent river channels to seasonal rivers between Yangtze River and Dongting Lake. Thus causes asymmetric erosion between mainsteam and its associated floodplain lakes, in particular, Dongting Lake (Lu et al., 2018). After the operation of the TGD, distribution of siltation and erosion along river changed from “bed scouring and beach building” to “erosion of both river bed and banks” (Xu et al., 2010; Dai and Liu, 2013). Asymetric erosion between river and two lakes (Dongting and Poyang), also drives water level recession faster than before, and floodplains exposed when TGD start fill in water, floodplain vegetation, e.g., Carex grow quickly in autumn before wintering geese ariving and caused food shortage (Guan et al., 2014, 2016). Shift of river channels between Jingjiang and Dongting Lake has significant impact on migration of fishes and Yangtze finless porpoises (Nabi et al., 2018). With the operation of the TGD in the future, combined with climate change effect, such asymmetric erosion in Jingjiang-Dongting Lake wetland complex may become even worse, and thus urgent mitigation measures are needed.
Why Esturay Floodplain Areas Increase
Due to dam effect, the estuary lost 80% of the sediments (Cao and Wang, 2015), which should lead to erosion of the floodplains in the estuary, however, our model suggested the opposite. It is important to note that, the increased floodplain areas are mainly in the north river course, whereas, floodplain areas in the south river course are eroding as most studies suggested (Figure 8; Li, 2012). The reason why the estuary floodplains areas increase in the north, may not be linked to the operation of the TGD. Instead, such increase may cause by other two facts. Firstly, the morphological change in Chongming Island drives the northern river cause much less influence by hydrological forces of Yangtze river, and thus the water flow slows down and leads to siltation. Secondly, the sediments deposite in northern river course maybe transport by ocean currents.
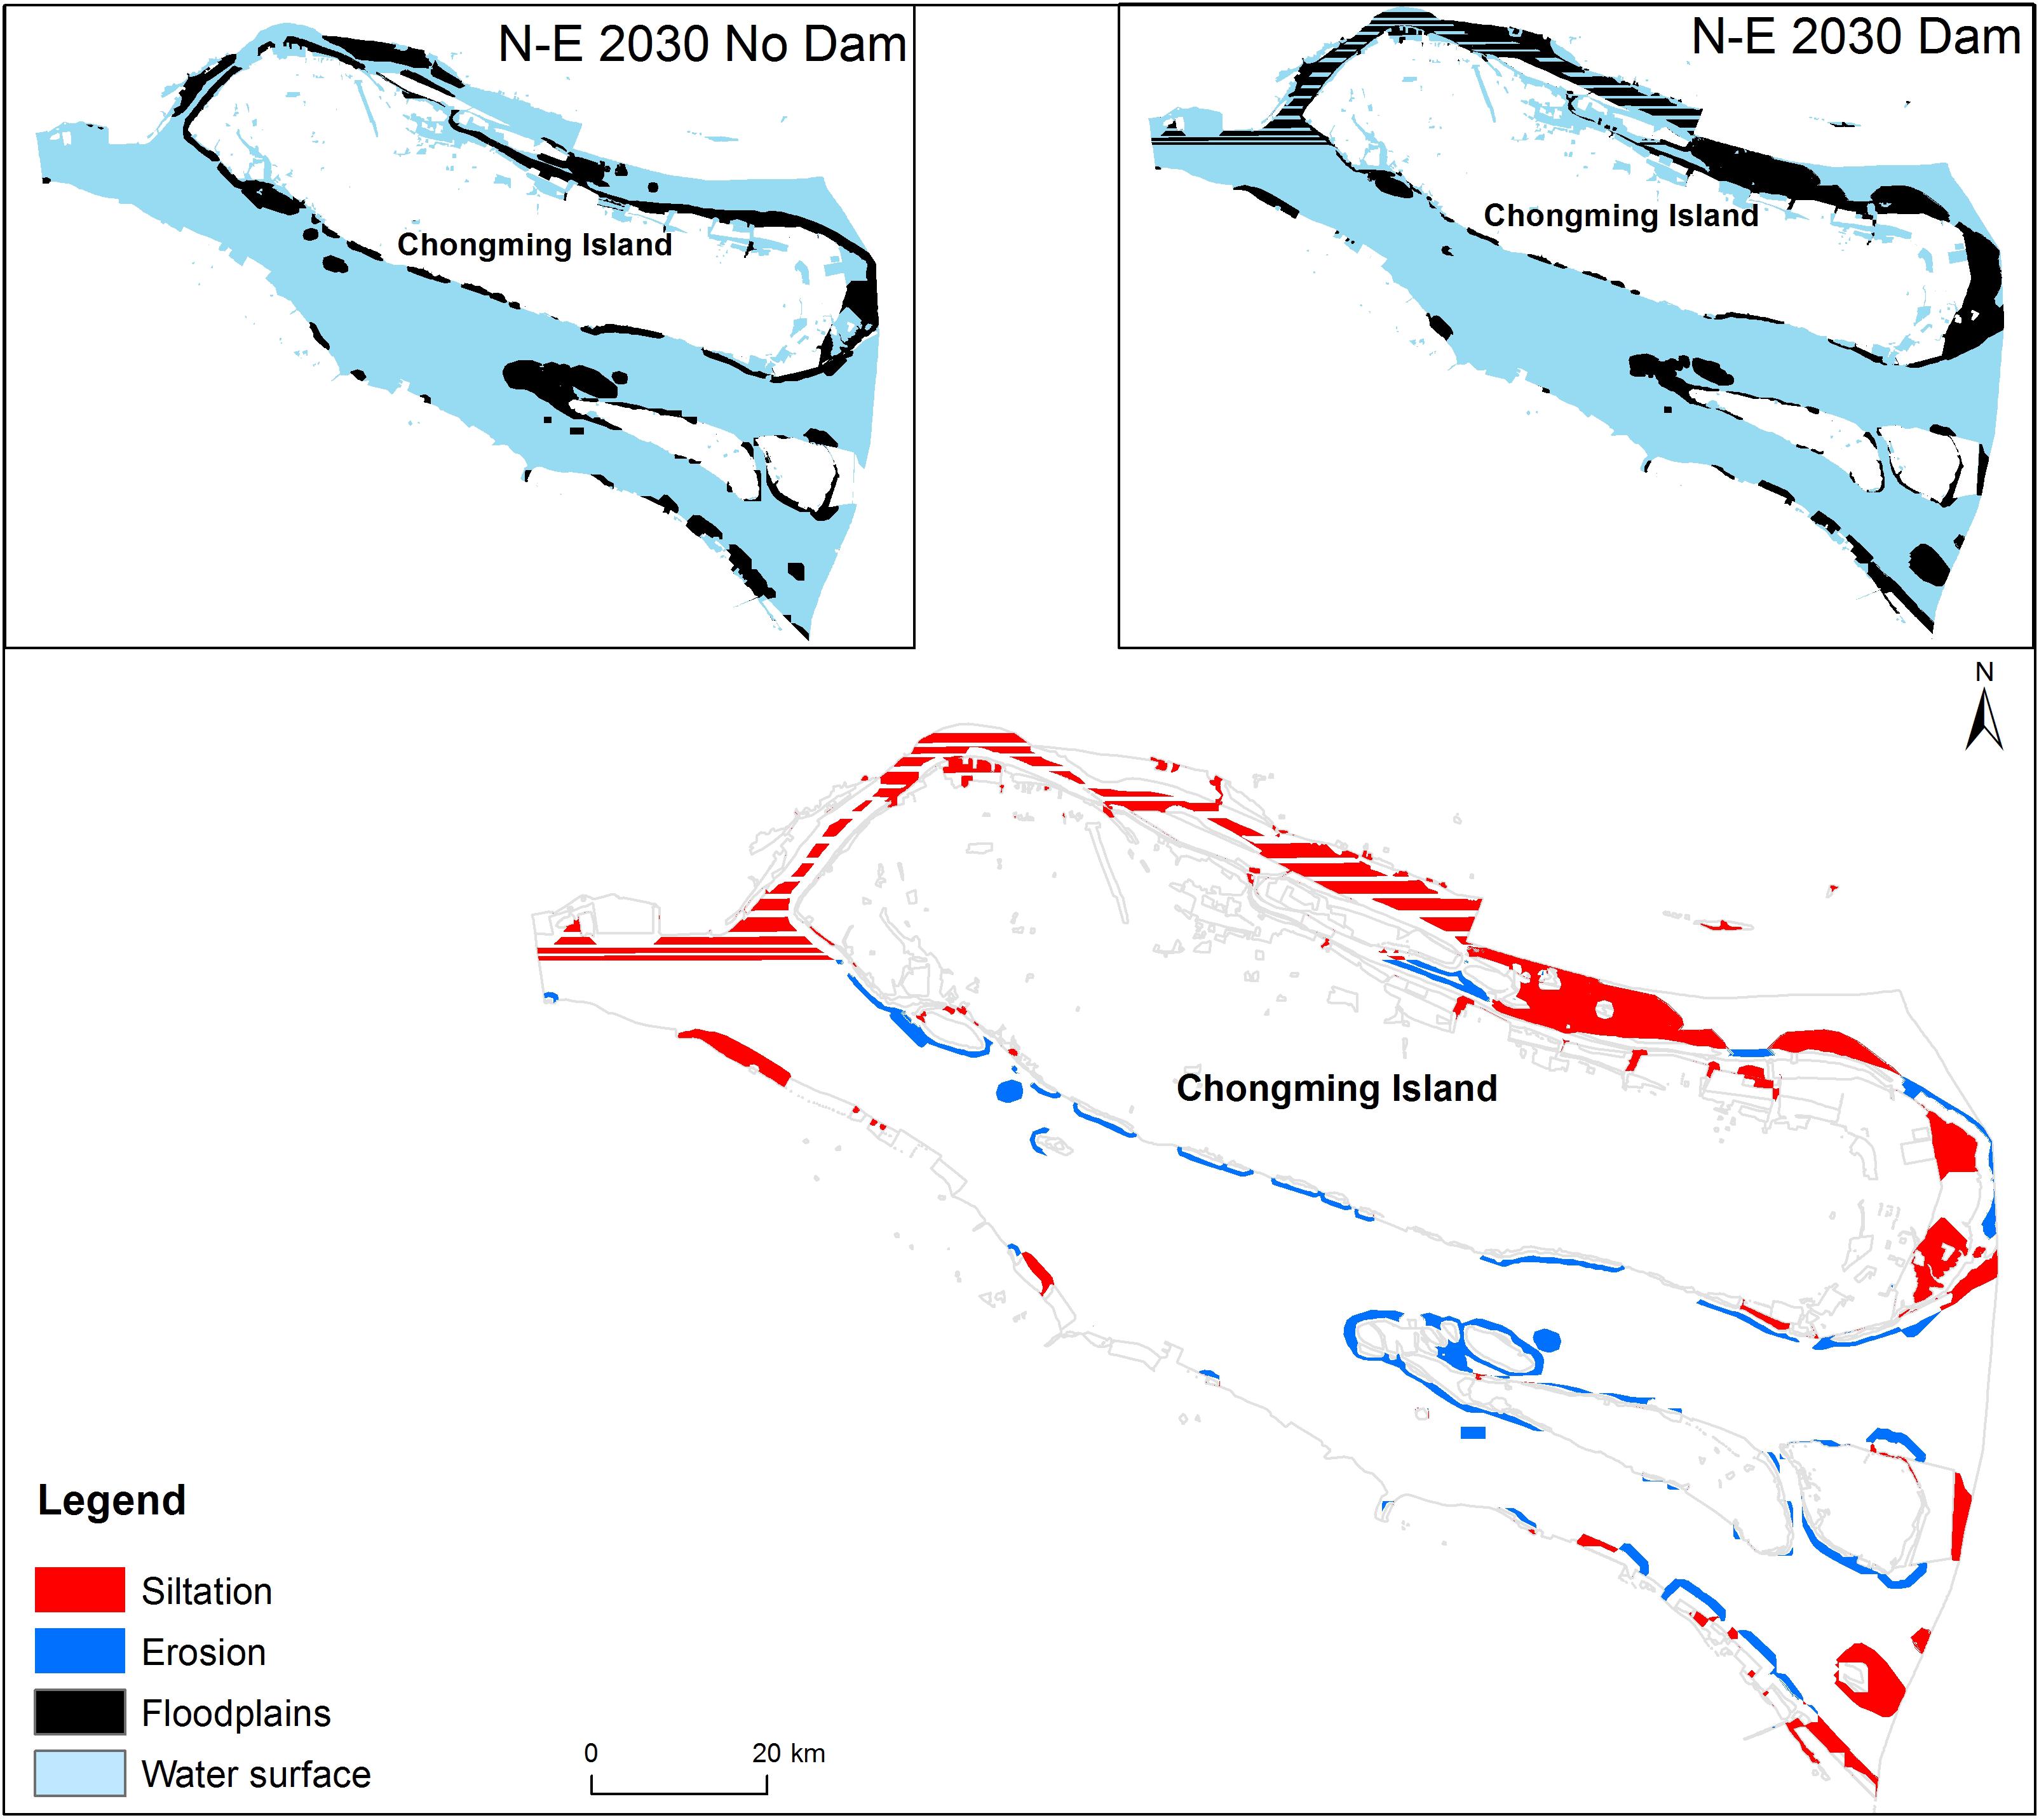
Figure 8. Comparison of estuarine wetland landscape with and without dam.
Conclusion
The operation of the TGD has significantly impact on downstream wetland ecosystems. Our study revealed the relationship with siltation patterns and wetland types transformation after the operation of the TGD, which are critically important to understand ecological characters dynamics in new environmental setting, and provide science-based conservation and restoration recommendation.
After the operation of the TGD, changes between water surface and floodplains areas were spatial heterogeneity. With the increase of distance to the TGD, floodplain erosion force declining gradually. The most important finding is the asymmetric erosion between main river course and its associated floodplain lakes, e.g., Dongting lake. This has significant implications for dam operation in autumn and habitat management.
After the operation of the TGD, floodplain in the estuary is driven by both the Yangtze river and ocean currents. The strong hydrological force and reduced sediments of Yangtze river drive erosion of the southern river course in the estuary, whereas, the weakened hydrological force in the northern river course attracts sedimentation.
Data Availability Statement
The raw data supporting the conclusions of this article will be made available by the authors, without undue reservation.
Author Contributions
All authors contribute equally and agreed to be accountable for the content of the work.
Funding
This work is supported by the National Key Research and Development Program of China (2017YFC0405303).
Conflict of Interest
The authors declare that the research was conducted in the absence of any commercial or financial relationships that could be construed as a potential conflict of interest.
Footnotes
References
Anderson, T. W., and Goodman, L. A. (1957). Statistical inference about markov chains[J]. Ann. Mathemat. Stat. 28, 89–110.
Barter, M., Chen, L. W., Cao, L., and Lei, G. (2004). Waterbird Survey of the Middle and Lower Yangtze River Floodplain in Late January and Early February. Beijing: China Forestry Pulishing House.
Barter, M., Lei, G., and Cao, L. (2006). Waterbird Survey of the Middle and Lower Yangtze River Floodplain (February2005). Beijing: World Wildlife Fund-China and Chinese Forestry Publishing House.
Cao, G. C., and Wang, J. (2015). Observation and Study on Hydrology and Sediment of Three Gorges Project. Beijing: Science Press.
Cao, L., Barter, M., and Lei, G. (2008). New Anatidae population estimates for eastern China: implications for current flyway estimates. Biol. Conserv. 141, 2301–2309. doi: 10.1016/j.biocon.2008.06.022
Chen, Y. (2019). Connectivity Mechhhanism and Prediction Evaluation Model of Alluvial River System. Ph.D dissertation, China Iinstitute of Water Resources and Hydropower Research, Beijiing.
Chen, Y. S., Qu, X., Xiong, F. Y., Lu, Y., Wang, L. Z., and Hughes, R. M. (2020). Challenges to saving China’s freshwater biodiversity: fishery exploitation and landscape pressures. Ambio 49, 926–938. doi: 10.1007/s13280-019-01246-2
Dai, Z., and Liu, J. T. (2013). Impacts of large dams on downstream fluvial sedimentation: an example of the Three Gorges Dam (TGD) on the Changjiang (Yangtze River). J. Hydrol. 480, 10–18. doi: 10.1016/j.jhydrol.2012.12.003
Das, S., Pradhan, B., Shit, P. K., and Alamri, A. M. (2020). Assessment of wetland ecosystem health using the pressure-state-response (PSR) model: a case study of Mursidabad district of West Bengal (India). Sustainability 12:5932. doi: 10.3390/su12155932
Duan, W. Z. (1993). The relation between cut-offs in lower Jingjiang river and water level at Chenglingji. J. Sediment Res. 1, 39–50.
Etienne, F. C., Ben, S. K., Nick, D. C., Max, F., and Peter, B. M. (2020). Reciprocal insights from global aquatic stressor maps and local reporting across the Ramsar wetland network. Ecol. Indic. 109:105772. doi: 10.1016/j.ecolind.2019.105772
Fu, C. C., Wu, J. H., Chen, J. K., Wu, Q. H., and Lei, G. C. (2003). Freshwater fish biodiversity in the Yangtze river basin of China: patterns, threats and conservation. Biodivers. Conserv. 12, 1649–1685.
Gao, B., Yang, D. W., and Yang, H. B. (2013). Impact of the three Gorges Dam on flow regime in the middle and lower Yangtze River. Quat. Int. 304, 43–50. doi: 10.1016/j.quaint.2012.11.023
Guan, L., Lei, J. L., Zuo, A. J., Wen, L., and Lei, G. C. (2016). Optimizing the timing of water level recession for conservation of wintering geese in dongting lake, China. Ecol. Eng. 88, 90–98. doi: 10.1016/j.ecoleng.2015.12.009
Guan, L., Wen, L., Feng, D. D., Zhang, H., and Lei, G. C. (2014). Delayed flood recession in central Yangtze floodplains can cause significant food shortages for wintering geese: results of inundation experiment. Environ. Manage. 54, 1331–1341. doi: 10.1007/s00267-014-0350-7
Han, J. Q., and Huang, L. B. (2018). Numerical experiments on stagnation points influenced by the Three Gorges Dam in the Yangtze Estuary. Water Sci. Technol. Water Supply 18, 1032–1040. doi: 10.2166/ws.2017.173
Jean-François P., Andrew, C., Noel, G., and Alan, S. B. (2016). High-resolution mapping of Global surface Water and Its Long-Term changes. Nature 540, 418–422. doi: 10.1038/nature20584
Jiang, L., Ban, X., Wang, X., and Cai, X. (2014). Assessment of hydrologic alterations caused by the Three Gorges Dam in the middle and lower reaches of Yangtze River, China. Water 6, 1419–1434. doi: 10.3390/w6051419
Lai, X. H. (2018). The Process and Mechanism of River Channel Erosion Below Three Gorges Dam its Effect and Prediction to Sedimemt Load into the Sea. PhD dissertation, The East China Normal University, Shanghai.
Li, L. L. (2009). Hydrodynamics of Jingjiang River and Dongting Lake as a Coupled System. PhD dissertation, Tsinghua University, Beijiing.
Li, P. (2012). Variations in Estuarine and Coastal Suspended Sediment Concentration and Delta Accretion/Erosion in Response to Decline in Sediment Supply From the Yangtze River. PhD dissertation, The East China Normal University, Shanghai.
Li, Y. Y., Chang, J. X., Wang, Y. M., Liu, Q., Fan, J. J., and Ye, D. Y. (2020). Land use simulation and prediction in the yellow river basin based on CA-Markov model. J. Northwest A F Univ. Nat. Sci. 48, 1–10.
Liu, J., Niu, J. Y., Zou, Y. A., Lu, S., and Wang, T. H. (2015). Changes in the waterbird community of the ecological Restoored Wetlands in Pudong Dongtan, Shanghai. Resour. Environ. Yangtze Basin 24, 219–226.
Liu, W. B., Yang, T., Du, M. Y., Sun, F. B., and Liu, C. M. (2018). Impact of the Three Gorges Dam on the hydrology mechanism of typical hydrologic stations in the middle and lower reaches of the Yangtze River. Ecol. Environ. Monit. Three Gorges 3, 8–15.
Lu, C., Jia, Y. F., Jing, L., Zeng, Q., Lei, J., Zhang, S., et al. (2018). Shifts in river floodplain relationship reveal the impacts of river regulation: a case study of Dongting Lake in China. J. Hydrol. 559, 932–941. doi: 10.1016/j.jhydrol.2018.03.004
Lu, H. Y., Guo, C., Zhang, T., Hu, C., and Xie, T. (2020). Study on land use change of Panzhou city based on CA- Markov. J. Guangxi Univ. Nat. Sci. 45, 550–557.
Margaret, P., and Albert, R. (2019). Linkages between flow regime, biota, and ecosystem processes: implications for river restoration. Science 365:aaw2087. doi: 10.1126/science.aaw2087
Mei, Z. G., Chen, M., Li, Y. T., Huang, S. L., Haung, J., Wang, D., et al. (2016). Habitat preference of the Yangtze finless porpoise in a minimally disturbed environment. Ecol. Model. 353, 47–53. doi: 10.1016/j.ecolmodel.2016.12.020
Nabi, G., Hao, Y. J., Robeck, T. R., Zheng, J. S., and Wang, D. (2018). Physiological consequences of biologic state and habitat dynamics on the critically endangered Yangtze finless porpoises (Neophocaena Asiaeorientalis ssp. Asiaeorientalis) dwelling in the wild and semi-natural environment. Conserv. Physiol. 6:coy072. doi: 10.1093/conphys/coy072
Oslon, D., and Dinerstein, E. (2002). The Global 200: priority ecoregions for global conservation. Ann. Mo. Bot. Gard. 89, 199–224. doi: 10.2307/3298564
Pan, Q. X., and Hu, X. Y. (2015). Review of 60 years’ river channel harnessing of Jingjiang reach in Yangtze River. Yangtze River 46, 1–6.
Pan, T., Wang, H., Duan, S. L., Ali, I., Yan, P., and Wu, X. B. (2019). Historical population decline and habitat loss in a critically endangered species, the Chinese Alligator (Alligator Sinensis). Glob. Ecol. Conserv. 20:e00692. doi: 10.1016/j.gecco.2019.e00692
Park, E., Emadzadeh, A., Alcantara, E., Yang, X. K., and Ho, H. L. (2020). Inferring floodplain bathymetry using inundation frequency. J. Environ. Manage. 273:111138. doi: 10.1016/j.jenvman.2020.111138
Postel, S. L., Daily, G. C., and Ehrlich, P. R. (1996). Human appropriation of renewable fresh water. Science 271, 785–788. doi: 10.1126/science.271.5250.785
Ramsar Convention on Wetlands (2018). Global Wetland Outlook: State of the World’s Wetlands and their Services to People. Gland: Ramsar Convention Secretariat.
Su, Z. K., Ho, M., Hao, Z. C., Lall, U., Sun, X., Chen, X., et al. (2019). The impact of the Three Gorges Dam on summer streamflow in the Yangtze River Basin. Hydrol. Processes 34, 705–717. doi: 10.1002/hyp.13619
Tian, J. X., Chang, J., Zhang, Z. X., Wang, Y. J., Wu, Y. F., and Jiang, T. (2019). Influence of Three Gorges Dam on downstream low flow. Water 11:65. doi: 10.3390/w11010065
United Nations Department of Economic and Social Affairs (2015). WorldPopulation Prospects: The 2015 Revision, Key Findings and Advance Tables. Working Paper No. ESA/P/WP.241. Available online at: https://esa.un.org/unpd/wpp/publications/files/key_findings_wpp_2015.pdf (accessed June 15, 2020).
Vörösmarty, C. J., Green, P., Salisbury, J., and Lammers, R. B. (2000). Global water resources: vulnerability from climate change and population growth. Science 289, 284–288. doi: 10.1126/science.289.5477.284
Wang, J. D., Sheng, Y. W., Gleason, C. J., and Wada, Y. (2013). Downstream Yangtze River levels impacted by Three Gorges Dam. Environ. Res. Lett. 8:044012. doi: 10.1088/1748-9326/8/4/044012
Wang, L. X., Zhang, J. W., Meng, N. N., Zhang, S. C., and Liu, Z. (2020). Simulation and prediction of temporal and spatial changes of NDVI in Weihe river basin based on Ca-Markov. Res. Soil Water Conserv. 27, 206–212.
Wang, Y. Y., Kao, Y. C., Zhou, Y. M., Zhang, H., Yu, X. B., and Lei, G. C. (2019). Can water level management, stock enhancement, and fishery restriction offset negative effects of hydrological changes on the four major Chinese Carps in China’s largest freshwater Lake? Ecol. Model. 403, 1–10. doi: 10.1016/j.ecolmodel.2019.03.020
Xie, P., Wu, J. G., Huang, J. H., and Han, X. G. (2016). Three-Gorges Dam:risk to ancient fish. Science 302, 1149–1151.
Xu, X. J., Yang, S. L., and Zhang, Z. (2010). Variation in grain size of sedimentin middle and lower changjiang river since impoundment of three gorges reservoir. Sci. Geol. Sin. 30, 103–107.
Yang, Y. P., Zhang, M. J., Sun, Z. H., Han, J. Q., Li, H. G., and You, X. Y. (2017). The relationship between water level change and river channel geometry adjustment in the downstream of the Three Gorges Dam (TGD). Acta Geographica Sinica 72, 776–789. doi: 10.11821/dlxb201705002
Yuan, W. H. (2014). The Fluvial Dynamic Process of River-Channel Erosion in the Middle Yangtze River after 3-Gorges Dam Closure-A Prediction of New Sediment Source to Estuary. PhD dissertation, East China Normal University, Shanghai.
Zhang, H., Kang, M., Shen, L., Wu, J. M., Li, J. Y., Du, H., et al. (2020). Rapid change in Yangtze Fisheries and its implications for global freshwater ecosystem management. Fish. Fish. 21, 601–620. doi: 10.1111/faf.12449
Zhang, X., Dong, Z. C., Gupta, H., Wu, G. D., and Li, D. Y. (2016). Impact of the Three Gorges Dam on the hydrology and ecology of the Yangtze River. Water 8:590. doi: 10.3390/w8120590
Keywords: floodplains, water surface, three gorges dam, Yangtze River, landscape fragmentation, CA-Markov
Citation: Sun G, Lei G, Qu Y, Zhang C and He K (2020) The Operation of the Three Gorges Dam Alters Wetlands in the Middle and Lower Reaches of the Yangtze River. Front. Environ. Sci. 8:576307. doi: 10.3389/fenvs.2020.576307
Received: 26 June 2020; Accepted: 14 October 2020;
Published: 17 November 2020.
Edited by:
Ligang Xu, Nanjing Institute of Geography and Limnology (CAS), ChinaReviewed by:
Yuankun Wang, Nanjing University, ChinaMei Xuefei, East China Normal University, China
Copyright © 2020 Sun, Lei, Qu, Zhang and He. This is an open-access article distributed under the terms of the Creative Commons Attribution License (CC BY). The use, distribution or reproduction in other forums is permitted, provided the original author(s) and the copyright owner(s) are credited and that the original publication in this journal is cited, in accordance with accepted academic practice. No use, distribution or reproduction is permitted which does not comply with these terms.
*Correspondence: Guangchun Lei, Z3VhbmdjaHVuLmxlaUBmb3htYWlsLmNvbQ==