 Guanglong Dong
 Yibing Ge1
- 1School of Management Engineering, Shandong Jianzhu University, Jinan, China
- 2Shandong Land Surveying and Planning Institute, Jinan, China
- 3School of Public Administration and Policy, Shandong University of Finance and Economics, Jinan, China
This study constructed a comprehensive index system and employed a coupling coordination degree model, global spatial autocorrelation models, and local spatial autocorrelation models to quantitatively investigate the spatiotemporal characteristics and dynamic mechanism of the coupling coordination relationship between green urbanization and green finance in China during 2010–2017. The results showed that the level of green urbanization and green finance improved over the study period, but the development of green finance lagged behind the pace of green urbanization and the comprehensive score was still low. The coupling coordination degree presented a trend of continuous optimization, with coordination in eastern China being clearly higher than in central, western, and northeastern China. Furthermore, there was both spatial dependency and spatial heterogeneity in the coupling coordination degree between green urbanization and green finance. Provinces with a high-high clustering mode were mainly distributed in the eastern region, while provinces in western and northeastern China mainly had a low-low clustering mode in 2010. The high-high clustering mode gradually expanded from eastern to central China, while most provinces in western and northeastern China still exhibited low-low clustering in 2017. This indicates that the coupling coordination degree between green urbanization and green finance had strong spatial agglomeration and spatial spillover effects in central and eastern China, while in western and northeastern China its development was still poor.
Introduction
Since the reform and opening up period, China has experienced unprecedented rapid urbanization (Bai et al., 2014), with the urbanization level rising from 17.92% in 1978 to 59.58% in 2018. In this process, the material and spiritual living standards of the population have been greatly improved and enriched. However, the long-term extensive development model has consumed a lot of resources and caused great damage to the ecological environment (Chen et al., 2013; Song et al., 2015; Zhou et al., 2015; Li et al., 2020). In 2018, China accounted for 24% of global energy consumption and 34% of global energy consumption growth. China has been the world’s largest energy growth country for 18 years in a row (Song et al., 2019; Wu et al., 2020; Zhang et al., 2020). Among the 338 cities at and above the prefectural level in which air quality is monitored, only 121 (35.8%) met the national air quality standard. While the Chinese people have enjoyed the material benefits brought about by rapid urbanization, the environment in which they live has been severely damaged. China’s economic losses from environmental pollution will reach around 13% of GDP by 2020.
The economic development and urbanization of China is faced with the double pressure of resource depletion and environmental degradation (Bai et al., 2018; Gu, 2019; Yang et al., 2020a; Wang et al., 2020). Therefore, green development has become the inevitable choice of China’s sustainable economic development (Xu et al., 2019). Green urbanization is different from the traditional urbanization model with its high energy consumption, high levels of pollution, high emission rates, and extensive development. It is a new model that considers the coordinated development of society, economy, and environment in the process of urbanization. Green urbanization is in line with China’s resource availability and environmental conditions and has become an important way to promote ecological progress and build a beautiful China. Resource depletion and environmental problems caused by traditional urbanization models, such as “big city disease,” “rural decline,” and “biodiversity loss,” are forcing China to choose the path of green urbanization.
Green finance also plays an important role in realizing green development (Taghizadeh-Hesary and Yoshino, 2019). The development of green finance in China is in its infancy. Since the 18th National Congress of The Communist Party of China proposed the concept of green development, green finance has been highly valued. The Overall Plan for The Reform of the Ecological Civilization System, which was launched on September 11, 2015, clearly proposed the building of a green financial system. In August 2016, seven ministries and commissions, including the People’s Bank of China jointly issued the Guidance on Building a Green Financial System, which clarified the definition of green finance. Green finance refers to economic activities in support of environmental improvement, climate change response, and resource conservation and efficient utilization, namely, financial services provided for project investment and financing, project operation and risk management in the fields of environmental protection, energy conservation, clean energy, green transportation, and green building. The 19th National Congress of the Communist Party of China (CPC) proposed that “clear water and green mountains are gold and silver mountains.” Under the guidance of relevant policies, green development has become the future direction of economic transformation and social development, and green finance will play an increasingly important role.
Finance plays an increasingly important role in modern society (Soejachmoen, 2017; Ng, 2018; Hu et al., 2020). As an emerging economic development model, green finance through diversified financial product tools, green finance guides capital flows, optimizes resource allocation, and considers the living environment and long-term development of human society while pursuing economic returns (Owen et al., 2018; Bucci et al., 2019; Zhang et al., 2019; Li et al., 2021). The development of green finance has become the best option for China’s economic development and ecological construction during urbanization.
The basic principle of green finance to protect the environment is consistent with the concept of green urbanization. The development of green finance contributes to the realization of green urbanization; in turn, the development of green urbanization promotes the improvement and perfection of green finance. There have been many studies on green urbanization (Liu et al., 2018a; Zhou et al., 2018; Li et al., 2019; Fan et al., 2020; Zhang and Li, 2020). However, because green finance is still in its infancy in China, most research has focused on theoretical discussions of the concept, mechanism, and policy, as well as the promotion of practical green finance systems (Zhou and Li, 2019; Cui et al., 2020). Due to the relatively late disclosure of information related to green finance in China, inconsistent statistical calibrations, and difficulties in data acquisition, most studies have conducted a qualitative analysis and there is a lack of quantitative research. These studies have played an important role in spreading the concept of green finance, understanding the function of green finance, and extending the application of green finance.
However, a qualitative analysis alone is insufficient, and a quantitative evaluation of the comprehensive development level of green finance is required for the optimal development of green finance. In recent years, some researchers have attempted to conduct a quantitative evaluation of green finance. Zhang et al. measured green finance based on the data of green listed companies and listed companies on the New Third Board (Zhang et al., 2018). Zhu et al. used green investment to represent green finance and investigated the relationship between circular economy and green finance in Guizhou (Zhu et al., 2019). Zeng et al. (2014) constructed a comprehensive index system of green finance from the aspects of green credit, green securities, green insurance, green investment, and carbon finance. Liu et al. evaluated the level of coupling coordination between green finance and green economy (Liu et al., 2020). Li found that green finance contributes to the improvement of regional ecological environment (Li and Gan, 2020).
Furthermore, the development of green urbanization in China shows obvious regional imbalance. However, due to the lack of quantitative evaluation of green finance, we cannot know whether the development of green urbanization and green finance has been synchronized and coordinated, and we cannot know which side is relatively backward. Thus, the relationship between green finance and green urbanization is far from fully understood. This study attempted to fill this knowledge gap and provide some more precise insights into the spatiotemporal features and dynamic mechanisms of the coupling relationship between green urbanization and green finance. This study used China as the research area and its provincial administrative divisions as the basic evaluation units. The main objectives of the study were to 1) establish a comprehensive evaluation index system for green urbanization and green finance, 2) quantitatively examine the temporal and spatial coordination between green urbanization and green finance, and 3) explore the spatial agglomeration effect and the spatiotemporal transformation features of the coupling coordination relationship.
Study Area and Materials
Study Area
Since the reform and opening up period, China has gone through a rapid process of urbanization and industrialization and achieved remarkable progress. As the second largest economy in the world, China’s economic growth accounts for nearly 30% of global growth, making China the largest contributor to world economic growth. However, there is a significant imbalance in China’s social and economic development. According to the National Bureau of Statistics, the 30 provinces of China studied in this article (except Tibet, Hong Kong, Macau, and Taiwan) can be divided into eastern, central, western, and northeastern China (Figure 1). Eastern China consists of 10 provinces, namely, Beijing, Tianjin, Hebei, Shanghai, Jiangsu, Zhejiang, Fujian, Shandong, Guangdong, and Hainan. Shanxi, Anhui, Jiangxi, Henan, Hubei, and Hunan are in central China. The provinces located in western China are Inner Mongolia, Guangxi, Chongqing, Sichuan, Guizhou, Yunnan, Shaanxi, Gansu, Qinghai, Ningxia, and Xinjiang. Liaoning, Jilin, and Heilongjiang are located in northeastern China.
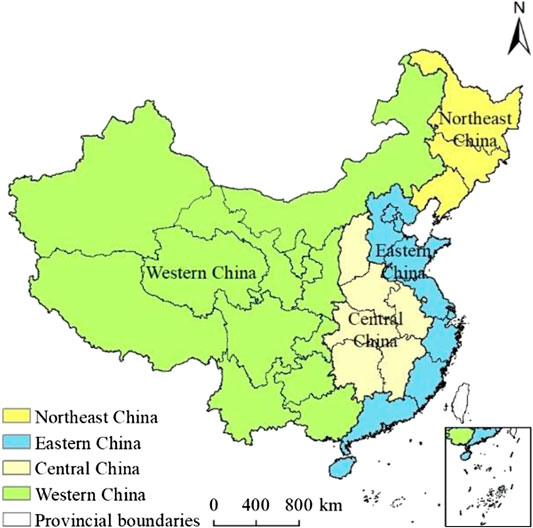
FIGURE 1. China’s four major economic regions.
In March 2018, China added ecological civilization to its constitution. It further deepened the consensus on green development and promoted the practice of green development. According to the China Green Finance Development Report (2018), the scale of China’s green financial market keeps expanding, and innovation in products and services keeps emerging. In 2018, China issued more than 280 billion yuan of green bonds. The stock of bonds is close to 600 billion yuan, one of the highest in the world.
Data Sources and Preprocessing
This study used the provincial administrative division as the basic unit and analyzed the evolution of the coupling coordination degree between green urbanization and green finance in China from 2010 to 2017. Green urbanization data were obtained from the China Statistical Yearbook 2011–2018 and the China Energy Statistical Yearbook 2011–2018, while the data used to evaluate green finance were obtained from wind database and the China Statistical Yearbook 2011–2018 (Zhou et al., 2020). The administrative boundaries were provided by the Resource and Environment Data Cloud Platform, Data Center for Resources and Environmental Sciences, Chinese Academy of Sciences (http://www.resdc.cn/).
Data from different sources have various units and magnitudes, which makes them incommensurable. Additionally, different indicators may have positive or negative effects on the same evaluation target. To overcome these problems, a range standardization method was adopted to process the original data.
Theoretical Framework
Green finance and green urbanization complement each other. Coordinated and synchronized development of the two is conducive to sustainable development, while lagging behind on either side will be the weak link of sustainable development. Through the function of resource allocation, green finance guides the flow of capital, labor force, technology, and other factors to the green industry, promotes the development of the green industry, and at the same time restricts the enterprises with “two high and one surplus” (resource-based industries with high pollution and energy consumption and industries with excess production capacity), so as to promote industrial transformation and upgrading, energy conservation and emission reduction, and realize green urbanization (Figure 2). In turn, the development of green urbanization puts forward higher requirements for green finance. It will force green finance to make continuous innovations, such as expanding service scope, upgrading service mode, building multidimensional products, and improving mechanism, so as to match the development speed and requirements of green urbanization.
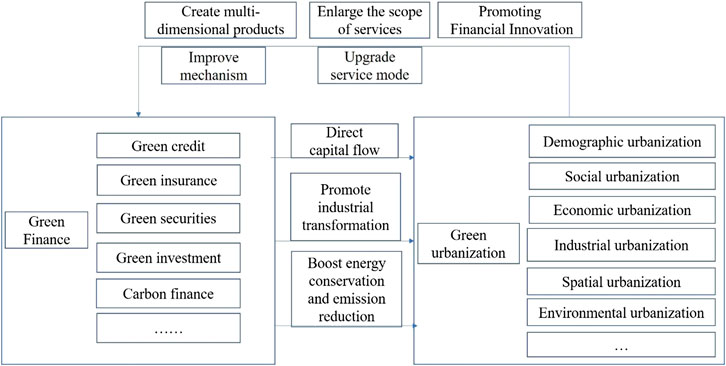
FIGURE 2. Theoretical framework.
Methods
Construction of an Evaluation Index System for Green Finance
Green finance instruments consist of various products and mechanisms, including green credit, green security, green insurance, green investment, carbon finance, etc. (Zeng et al., 2014; Zhang et al., 2019; Liu et al., 2020). However, green finance in China is still in the developmental stage, with a lack of relevant statistics. Therefore, following the principles of 1) reflecting the basic connotation of green finance, 2) covering the scope of green financial services, and 3) considering the representativeness of indicators and availability of data, we built a green finance evaluation indicator system, including six indicators from four aspects, namely, green credit, green security, green investment, and carbon finance (Zhou et al., 2020) (Table 1).
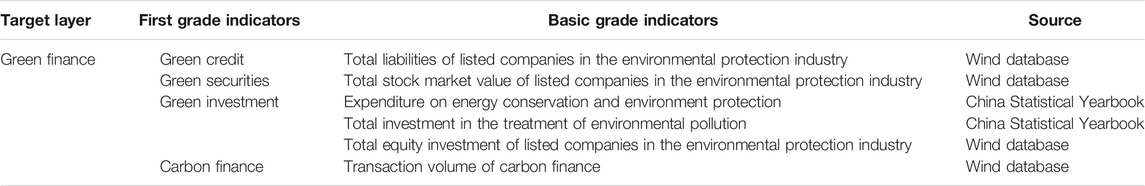
TABLE 1. The evaluation indicator system for assessing green finance.
A global principal component analysis was applied to calculate the comprehensive score of green finance. Global principal component analysis is an improvement on the traditional principal component analysis. It combines the traditional principal component analysis and a time series analysis (Fan et al., 2020; Zhou et al., 2020). Therefore, it can be used to process panel data, including the green finance data of the various provinces in China from 2010 to 2017.
Construction of an Evaluation Indicator System for Green Urbanization
Considering the rich connotation of green urbanization, we established a comprehensive indicator system to evaluate the level of green urbanization, with reference to existing relevant studies (Liu et al., 2018a; Zhou et al., 2018; Fan et al., 2020; Zhang and Li, 2020). The green urbanization evaluation index system was comprised of 17 indicators from the six dimensions of demographic urbanization, industrial urbanization, economic urbanization, social urbanization, spatial urbanization, and environmental urbanization (Table 2). These indicators were mainly selected following the principles of typicality, comparability, systematically, and availability.
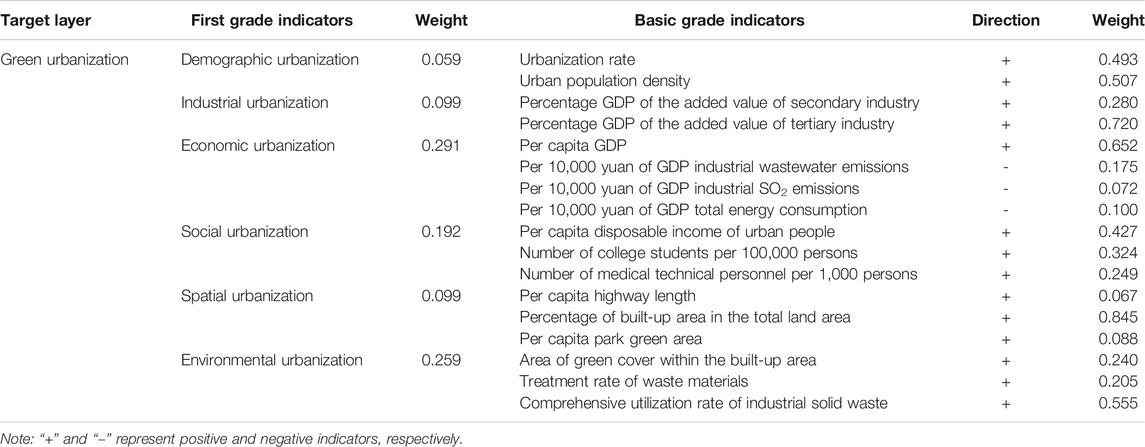
TABLE 2. The evaluation indicator system and weights for assessing green urbanization.
Specifically, demographic urbanization is the most basic feature of urbanization. Urban population agglomeration is the most direct manifestation of urbanization. The percentage of urban population and urban population density are the most commonly used indicators to measure demographic urbanization. Consequently, the percentage of urban population and urban population density were used as indicators of demographic urbanization. Industrial urbanization is the key to green urbanization. The urbanization driving force and the resource depletion and environmental degradation caused by different industrial structures are quite different. Hence, the percentage GDP of the added value of secondary industry and the percentage GDP of the added value of tertiary industry were used to represent industrial urbanization. Economic urbanization is one of the main goals of urbanization. To ensure green urbanization, economic urbanization not only pursues economic growth but also considers the resource consumption and environmental impact of economic growth. Therefore, in addition to per capita GDP, per 10,000 yuan of GDP industrial wastewater emissions, per 10,000 yuan of GDP industrial SO2 emissions, and per 10,000 yuan of GDP total energy consumption were used as indicators of economic urbanization. Social urbanization can improve the quality of life of urban residents, which can be represented by income, education, medical care, and other factors. Thus, the secondary indicators of social urbanization consisted of per capita disposable income of urban people, number of college students per 100,000 persons, and number of medical technical personnel per 1,000 persons. Spatial urbanization mainly refers to land use changes during urbanization, especially the expansion of impermeable surfaces. Per capita highway length and the percentage of built-up area in the total land area are the two indicators commonly used for evaluating spatial urbanization. In this study, per capita park green area was also considered as an indicator of spatial urbanization from the perspective of urban green space. Environmental urbanization reflects the quality of the ecological environment in the process of urbanization, which is an important requirement for the harmonious development between human society and nature. Environmental urbanization was evaluated through three indicators, namely, the area of green cover within the built-up area, treatment rate of waste materials, and comprehensive utilization rate of industrial solid waste.
It is of crucial importance to reasonably determine the weight of the indicators for the reliability of the evaluation results. As an objective weighting method, the entropy method has been widely used in previous studies (Liu et al., 2018b; Liao et al., 2020). Therefore, this article uses the entropy weight method to determine the weight of urbanization index. Subsequently, the green urbanization development index can be obtained as follows:
where
The Coupling Coordination Degree Model
Coupling is a physical concept and refers to the phenomenon whereby two or more systems interact with each other and even join together through various interactions (Zhou et al., 2015; Yang et al., 2020b). The coupling degree model was as follows:
Despite the coupling degree model being derived from studies in the field of physics, it has been widely adopted to study the coupling relationship between multiple systems. Thus, we used this model to investigate the relationship between green urbanization and green finance. The coupling degree model for green urbanization and green finance can be written as follows:
where
However, the coupling degree model can only reflect the degree of interactive coupling between green urbanization and green finance. It is not sufficient to fully reflect the state of its collaborative development. Consequently, we further established the coupling coordination degree model of green urbanization and green finance as follows:
where T is the coupling coordination index between green urbanization and green finance; and
Finally, the coupling relationship between green urbanization and green finance was classified into three categories, four subclasses, and twelve subtypes, according to their scores (Table 3).
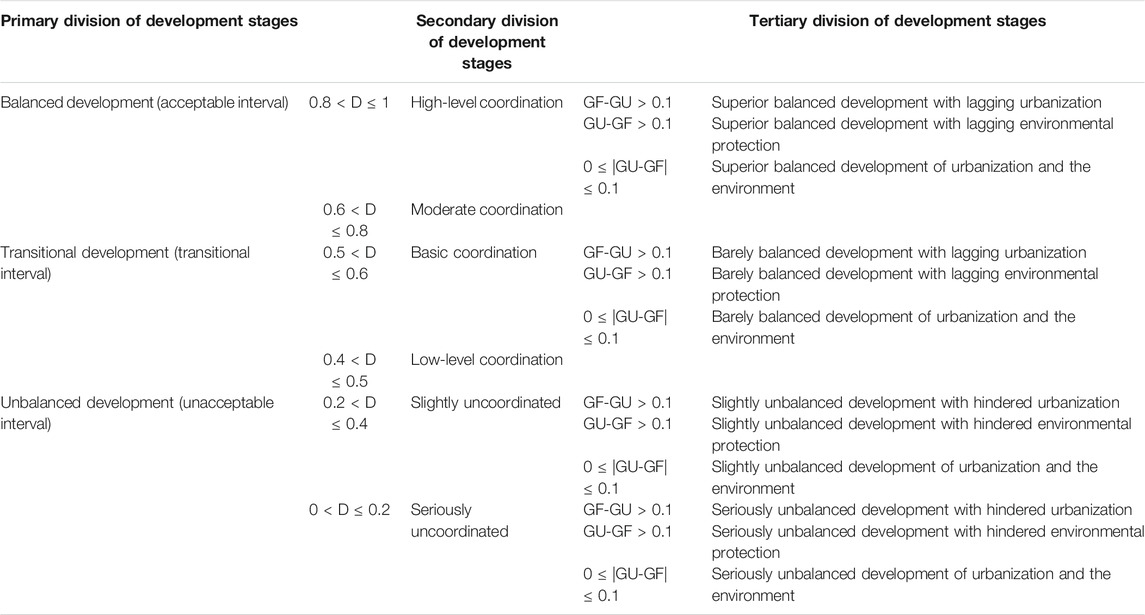
TABLE 3. The classification of the coupling coordination degree between green urbanization and green finance.
Spatial Autocorrelation
Spatial autocorrelation analysis is an effective method to characterize the degree of correlation among adjacent geographic units by considering both the location and attribute information of the research object synchronously and includes a global spatial autocorrelation and local autocorrelation (Su et al., 2012; Liu et al., 2018a; Zhang and Li, 2020). In this study, we applied both global and local Moran’s I to describe and visualize the spatial autocorrelation and spatial differentiation of the coupling coordination degree between green urbanization and green finance in China.
Results
Spatiotemporal Evolution of Green Urbanization
During 2010–2017, the main characteristic of “high in the east” and “low in the west” remained the same (Figure 3). Overall, the level of green urbanization significantly improved, as indicated by the mean value of green urbanization increasing from 0.39 in 2010 to 0.44 in 2017. The green urbanization level of Beijing–Tianjin, Yangtze River Delta, and Pearl River Delta was clearly higher than that of other regions, forming three growth poles in 2017. However, the interprovincial differences of green urbanization slightly increased, with the standard deviation increasing from 0.10 in 2010 to 0.12 in 2017.
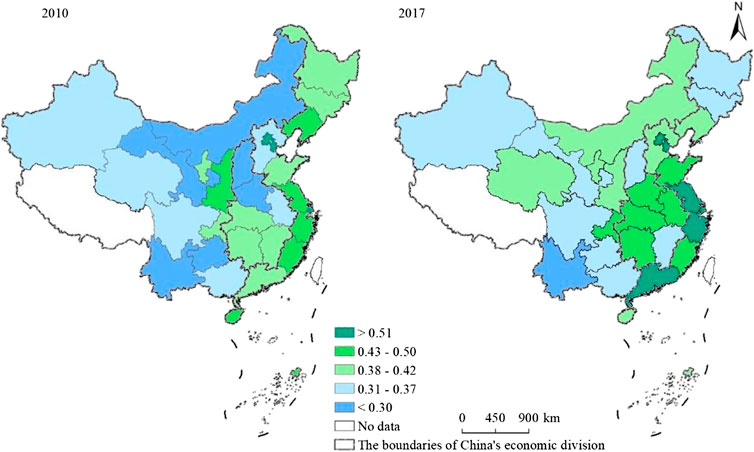
FIGURE 3. Spatial distribution of green urbanization in 2010 and 2017.
Both the level and spatial distribution of green urbanization underwent significant changes during 2010–2017. 1) In 2010, the green urbanization value in six provinces was below 0.30, including four (Yunnan, Guizhou, Gansu, and Inner Mongolia) in western China and two (Shanxi and Henan) in central China. Only Yunnan Province still had a value less than 0.30 in 2017, whereas the green urbanization value of the other provinces increased over time. 2) The number of provinces with green urbanization values between 0.31 and 0.37 was equal to the numbers with values below 0.31 in 2010. In addition to Xinjiang, Qinghai, Sichuan, and Guangxi provinces, which were mainly distributed in western China, Anhui in central China and Hebei in eastern China also fell into this category in 2010. The number and spatial distribution of provinces in this level clearly changed by 2017. In addition to the total number of provinces in this level increasing to nine in 2017, the spatial distribution range changed from western, central, and eastern China to western, central, and northeast China, maintaining a wide spatial distribution. 3) In 2010, there were 9 provinces with a green urbanization value between 0.38 and 0.42, which were widely distributed in the four major economic zones, but in 2017, areas with the same green urbanization values were clustered and distributed in the north of China. 4) Six provinces with green urbanization levels between 0.43 and 0.50 were mainly distributed in eastern China, especially the Yangtze River Delta, as well as Liaoning in northeast China and Gansu in western China in 2010, while provinces with the same green urbanization level in 2017 were mainly distributed in central China. 5) Only Beijing, Tianjin, and Shanghai city had green urbanization levels between 0.51 and 0.65 in 2010, but by 2017, they were joined by three other provinces, Jiangsu, Zhejiang, and Guangdong, in eastern China.
Spatiotemporal Evolution of Green Finance
In 2010, the level of green finance was relatively low, as indicated by the green finance score of most provinces (21 provinces, accounting for 70% of the total) being below 0.11 (Figure 4). Only Guangdong Province had a high level of green finance. The other eight provinces (Shandong, Jiangsu, Beijing, Hebei, Fujian, Zhejiang, Henan, and Sichuan) had values between 0.12 and 0.31 and were located in eastern China, except for Sichuan and Henan provinces.
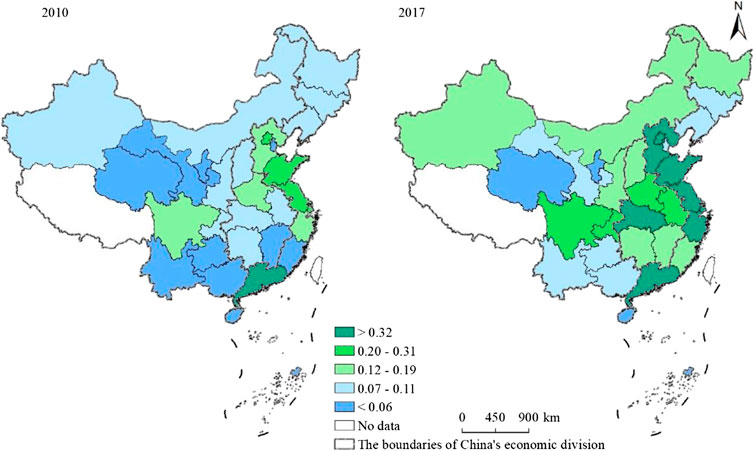
FIGURE 4. Spatial distribution of green finance in 2010 and 2017.
In 2017, the development level of green finance was significantly improved, with most provinces (20 provinces, accounting for 66.67% of the total) scoring higher than 0.12. The scores for provinces in eastern China, except Fujian and Hainan provinces, were larger than 0.32. The spatial distribution of provinces with scores between 0.20 and 0.31 tended to move westward. The provinces (Qinghai, Ningxia, Hainan, Gansu, Yunnan, Guizhou, Guangxi, Jilin, and Liaoning) with scores less than 0.11 mainly distributed in western China.
The Spatiotemporal Characteristics of the Coupling Coordination Degree Between Green Urbanization and Green Finance
The coupling coordination degree between green urbanization and green finance displayed an overall tendency of continuous optimization (Figure 5). However, the regional differences of the coupling coordination degree widened, as indicated by the range of regional coupling coordination degree increased from 0.12 to 0.23. The coupling coordination degree in eastern China was clearly higher than the corresponding values in central, western, and northeastern China. The coupling coordination degree ranged from high to low in the order of eastern, central, northeastern, and western China in 2010, while the score of western China surpassed that of northeastern China in 2017.
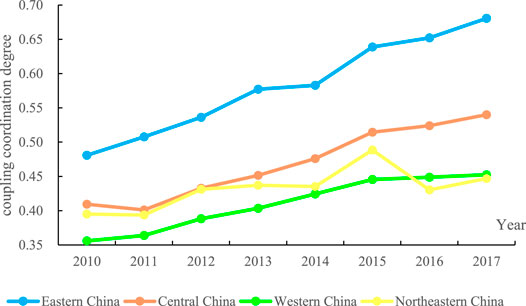
FIGURE 5. Temporal variation of the coupling coordination degree during 2010–2017.
Specifically, eastern China shifted from a low-level coordination in 2010 to a moderate coordination in 2017. Central China changed from a low-level coordination into a basic coordination during 2010–2017. Northeast China was in a state of basic coordination in 2017, but with a high level of volatility. From 2010 to 2015, the degree of coordination in Northeast China first showed a fluctuating rising trend, and then showed a decreasing trend. The western region realized a transformation from slightly uncoordinated to low-level coordination.
The coupling coordination degree between green urbanization and green finance displayed spatiotemporal differences across China at provincial level (Figure 6). Compared with 2010, the coupling coordination degree between green urbanization and green finance was significantly improved in 2017. However, the interprovincial differences of the coupling coordination degree also widened simultaneously.
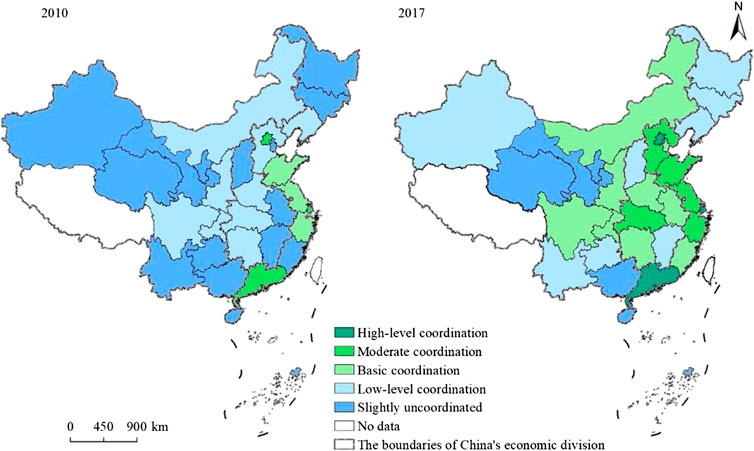
FIGURE 6. Spatial distribution of coupling coordination degree during 2010–2017.
In 2010, the relationship between green urbanization and green finance could be classified into four types according to the score of the coupling coordination degree: slightly uncoordinated, low-level coordination, basic coordination, and moderate coordination. Slightly uncoordinated and low-level coordination were the main types, accounting for fifteen (Heilongjiang, Jilin, Tianjin, Anhui, Fujian, Jiangxi, Shanxi, Hainan, Guangxi, Guizhou, Yunnan, Xinjiang, Qinghai, Gansu, and Ningxia) and nine (Hebei, Henan, Hubei, Hunan, Liaoning, Inner Mongolia, Shaanxi, Chongqing, and Sichuan) provinces, respectively. Together, these provinces accounted for 80% of all provinces. The number of provinces classed as basic coordination (Shandong, Jiangsu and Zhejiang) and moderate coordination (Beijing, Shanghai, and Guangdong) types was three in each category, and they were only distributed in eastern China.
In 2017, only Qinghai, Gansu, Ningxia, Guizhou, and Hainan were still slightly uncoordinated, while the remaining provinces had improved. The number of low-level coordination provinces decreased to eight, while the number of basic coordination and moderate coordination provinces increased to nine and five, respectively (Figure 7). In addition, Beijing, Shanghai, and Guangdong were classed as the newly emerging high-level coordination type.
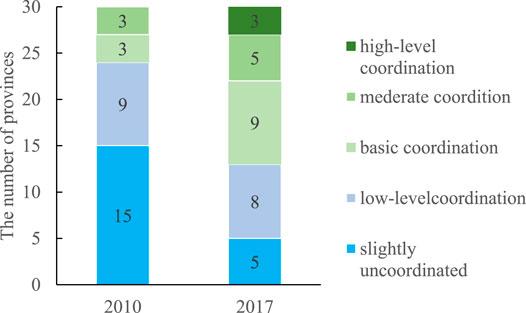
FIGURE 7. The number of provinces in different coupling coordination stages.
Spatial Association of the Coupling Coordination Degree
The global Moran’s I values in 2010 and 2017 were 0.211 and 0.282, respectively, with a p-value less than 0.01 (Figure 8). This indicates that the coupling coordination degree between green urbanization and green finance had significant spatial autocorrelation. And this kind of spatial agglomeration feature has been strengthened. However, global spatial autocorrelation is based on the assumption of spatial stability, and it is considered that the whole of a region has only one of the three trends of aggregation, dispersion, or random distribution. Therefore, global spatial autocorrelation may mask local instability. A Moran scatterplot is an effective way to investigate local spatial clustering and instability features, which mainly describe the correlation between the observed and spatial lag variables (i.e., the weighted average value of the observed variable values of adjacent spatial units) of a spatial unit. Moran scatterplots of the spatial clustering mode of green urbanization and green finance in 2010 and 2017 were generated using GeoDa software, with the plots divided into four quadrants (i.e., HH, LH, LL, and HL) based on the differences between provinces and their surrounding regions.
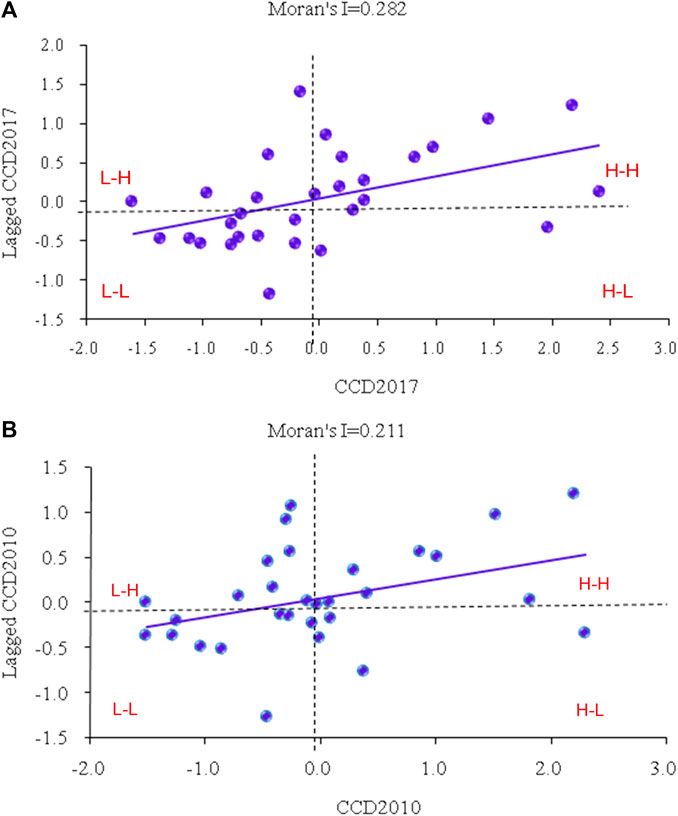
FIGURE 8. Moran scatterplots of the coupling coordination degree in 2010 and 2017.
In 2010, seven provinces fell into the quadrant of the HH spatial agglomeration mode (Beijing, Shanghai, Jiangsu, Shandong, Zhejiang, Hebei, and Henan), meaning that a high value was surrounded by another high value. Both the coupling coordination degree of these provinces and the spatially weighted average of the coupling coordination degree of their adjacent units were higher than the average, indicating a positive spatial correlation. Eleven provinces were located in the LL quadrant (Hubei, Shaanxi, Jilin, Heilongjiang, Yunnan, Gansu, Ningxia, Qinghai, Guizhou, Hainan, and Xinjiang), with these provinces having low values and their neighboring provinces also having low values. Seven provinces (Liaoning, Guangxi, Shanxi, Jiangxi, Anhui, Fujian, and Tianjin) were in the LH quadrant, and five provinces (Hunan, Chongqing, Inner Mongolia, Sichuan, and Guangdong) were in the HL quadrant, which indicated a spatial heterogeneity with their neighboring provinces.
In 2017, the number of provinces in the HH quadrant increased to 10, including Shanghai, Jiangsu, Zhejiang, Shandong, Hebei, Beijing, Fujian, Anhui, Henan, and Hubei. There were five provinces in the LH quadrant (Tianjin, Jiangxi, Shanxi, Guangxi, and Hunan). The HL quadrant only included Guangdong, Chongqing, and Sichuan. Twelve provinces were classed in the LL clustering mode.
There were four modes of spatiotemporal evolution revealed by the clustering model of the coupling coordination degree between green urbanization and green finance. Mode a describes the state change of a spatial unit itself, with the state of its adjacent spatial units remaining unchanged: HH→LH, LH→HH, LL→HL, and HL→LL. In contrast, mode b describes the transformation of an adjacent spatial unit, while the state of the original unit remains unchanged: HH→HL, LH→LL, LL→LH, and HL→HH. Mode c refers to a change in both the state of a unit and that of its neighboring units: HH→LL, LH→HL, LL→HH, and HL→LH. In mode d, there are no changes in a state of a unit or in its neighboring units: HH→HH, LH→LH, LL→LL, and HL→HL.
Figure 9 shows the transformation of the spatial clustering mode of each province and its neighboring provinces in China during 2010–2017. Mode d was the dominant mode, and therefore the spatial clustering mode of most provinces and their neighboring provinces remained unchanged, implying spatial stability. In terms of spatiotemporal transformation, three provinces were classed as mode a, indicating that their status remained the same, while those of their adjacent provinces changed. Only one province was classified into mode b, and two provinces belonged to mode c. Specifically, mode a transformation occurred in Anhui, Fujian, and Inner Mongolia during 2010–2017. Inner Mongolia was transformed from HL to LL, while Anhui and Fujian transformed from LH to HH. Liaoning experienced a mode b transition, from LH to LL. Hubei and Hunan experienced a mode c transformation, with Hubei transforming from LL to HH, and Hunan changing from HL to LH.
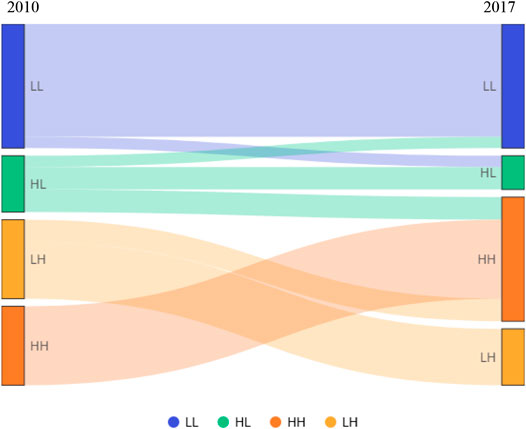
FIGURE 9. The transformation of spatial aggregation patterns of the coupling coordination degree.
Discussion
Spatial Characteristics of the Coupling Coordination Degree of Green Urbanization and Green Finance
The coupling coordination degree between green urbanization and green finance was higher in eastern China than in western China. Northeastern China had the lowest score. This spatial distribution was basically consistent with the overall pattern of social and economic development in China, although the coupling coordination degree was influenced by many factors. Western China, especially the area west of Hu’s Line, is sparsely populated, with a high altitude, dry climate, and poor transportation networks, which has led to a low level of urbanization. In addition, green finance in western China started late and from a low starting point. These factors resulted in the coupling coordination degree being low in western China. As the heavy industry base and granary of China, northeastern China is faced with problems such as resource exhaustion, an unbalanced industrial structure, and population loss, which are the main reasons for the low coupling coordination degree in northeastern China. The values of the coupling coordination degree of Shanxi and Jiangxi were the lowest of the central region provinces. Shanxi is a resource-exhausted province, while Jiangxi is surrounded by mountains, which restricts traffic flows. The coupling coordination level in the eastern region was generally high (except for Hainan), especially in Beijing, Shanghai, and Guangdong. Beijing is the capital city and the political, cultural, and scientific innovation center of China, while Shanghai is the economic, financial, and scientific innovation center of China. Guangdong is the largest economic province in China, and it has the strongest and most competitive provincial economy in China. Both the green urbanization and green finance of these three regions have developed well and a good coupling and coordination relationship has been formed.
Temporal Characteristics of the Coupling Coordination Degree of Green Urbanization and Green Finance
China has made unprecedented achievements in social and economic development, moving from rapid development to high-quality development during 2010–2017. With the implementation of the concepts of the construction of an ecological civilization and clear water and green mountains, all regions have given more attention to green development in the process of urbanization, which has significantly promoted the development of green finance. Compared with 2010, the degree of coupling coordination was significantly improved in 2017. The improvement of the coupling coordination degree also resulted in a significant spatial disequilibrium. The average increase of the coupling coordination degree followed a pattern from high to low in the order of eastern, central, western, and northeastern China. There are several possible reasons for this. Under the influence of the western development strategy, urbanization has improved to some extent in western China, but resource-based industries with high pollution levels and high energy consumption and industries with excess production capacity are still the main driving forces of social and economic development. Northeastern China is still in the transformation period of industrial structure adjustment. Green finance has not yet developed and only plays a limited role, and it is therefore difficult to achieve a high level of coupling and coordination with urbanization. Due to their unique geographical location close to the coast, the eastern provinces enjoy a relatively high level of social and economic development. They are moving away from rapid development to high-quality development, and are paying more attention to green development, while pursuing social and economic development. Central China is adjacent to eastern China, and its coupling coordination degree has increased rapidly under the influence of a spatial spillover effect from eastern China.
Spatial Dependence of the Coupling Coordination Degree
The provinces with a HH spatial aggregation model were mainly distributed in eastern China in 2010, but had spread to central China in 2017. This indicated that the eastern region had a high coupling coordination degree of green urbanization and green finance, as well as showing a spatial spillover effect, achieving coordinated and interconnected development among provinces and regions to a certain extent. The provinces with an LL spatial aggregation were located in western and northern China. Natural conditions, location conditions, and industrial structure were the main reasons for the low degree of coupling coordination in these regions. The LH spatial clustering mode was distributed in eastern, central, and western China, meaning that the provinces with a low coupling coordination degree were surrounded by provinces with high values. Tianjin, Jiangxi, Guangxi, Shanxi, and Hainan all exhibited LH spatial clustering in 2010 and 2017. Except for Tianjin, these areas have many mountains and hills, with difficult access for traffic, resulting in economic development and a lack of development impetus. Guangdong, Chongqing, and Sichuan exhibited the HL spatial aggregation model in 2010 and 2017, indicating that these provinces had a high coupling coordination degree but were surrounded by provinces with low values. This indicates that the radiation driving effect of these provinces on the surrounding provinces was limited, with a siphon effect being a better description of their impact.
Policy Implication
The coordinated development of green urbanization and green finance is the inevitable choice to realize the Chinese dream. However, the development level of green finance in China is generally low. China should gradually explore a development path that is compatible with the development stage of China’s green urbanization. For relatively backward regions, the traditional urbanization model should be changed and green finance should be developed to guide capital flow to green industries so as to achieve green development. For some regions with a high level of green urbanization, the development of corresponding green finance is relatively backward. We should gradually expand the scope of green financial services, build a “green finance plus” service system, and create multidimensional green financial products. Besides, it should be noted that regional development has obvious spatial spillover effect, so effective linkage, benign competition, and coordinated development between regions should be strengthened.
Conclusion
Taking China as the study area, this study constructed a comprehensive evaluation index of green urbanization and green finance based on data for 30 provinces during 2010–2017. Subsequently, a coupling coordination degree model was applied to investigate the relationship between green urbanization and green finance, as well as the spatiotemporal characteristics of their coupling coordination state. Furthermore, global and local Moran’s I were used to explore the spatial dependence of the coupling coordination degree between green urbanization and green finance. The main conclusions were as follows.
1) During 2010–2017, the level of green urbanization and green finance improved, but the development of green finance lagged behind green urbanization, and the comprehensive score was still low.
2) The coupling coordination degree between green urbanization and green finance had clear temporal and spatial differences. From a temporal perspective, it presented a trend of continuous optimization. From a spatial perspective, that of the eastern region was clearly higher than that of other regions. Additionally, there were large regional differences in the coupling coordination degree.
3) In 2010, four types of relationship between green urbanization and green finance were observed, i.e., slightly uncoordinated, low-level coordination, basic coordination, and moderate coordination. Slightly uncoordinated and low-level coordination were the main types, accounting for 80% of all provinces. In 2017, the coupling coordination degree between green urbanization and green finance in most provinces was at or above the basic coordination level. In addition, the newly emerging high-level coordination type was observed in Beijing, Shanghai, and Guangdong.
4) Spatial dependency and spatial heterogeneity existed in the coupling coordination degree between green urbanization and green finance. The HH pattern gradually expanded from east to west China, while the provinces in the HL agglomeration class decreased during 2010–2017. This indicates that the coupling coordination degree between green urbanization and green finance had a good spatial agglomeration effect and there was a spatial spillover effect in central and eastern China. Most provinces in western China were in the LL clustering mode.
Data Availability Statement
The original contributions presented in the study are included in the article/Supplementary Material, and further inquiries can be directed to the corresponding author.
Author Contributions
GD and WenZ designed the study, YG was responsible for data collection and processing, GD completed the analysis of the results and the writing of the manuscript, YQ and WeiZ are responsible for the revision of the manuscript.
Funding
This research was funded by the National Natural Science Foundation of China (41801173) and Doctor foundation of Shandong Jianzhu University (XNBS1803).
Conflict of Interest
The authors declare that the research was conducted in the absence of any commercial or financial relationships that could be construed as a potential conflict of interest.
References
Bai, X., Shi, P., and Liu, Y. (2014). Society: realizing China’s urban dream. Nature 509, 158–160. doi:10.1038/509158a
Bai, Y. P., Deng, X. Z., Jiang, S. J., Zhang, Q., and Wang, Z. (2018). Exploring the relationship between urbanization and urban eco-efficiency: evidence from prefecture-level cities in China. J. Clean. Prod. 195, 1487–1496. doi:10.1016/j.jclepro.2017.11.115
Bucci, A., La Torre, D., Liuzzi, D., and Marsiglio, S. (2019). Financial contagion and economic development: an epidemiological approach. J. Econ. Behav. Organ. 162, 211–228. doi:10.1016/j.jebo.2018.12.018
Chen, M. X., Liu, W. D., and Tao, X. L. (2013). Evolution and assessment on China’s urbanization 1960-2010: under-urbanization or over-urbanization?. Habitat Int. 38, 25–33. doi:10.1016/j.habitatint.2012.09.007
Cui, H. R., Wang, R. Y., and Wang, H. R. (2020). An evolutionary analysis of green finance sustainability based on multi-agent game. J. Clean. Prod. 269, 16. doi:10.1016/j.jclepro.2020.121799
Fan, W. P., Wang, H. K., Liu, Y., and Liu, H. P. (2020). Spatio-temporal variation of the coupling relationship between urbanization and air quality: a case study of Shandong Province. J. Clean. Prod. 272, 122812. doi:10.1016/j.jclepro.2020.122812
Gu, C. L. (2019). Urbanization: processes and driving forces. Sci. China Earth Sci. 62, 1351–1360. doi:10.1007/s11430-018-9359-y
He, J. Q., Wang, S. J., Liu, Y. Y., Ma, H. T., and Liu, Q. Q. (2017). Examining the relationship between urbanization and the eco-environment using a coupling analysis: case study of Shanghai, China. Ecol. Indicat. 77, 185–193. doi:10.1016/j.ecolind.2017.01.017
Hu, M., Zhang, D., Ji, Q., and Wei, L. (2020). Macro factors and the realized volatility of commodities: a dynamic network analysis. Resour. Policy 68, 101813. doi:10.1016/j.resourpol.2020.101813
Li, C. G., and Gan, Y. (2020). The spatial spillover effects of green finance on ecological environment-empirical research based on spatial econometric model. Environ. Sci. Pollut. Control Ser. doi:10.1007/s11356-020-10961-3
Li, J. J., Zhang, J., Zhang, D., and Ji, Q. (2019). Does gender inequality affect household green consumption behaviour in China?. Energy Pol. 135, 101813. doi:10.1016/j.enpol.2019.111071
Li, S. C., Zhang, H., Zhou, X. W., Yu, H. B., and Li, W. J. (2020). Enhancing protected areas for biodiversity and ecosystem services in the Qinghai Tibet Plateau. Ecosystem Services 43, 101090. doi:10.1016/j.ecoser.2020.101090
Li, X., Zhang, D., Zhang, T., Ji, Q., and Lucey, B. (2021). Awareness, energy consumption and pro-environmental choices of Chinese households. J. Clean. Prod. 279, 123734. doi:10.1016/j.jclepro.2020.123734
Liao, S. J., Wu, Y., Wong, S. W., and Shen, L. Y. (2020). Provincial perspective analysis on the coordination between urbanization growth and resource environment carrying capacity (RECC) in China. Sci. Total Environ. 730, 138964. doi:10.1016/j.scitotenv.2020.138964
Liu, N. N., Liu, C. Z., Xia, Y. F., and Da, B. W. (2018a). Examining the coordination between urbanization and eco-environment using coupling and spatial analyses: a case study in China. Ecol. Indicat. 93, 1163–1175. doi:10.1016/j.ecolind.2018.06.013
Liu, W. J., Jiao, F. C., Ren, L. J., Xu, X. G., Wang, J. C., and Wang, X. (2018b). Coupling coordination relationship between urbanization and atmospheric environment security in Jinan City. J. Clean. Prod. 204, 1–11. doi:10.1016/j.jclepro.2018.08.244
Liu, N. N., Liu, C. Z., Xia, Y. F., Ren, Y., and Liang, J. Z. (2020). Examining the coordination between green finance and green economy aiming for sustainable development: a case study of China. Sustainability 12, 3717. doi:10.3390/su12093717
Ng, A. W. (2018). From sustainability accounting to a green financing system: institutional legitimacy and market heterogeneity in a global financial centre. J. Clean. Prod. 195, 585–592. doi:10.1016/j.jclepro.2018.05.250
Owen, R., Brennan, G., and Lyon, F. (2018). Enabling investment for the transition to a low carbon economy: government policy to finance early stage green innovation. Current Opinion in Environ. Sustainability 31, 137–145. doi:10.1016/j.cosust.2018.03.004
Soejachmoen, M. P. (2017). Financing the green transformation: how to make green finance work in Indonesia. Appl. Artif. Intell. 53, 222–224. doi:10.1057/9781137486127
Song, W., Pijanowski, B. C., and Tayyebi, A. (2015). Urban expansion and its consumption of high-quality farmland in Beijing, China. Ecol. Indicat. 54, 60–70. doi:10.1016/j.ecolind.2015.02.015
Song, Y. J., Ji, Q., Du, Y. J., and Geng, J. B. (2019). The dynamic dependence of fossil energy, investor sentiment and renewable energy stock markets. Energy Econ. 84, 104564. doi:10.1016/j.eneco.2019.104564
Su, S. L., Xiao, R., and Zhang, Y. (2012). Multi-scale analysis of spatially varying relationships between agricultural landscape patterns and urbanization using geographically weighted regression. Appl. Geogr. 32, 360–375. doi:10.1016/j.apgeog.2011.06.005
Taghizadeh-Hesary, F., and Yoshino, N. (2019). The way to induce private participation in green finance and investment. Finance Res. Lett. 31, 98–103. doi:10.1016/j.frl.2019.04.016
Tian, Y. Y., Zhou, D. Y., and Jiang, G. H. (2020). Conflict or coordination? multiscale assessment of the spatio-temporal coupling relationship between urbanization and ecosystem services: the case of the Jingjinji Region, China. Ecol. Indicat. 117, 106543. doi:10.1016/j.ecolind.2020.106543
Wang, Y., Zhang, Q., Bilsborrow, R., Tao, S., Chen, X., Sullivan-Wiley, K., et al. (2020). Effects of payments for ecosystem services programs in China on rural household labor allocation and land use: identifying complex pathways. Land Use Pol. 99, 105024. doi:10.1016/j.landusepol.2020.105024
Wu, F., Zhao, W. L., Ji, Q., and Zhang, D. Y. (2020). Dependency, centrality and dynamic networks for international commodity futures prices. Int. Rev. Econ. Finance 67, 118–132. doi:10.1016/j.iref.2020.01.004
Xu, X. F., Wei, Z. F., Ji, Q., Wang, C. L., and Gao, G. W. (2019). Global renewable energy development: influencing factors, trend predictions and countermeasures. Resour. Policy 63, 101470. doi:10.1016/j.resourpol.2019.101470
Yang, M., Hou, Y., Ji, Q., and Zhang, D. (2020a). Assessment and optimization of provincial CO2 emission reduction scheme in China: an improved ZSG-DEA approach. Energy Econ. 91, 104931. doi:10.1016/j.eneco.2020.104931
Yang, Y. Y., Bao, W. K., and Liu, Y. S. (2020b). Coupling coordination analysis of rural production-living-ecological space in the Beijing-Tianjin-Hebei region. Ecol. Indicat. 117, 106512. doi:10.1016/j.ecolind.2020.106512
Zeng, X., Liu, Y., Man, M., and Shen, Q. (2014). Measurement analysis of the development level of China’s green finance. J. China Executive Leadership Academy Yan’an. 7, 112–121. doi:10.1155/2020/8851684
Zhang, D., Li, J., and Ji, Q. (2020). Does better access to credit help reduce energy intensity in China? Evidence from manufacturing firms. Energy Pol. 145, 111710. doi:10.1016/j.enpol.2020.111710
Zhang, D. Y., Zhang, Z. W., and Managi, S. (2019). A bibliometric analysis on green finance: current status, development, and future directions. Finance Res. Lett. 29, 425–430. doi:10.1016/j.frl.2019.02.003
Zhang, L., Xiao, L., and Gao, J. (2018). Measurement and comparison of green financial development level and efficiency in China: based on data of 1040 public companies. China Science and Technology Forum, 100–112. doi:10.13580/j.cnki.fstc.2018.09.017
Zhang, Z. X., and Li, Y. (2020). Coupling coordination and spatiotemporal dynamic evolution between urbanization and geological hazards?A case study from China. Sci. Total Environ. 728, 138825. doi:10.1016/j.scitotenv.2020.138825
Zhou, D., Xu, J. C., Wang, L., and Lin, Z. L. (2015). Assessing urbanization quality using structure and function analyses: a case study of the urban agglomeration around Hangzhou Bay (UAHB), China. Habitat Int. 49, 165–176. doi:10.1016/j.habitatint.2015.05.020
Zhou, D. Y., Tian, Y. Y., and Jiang, G. H. (2018). Spatio-temporal investigation of the interactive relationship between urbanization and ecosystem services: case study of the Jingjinji urban agglomeration. China. Ecol. Indic. 95, 152–164. doi:10.1016/j.ecolind.2018.07.007
Zhou, K. L., and Li, Y. W. (2019). Carbon finance and carbon market in China: progress and challenges. J. Clean. Prod. 214, 536–549. doi:10.1016/j.jclepro.2018.12.298
Zhou, X., Tang, X., and Zhang, R. (2020). Impact of green finance on economic development and environmental quality: a study based on provincial panel data from China. Environ. Sci. Pollut. Res. Int. 27, 19915–19932. doi:10.1007/s11356-020-08383-2
Keywords: green urbanization, green finance, coupling coordination degree, spatial correlation, spatial heterogeneity
Citation: Dong G, Ge Y, Zhu W, Qu Y and Zhang W (2021) Coupling Coordination and Spatiotemporal Dynamic Evolution Between Green Urbanization and Green Finance: A Case Study in China. Front. Environ. Sci. 8:621846. doi: 10.3389/fenvs.2020.621846
Received: 27 October 2020; Accepted: 03 December 2020;
Published: 01 February 2021.
Edited by:
Qiang Ji, Chinese Academy of Sciences, ChinaReviewed by:
Zhilong Wu, Jiangxi University of Finance and Economics, ChinaChuanzhun Sun, South China Agricultural University, China
Copyright © 2021 Dong, Ge, Zhu, Qu and Zhang. This is an open-access article distributed under the terms of the Creative Commons Attribution License (CC BY). The use, distribution or reproduction in other forums is permitted, provided the original author(s) and the copyright owner(s) are credited and that the original publication in this journal is cited, in accordance with accepted academic practice. No use, distribution or reproduction is permitted which does not comply with these terms.
*Correspondence: Wenxin Zhang, d3h6aGFuZ2puQDE2My5jb20=