 Laura Sereni
 Bertrand Guenet
 Isabelle Lamy
- 1Ecotoxicology Team, UMR ECOSYS, INRAe, AgroParisTech, Université Paris-Saclay, Versailles, France
- 2Laboratoire des Sciences du Climat et de l’Environnement, LSCE/IPSL, CEA-CNRS-UVSQ, Université Paris-Saclay, Gif-sur-Yvette, France
Contaminated soils are widespread and contamination is known to impact several biotic soil processes. But it is still not clear to what extent soil contamination affects soil carbon efflux (CO2) occurring through soil microfauna respiration. Regarding the large stocks of organic carbon (Corga) stored in soils, even limited changes in the outputs fluxes may modify atmospheric CO2 concentration with important feedbacks on climate. In this study, we aimed at assessing and quantifying how soil respiration is affected by contamination. For that, we performed a quantitative review of literature focusing on 1) soil heterotrophic respiration measurements thus excluding autotrophic respiration from plants, 2) soil copper contamination, and 3) the influence of pedo-climatic parameters such as pH, clay content or the type of climate. Using a dataset of 389 data analyzed with RandomForest and linear mixed statistical models, we showed a decrease in soil CO2 emission with an increase in soil copper contamination. Specific data from ex-situ spiking experiments could be easily differentiated from the ones originated from in-situ contamination due to their sharper decrease in soil Corga mineralization. Interestingly, ex-situ spikes data provided a threshold in soil Cu contents for CO2 emissions: CO2 emission increased for inputs below 265 mgCu.kg−1 soil and decreased above this concentration. Data from long-term in-situ contaminations due to anthropogenic activities (industrialization, agriculture, … ) also displayed an impact on soil carbon mineralization, much particularly for industrial contaminations (smelter, sewage sludge, … ) with decreased in CO2 emissions when Cu contamination increased. Soil pH was identified as a significant driver of the effect of Cu on CO2 emissions, as soil C mineralization was found to be more sensitive to Cu contamination in acidic soils than in neutral or alkaline soils. Conversely the clay content and the type of climate did not significantly explain the responses in soil C mineralization. Finally, the collected data were used to propose an empirical equation quantifying how soil respiration can be affected by a Cu contamination. The decrease in soil CO2 emissions cannot be related, however, in a role of C sink as it comes together with a decrease in soil microbial biomass.
Highlights
* A literature review assessed soil Cu contamination and basal respiration links.
* Soil Cu was found to decrease basal respiration specifically in acidic soils.
* Taking into account microbial biomass specific respiration increases with soil Cu.
* Soil respiration decreased after a 265 mgCu.kg1 threshold as assessed in laboratory.
Introduction
Soils play a key role in different ecosystem services such as water storage, food production or carbon sequestration. The last one is of particular interest due to the strong interactions with all the other ecosystems services and its direct impact on the climate system (FAO and ITPS, 2015; Adhikari and Hartemink, 2016). In the context of an increase in atmospheric greenhouse gas concentrations, soil carbon management is hence of major importance with a roughly three times larger carbon (C) pool in soils than in atmosphere (2400 GtC vs 800 GtC (Batjes, 2014; Friedlingstein et al., 2019)]. However, the soil C residence times vary from years to millennia depending on land use, climate or soil mineral composition (Sorensen, 1981; Liang and Balser, 2011; Schmidt et al., 2011).
Carbon fluxes from soils to atmosphere are estimated from 75 (Schlesinger, 2000) to 91 Pg.C.year−1 (Hashimoto et al., 2015) and represent the second largest carbon fluxes after photosynthesis between terrestrial ecosystems and the atmosphere (Xu and Shang, 2016). Soil microbial respiration would account for around 56% of these C fluxes (Hashimoto et al., 2015) with a magnitude depending on environmental factors such as soil mineralogy (Wang, et al., 2003; Müller and Höper, 2004) or pH (Rousk et al., 2009). The soil microbial respiration results from soil organic matter (OM) decomposition and is driven by the amount of microbial biomass and by how much is respired by microbes. Microbial activities are driven by environmental factors (temperature, soil moisture, etc.) but are also affected by contamination (Baath, 1989). The ratio of respiration (C-CO2) per unit of microbial carbon biomass (Cmic) is called specific respiration or metabolic quotient (qCO2) depending of the authors. Jones and Ananyeva (2001) identified the metabolic quotient as an interesting indicator of stress related to organic contaminations with higher metabolic quotients in soils contaminated by pesticides. Metabolic quotient is thus commonly used as a suitable indicator to investigate the impact of environmental conditions on soil microbial communities (Anderson and Domsch, 1993). Soil contaminant effect on soil microbial community structure is complex and can varies with time (Deary et al., 2018). However, soil contaminants are expected to alter soil ecosystem services by 1) a general decrease in microbial communities sizes, 2) a replacement by competitor or a lack in trophic-chain (Wakelin et al., 2010) due to differential mortality in communities, 3) an increase in respiratory activities per unit of microbial biomass in reaction to stress (Odum, 1995), and/or 4) an impact on the soil OM degradation due to a decrease in soil OM availability following associations between OM and contaminants (Dumestre et al., 1999; Sauvé et al., 2000).
It has been estimated during the 90’s that more than 22 Gha of soils over the globe were contaminated by organic and/or metallic substances from numerous origins (Rodríguez-Eugenio, 2018). These contaminations were due either to atmospheric deposition near roadside (Kumar et al., 2016; Venuti et al., 2016), or near industries, or to water treatment plant or landfill (Baderna et al., 2011). Agricultural practices have also provided different soil contaminants through the spreading of pesticides, or mineral or organic fertilizers which have been widely used in developed countries since the 50’s. In the attempt to estimate the effect of soil pollution on the soil functions, microbial respiration measurements have been mainly used in ecotoxicological studies. Bååth (1989) claimed that microbial respiration is “the oldest and most studied variable in connection with metal pollution”, because it is a key process in the soil C storage function. But the use of this indicator and the ways of interpreting it were shown to be contrasted, depending on the pollutant and on local conditions. Consequently no clear pattern arose across studies on the effects of contaminants on soil respiration, even with respiration values normalized by microbial community size or soil OM content as suggested by Brookes (1995).
Among metal pollutants, copper (Cu) is of major environmental and toxicological concern (Komárek et al., 2010) and many data can be found in the literature (Panagos et al., 2018). Soil Cu contamination has various origins including both industrial or agricultural activities. Mine tailing or atmospheric deposition can increase soil Cu concentration regarding to geochemical background as well as the agricultural practices with the use of Cu-based fungicide or the application of enriched Cu animal manure or sewage sludge. As a cation, Cu is easily complexed by the negatively charged soil OM more than other metallic cations, inducing high Cu concentrations in the upper layers of soils where OM concentration are higher (Rodríguez-Eugenio, 2018). Cu contamination was shown to affect soil respiration, but some studies provided contrasting results. For instance, without supplement in carbohydrates (the source of energy for microorganisms) Soler-Rovira et al. (2013) had not detected any effect of Cu contamination on soil respiration while other studies showed either a decrease or an increase in respiration with an increase in Cu soil concentration (Merrington et al., 2002; Li et al., 2005; Keiblinger et al., 2017). The type of soil appears as a key factor modulating the effect of Cu on soil respiration due to biotic or abiotic Cu bounds with soil constituents (Komárek et al., 2010). Dominant mechanisms, however, are still not clearly assessed, even when using the various technics mimicking the bio-available pool of Cu such as soil extractions with CaCl2, ethylenediaminetetraacetic (EDTA), or diethylenetriaminepentaacetic acid (DTPA) solutions (Wang et al., 2018). Other parameters like soil OM content or soil pH have been proposed to explain some of the contrasting results observed in the literature (Moreno et al., 2009; Fernandez-Calvino and Baath, 2016). Finally, if soil Cu contamination unambiguously can have an impact on soil respiration, it is not clear if a generic relationship can be defined or if observed results are site-specific. Such a generic and empiric relationship, however, could be useful to take into account soil contamination in various modeling prospective scenario involving carbon cycle like those of climate change.
In this context, the aim of this study was twofold: 1) to establish a generic relationship describing soil Cu contamination effect on soil CO2 emissions using available literature data and 2) to identify the main drivers of CO2 emissions, following a gradient of soil Cu contamination. We carried out a quantitative review of peer review published available data and created a database by collecting soil respiration data in the presence of Cu contamination together with available pedo-climatic conditions of the samples used for the measured data. We took into account both papers dealing either with data involving in situ Cu contamination or those dealing with ex situ Cu spikes under laboratory conditions. To be environmentally relevant, we chose to focus the present study on basal respiration, defined as the steady state of respiration in soil which originates from the mineralization of soil OM by microorganisms and the associated CO2 fluxes (Pell et al., 2006). Thus, we do not to take into account data where carbohydrates were added. Selected papers were those which only provided data both from soil basal respiratory activities and soil total Cu concentrations. In order to highlight the drivers of the changes in soil C mineralization, collected data included total soil Cu concentration, and when they were available the values for the microbial biomass carbon and pedological factors as soil pH, clay, and OM contents. We also included the origin of the soil contamination, and the climatic zone of the soil samples as, different climatic conditions can impact microbial communities evolution (Fierer, 2017). Data were discussed by exploring the main factors best explaining the Cu contamination effect on soil C mineralization.
Materials and Methods
Bibliographic Research
To find data linking soil C emissions and soil Cu concentrations, we ran a Wos Core Collection research using the following equation of research:
TS = (("soil C" OR "soil organic C*" OR "soil organic matter") NEAR/10 (minerali* OR decomposition)) OR TS = ((soil near/4 ("CO2 emission" OR "CO2 release" OR "basal respiration" OR respiration)) OR "soil respiration") AND TS = (Cu OR cupric OR copper)
Where “TS” refers to the titles, abstracts or subjects of research papers. NEAR was used to restrict the research to the “C mineralization” nominal group related to soil processes. Four and ten spacing between words were defined by successive research looking for a maximum of results with a minimum of noise and usable number of papers. The research was lastly actualized in December 2019.
This provided 238 papers published between 1983 and 2019. To focus only on soil heterotrophic basal respiration, we excluded from this selection through careful reading the papers where litter or lake sediment respiration were measured, or when studies focused on substrate induced respiration. In order to focus mainly on Cu effect, we also excluded papers from multi-contaminated soil if the contribution of Cu contamination was identified by the authors as minor compared to other contaminants. Finally, we excluded soil remediation studies using mineral (lime, beringite, and Ca) or biochar amendment because these soil inputs introduced a bias in the soil carbon emissions and their side effects were poorly documented.
The final selection consisted in 92 papers from both in-situ or ex-situ (laboratory) Cu contamination. Papers with unclear protocols regarding to the incubation lengths, or with supply in carbohydrates or in the presence of plant (particularly in the case of field measurements) were also discarded. Furthermore we extracted data giving outcomes only with long term measurements (> 7 days) to avoid the parts corresponding to the Birch effect, i.e. the known major increase in mineralization rate due to soil re-humidification (Birch, 1958). None of the papers dealing with in situ field measurements satisfied our standards (e.g., absence of plants, knowledge of total Cu content, … ), so they were not kept in our final selection. This ended to 46 papers describing incubations experiments using either uncontaminated soils which were further copper contaminated, or already contaminated soils. These papers allowed us to have access to 389 data including their associated control in order to build the database. Fourteen from those 46 papers where published between 1990 and 2000, 24 between 2000 and 2010 and 17 between 2010 and December 2019. Graphical values were exported with the Engauge digitizer (v12.0) software (Engauge digitizer v12.0) (Mitchell, 2019).
Database Construction
We gathered 389 experimental laboratory measurements. All contained total Cu in soil (mg.kg soil−1) and the corresponding basal heterotrophic respiration (C-CO2 kg soil−1 d−1). When available soil Corga, soil pH, clay percentage and microbial C biomass (Cmic gC.kg soil−1) were also reported. When soil carbon data were originally expressed in OM we converted them in Corga using Corga = OM/2 (Pribyl, 2010). When total carbon was measured without mention of carbonates, we assumed that total C = Corga. Data were expressed on a dry soil weight basis. When original data were expressed on a fresh soil weight basis, we converted fresh soil weight data in dry soil weight data using water holding capacity (WHC) and soil moisture information’s when given. In the absence of mention on the humidity state of the samples used in the experiments, we hypothesized that data were expressed on a dry weight basis. For 7 papers (corresponding to 33 data) where the soil Cu concentrations in the control samples were not explicitly given, we used as a surrogate the corresponding copper concentration given by the map of Ballabio et al. (2018) for the position.
The database was supplemented when possible with two types of calculated data:
1) In order to take into account soil Corga concentration, daily mineralization was divided by the soil Corga and was further named soil C mineralization (expressed as fluxes per day). When soil C respiration was reported with cumulative measurements (e.g., amount of C released during incubation time) we calculated a daily respiration from the data after the equilibration period (i.e.; after rewetting) using the two last points from curve of cumulative C release to provide an amount of C release per day at the end of the incubation period.
2) The Response Ratio (R.R, Eq. (1)) for each incubation experiment involving laboratory copper contamination, defined as the ratio of C mineralization in contaminated conditions on C mineralization for the control:
Finally, the database was also supplemented with two other extractable data: 1) the climatic origin of the soil samples and 2) the origin of the Cu contamination. This latter being linked to the form under which it is present (organic or mineral, in solution or included in a solid phase for example). For each data we gathered the climatic origin of the soil samples using the Koeppen classification system (Rudolf Geiger, 1954) with ten subdivisions corresponding to the main geographic repartition of climate in the world. Thereafter two letters were used in accordance with the Koeppen classification system: the first letters refer to the main type of climate (A = Tropical, B = Dry, C = Temperate, D = continental), and the second letters will refer to the rainfall pattern (f = humid all year long, m = monsoon, s = dry summer, w = dry winter).
To fill in the database with the origin of the Cu contamination and in order to take into account the magnitude of the Cu contamination together with the exposition time in the effect on soil C mineralization, we collected explicit information regarding the site where the soils were sampled. We have thus divided the contamination information into four main categories: 1) the “non contaminated” sites (thereafter named Nc) used as “non-polluted” controls in the laboratory experiments, or often sampled in situ under grassland or forest, 2) the agricultural sites (thereafter named Agr) with moderate but chronic contamination, 3) the industrial sites (thereafter named Ind) with high mostly multi-contaminated soils during the last 100 years from industrial effluents or atmospheric dust deposition; and 4) a category we called “Other sites” (thereafter named Oth) in which the Cu contamination was from various or from undefined origin (city park, roadside …). In addition to this information on contamination, a suffix was added to distinguish the various ex-situ experiments: 1) the addition of a non-contaminated OM like straw or grass to a soil sample (thereafter called + OM), 2) the addition of an already Cu contaminated OM like pig slurry or sewage sludge to a soil sample (thereafter called + OMc), 3) the addition of Cu spikes under mineral forms to soils (thereafter called + S), or 4) the addition of both OM and Cu spikes to soils (thereafter called OM + S).
All these subdivisions introduced in the database were made to provide clusters in order to interpret the whole set of data and assess the genericity of the soil C mineralization answers to soil Cu contamination.
Statistical Analysis
Statistics were used here to overcome two main difficulties in dealing with our bibliographic data: 1) the missing data across papers and in particular pedological data, and 2) the fact that because some studies performed several treatments, data extracted from a same paper were less independent from each other than data from different papers. Thus, two successive and complementary statistical approaches were conducted, one descriptive and the other predictive.
To explain daily soil Corga mineralization we first analyzed the data with the maximum number of parameters including the pedo-climatic ones (thus with the smallest number of data) using the descriptive statistics PCA (R packages FactoMineR and factoextra) and Random Forest (R package randomforest) to determine which parameters have to be firstly considered. This prevents us to deal with parameters which restrict the number of data to be analyzed simultaneously (due to a lack of this information in some papers). This also prevents us to deal with co-correlation. Random Forest results were exploited through the partial modelled plots and the % of Mean Standard Error (MSE) Increase. This percentage represents the increase in MSE predictions of a randomly chosen variable being permuted among all the variables.
The following step consisted in using the stepwise regression on linear mixed effects models (lme, stepAIC, MASS package, with bidirectional selection) as predictive statistics. This method takes a given number of variables as fixed effect and selects the better ones as predictors to explain a response variable by minimizing the model AIC. It was used on the sub-dataset defined thanks to the use of Random Forest and PCA. A final model was then gradually built by adding or deleting variables which were or were not linearly related to the response variable. The model was selected thanks to the AIC criterion. The final selected model had to provide the maximum likelihood for the minimum number of response variables. It could happen that one variable is selected in the final model even if its p-value does not appear as particularly relevant: this is because the final model would have been particularly degraded without this variable.
The three following variables: 1) soil C mineralization, 2) respiration per microbial C biomass also named metabolic quotient thereafter called qCO2 and 3) response ratio (R.R.) were tested as response variables whereas soil Cu content, pH, % of clay or microbial C biomass (Cmic) were fixed quantitative effect. Interactions between response variable were also tested, but were limited to Cu and pH interaction due to the lack of data for the other response variables. The rainfall pattern (corresponding to the 2nd letter of the Koeppen classification), the ex-situ additions of contamination (under the form of added organic or mineral Cu contents) and the nature of the in-situ contamination (agricultural, industrial or “other” as well as non-contaminated) were tested as fixed qualitative variables. Data originating from a same paper -thus a same set of experiment- were less independent from each other than data from different articles. To tackle this problem, we used those articles from which the data came from as a random effect in linear mixed model. In our case the complementary use of descriptive and predictive statistics was used to confirm the robustness of the results. All analyses were performed using R v3.5.1 and log transformed data to satisfy normal distributions hypothesis tested using Kurtosis and skewness tests.
Results
Collected Data and Structure of the Database
The complete database can be found in the attached data.
The main characteristics of the database are given Table 1 with the descriptors used in this study. Compared to the number of data we gathered for soil total Cu and pH (389), Corga (385), or mineralization of Corga (382), the data much missing were the microbial biomass Cmic (128 data). The number of data we could account for the response ratio was also limited (173 data) because R.R was calculated only with the set of papers dealing with added Cu contamination during laboratory experiments (spikes or contaminated organic matter). The percentage of clay was also a data not frequently specified (206 data). Furthermore, papers reported either Cmic or clay values but both were very seldom reported (43 data, 9 papers) which prevents us from analyzing collectively these two predictors. The range of values covered by the data was large (Table 1) which allows working with wide gradients. In particular, the Cu gradient covers a large range of soil Cu contents from non-contaminated to highly contaminated soils, with a total soil Cu concentration of 586 ± 65.6 mg.kg soil−1 (mean and SE) due to the various sources of Cu. The number of data in each categories of type of climate is given in Supplementary Table S1. Data covered a wide range of ecosystems but not equally distributed (Supplementary Figure S1): main data come from European countries and temperate climate, either with or without dry seasons, while the least well represented is the dry climate.
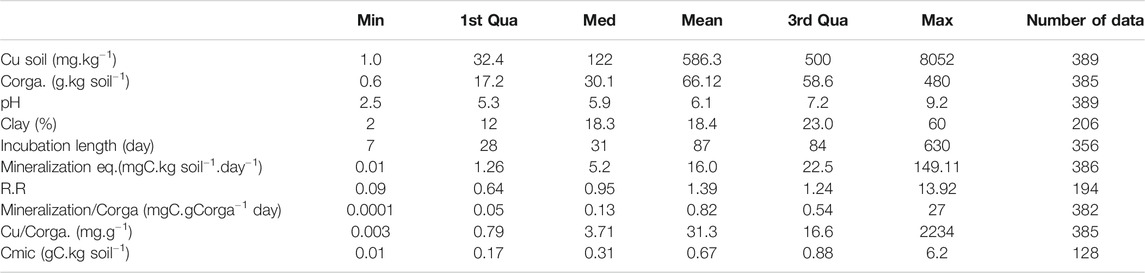
TABLE 1. Number of collected data after the final selection of the 46 papers and their corresponding ranges of values given as minimal (Min), medium (Med), maximal (Max), 1st and 3rd quadrant (Qua) and mean (Mean) values. Corga is the soil organic carbon content, R.R is the Response Ratio calculated according to Eq. (1), Cmic is the microbial C biomass.
In the dataset, spiked samples to introduce Cu contamination represent almost half of the data (Supplementary Table S2) and the highest values of added Cu concentrations pull up the average. When excluding laboratory contaminated experiments, most of the reported soil Cu concentrations ranged around 140 ± 19 mg.kg soil−1 as mean and SE respectively calculated for all the sites classified Agr, Nc, Oth or Ind in Supplementary Table S2. This value largely overwhelmed the mean Cu concentration measured in Europe (16.85 mg.kg−1) as reported by the European Soil Data Centre (ESDAC in Ballabio et al., 2018). But comparing with the measured concentration in vineyard soils (mean at 49.26 mg.kg−1) and considering that more than 14% of vineyard samples have values higher than 100 mg.kg soil−1), the mean 140 mg.kg soil−1 describing our database is in the upper Cu range of European soils. The database also reported few high spots of soil Cu contents in the so-called ‘industrial contamination’ group of data but the mean Cu concentration was around 190 mg.kg soil−1 (with a median at 95 mg.kg soil−1).
The discrepancy in the number of data per category had ambivalent impacts on our dataset. In one hand it confers some large sub-groups (for instance the “spiked” or the soils under agriculture) to carry out the analysis, but on the other hand the analysis of cross subgroups were not possible. For instance, industrial soils further contaminated by contaminated OM just provided 4 data. It was also not possible to cross rainfall pattern with the origin of the contamination (see Supplementary Tables S1,S2).
Selection of the Predictive Variables
A first selection of the predictive variables (also called thereafter predictors) was made by Random Forest on all the variables (numerical variables: Cu, clay, pH, microbial C biomass, and soil C mineralization but also categorical variables: main climate, rainfall pattern, soil use type and type of contamination).
A small number of papers (9) presented both values for clay percentage and Cmic, thus the analyzed data associated was 43. Random Forest explained 78.9% of the soil C mineralization variance. Random Forest emphasizes an effect of seasonal rainfall pattern (Figure 1A) which account for 19.7% of increase in MSE per standard deviation. pH, microbial biomass carbon and clay represent a second pool of variable of interest as these variables account respectively for 13.7,12.7 and 12.2% of increase in MSE per standard deviation (Figure 1A). Finally, Random Forest attributes a moderate part of the variation of the soil C mineralization to soil Cu contamination (4.3% of increase in MSE per standard deviation, Figure 1A).
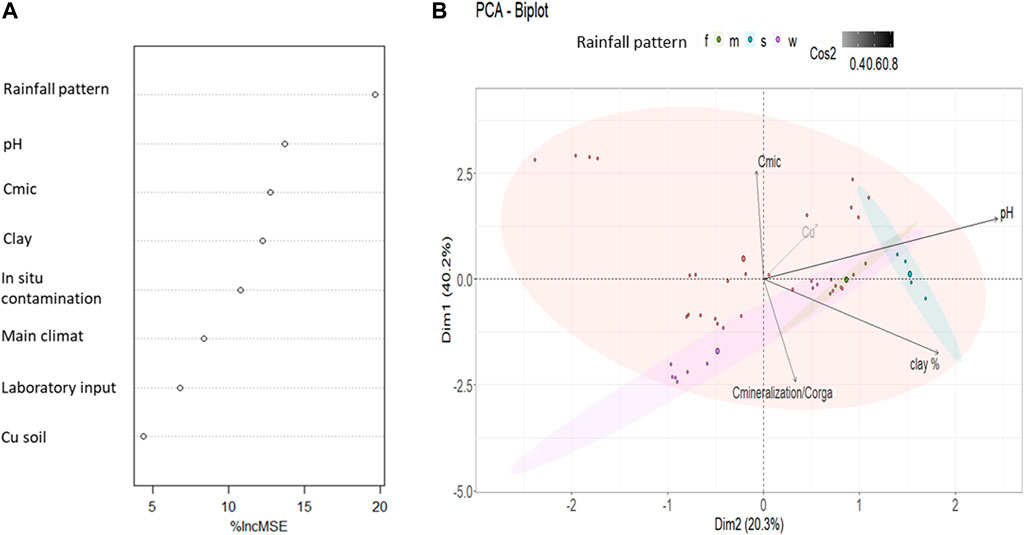
FIGURE 1. Analytical statistic description of the 43 data with all recorded variables set by two statistical approaches (A) Random Forest analysis with the % of increase in mean standard deviation (%IncMSE) due to each variable for soil C mineralization per soil organic carbon (B) PCA with the 2 first dimensions contributing to 60.5% of variance in the data set. Quality of representation through PCA construction of quantitative variables (axes component) are represented through the color of the arrow (cos2). Rainfall pattern is illustrated with the color of the data point, ellipse are the 95% confidence interval of groups representation in the PCA space estimation. Cmic is expressed in g per kg of soil, clay in percentage of soil, soil Cu in mg of Cu per kg of soil and C mineralization in mg of C-CO2 per g of soil Corga.
Sensus stricto PCA analyses cannot use categorical variables to define axis. Thus, the PCA was run on the same numerical variables than Random Forest (Cmic, pH, clay, Cu, mineralization per Corga). The component space (build on the numerical variables) was represented and then the data were added with respect to their categorical variables (climate, type or in or type of ex situ contamination). Their category was illustrated in color (Figure 1B) but they were not use to build the axes. The PCA explained 60.5% on the two first axes of the data set variance (Figure 1B), all variables being well reproduced (cos2>0.2) through these 2 dimensions. The 5 variables account significantly in the data set description with a highest contribution in the PCA construction of pH and Cmic (respectively 27 and 23%) and a smallest contribution for soil Cu (7%). Based on the PCA representation we could expect a positive correlation between Cu and Cmic and a negative one between Cu and soil C mineralization.
Compared to the Random Forest analysis, the exclusion of categorical variables in the PCA only slightly decreased the explanation of variances. The representation of data’s rainfall pattern is shown in Figure 1B. The PCA analysis doesn’t show significant differences between the different rainfall patterns, which also have a small number of soils sampled and large variation, particularly for the “w” soils. The other categorical variables (main climate, rainfall pattern, types of in situ and type of ex situ contamination) where not displayed by the PCA (Figure 1B for the rainfall pattern, other data not shown). Random Forest partial model plot (not shown) also showed that the rainfall pattern had weak interaction with the pH or with the nature of in situ contamination and no interaction with the other covariables. From our database, the rainfall pattern is thus suggested to impact the microbial biomass amount but the relationships with the effect of soil Cu and C mineralization were less clear and will have to be clarified using lme.
Global Soil Copper Contamination Effect on Soil C Mineralization and Influence of Specific Descriptors
In order to assess the specific impacts of the several descriptors, the first results with Random Forest and PCA have guided the further analyses on Cu effect on soil C mineralization using linear mixed effect models. Successive analyses were made on five types of dataset: 1) on the maximum dataset thus including only the co-variables always recorded (soil C mineralization and Cu contents) to clarify the effect of soil Cu on soil C mineralization; 2) on a dataset including in addition pH, rainfall pattern and clay percentage, as these co-variables were shown to be of main importance by our previous analysis (but not Cmic); 3) on a dataset replacing rainfall pattern and clay by Cmic then using the analyses of metabolic quotient qCO2 as response variable; 4) on a dataset restricted to response ratio measurements thus corresponding only to copper contamination supplied in laboratory; 5) on a dataset restricted to natural, in situ contamination in order to point out the influence of the origin of the contamination.
Modulation of Soil Organic C Mineralization by Soil Cu Content
We checked the influence of soil Cu per se with a lme analysis using the 382 data concerning soil C mineralization (as the response variable), Cu contents (as the fixed effect) and the papers as random effects as described in material and methods. Figure 2 shows the results confirming a non-negligible effect of soil Cu content on soil C mineralization as soil C mineralization decreases when soil copper content increases. The relationship was defined as:
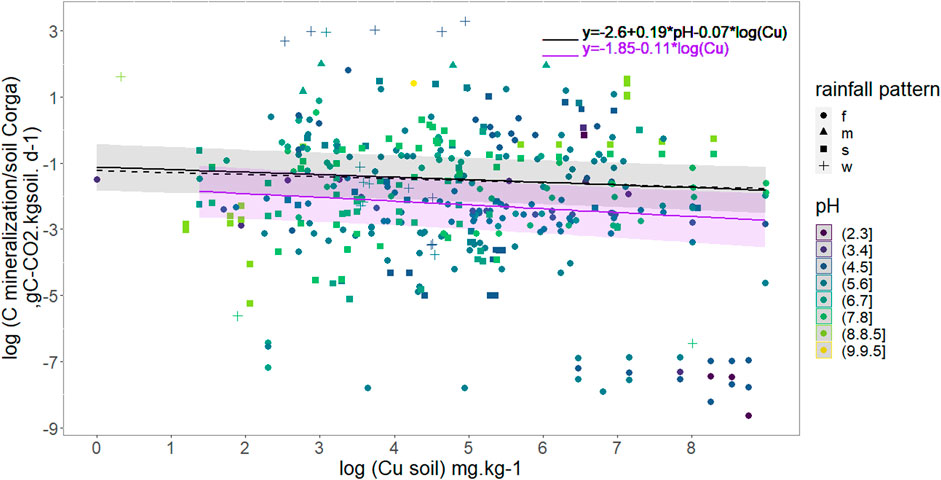
FIGURE 2. Daily Soil C mineralization per g organic C per day as a function of soil Cu concentration. Soil pH is colored scale and rainfall pattern represented with point shape. The full black line models copper effect on daily mineralization for all data considering median pH (5.9), R2 = 0.90. The black dash line models copper effect on daily mineralization for data with pH < 5.3. The purple line models copper effect on daily mineralization for data with pH Є[5.3,7]. The shaded area are 95% confidence interval for all data in black and data with pH Є05.3,7] in purple. Rainfall patterns are the following: f = humid all year long, m = monsoon, s = dry summer, w = dry winter.
Influence of Clay, Rainfall Pattern, and pH
Once clay, pH and rainfall pattern were included in the linear model selection, the selected model after stepwise regression (R2 = 0.92, 206 data) excluded clay but included pH and Cu as explaining variables as well than their interactions. However, p-values weren’t below acceptance rate (Cu p-value = 0.08; pH p-value = 0.70 and pH-Cu interactions p-value = 0.1, Supplementary Table S3). Rainfall pattern did not significantly affect soil C mineralization.
Investigations were then pursued without clay values and focusing on pH taking into account that pH is expected to be a determining factor based on PCA and Random Forest analysis (Figure 1). pH was a parameter always recorded in our database, thus, a largest number of soil C mineralization data could be analyzed (382). The selected model shows that an increase in soil Cu significantly decreases the soil C mineralization (p-value <0.005) and that the soil pH increase was related to an increase in soil C mineralization (p-value<2e−16). The interaction between pH and Cu weren’t selected in the final model. The analysis also showed an effect of the rainfall pattern: the soil C mineralization was significantly higher in the case of the “w” soils than in the case of the “f” ones. The adjusted effects of soil C mineralization with rainfall pattern are presented in Table 2, and the global equation of soil C mineralization is:
The small size effective of the different rainfall pattern doesn’t allow to assess if the Cu effect (understood as Cu slope) was significantly different between rainfall patterns.
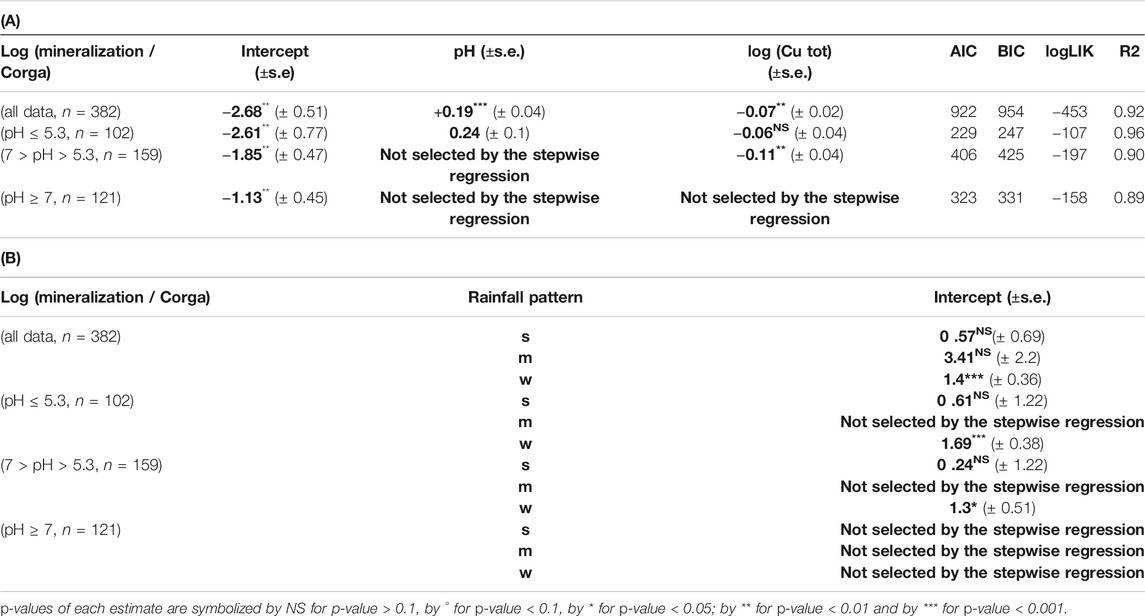
TABLE 2. (A) Slope and intercept ± SE between log (mineralization/ Corga) and variables selected through stepwise analyses with the linear mixed model for different dataset (all data, data with pH ≤ 5.3, data with 7 > pH > 5.3 and data with pH ≥ 7) as well as the metrics associated to each model. (B) Shift of the intercept for log (mineralization/organic C) between the different groups of qualitative variable (rainfall pattern) (s = dry summer, w = dry winter) and the reference one (f = humid all year long) Bold values are estimated coefficient through step wise regression.
Specific Influence of pH
Taking into account specifically the pH values allows us to work with a larger number of data analyzed. A first analysis showed that the interaction between soil pH and soil Cu concentration weren’t selected by the step wise (see Influence of Clay, Rainfall Pattern, and pH). To disentangle the effect of soil Cu across pH from a potential threshold effect on the soil C mineralization, we completed this first result with a splitting of the database in 3 subgroups defined on the basis of a decisional tree (Supplementary Figure S2): 1) 102 data with data pH ≤ 5.3, 2) 159 data with 7 > pH > 5.3, 3) 121 data with pH ≥ 7.
For the acidic soils (pH ≤ 5.3) the lme analysis showed a significant effect of pH but not of Cu on soil C mineralization. Cu was however maintained in the final model through the selection procedure even if the p-value wasn’t significant (p-v = 0.15) as explained in the material and method section (Table 2; Figure 2). For the soils with pH in the range]5.3; 7[soil C mineralization is expected to decrease with increase in soil Cu but no effect of pH was found (Table 2; Figure 2). For the soils with alkaline pH values soil C mineralization was not correlated neither to pH nor Cu (Table 2). In the two first cases the soils samples under “w” (dry winter) rainfall pattern were found to have soil C mineralization highest than the soils samples under the other rainfall patterns whereas the rainfall pattern was not supposed to modulate the soil C mineralization in the last case.
Finally, no clear interactions between Cu and pH were found, but we found different Cu effects on soil C mineralization depending on the ranges of pH values. The selection of Cu through stepwise for pH < 7 tends to show that soil Cu mostly affects soil C mineralization in acidic soil pH conditions, but the limited associated p-v for pH lower than 5.3 doesn’t allow us to draw general conclusion.
Cu Contamination and Microbial Parameters Effects on Soil Organic Carbon Mineralization: Use of the Metabolic Quotient qCO2
Based on the descriptive statistics, microbial C biomass was also an important variable to explain C mineralization variability. However, only few C-CO2 emission data were found associated with both clay and Cmic values while both variables were pointed out by descriptive analyses. We thus considered microbial carbon biomass rather than clay percentage in the explanatory variables (128 values), and did not find any significant Cu effect on soil C mineralization variability, which was found to only depend on Cmic and pH (general R2 = 0.90, Supplementary Table S4).
Based on the dependency of soil C mineralization on Cmic and because it has been shown that relative variables were most informative than absolute (Brookes, 1995) we modified our lme equation in order to use the metabolic quotient eg., daily mineralization per microbial carbon biomass (Figure 3) to use it as response variable in the lme. The final selected model shows that qCO2 increases with pH and Cu without evident interaction between the two variables. Neither rainfall pattern nor soil Corga were selected and the relationship obtained was:
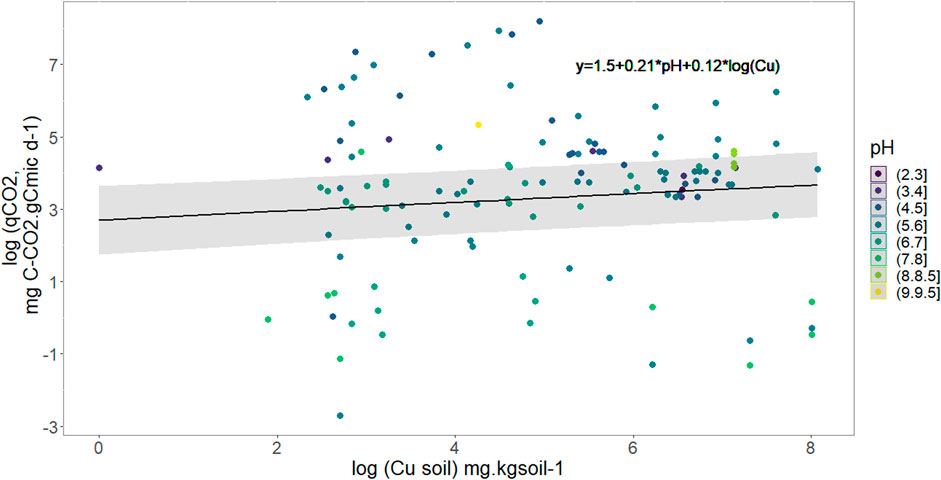
FIGURE 3. Variation of the metabolic quotient (qCO2) in mg C-CO2 respired per g of C of soil microbes as a function of soil copper concentration and pH represented through the color of points. The black full line models soil Cu effect on qCO2 with median pH value (5.7), R2 = 0.94.
From Eq. 2 we showed that soil C mineralization decreases with an increase in soil Cu concentration, and we also showed that soil CO2 emission increases with soil C microbial biomass (lme result, Supplementary Table S4). The effect of soil Cu on metabolic quotient was hence refined with the use of Cmic as response variable and Corga, soil Cu, pH and rainfall pattern as fixed explanatory variable. The model selection shows that microbial C biomass increases with soil Corga, but decreases when soil Cu content increases (p-value. respectively 0.02 and 0.008, general R2 = 0.84 see Supplementary Table S5). Rainfall pattern wasn’t selected by this step AIC selection.
Influence of Cu Contamination Supplied Ex-Situ using the Analysis of Response Ratio
Several data from our dataset concerned experiments introducing Cu contamination into soil microcosms in the form of Cu in solution (spikes), sometimes with OM (grass residues … ) or in the form of Cu contaminated OM (Supplementary Table S2). These experiments represent an artificial, non-repetitive and short-term contamination. Consequently, the microbial community has no time to develop evolutional response and must adapt thanks to phenological plasticity in contrary to more chronic, long-term diffuse contaminations where microbes can evolve to adapt. It was thus interesting to analyze these data per se, and in particular the R.R calculated as the variation of a given soil sample to a sudden increase in Cu content compared to a control (Eq. (1)). To include a maximum number of data in the response ratio analyses we didn’t take soil clay percentage into account. Soil pH and soil Corga were however kept in the analysis because they were well reported thus didn’t limit the number of data (176) to be analyzed.
Results show that R.R decreases when soil copper content increases (Table 3A) but increases when pH increases following Eq. (5):
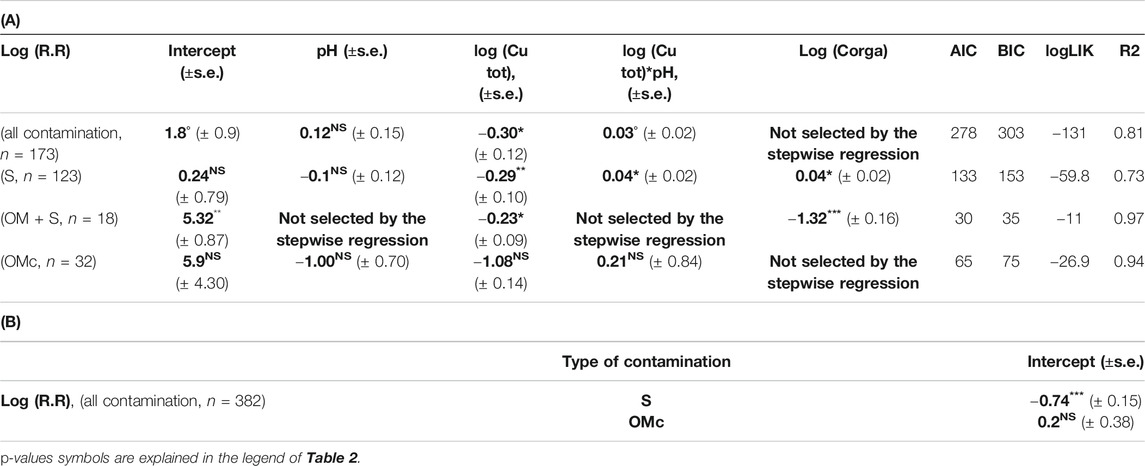
TABLE 3. (A) Slope and intercept (±SE) between log(R.R) and variables selected through stepwise analysis with the linear mixed model for different dataset (all contamination, spikes and contamination due to organic matter additions). (B) Shift of the intercept for log(R.R) between the different groups of qualitative variable (different type of laboratory contamination, S = Spike, OMc = contaminated organic matter) and the reference one (Spike + Organic matter contamination) only calculated for the full dataset. Bold values are estimated coefficient through step wise regression.
Interestingly, Figure 4 shows that response ratio is higher than 1 (log (R.R) > 0) for low soil Cu concentrations, meaning that the soil C mineralization is highest in contaminated soils than in the control ones. For all the OM + S and OMc contaminated samples, mean R.R was higher than 1. In these cases it is important to note that R.R, for the OM + S data, were calculated with the OM contamination as a control, thus largest soil C mineralization fluxes could not be attributed to organic matter supply. Figure 4 also shows that R.R lower than 1 (log(R.R) < 0) is expected for a soil Cu concentration exceeding a threshold value. From our dataset the soil Cu threshold was found controlled by the pH following the Eq. (6):
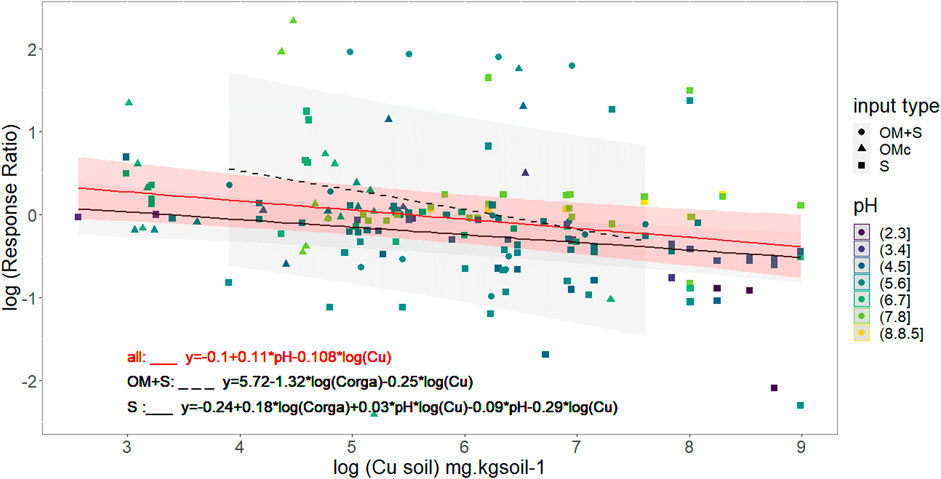
FIGURE 4. Variation in soil C mineralization due to artificial contamination. pH and nature of artificial contamination are represented through color and shape. Black red line models soil Cu effect on log (Response Ratio) for all supplementary contamination with median pH value (5.9), black full line for Spike contamination with median pH and Corga (5.7 and 29.4 g. kgsoil−1) value and black dashed line for organic matter + spike data with median Corga value (27 g.kg soil−1). Mean Response Ratio are calculated according to Eq. (1) and soil respiration in contaminated condition is equal to control respiration for log(Response Ratio) = 0 which is the grey dashed line.
As an example, a threshold value of 265 mg Cu. kg soil−1 can be calculated taking into account the mean reported pH 5.95 value in artificially contaminated samples. In those conditions, such a threshold value means that 1) for Cu inputs below 265 mg Cu. kg soil−1 the soil C mineralization fluxes will increase, 2) the soil C mineralization in contaminated soil is lower than in the control for soil Cu higher than 265 mg.kg soil−1, and 3) the highest the Cu inputs the lowest the R.R.
The type of added contamination (spikes only or in the presence of OM) could affect the soil response due to different Cu speciation as inputs. It would have been useful to include the interaction between the type of inputs and Cu in the R.R analysis through lme. However, due to the effective size we could only include the type of inputs but not their interactions with Cu. Nevertheless, results given in Table 3 show that the type of inputs affected the range of R.R values. Indeed, different intercepts were defined but the influence of the type of contamination on the Cu effect on C mineralization was less clear.
In order to improve the quantification of the effect of different kinds of added contamination (pure spike contamination, spike with non-contaminated OM and OM associated contamination) we analyzed separately the different subgroups. Results show that copper contamination effect was different depending of the contamination cases (Tables 3A,B) so that:
1) For pure spikes contaminations (123 data) and spikes with non-contaminated OM (16 data) we observed a decrease in R.R when Cu concentration increased (p-value = 0.005, general R2 = 0.89 and p-value = 0.01, general R2 = 0.80 respectively). Nevertheless, co-factors were found different between these two cases. In the cases of spikes, R.R is expected to increase with an increase in pH and in Corga. In the cases of spikes with non-contaminated OM, R.R is expected to decrease with an increase in Corga (see Tables 3A,B and Figure 4)
2) For contamination associated with OM (32 data), the effect of soil Cu on R.R was not significant even though Cu was kept in the model selection but with a p-value > 0.1. No effect of pH nor of Corga were found.
Thus, a strong influence on the nature of the Cu contamination supplied ex-situ was assess using R.R and the dataset restricted to laboratory conditions.
Effect of the Origin of Cu Contamination on Soil C Mineralization: Case of In Situ Copper Contamination
To investigate specifically data of in situ Cu contaminated soils without laboratory added Cu contamination (eg., when limiting the data set to the « non added contamination »), the soil clay content data were not included because the number of data from industrial or “other” soils would have been too small. Our analyses were then restricted to Cu and pH effects on soil C mineralization without investigation of other parameters. On their whole the 189 data thus obtained and analyzed by lme showed a slight tendency of a soil C mineralization to decrease with an increase in soil Cu (p-value = 0.08) and an increase with an increase in soil pH (p-value = 0.08) (Supplementary Table S6A).
Focusing on the 105 data with pH < 6.2 (taking the mean value of the 105 data as threshold) we found a significant and negative effect of soil Cu (p-value = 0.02) on soil C mineralization (Table 4A) as well as an effect of soil contamination type. Aggregating all the in situ contamination type the soil Cu contamination effect on soil C mineralization was modelled as Eq. (7):
The p-values were 0.6; 0.06; and 0.1 for pH, Cu and their interactions respectively, with a R2 = 0.97.
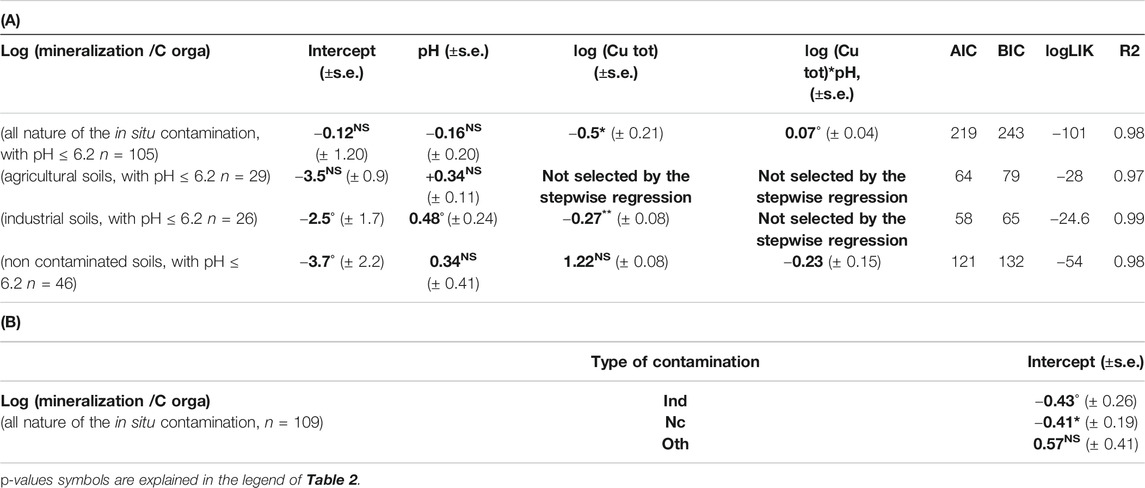
TABLE 4. (A) Slope and intercept (±SE) between log(mineralization/organic C) and variables selected through step wise analyze for the linear mixed model for different dataset (all nature of the in situ contamination with pH ≤ 6.2, agricultural soils with pH ≤ 6.2, industrial soils with pH ≤ 6.2, non-contaminated soils with pH ≤ 6.2). (B) Shift of the intercept for log(mineralization/organic C) between the different groups of qualitative variable (different types of in situ contamination with pH ≤ 6.2, industrial soils with pH ≤ 6.2, non-contaminated soils with pH ≤ 6.2) and the reference one (agricultural soils) only calculated for the full dataset. Bold values are estimated coefficient through step wise regression.
We did not find any effect of soil Cu on the soil C mineralization when agricultural type of contamination was involved (29 data, Table 4A). The same was found when the non-contaminated samples at the background Cu level were involved (46 data, Table 4A) but we did find an effect of soil Cu on soil C mineralization for the industrially contaminated soil types (26 data, Table 4A). The “other” sources of contamination were not examined separately because of the small number of data (n = 4). Hence, even for a diffuse and chronic in situ Cu contamination, the increase in soil Cu concentration can be related to a decrease in soil C mineralization. As previously we noticed a more pronounced effect of soil Cu on soil C mineralization in the acid soils. However, the differences in soil pH or soil Cu concentration could not explain the different relationships for the acid agricultural or industrial sites. In fact for Agr soils 1st and 3rd quartile of pH are 4.7 and 5.9 against 4.6 and 5.7 for Ind soils whereas mean and max Cu concentration are 148 and 992 mg.kg soil−1 for Agr soils and 109 and 898 mg.kg soil−1 for Ind soils. The multicontamination occurring in the industrial sites could artificially increase the effect of soil Cu on soil C mineralization in these sites, but we also observed a decreasing tendency in the whole naturally contaminated data set, which comfort us in the hypothesis of an observable in situ soil Cu effect.
Discussion
From General to Specific Relationship of Soil Copper Content Effect on Soil CO2 Emissions
Our general bibliographic approach allowed us to construct a large database with soil Cu concentrations associated to soil C mineralization for a large panel of ecosystems and contamination cases and with a broad range of soil pedological characteristics. Most of the in situ soil Cu content values (1st and 3rd quartile are respectively 16 and 133.4 mg.kg soil−1) used in these studies are in the range of European values from ESDAC Database [Supplementary Table S2 and (Ballabio et al., 2018)]. Moreover, for some cases (industrial fields) the Cu values were higher than data reported by ESDAC (1st and 3rd quartile respectively 44.6 and 216.3 mg.kg soil−1 but max at 1251 mg.kg soil−1). This might be due to the spatial heterogeneity of the Cu distribution at smaller scale (Chopin and Alloway, 2007) not reflected by the European database ESDAC despite their large (22,000) number of samples (Ballabio et al., 2018). Hence our industrial contamination database provides 8 data in the range of the highest spike contamination Cu concentration we also recorded. The high concentrations reached with spikes overwhelmed by several orders of magnitude most of the in-situ reported Cu concentrations. But they can still be considered as environmentally relevant because industrial sites, or amended agricultural soils like vineyard soils, are known to exhibit such concentrations (Aoyama and Nagumo, 1997; Zimakowska-Gnoińska et al., 2000; Usman, et al., 2005).
The complementarity uses of PCA and Random Forest allowed us to establish important cluster of analysis while analysis with lme limited the statistical bias in the small size factor classes. Using our quantitative analysis approach, we were able to define a generic relationship between soil C mineralization and soil Cu contamination and thus confirm an effective impact of Cu contamination on soil C mineralization. Several authors reported different effects of Cu on microbial characteristics and functions in soils (biomass, C mineralization, … ) depending of local soil properties, soil type (Doelman and Haanstra, 1984; Broos et al., 2007; Li et al., 2016), OM content, clay types (Li et al., 2015), pH (Fernández-Calviño and Bååth, 2016) or specific environmental conditions (freezing exposure (Salminen et al., 2002). Hence, from our global dataset, we confirmed the possibility of obtaining a general log linear relationship between soil C mineralization and soil Cu content, that shows a decrease in soil C mineralization when soil Cu content increase (Eq. (2)). Furthermore, we identified specific cases based on general soil properties such as pH but not clay. Even if Eq. (2)Eq. (3) relying soil C mineralization to soil Cu contents were different, it is notable that their slopes were rather identical (near −0.08, cf Eqs. (2) and Eqs. (3)). Thus, effect of soil Cu contamination on soil C mineralization was similar whatever the co-factor.
Soil contamination history, which was here roughly assimilated to the in situ contamination and soil use type, has also been identified as a non-negligible co-factor in Cu effect on soil C mineralization. The relationship between soil C mineralization and Cu contamination was also refined for the industrial sites or acidic soils. To better understand the impact of soil contamination on soil CO2 emissions, we looked at three response variables: qCO2, R.R and soil C mineralization. The equations thus obtained can be further used in other works depending on the desired expression of soil C mineralization or CO2 emission of interest and the available data mostly as soil pH and Corga.
How Environmental Factors Influence the Effect of Soil Cu Contamination on Soil C Mineralization?
We have shown that the global decrease in soil respiration with the increase in soil Cu contents could be refined considering the soil pH or the origin of contamination (Table 2). Our results showed that this decrease was i) particularly marked for acidic soils and ii) somehow influenced by OM.
The highest sensitivity of soil C mineralization to Cu contamination in the case of acidic soil compared to neutral or alkaline soil conditions is consistent with the fact that cationic Cu species are known to readily associate with OM, hence be less bioavailable for microbial communities. This was shown for moderate Cu concentrations but not for too high concentrations (Fließbach et al., 1994). In acidic soils, H+ and Cu2+ can compete to link with the functional reactive groups of OM so that for a same amount of soil Cu and soil OM, more Cu can be bioavailable in acidic soil (Khan and Scullion, 2000; Sauvé et al., 2000; Li et al., 2015). Furthermore, soil Cu concentration has been found positively correlated with soil pH (Panagos et al., 2018). Thus, the highest sensitivity of soil C mineralization in acidic soils found in laboratory conditions can be counter-balanced by the fact that in situ these soils are generally found to be less contaminated. As a result, the global effect of soil Cu contamination on soil C mineralization could be limited.
Numerous studies emphasize the potentiality of OM bindings to limit Cu bioavailability (Degryse et al., 2009; Amery et al., 2010; Groenenberg et al., 2010; Ren et al., 2015) particularly in the case of organic fertilizer amendments. Our results do not allow us to clearly assess the OM effect on Cu contamination. However, we saw that Corga could not be excluded from R.R analyses in spiked cases (Table 4B). In the case of spikes, the increase in R.R with OM tends to show that the negative Cu effect on soil C mineralization would be mitigated by the soil organic matter. But in the case of contamination with both spikes and OM inputs (OM + S), the negative influence of Corga could be due to confounding effects between an increase in soil Cu and an increase in soil Corga. Moreover, in this last case R.R is expected to be largely higher than 1 for the lowest Cu input but to decrease more abruptly with Cu concentration than in the case of spike only. Finally, no clear effect on soil C mineralization was found when dealing with the OMc samples for which Cu was provided in tight association with OM. Nonetheless our results are consistent with previous studies reporting that high soil OM contents diminished to a certain extent Cu availability (Smolders et al., 2012; Laurent et al., 2020), hence somewhat diminished the decrease in soil C mineralization due to Cu contamination. Thus, the soil C mineralization of soils with high C contents could be less impacted by Cu contamination than the one in soils with low Corga contents.
For the Soil Cu Contamination Effect, Does the Nature of the Input Matter?
It was interesting to investigate external, anthropogenic factors, as they are known to influence the soil responses. We thus separated the impact of land use through the analysis of the different natures of in situ contamination cases, and the cases of artificial laboratory contaminations. The comparison was not straightforward between short-term artificial contaminations in laboratories and chronic low inputs as in natural in situ environmental samples. Artificial Cu inputs are expected to rapidly and temporary decrease soil pH, whereas naturally in situ contaminated soils progressively equilibrate through various processes called “aging processes” or “natural attenuation” leading to less available contamination and less toxicity (Oorts et al., 2006; Smolders et al., 2009). Moreover on the long term, soil microbial community adaptation to successive metal stress has been shown (Niklińska et al., 2006; Philippot et al., 2008). Hence, compared to naturally contaminated samples, a larger effect of soil Cu content on soil respiration is expected for the ex-situ contamination experiments. Our results are consistent with these findings: the effect of soil Cu content on soil C mineralization is clearly assessed in the case of laboratory contamination, but only slightly assessed when considering the entirety of in situ Cu contaminated soil data.
The influence of the nature of the in situ contamination, however, was not clear: Cu effect on soil C mineralization was noticed for all the in situ contaminated acid soils (pH < 6.2) with different intercept values (Table 4B) depending on the contamination type. However, focusing on each subgroups of in situ contamination (Agr, Ind, Nc, Oth, Supplementary Table S2 the effect of soil Cu contamination on soil C mineralization was only assessed for the industrial soils. Multi-contaminations occurring in industrial sites (Wilson and Pyatt, 2007) have often been proposed to explain strong decline in soil functions (Ramsey, et al., 2005; Romero-Freire, et al., 2016). Some of the samples with “other” Cu source were also multi-contaminated, as they include for instance contamination from roadside. Unfortunately, the small (7) number of samples does not allow us to investigate the effect of soil Cu contamination on C mineralization in those soils and to affine the potential effect of multi-contamination. Hence, we just observed a downward trend in CO2 emissions with an increase in Cu contamination for in-situ contaminated sites. The effects were more pronounced in acids industrial sites. However, for low contaminated agricultural or other soils, no effect was detected.
Implication for the Climate of the Soil Cu Contaminations as Seen by the Variations in CO2 Emissions
Nowadays, several environmental policies aim at reducing atmospheric CO2 according to scenarios included in predictive atmospheric CO2 models. Soil pollution is still not included in models projection used to define policies, even if soil contamination is suspected to alter soil CO2 emissions. Our study focuses on Cu as a common pollutant known to affect several biological processes like plant productivity, microfauna reproduction or their biomass (Eijsackers et al., 2005; Tobor-Kapłon et al., 2006). Here we focused on one soil function which is the soil C mineralization and we showed that soil C mineralization and thus CO2 emissions tended to decrease when soil Cu concentrations increased. This is the results of two compensating processes: 1) the specific respiration (e.g., the amount of respired C per unit of microbial biomass) increases in particular for high contamination levels and low soil pHs and 2) soil microbial biomass decreases when Cu increases. Analyses of response ratio data also showed the same trend: as Cu concentration increases, R.R decreases when contamination stays below an estimated threshold of about 265 mg.kg−1, meaning that Cu inputs will increase the respiration of a contaminated soil compared to its uncontaminated level (see Influence of Cu Contamination Supplied Ex-Situ using the Analysis of Response Ratio).
Heavy metals such as Cu are known to accumulate in surface soils for a long time (Pietrzak and McPhail, 2004) and can be predicted to increase progressively as they are not biodegradable and poorly mobile in the soil profile. In accordance with our results, and following a Cu accumulation with time, contaminated soils will be supposed to emit less CO2 than non-contaminated ones. Furthermore, the increase in soil C mineralization noticed for Cu input below 265 mgCu. kg−1 would likely not be observed in the case of field contamination in scenarios with increasing Cu inputs. Finally, considering minimal and mean Cu contents in the case of in situ contamination from 1 to 140 mg Cu. kg soil −1 (Table 1; Supplementary Table S2 and Eq. (2)), we can predict with the geochemical models of soil CO2 emission an overestimation from roughly 41%.
Nevertheless, the general observed lower soil C mineralization in contaminated soils gets with an increase in the specific respiration rate (respired CO2 per unit of microbial biomass) at higher copper level. Thus, even though toxic high Cu contaminations reduce soil microbial biomass we can notice that CO2 respired per microbial biomass unit increases. Thus, our results rather show that if soil Cu contamination result in a decrease in soil C-CO2 emissions it is accompanied by a loss of soil function but not by an increase in C storing potential. Hence, a decrease in soil respiration does not necessary mean that more C is stored in the soil for a long time but it could be that less C is converted in biomass and biological products as microbial C biomass decreases. According to Ding et al., (2016) and Liang et al., (2017) the microbial biomass and more specifically the necromass are the primary contributors of stable soil C pool. Hence, taking into account the decrease of microbial biomass in contaminated soils, the over whole stabilization of C in soil is not expected to increase. Some biogeochemicals models include microbial biomass dynamics (Changsheng Li et al., 1992; Kuijper, et al., 2005; Moore et al., 2004) and their use could be useful to predict longer term effect of soil Cu pollution on C stock. In particular, the generic relationships between soil CO2 emission and soil Cu concentration obtained here could be used as a first step to complete continental biogeochemical models including soil Cu pollution and to refine soil CO2 emission scenarii. We propose that such a modified model should be used when prospecting futures of CO2 atmospheric concentrations and climate with, for instance, soil land use modifications and the estimated associated Cu pollution.
Conclusion
The aim of this study was to quantify a generic effect of soil Cu contamination on soil Corga mineralization and thus on soil CO2 emissions. By taking into account various soils types and contamination cases our study established that Cu contamination may decrease soil carbon mineralization and a generic relationship was established (Eq. (2)). This simple relationship between soil carbon emissions and soil Cu could, however, be refined to include soil parameters such as pH, Corga content and, when available the origin of the contamination. Our study points out that soil Cu contamination significantly affect soil C mineralization for soil Cu contents above 265 mg.kg−1 and also for acidic soils. Artificial acute Cu contaminations lead to highest decreases in soil C mineralization than in situ contamination. However if we raise our acceptation p-value to 0.1 the in situ contamination could be considered as significant. So that, even chronic long term contamination of soils due to anthropogenic activities can be related to a decrease in soil C mineralization. Our statistical analysis of soil microbial C content with Cu contamination showed a decrease of Cmic and an increase in carbon emission per unit of microbial biomass in some contaminated environments. Thus, it must not be concluded that the observed decrease in soil C mineralization in contaminated soils may be associated with a way to store more C in soils. On the contrary, the observed decrease in Cmic is expected to favor loss of soil functions and of resiliency to face supplementary stresses like extreme climatic events (Visser and Parkinson, 1992; Tobor-Kapłon et al., 2006).
Although very comprehensive, our study faces the lack of information on 1) soil carbon mineralization kinetics, 2) field measurements and 3) studies with extreme climate samples. Particularly 1) and 3) are factors of interest in long-term soil carbon release estimation to model CO2 cycle, CO2 atmospheric concentration and climate. The poor number of data concerning field measurements as well as the over-representation temperate and continental climates are damageable for global Earth functioning comprehension. To better anticipate the climate changes, we need studies in extreme climate conditions that get out of our methodological approach but would provide more reliable results. Nonetheless the generic equation we obtained relying soil C mineralization to soil Cu concentration can be considered as a step forward to improve the soil biogeochemical models and further climate projections. Moreover, some important drivers of soil OM mineralization had to be ignored in our study because of missing data such as microbial community composition or activity.
Data Availability Statement
The datasets presented in this study can be found in online repositories. The names of the repository/repositories and accession numbers can be found below: https://data.inrae.fr/dataset.xhtml?persistentId=doi:10.15454/P6XPF6 repository: data.inrae.fr; doi: 10.15454/P6XPF6.
Author Contributions
LS created the database and performed the analysis. IL and BG designed the study. All authors equally contributed the interpretation and the writing.
Funding
We acknowledge support from the Agence Nationale de la Recherche with the LabEx BASC (ANR-11-LABX-0034) and the CONNEXION project.
Conflict of Interest
The authors declare that the research was conducted in the absence of any commercial or financial relationships that could be construed as a potential conflict of interest.
Acknowledgments
The authors thank Christine Sireyjol for her help in the bibliographic search process, Olivier Crouzet for his advices in results exploitation. LS also thanks the ENS for her grant.
Supplementary Material
The Supplementary Material for this article can be found online at: https://www.frontiersin.org/articles/10.3389/fenvs.2021.585677/full#supplementary-material.
References
Adhikari, K., and Hartemink, A. E. (2016). Geoderma linking soils to ecosystem services — a global review. Geoderma 262, 101–111. doi:10.1016/j.geoderma.2015.08.009
Amery, F., Degryse, F., Van Moorleghem, C., Duyck, M., and Smolders, E. (2010). The dissociation kinetics of Cu-dissolved organic matter complexes from soil and soil amendments. Analytica. Chim. Acta 670, 24. doi:10.1016/j.aca.2010.04.047
Anderson, T. H., and Domsch, K. H. (1993). The metabolic quotient for CO2 (qCO2) as a specific activity parameter to assess the effects of environmental conditions, such as ph, on the microbial biomass of forest soils. Soil Biol. Biochem. 25, 393–395. doi:10.1016/0038-0717(93)90140-7
Aoyama, M., and Nagumo, T. (1997). Effects of heavy metal accumulation in apple orchard soils on microbial biomass and microbial activities. Soil Sci. Plant Nutr. 43, 601–612. doi:10.1080/00380768.1997.10414786
Bååth, E. (1989). Effects of heavy metals in soil on microbial processes and populations (a review). Water Air Soil Pollut. 47, 335–379. doi:10.1007/BF00279331
Baderna, D., Maggioni, S., Boriani, E., Gemma, S., Molteni, M., Lombardo, A., et al. (2011). A combined approach to investigate the toxicity of an industrial landfill’s leachate: chemical analyses, risk assessment and in vitro assays. Environ. Res. 111, 603. doi:10.1016/j.envres.2011.01.015
Ballabio, C., Panagos, P., Lugato, E., Huang, J.-H., Orgiazzi, A., Jones, A., et al. (2018). Copper distribution in European topsoils: an assessment based on LUCAS soil survey. Sci. Total Environ. 636, 282–298. doi:10.1016/j.scitotenv.2018.04.268
Batjes, N. H. (2014). Total carbon and nitrogen in the soils of the world. Eur. J. Soil Sci. 65, 10. doi:10.1111/ejss.12114_2
Birch, H. F. (1958). The effect of soil drying on humus decomposition and nitrogen availability. Plant Soil 10, 9. doi:10.1007/BF01343734
Brookes, P. C. (1995). The use of microbial parameters in monitoring soil pollution by heavy metals. Biol. Fertil. Soils 19, 269. doi:10.1007/BF00336094
Broos, K., Warne, M. S. J., Heemsbergen, D. A., Stevens, D., Barnes, M. B., Correll, R. L., et al. (2007). Soil factors controlling the toxicity of copper and zinc to microbial processes in Australian soils. Environ. Toxicol. Chem. 26, 583–590. doi:10.1897/06-302R.1
Chopin, E. I. B., and Alloway, B. J. (2007). Distribution and mobility of trace elements in soils and vegetation around the mining and smelting areas of Tharsis, Ríotinto and Huelva, Iberian Pyrite Belt, SW Spain. Water Air Soil Pollut. 182, 245. doi:10.1007/s11270-007-9336-x
Deary, M. E., Ekumankama, C. C., and Cummings, S. P. (2018). Effect of lead, cadmium, and mercury co-contaminants on biodegradation in PAH-polluted soils. Land Degrad. Dev. 29, 1583. doi:10.1002/ldr.2958
Degryse, F., Smolders, E., and Parker, D. R. (2009). Partitioning of metals (Cd, Co, Cu, Ni, Pb, Zn) in soils: concepts, methodologies, prediction and applications - a review. Eur. J. Soil Sci. 60, 590–612. doi:10.1111/j.1365-2389.2009.01142.x
Ding, J., Chen, L., Zhang, B., Liu, L., Yang, G., Fang, K., et al. (2016). Linking temperature sensitivity of soil CO2 release to substrate, environmental, and microbial properties across alpine ecosystems. Glob. Biogeochem. Cycles 30, 1310. doi:10.1002/2015GB005333
Doelman, P., and Haanstra, L. (1984). Short-term and long-term effects of cadmium, chromium, copper, nickel, lead and zinc on soil microbial respiration in relation to abiotic soil factors. Plant Soil 79, 317–327. doi:10.1007/BF02184325
Dumestre, A., Sauvé, S., McBride, M., Baveye, P., and Berthelin, J. (1999). Copper speciation and microbial activity in long-term contaminated soils. Arch. Environ. Contam. Toxicol. 36, 124–131. doi:10.1007/s002449900451
Eijsackers, H., Beneke, P., Maboeta, M., Louw, J. P. E., and Reinecke, A. J. (2005). The implications of copper fungicide usage in vineyards for earthworm activity and resulting sustainable soil quality. Ecotoxicol. Environ. Saf. 62, 99. doi:10.1016/j.ecoenv.2005.02.017
FAO and ITPS. (2015). Status of the World's Soil Resources (SWSR) ‐ Main Report. Food and Agriculture Organization of the United Nationsand Intergovernmental Technical Panel on Soils: Rome, Italy. Available at: http://www.fao.org/3/i5126e/i5126e.pdf.
Fernández-Calviño, D., and Bååth, E. (2016). Interaction between pH and Cu toxicity on fungal and bacterial performance in soil. Soil Biol. Biochem. 96, 20–29. doi:10.1016/j.soilbio.2016.01.010
Fierer, N. (2017). Embracing the unknown: disentangling the complexities of the soil microbiome. Nat. Rev. Microbiol. 15, 579. doi:10.1038/nrmicro.2017.87
Fließbach, A., Martens, R., and Reber, H. H. (1994). Soil microbial biomass and microbial activity in soils treated with heavy metal contaminated sewage sludge. Soil Biol. Biochem. 26, 1201–1205. doi:10.1016/0038-0717(94)90144-9
Friedlingstein, P., Jones, M. W., O’Sullivan, M., Andrew, R. M., Hauck, J., Peters, G. P., et al. (2019). Global carbon budget 2019. Earth Syst. Sci. Data 11, 1783–1838. doi:10.5194/essd-11-1783-2019
Groenenberg, J. E., Koopmans, G. F., and Comans, R. N. J. (2010). Uncertainty analysis of the nonideal competitive adsorption - Donnan model: effects of dissolved organic matter variability on predicted metal speciation in soil solution. Environ. Sci. Technol. 44, 1340. doi:10.1021/es902615w
Hashimoto, S., Carvalhais, N., Ito, A., Migliavacca, M., Nishina, K., and Reichstein, M. (2015). Global spatiotemporal distribution of soil respiration modeled using a global database. Biogeosciences 12, 4121–4132. doi:10.5194/bg-12-4121-2015
Jones, W. J., and Ananyeva, N. D. (2001). Correlations between pesticide transformation rate and microbial respiration activity in soil of different ecosystems. Biol. Fertil. Soils 33, 477. doi:10.1007/s003740100365
Keiblinger, K. M., Schneider, M., Gorfer, M., Paumann, M., Deltedesco, E., Berger, H., et al. (2018). Assessment of Cu applications in two contrasting soils—effects on soil microbial activity and the fungal community structure. Ecotoxicology 27, 217–233. doi:10.1007/s10646-017-1888-y
Khan, M., and Scullion, J. (2000). Effect of soil on microbial responses to metal contamination. Environ. Pollut. 110, 115. doi:10.1016/S0269-7491(99)00288-2
Komárek, M., Čadková, E., Chrastný, V., Bordas, F., and Bollinger, J.-C. (2010). Contamination of vineyard soils with fungicides: a review of environmental and toxicological aspects. Environ. Int. 36, 138. doi:10.1016/j.envint.2009.10.005
Kuijper, L. D. J., Berg, M. P., Morriën, E., Kooi, B. W., and Verhoef, H. A. (2005). Global change effects on a mechanistic decomposer food web model. Glob. Change Biol. 11, 249. doi:10.1111/j.1365-2486.2005.00898.x
Kumar, V., Kothiyal, N. C., and Saruchi, (2016). Analysis of polycyclic aromatic hydrocarbon, toxic equivalency factor and related carcinogenic potencies in roadside soil within a developing city of Northern India. Polycycl. Aromat. Compd. 36, 506. doi:10.1080/10406638.2015.1026999
Laurent, C., Bravin, M. N., Crouzet, O., Pelosi, C., Tillard, E., Lecomte, P., et al. (2020). Increased soil pH and dissolved organic matter after a decade of organic fertilizer application mitigates copper and zinc availability despite contamination. Sci. Total Environ. 709, 135927. doi:10.1016/j.scitotenv.2019.135927
Li, C., Frolking, S., and Frolking, T. A. (1992). A model of nitrous oxide evolution from soil driven by rainfall events: 1. Model structure and sensitivity. J. Geophys. Res. 97, 9759. doi:10.1029/92jd00509
Li, J., Ma, Y.-B., Hu, H.-W., Wang, J.-T., Liu, Y.-R., and He, J.-Z. (2015). Field-based evidence for consistent responses of bacterial communities to copper contamination in two contrasting agricultural soils. Front. Microbiol. 6, 1–12. doi:10.3389/fmicb.2015.00031
Li, J., Wang, J.-T., Hu, H.-W., Ma, Y.-B., Zhang, L.-M., and He, J.-Z. (2016). Copper pollution decreases the resistance of soil microbial community to subsequent dry-rewetting disturbance. J. Environ. Sci. 39, 155. doi:10.1016/j.jes.2015.10.009
Li, Y. T., Becquer, T., Quantin, C., Benedetti, M., Lavelle, P., and Jun, D. (2005). Microbial activity indices: sensitive soil quality indicators for trace metal stress. Pedosphere 15, 409–416. doi:10.1007/s11703-007-0049-0
Liang, C., and Balser, T. C. (2011). Microbial production of recalcitrant organic matter in global soils: implications for productivity and climate policy. Nat. Rev. Microbiol. 9, 75. doi:10.1038/nrmicro2386-c1
Liang, C., Schimel, J. P., and Jastrow, J. D. (2017). The importance of anabolism in microbial control over soil carbon storage. Nat. Microbiol. 2, 1–6. doi:10.1038/nmicrobiol.2017.105
Merrington, G., Rogers, S. L., and Van Zwieten, L. (2002). The potential impact of long-term copper fungicide usage on soil microbial biomass and microbial activity in an avocado orchard. Aust. J. Soil Res. 40, 749–759. doi:10.1071/SR01084
Mitchell, M., Muftakhidinov, B., Winchen, T., van Schaik, B., Wilms, A., Kylesower, , et al. (2019). Engauge digitizer software. Available at: http://markummitchell.github.io/engauge-digitizer.
Moore, J. C., Berlow, E. L., Coleman, D. C., De Suiter, P. C., Dong, Q., Hastings, A., et al. (2004). Detritus, trophic dynamics and biodiversity. Ecol. Lett. 7, 584. doi:10.1111/j.1461-0248.2004.00606.x
Moreno, J. L., Bastida, F., Ros, M., Hernández, T., and García, C. (2009). Soil organic carbon buffers heavy metal contamination on semiarid soils: effects of different metal threshold levels on soil microbial activity. Eur. J. Soil Biol. 45, 220–228. doi:10.1016/j.ejsobi.2009.02.004
Müller, T., and Höper, H. (2004). Soil organic matter turnover as a function of the soil clay content: consequences for model applications. Soil Biol. Biochem. 36, 877. doi:10.1016/j.soilbio.2003.12.015
Niklińska, M., Chodak, M., and Laskowski, R. (2006). Pollution-induced community tolerance of microorganisms from forest soil organic layers polluted with Zn or Cu. Appl. Soil Ecol. 32, 265–272. doi:10.1016/j.apsoil.2005.08.002
Odum, E. P. (1995). Expected Trends in stressed ecosystem. Bioscience 35, 419–422. doi:10.2307/1310021
Oorts, K., Bronckaers, H., and Smolders, E. (2006). Discrepancy of the microbial response to elevated copper between freshly spiked and long-term contaminated soils. Environ. Toxicol. Chem. 25, 845–853. doi:10.1897/04-673r.1
Panagos, P., Ballabio, C., Lugato, E., Jones, A., Borrelli, P., Scarpa, S., et al. (2018). Potential sources of anthropogenic copper inputs to European agricultural soils. Sustainability 10, 2380. doi:10.3390/su10072380
Pell, M., Stenström, J., and Granhall, U. (2006). Microbiological methods for assessing soil quality. Editors J. Bloem, D. W. Hopkins, and A. Benedetti (Wallingford, United Kingdom: CAB International), 307. doi:10.1079/9780851990989.0000
Philippot, L., Cregut, M., Chèneby, D., Bressan, M., Dequiet, S., Martin-Laurent, F., et al. (2008). Effect of primary mild stresses on resilience and resistance of the nitrate reducer community to a subsequent severe stress. FEMS Microbiol. Lett. 285, 51. doi:10.1111/j.1574-6968.2008.01210.x
Pietrzak, U., and McPhail, D. C. (2004). Copper accumulation, distribution and fractionation in vineyard soils of Victoria, Australia. Geoderma 122, 151. doi:10.1016/j.geoderma.2004.01.005
Pribyl, D. W. (2010). A critical review of the conventional SOC to SOM conversion factor. Geoderma 156, 75–83. doi:10.1016/j.geoderma.2010.02.003
Ramsey, P. W., Rillig, M. C., Feris, K. P., Moore, J. N., and Gannon, J. E. (2005). Mine waste contamination limits soil respiration rates: a case study using quantile regression. Soil Biol. Biochem. 37, 1177–1183. doi:10.1016/j.soilbio.2004.11.016
Ren, Z.-L., Tella, M., Bravin, M. N., Comans, R. N. J., Dai, J., Garnier, J.-M., et al. (2015). Effect of dissolved organic matter composition on metal speciation in soil solutions. Chem. Geol. 398, 61. doi:10.1016/j.chemgeo.2015.01.020
Rodríguez-Eugenio, N., McLaughlin, M., and Pennock, D. (2018). Soil pollution: a hidden reality. Rome,FAO, 142.
Romero-Freire, A., García Fernández, I., Simón Torres, M., Martínez Garzón, F. J., and Martín Peinado, F. J. (2016). Long-term toxicity assessment of soils in a recovered area affected by a mining spill. Environ. Pollut. 208, 553–561. doi:10.1016/j.envpol.2015.10.029
Rousk, J., Brookes, P. C., Bååth, E., Rousk, J., Brookes, P. C., and Bååth, E. (2009). Contrasting soil pH effects on fungal and bacterial growth suggest functional redundancy in carbon mineralization. Appl. Environ. Microbio. 75, 1589. doi:10.1128/AEM.02775-08
Rudolf Geiger, W. P. (1954). Eine neue wandkarte der klimagebiete der erde nach W. Köppens klassifikation (a new wall map of the climatic regions of the world according to W. Köppen’s classification). Erdkunde 8, 58–61. doi:10.3112/erdkunde.1954.01.04
Salminen, J., Liiri, M., and Haimi, J. (2002). Responses of microbial activity and decomposer organisms to contamination in microcosms containing coniferous forest soil. Ecotoxicol. Environ. Saf. 53, 93–103. doi:10.1006/eesa.2001.2215
Sauvé, S., Hendershot, W., and Herbert, E. A. (2000). Solid-solution partitioning of metals in contaminated soils: dependence on pH, total metal burden, and organic matter. Am. Chem. Soc. 34, 1125–1131. doi:10.1021/es9907764
Schlesinger, W. H., and Andrews, J. A. (2000). Soil respiration and the global carbon cycle. Biogeochemistry. 48, 7–20. doi:10.1023/A:1006247623877
Schmidt, M. W. I., Torn, M. S., Abiven, S., Dittmar, T., Guggenberger, G., Janssens, I. A., et al. (2011). Persistence of soil organic matter as an ecosystem property. Nature 478, 49. doi:10.1038/nature10386
Smolders, E., Oorts, K., Lombi, E., Schoeters, I., Ma, Y., Zrna, S., et al. (2012). The availability of copper in soils historically amended with sewage sludge, manure, and compost. J. Environ. Qual. 41, 506. doi:10.2134/jeq2011.0317
Smolders, E., Oorts, K., Van Sprang, P., Schoeters, I., Janssen, C. R., McGrath, S. P., et al. (2009). Toxicity of trace metals in soil as affected by soil type and aging after contamination: using calibrated bioavailability models to set ecological soil standards. Environ. Toxicol. Chem. 28, 1633. doi:10.1897/08-592.1
Soler-Rovira, P., Fernández-Calviño, D., Arias-Estévez, M., Plaza, C., and Polo, A. (2013). Respiration parameters determined by the ISO-17155 method as potential indicators of copper pollution in vineyard soils after long-term fungicide treatment. Sci. Total Environ. 447, 25–31. doi:10.1016/j.scitotenv.2012.12.077
Sorensen, L. H. (1981). Carbon-nitrogen relationships during the humification of cellulose in soils containing different amounts of clay. Soil Biol. Biochem. 13, 313–321. doi:10.1016/0038-0717(81)90068-7
Tobor-Kapłon, M. A., Bloem, J., and De Ruiter, P. C. (2006). Functional stability of microbial communities from long-term stressed soils to additional disturbance. Environ. Toxicol. Chem. 25, 1993–1999. doi:10.1897/05-398R1.1
Usman, A., Kuzyakov, Y., and Stahr, K. (2005). Effect of clay minerals on immobilization of heavy metals and microbial activity in a sewage wludge-contaminated soil. J. Soils Sediments 5, 245–252. doi:10.1065/jss2005.05.141
Venuti, A., Alfonsi, L., and Cavallo, A. (2016). Anthropogenic pollutants on top soils along a section of the Salaria state road, Central Italy. Ann. Geophys. 59, 11. doi:10.4401/ag-7021
Visser, S., and Parkinson, D. (1992). Soil biological criteria as indicators of soil quality: soil microorganisms. Am. J. Altern. Agric. 7, 33. doi:10.1017/S0889189300004434
Wakelin, S. A., Chu, G., Broos, K., Clarke, K. R., Liang, Y., and McLaughlin, M. J. (2010). Structural and functional response of soil microbiota to addition of plant substrate are moderated by soil Cu levels. Biol. Fertil. Soils 46, 333–342. doi:10.1007/s00374-009-0436-1
Wang, Q.-Y., Sun, J.-Y., Xu, X.-J., and Yu, H.-W. (2018). Integration of chemical and toxicological tools to assess the bioavailability of copper derived from different copper-based fungicides in soil. Ecotoxicol. Environ. Saf. 161, 662. doi:10.1016/j.ecoenv.2018.06.041
Wang, W. J., Dalal, R. C., Moody, P. W., and Smith, C. J. (2003). Relationships of soil respiration to microbial biomass, substrate availability and clay content. Soil Biol. Biochem. 35, 273–284. doi:10.1016/S0038-0717(02)00274-2
Wilson, B., and Pyatt, F. B. (2007). Heavy metal dispersion, persistance, and bioccumulation around an ancient copper mine situated in Anglesey, UK. Ecotoxicol. Environ. Saf. 66, 224. doi:10.1016/j.ecoenv.2006.02.015
Xu, M., and Shang, H. (2016). Contribution of soil respiration to the global carbon equation. J. Plant Physiol. 203, 16. doi:10.1016/j.jplph.2016.08.007
Keywords: basal respiration, ecotoxyicology, respiration quotient, climate change, statistical analysis, greenhouse gases
Citation: Sereni L, Guenet B and Lamy I (2021) Does Copper Contamination Affect Soil CO2 Emissions? A Literature Review. Front. Environ. Sci. 9:585677. doi: 10.3389/fenvs.2021.585677
Received: 21 July 2020; Accepted: 25 January 2021;
Published: 13 April 2021.
Edited by:
C. Marjorie Aelion, University of Massachusetts Amherst, United StatesReviewed by:
Michael Edward Deary, Northumbria University, United KingdomNadezhda Ananyeva, Institute of Physical-Chemical and Biological Problems in Soil Science (RAS), Russia
Copyright © 2021 Sereni, Guenet and Lamy. This is an open-access article distributed under the terms of the Creative Commons Attribution License (CC BY). The use, distribution or reproduction in other forums is permitted, provided the original author(s) and the copyright owner(s) are credited and that the original publication in this journal is cited, in accordance with accepted academic practice. No use, distribution or reproduction is permitted which does not comply with these terms.
*Correspondence: Laura Sereni, bGF1cmEuc2VyZW5pQGlucmFlLmZy