 Ke-Sheng Cheng
 Jia-Yi Ling1
 Teng-Wei Lin
- 1Department of Bioenvironmental Systems Engineering, National Taiwan University, Taipei, Taiwan
- 2Master Program in Statistics, National Taiwan University, Taipei, Taiwan
- 3Hydrotech Research Institute, National Taiwan University, Taipei, Taiwan
- 4Center for Southeast Asian Studies, Kyoto University, Kyoto, Japan
In numerous applications of land-use/land-cover (LULC) classification, the classification rules are determined using a set of training data; thus, the results are inherently affected by uncertainty in the selection of those data. Few studies have assessed the accuracy of LULC classification with this consideration. In this article, we provide a general expression of various measures of classification accuracy with regard to the sample data set for classifier training and the sample data set for the evaluation of the classification results. We conducted stochastic simulations for LULC classification of a two-feature two-class case and a three-feature four-class case to show the uncertainties in the training sample and reference sample confusion matrices. A bootstrap simulation approach for establishing the 95% confidence interval of the classifier global accuracy was proposed and validated through rigorous stochastic simulation. Moreover, theoretical relationships among the producer accuracy, user accuracy, and overall accuracy were derived. The results demonstrate that the sample size of class-specific training data and the a priori probabilities of individual LULC classes must be jointly considered to ensure the correct determination of LULC classification accuracy.
Introduction
Land-use/land-cover (LULC) classification using remote sensing images has been applied in numerous studies, including investigations involving environmental monitoring and change detection (Cheng et al., 2008; Chen et al., 2017), research on urbanization effects (Herold et al., 2002; Teng et al., 2008; Hung et al., 2010), and disaster mitigation (Zope et al., 2015; Yang et al., 2018). Results of LULC classification are critical for practical application of these studies. In supervised LULC classification using remote sensing images, a set of multi-class ground truth training samples is collected and used to establish the classification rules and multi-class boundaries in the feature space. These classification rules are then applied to an independent set of multi-class ground truth reference samples. Reference sample classification accuracy, comprising the producer accuracy (PA) and user accuracy (UA) for individual classes and overall accuracy (OA), is then summarized in a confusion or error matrix that is used to assess the classification accuracy and classifier performance (Congalton et al., 1983; Stehman, 1997a). Stehman and Czaplewski (1998) proposed that thematic maps constructed from remote sensing data should be subjected to a statistically rigorous accuracy assessment. In particular, the a priori probabilities (i.e., inclusion probabilities) of individual land-cover types must be considered.
A core assumption in classification accuracy analysis is that the confusion matrix is truly representative of the classification results of the entire study area. Several factors in the LULC classification process can affect the classification accuracies presented in a confusion matrix. These include errors in georeferencing, ground truth data collection, and errors involving classifiers, classification schemes, spatial autocorrelation modeling, sample size, and sampling schemes (Congalton, 1991; Hammond and Verbyla, 1996). Class-specific PA and UA values (or, correspondingly, omission and commission errors) summarized in a confusion matrix can be regarded as sample accuracy, and these values are only estimates of the true and yet unknown global accuracy (or population accuracy) concerning the entire study area (Hay, 1988; Stehman and Czaplewski, 1998). These accuracies or errors are inherently associated with uncertainty because of the uncertainty in the selection of the training and reference samples (Weber and Langille, 2007). Variance approximation and standard error formulas of classification accuracy estimates have been developed for quantifying this uncertainty (Czaplewski, 1994; Stehman, 1997b). Bootstrap resampling, a nonparametric approach, has been used to generate large sets of confusion matrices and assign confidence intervals for assessing the uncertainty of various measures of classification accuracy (Steele et al., 1998; Weber and Langille, 2007; Champagne et al., 2014; Hsiao and Cheng, 2016; Lyons et al., 2018).
In numerous studies, classification accuracy assessments were conducted using a classifier training data set (Franklin and Wilson, 1992; Bauer et al., 1994; Nageswara Rao and Mohankumar, 1994; Hammond and Verbyla, 1996; Hung et al., 2010; Hsiao and Cheng, 2016). Researchers have argued that using the same data set in training and validation can result in the overestimation of classification accuracy (Congalton, 1991; Hammond and Verbyla, 1996). In this study, the confusion matrix created using the same data set for training and validation is referred to as the training sample confusion matrix, and the confusion matrix constructed using an independent data set of reference samples is called the reference sample confusion matrix. Although assessing the reference sample confusion matrix has become common practice in the evaluation of LULC classification results, the PA and UA presented in this matrix are contingent on the training samples with regard to the classification rules established in the training stage. In numerous applications of LULC classification, the classification results are inherently affected by the uncertainty in the selection of a training data set used to determine the classification rules. Thus, for a thorough assessment of classification accuracy, researchers must consider the uncertainty in training data selection. To our knowledge, few researchers (Champagne et al., 2014; Hsiao and Cheng, 2016; Lyons et al., 2018) have conducted assessments of LULC classification accuracy with this consideration in mind. Thus, it is imperative for the remote sensing community to address two key issues: 1) a systematic expression of the relationship between the sample estimate of classification accuracy and the theoretical global accuracy, taking into account uncertainty in the selection of the training and reference data; and 2) a quantitative expression of uncertainty in LULC classification accuracy. Therefore, the study objectives are threefold: 1) to investigate the effect of training and reference data selection on classification accuracy, 2) to provide a theoretical expression of the relationship between the sample accuracy and the theoretical global accuracy, and 3) to propose an approach for quantitatively assessing the uncertainty in LULC classification results. Specifically, we performed a stochastic simulation of multi-class multivariate Gaussian distributions and conducted LULC classification using simulated samples to examine the proposed approach and identify essential concepts.
Methodology
Thoughts and the Theoretical Basis
As mentioned in Introduction, PA, UA, and overall accuracy of a reference sample confusion matrix constitute estimates of the true and yet unknown global accuracy. However, what exactly the global accuracy represents has not been clearly defined, and the following explanations are given to provide context for the subsequent analysis and discussion. In accordance with terms that are commonly used in numerous remote sensing studies, map class refers to the LULC class assigned by the classifier, whereas reference class refers to the ground truth class.
In a k-class LULC classification problem, the totality of pixels within the study area forms a finite population, and all pixels within a specific LULC class represent its subpopulation. The term population confusion matrix (or population error matrix; Table 1) was coined (Stehman, 1995; Stehman, 2009) to represent the LULC classification results of the entire study area when the true land-cover identities of all individual pixels are known. In Table 1, N represents the total number of pixels in the entire study area, and Nij represents the number of pixels of map class i and reference class j. The column sum N+i is the total number of pixels in the entire study area that truly belong to class i. The row sum Ni+ represents the total number of pixels in the entire study area assigned to class i. Three population accuracy measures, namely, PA (Pp), UA (Pu), and overall accuracy (Po), can then be expressed as follows:
The a priori probabilities, that is, the area proportions of individual LULC classes, are expressed as follows:
These population accuracy measures are unknown and, in most cases, are estimated using the reference sample accuracy. Table 2 shows a reference sample confusion matrix that summarizes the LULC classification results of a reference sample data set. Similarly, nij represents the number of pixels of map class i and reference class j in the reference sample. In numerous applications of LULC classification, the PA, UA, and overall accuracy of the sample are calculated using the following equations:
Supervised LULC classification consists of a training stage and a performance evaluation or validation stage, and a confusion matrix is constructed and used for accuracy assessment. To better define classification accuracy under different situations, we devised the following general expression for various measures of LULC classification accuracy.
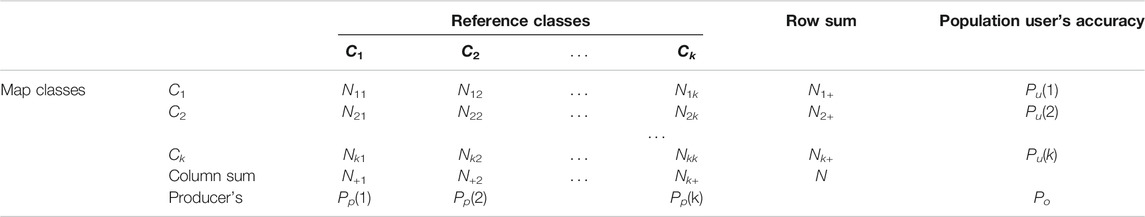
TABLE 1. Population confusion matrix for k-class land-use/land-cover classification using classification rules established by a training data set.
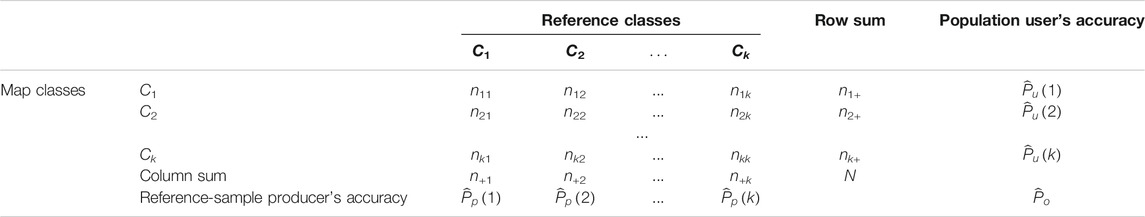
TABLE 2. Reference sample confusion matrix for k-class land-use/land-cover classification using classification rules established using a training data set.
Let Ω represent the set of all pixels in the study area (i.e., the global data set), and let ST and SR, two independent data sets of known ground truth LULC classes, represent the training and reference samples, respectively.
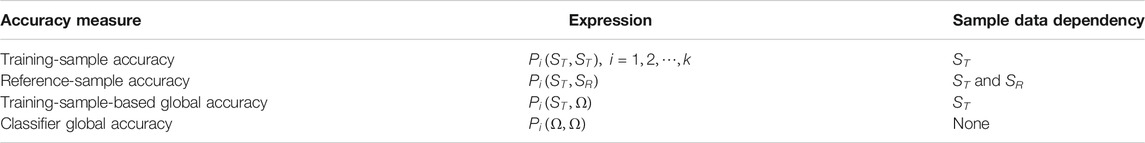
TABLE 3. Measures of land-use/land-cover classification accuracy and their data dependencies.
The training sample–based global accuracy, equivalent to the accuracy measures presented in Table 1, represents the classification accuracy of the thematic map. The training sample accuracy, reference sample accuracy, and training sample–based global accuracy are all dependent on the training data set. Thus, conclusions on accuracy assessment using these measures are susceptible to training data uncertainty. By contrast, the classifier global accuracy represents the accuracy achieved by using the population (i.e., the global data set) to establish the classification rules, and thus, it is only dependent on the classifier used for LULC classification. The global accuracy (be it PA, UA, or overall accuracy) of a specific classifier has a unique and theoretical value. The global accuracy, be it the training sample–based global accuracy or the classifier global accuracy, is unknown and can only be estimated by using the confusion matrix of the LULC classification results. For the convenience of discussion, only the PA is considered in this study, but the same specifications and simulations also apply to UA and overall accuracy. The classifier global accuracy provides an objective measure for comparing the performance of different classifiers.
The practical question is what the end users of land-cover maps wish to learn from LULC-based thematic maps. Users may be interested in the classification accuracy or the uncertainty of the classification results. Classification accuracy and uncertainty are different concepts; classification accuracy is defined as the degree to which the thematic map corresponds to the reference classification, whereas the uncertainty associated with the estimator of a classification measure is defined as the variability of that estimator over the set of all possible samples (Olofsson et al., 2013). Moreover, the PA and UA presented in a reference sample confusion matrix are contingent on land-cover classes. In a local-scale evaluation of LULC classification results, pixel-specific classification accuracy is desired. Spatial interpolation techniques in both geographic and feature spaces of pixel-specific classification accuracy or posterior class probability have been developed (Steele et al., 1998; Chiang et al., 2014; Khatami et al., 2017). Users may also be interested in knowing the uncertainty of pixel-specific classification results. By applying LULC classification to bootstrap samples of remote sensing data, uncertainty in class assignment can be evaluated using the class probability vector or the entropy of the class composition of individual pixels (Hsiao and Cheng, 2016).
Most studies assessing the accuracy and uncertainty of LULC classification results have used the reference sample confusion matrix to estimate the training sample–based global accuracy (i.e., the accuracies in Table 1) by using the reference sample classification accuracy (i.e., the accuracies in Table 2). However, the target accuracy, that is,
To demonstrate the usefulness and advantages of using the classifier’s global accuracy to assess the LULC classification results, we conducted rigorous stochastic simulations of multi-class multivariate Gaussian distributions to mimic an LULC classification. We then compared three evaluation approaches. The details of the simulations and related approaches are described as follows:
Consider a situation in which k land-cover types
Approach I: Reference Sample–Based Evaluation Approach
Approach I is the commonly adopted method for assessment of the LULC classification accuracy using the reference sample. Upon the completion of an LULC classification using a particular sample data set (e.g.,
Using a large number of reference samples
In most cases, the number of reference samples in the LULC classification is limited. Therefore, conducting a meaningful evaluation of the classification results is challenging when only one or a few sets of reference samples are used. Eq. 9 shows that this approach, at its best, can only provide a good estimate of the producer’s global accuracy,
Approach II: Training Sample–Based Evaluation Approach
If each of the sample data sets
Assume that all possible samples of a fixed sample size (i.e., the ensemble of samples) are available. As the number of training samples increases, the mean of the training sample accuracy approaches the classifier global accuracy:
This equation indicates that the ensemble mean
Approach III: Bootstrap Sample–Based Evaluation Approach
Both approaches I and II are susceptible to training data uncertainty. Approach III estimates the classifier global accuracy by assigning a confidence interval of the classifier global accuracy. This is achieved by bootstrap resampling from the only training sample set.
Given a training data set
Let
Notably, as the number of bootstrap samples increases, the mean bootstrap sample accuracy approaches the training sample accuracy (Hsiao, 2013):
The combination of Eqs. 11, 13 yields the following:
If only one training sample set is available (m = 1), the mean and sample quantile range
Stochastic Simulation of LULC Classification
Consider a special case of LULC classification with two land-cover classes (C1 and C2) and two classification features (X1 and X2). For each land-cover class, the two classification features form a bivariate Gaussian distribution. The mean vector, the covariance matrix of classification features, and the a priori probabilities of C1 and C2 are listed in Table 4. The two classification features are negatively correlated
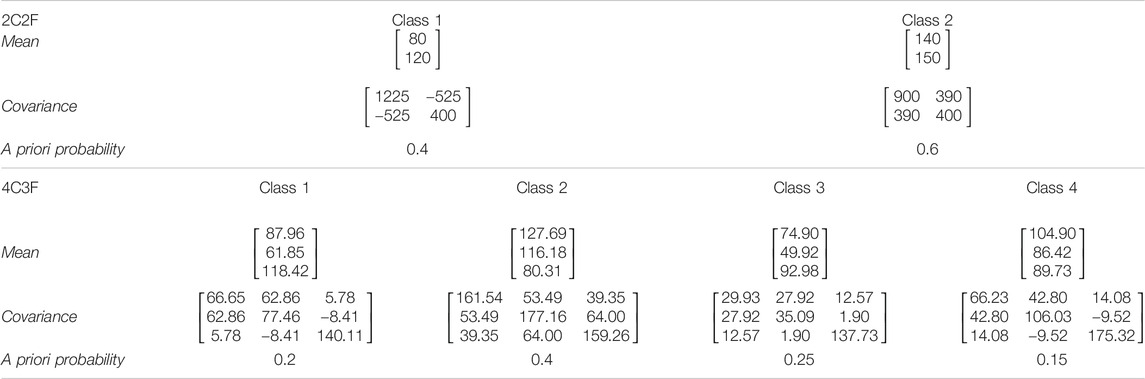
TABLE 4. Parameters of the multivariate Gaussian distributions of individual classes in the two-class, two-feature (2C2F) case and the four-class, three-feature (4C3F) case.
In k-class p-feature LULC classification using multispectral remote sensing images, a pixel can be characterized by a feature vector,
where
where
The simulation settings and details of the three evaluation approaches are described as follows.
Simulation Setting for Calculation of the Classifier Global Accuracy
The classifier global accuracies of C1 and C2 cannot be analytically derived. Thus, we simulated one large sample data set
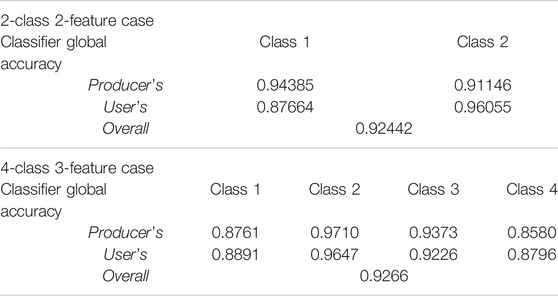
TABLE 5. Classifier global accuracies of individual classes achieved by using the Bayes classifier in the two-class, two-feature (2C2F) case and the four-class, three-feature (4C3F) case.
SIM-1.
SIM-2.
SIM-3.
Simulation Setting for Approach I
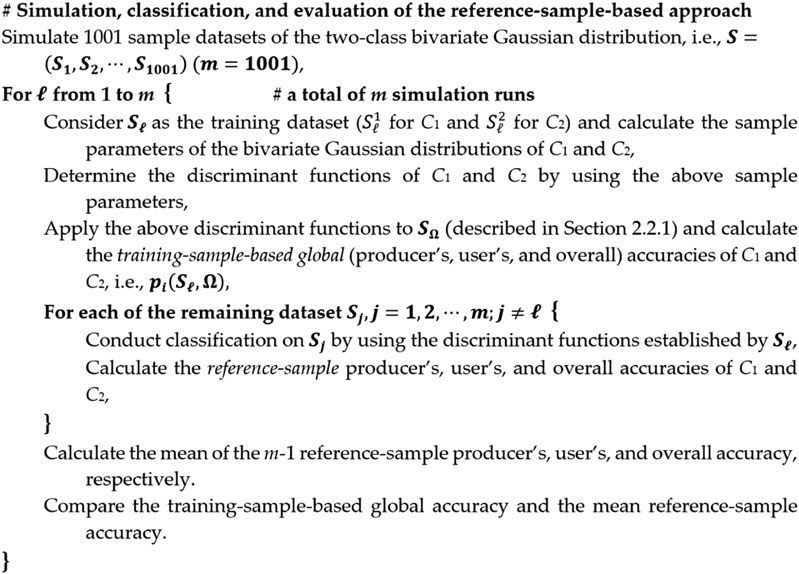
Using the parameters shown in Table 4, we generated 1,001 sample data sets
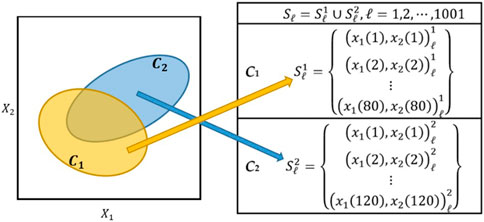
FIGURE 1. Conceptual illustrations of a two-class bivariate Gaussian distribution and simulated sample data sets. Each sample data set consists of 80 data points from C1 and 120 data points from C2.
Simulation Setting for Approach II
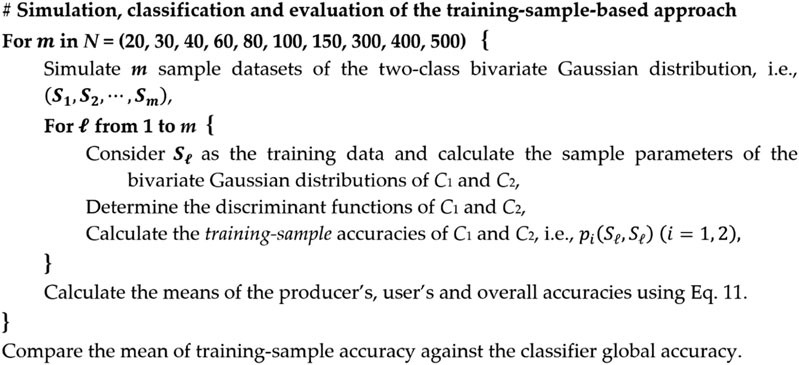
Similar to that for approach I, in the simulation setting for approach II, a sample data set comprised 200 data points, 80 and 120 from C1 and C2, respectively. Each data set was used as the training sample, and each yielded one training sample confusion matrix. Under this approach, m sample data sets were independently generated, and the mean of the training sample accuracies was calculated from m sets of training sample confusion matrices. To evaluate the statistical property regarding the training sample classification accuracy (Eq. 11), we considered various numbers of sample data sets
Simulation Setting for Approach III
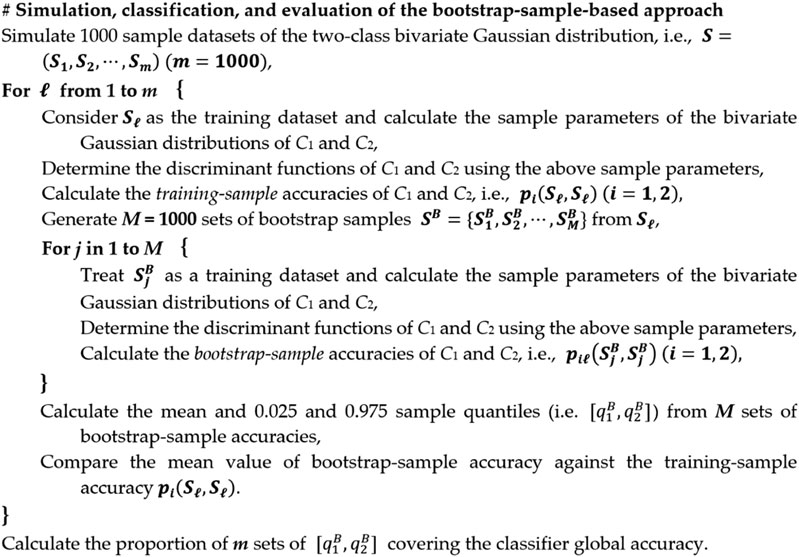
The objective of this approach is to demonstrate that a 95% confidence interval of the classifier global accuracy can be established by using bootstrap samples. We first generated a training data set from the two-class bivariate Gaussian distribution. Next, we generated 1,000 sets of bootstrap samples, with each set used as a training data set for LULC classification, and this approach yielded a bootstrap sample confusion matrix (1,000 in total). We then established a training data–dependent confidence interval of the classifier global accuracy by using the 0.025 and 0.975 sample quantiles. These procedures were performed 1,000 times to obtain 1,000 confidence intervals. Finally, we evaluated the proportion of the confidence intervals bounding the classifier global accuracy. Details of the simulation are presented in flowchart SIM‐3.
Detailed procedures for the application of the bootstrap resampling technique related to the LULC classification of remote sensing images are provided in the Supplementary Appendix.
Results and Discussion
The three evaluation approaches and the asymptotic properties of the reference sample, training sample, and bootstrap sample accuracies described in Methodology were validated using the simulated LULC classification results. For the convenience of explanation, a number affixed to PA and UA indicates the LULC class. For example, PA1 represents the PA of C1.
Evaluation of Reference Sample Classification Accuracy
Given one set of training samples (i.e., one simulation run of approach I), 1,000 sets of reference samples were classified using the class-specific discriminant functions established by the given training sample set. Figure 2 presents histograms of different reference sample classification accuracies (i.e., PA1, PA2, UA1, UA2, and OA) for one set of training samples. The reference sample classification accuracies varied relatively widely. For example, the reference sample PA of C1 varied between 0.8 and 1.0, and the reference sample OA varied between 0.86 and 0.98. This demonstrates that the conventional approach of evaluating LULC classification results by using only one set of reference samples involves a high degree of reference sample uncertainty. The figure also shows that the mean of the 1,000 reference sample accuracies was nearly the same as the global accuracy achieved by using the training sample (indicated by the black dashed line and the blue line, respectively), but that it differs from the classifier global accuracy (red line).
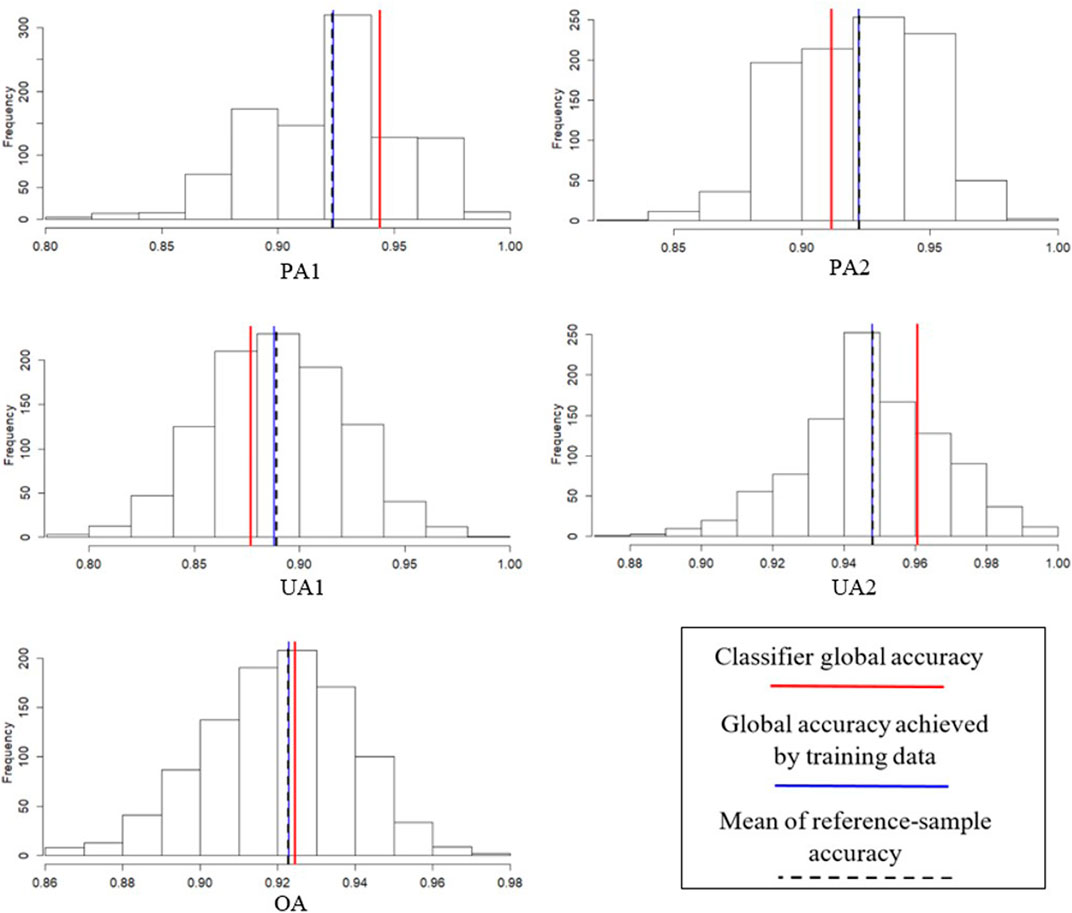
FIGURE 2. Histograms of different reference sample accuracies (based on 1,000 sets of reference samples) with respect to a given training sample.
Each of the 1,000 sets of training samples generated in our simulation corresponded to one set of training sample–based global accuracies and 1,000 sets of reference sample accuracies. Figure 3 presents a comparison of the mean reference sample accuracy, training sample–based global accuracy, and classifier global accuracy for 100 sets of training samples (runs 501–600). Regardless of the training data sets, the mean reference sample accuracy (red dashed line) remained nearly equal to the training sample–based global accuracy (blue line). However, overall, their values were not close to the classifier global accuracy (dark green line). Because all the sample data sets were independently generated from the same two-class bivariate Gaussian distribution, the results of other simulation runs were similar. In sum, the results invalidate the use of only one set of reference samples for evaluating LULC classification results.
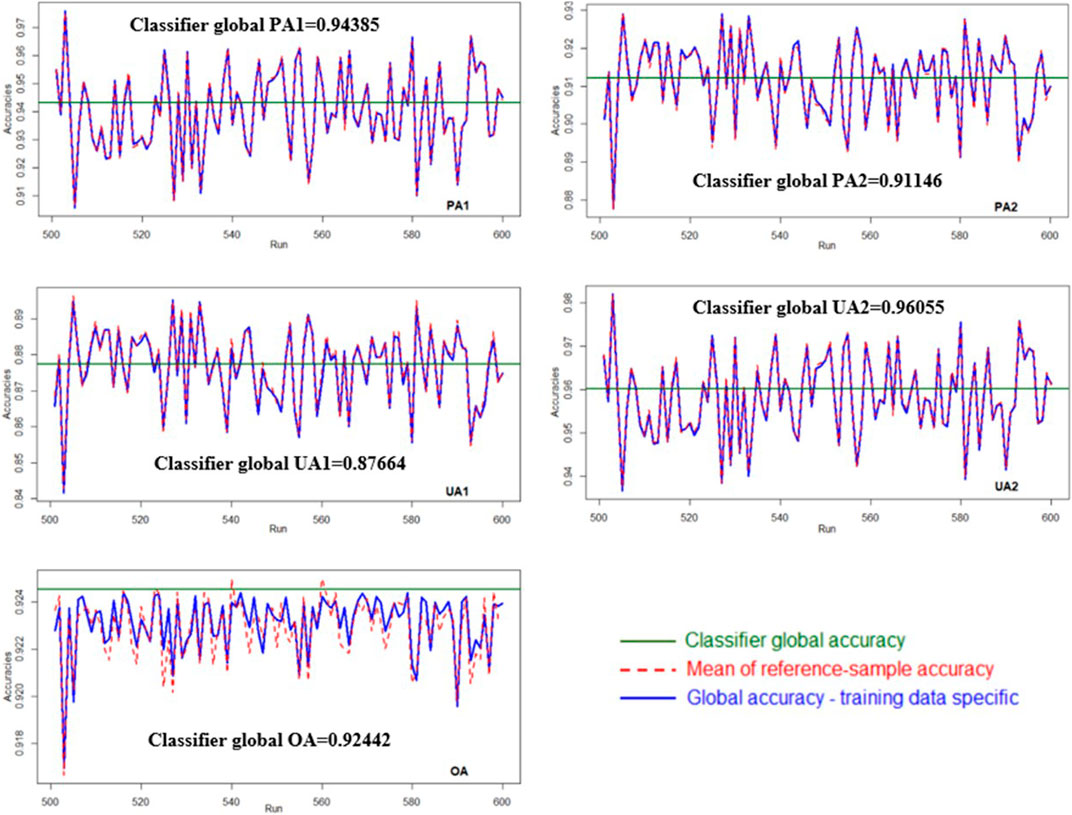
FIGURE 3. Comparison of the mean reference sample accuracy, training sample–based global accuracy, and classifier global accuracy. Each run corresponds to one set of training sample and 1,000 sets of reference samples.
Evaluation of Training Sample Classification Accuracy
Figure 4 shows the theoretical and training sample–dependent decision boundaries as well as the isoprobability contours of the bivariate Gaussian distribution of C1 and C2. Uncertainty in decision boundaries attributable to training data uncertainty was observable. Given the parameters shown in Table 4, the Bayes classifier involves a unique set of theoretical decision boundaries, as shown in Figure 4D. However, in an actual LULC classification, the parameters of the two-class bivariate Gaussian distribution are unknown and can only be estimated from the training sample. Thus, the decision boundaries and classification accuracies vary with training samples (Figures 4A–C). Figure 5 shows histograms of different training sample accuracies (PA1, PA2, UA1, UA2, and OA), which were based on 100 sets of training samples and mostly varied between 0.8 and 1.0. This demonstrates the effect of training data uncertainty on the LULC classification accuracies.
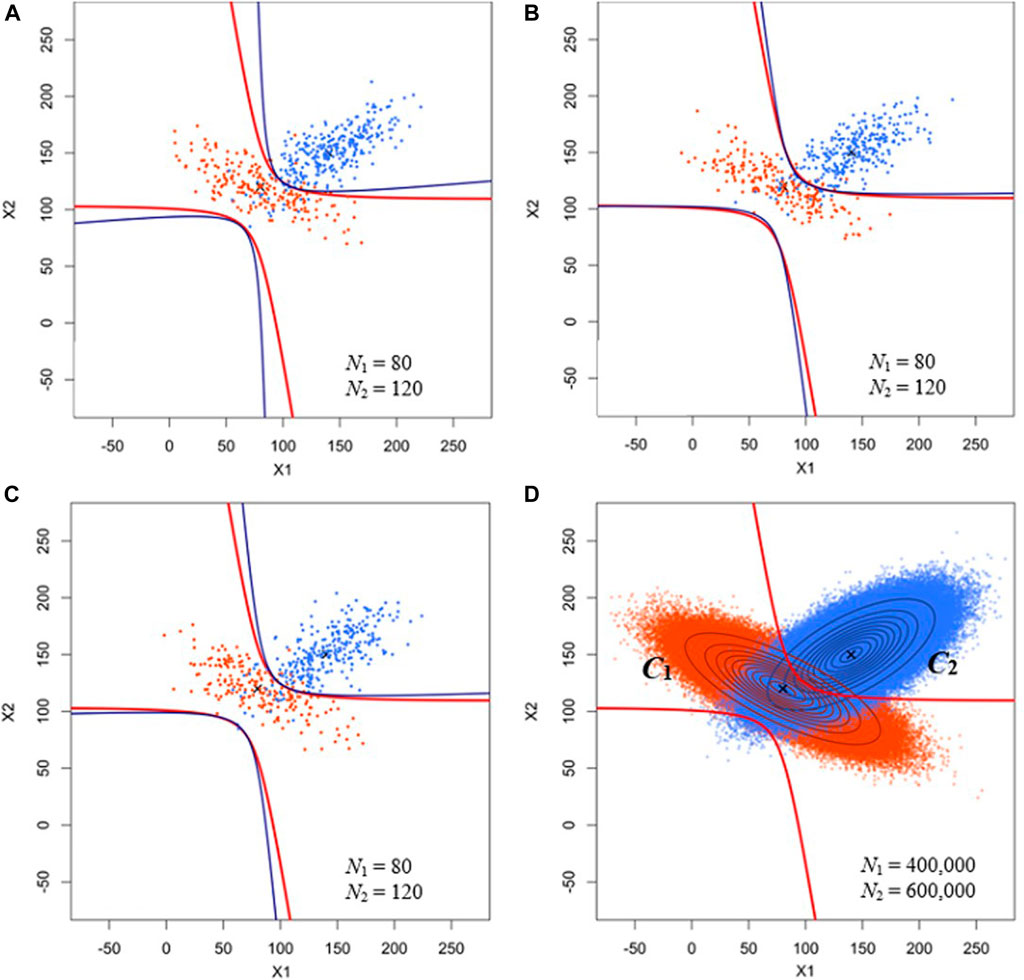
FIGURE 4. (A–C) Training samples and training sample–dependent decision boundaries. (D) Theoretical decision boundary and isoprobability contours of the bivariate Gaussian distribution of C1 and C2. Blue and red parabolic curves represent the training sample–dependent and theoretical decision boundaries, respectively. N1: number of training data points of C1; N2: number of training data points of C2.
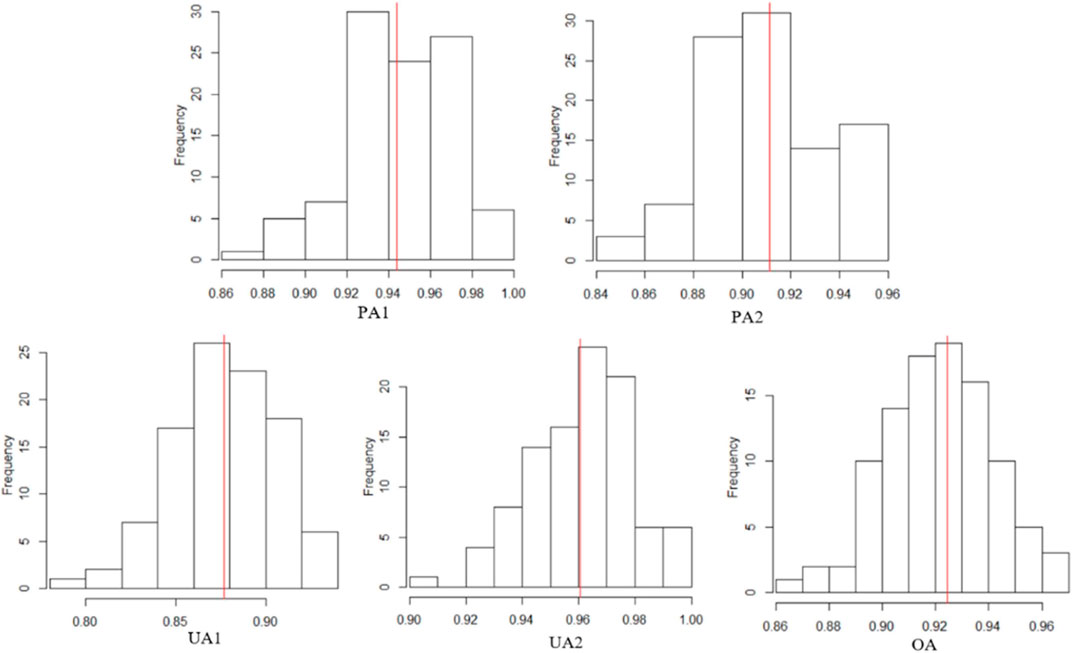
FIGURE 5. Histograms of different training sample accuracies based on 100 sets of training samples. The red vertical lines mark the classifier global accuracies.
We further investigated the asymptotic property related to the mean training sample classification accuracies. As the number of training data sets increased, the mean of training sample accuracy approached the classifier global accuracy (Figure 6). This demonstrates that the training sample accuracy is an unbiased estimator of the classifier global accuracy. By contrast, the mean reference sample accuracy approached the training sample–based global accuracy, but not the classifier global accuracy (Figure 3).
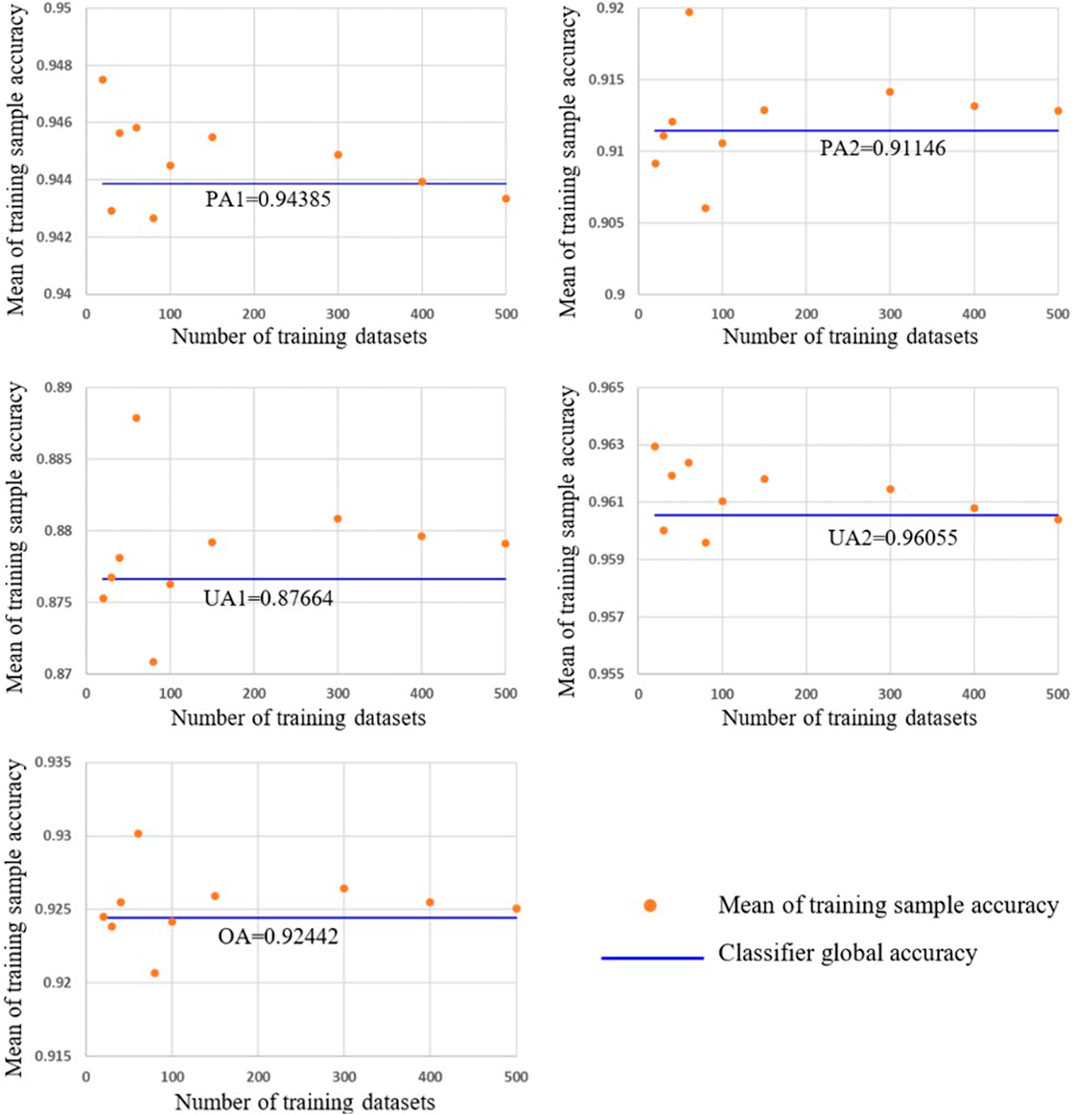
FIGURE 6. Asymptotic behavior of the mean training sample classification accuracies. The mean training sample accuracies were calculated based on 20, 30, 40, 60, 80, 100, 150, 300, 400, and 500 sets of training samples. Each training sample set is composed of 80 and 120 data points from C1 and C2, respectively.
Evaluation of Bootstrap Sample Classification Accuracy
We generated 1,000 sets of training samples from the two-class bivariate Gaussian distribution. Next, for each training sample set, 1,000 bootstrap samples were generated and used to establish the 95% confidence intervals of various accuracy measures. We then evaluated the proportions of these confidence intervals that covered the classifier global accuracies. Figure 7 shows the 95% bootstrap confidence intervals and the mean bootstrap sample accuracies for 100 sets of training samples (runs 301–400). In each training sample set, the mean of 1,000 bootstrap sample accuracies decreased very close to the training sample accuracy. The classifier global accuracy coverage probabilities of the bootstrap confidence intervals were 0.977, 0.945, 0.947, 0.977, and 0.953 for PA1, PA2, UA1, UA2, and OA, respectively. These probabilities were slightly higher than 0.95 (for PA1 and UA2) or nearly equal to 0.95 (for PA2, UA1, and OA), indicating that the bootstrap confidence interval was effective in evaluating the classification accuracy.
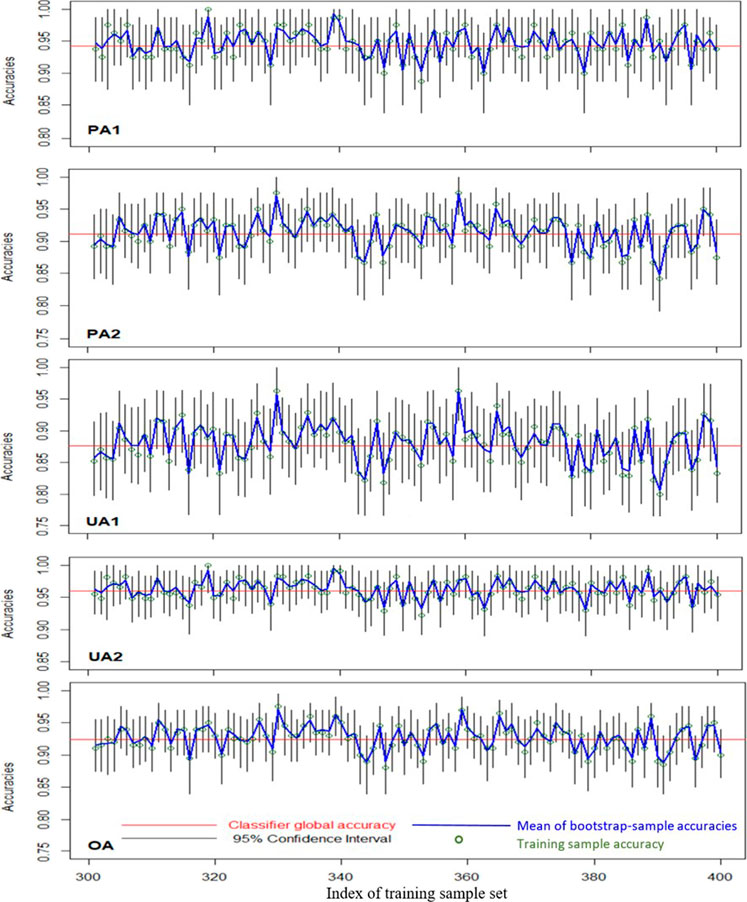
FIGURE 7. Illustration of 95% bootstrap confidence intervals of different accuracy measures (2C2F case).
Further Validation of the Bootstrap Confidence Interval Using a 4C3F Case
To demonstrate the effectiveness of the proposed bootstrap sample–based evaluation approach in more complex applications of LULC classifications, we conducted a similar stochastic simulation for a 4C3F LULC classification case, assuming that the three classification features of individual land-cover classes formed a trivariate Gaussian distribution. The mean vector and the covariance matrix of the classification features of individual land-cover classes are listed in Table 4. These parameters were selected according to the characteristics of different types of land cover (grass, built land, woods, and soil) discussed in a previous study (Fan, 2016). The a priori probabilities of the individual land-cover classes (classes 1–4) were 0.2, 0.4, 0.25, and 0.15, respectively. A sample data set of 1,000,000 data points was generated and used for an accurate estimation of the classifier global accuracies. We also generated 1,000 sample data sets, containing 400 data points each, that were then used as the training data sets. For each training data set, 1,000 sets of bootstrap samples were generated. Following the same procedures described in Simulation Setting for Approach III, we calculated the mean bootstrap sample accuracies and established 1,000 sets of 95% bootstrap confidence intervals.
The classifier global accuracies (PA, UA, and OA) obtained using 1,000,000 sample points are shown in Table 5. The 95% bootstrap confidence intervals of the classifier global accuracy and the mean bootstrap sample accuracies for 100 sets of training samples (runs 301–400) for the 4C3F case are shown in Figure 8. In each training data set, the mean of 1,000 bootstrap sample accuracies was very close to the training sample accuracy. The classifier-global-accuracy coverage probabilities of the bootstrap confidence intervals were 0.96, 0.976, 0.949, 0.955, 0.958, 0.955, 0.963, 0.958, and 0.936 for PA1, PA2, PA3, PA4, UA1, UA2, UA3, UA4, and OA, respectively. These results demonstrate that the bootstrap sample–based evaluation method and the 95% bootstrap confidence intervals of different measures of classification accuracy can be applied as general approaches.
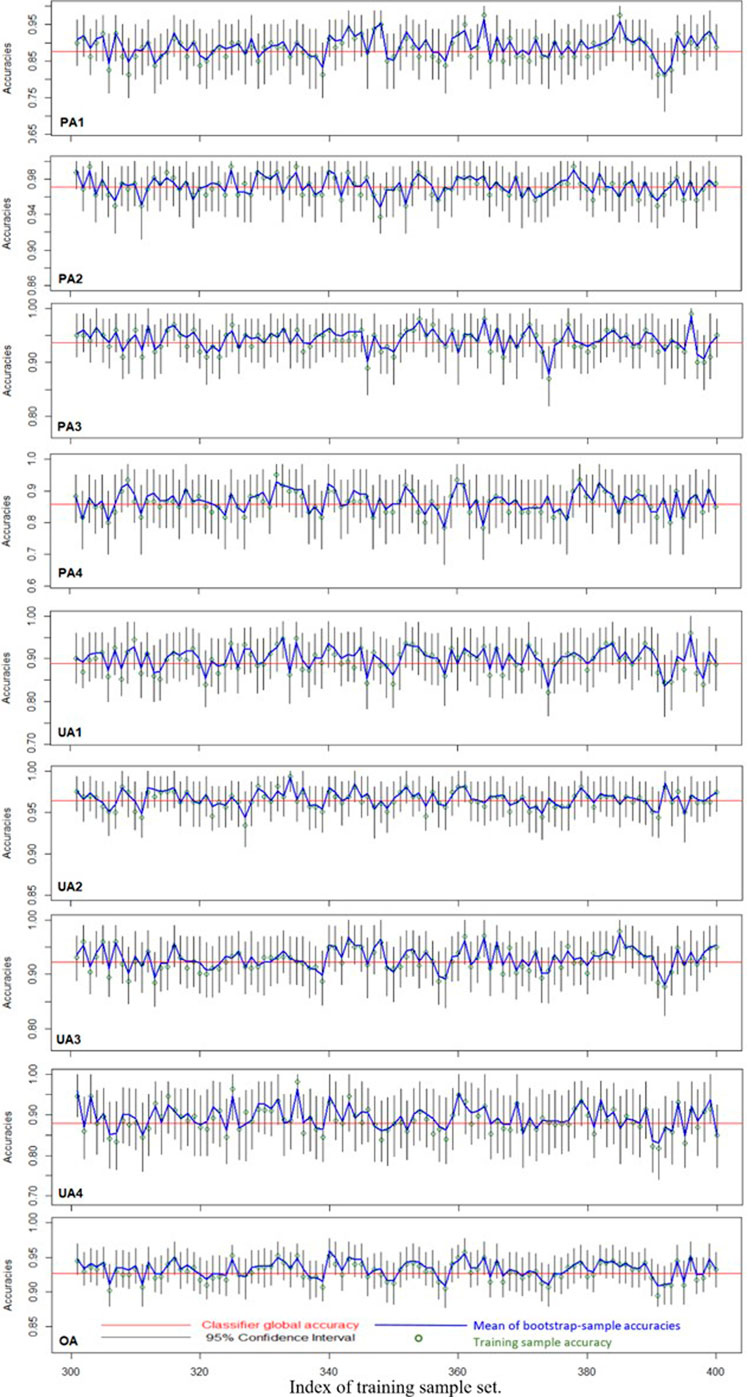
FIGURE 8. Illustration of 95% bootstrap confidence intervals of different accuracy measures (4C3F case).
Training Sample Confusion Matrix: A Closer Look
The evaluations discussed thus far indicate that the training sample accuracies (i.e., the accuracies presented in the training sample confusion matrix) were unbiased point estimators of their corresponding classifier global accuracies, whereas the reference sample accuracies were affected by uncertainty in the training data. The key statistical properties of the training sample confusion matrix are further discussed as follows.
Table 6 presents a training sample confusion matrix generated in the LULC classification involving k classes. Percentages of class-specific training data assigned to individual LULC classes, rather than the number of training data points classified into individual LULC classes, are shown, and
where
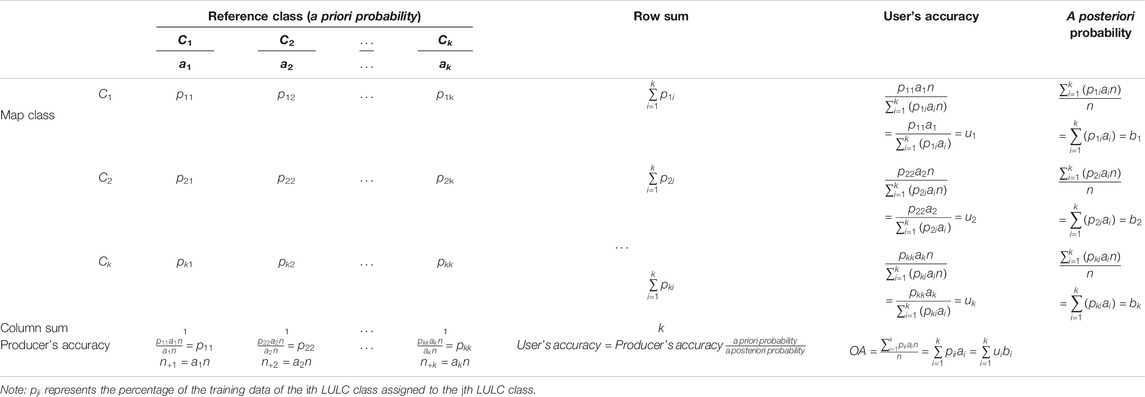
TABLE 6. Training sample confusion matrix for k-class land-use/land-cover (LULC) classification.
The calculation of PA can be perceived as parameter estimation using the training sample. As long as the sample size (i.e., the number of training data points) of individual LULC classes is sufficiently large, the class-specific PAs achieved using the training data can be expected to be close to the global PAs of their corresponding classifier. This is true even if the training sample size of individual LULC classes is not proportional to their a priori probabilities. Because the PA of a specific LULC class does not depend on the methods by which the training data of other LULC classes are classified, the class-specific PA varies only slightly when the training sample size is large. By contrast, the UAs are affected by the proportions of training data of individual LULC classes. Table 7 demonstrates that UA of a certain LULC class can be largely increased or decreased by changing the proportions of class-specific training data. Thus, taking into account the a priori probabilities of individual LULC classes in the calculation of the UAs is essential.

TABLE 7. Example of changes in user accuracy (UA) caused by changes in the percentage proportions (a priori probabilities) of class-specific training data (cases 1 and 2).
Summary and Conclusion
In this article, we present new concepts of LULC classification accuracies, namely, the training sample–based global accuracy and the classifier global accuracy, as well as a general expression of various measures of classification accuracy that were based on the sample data sets used for classifier training and evaluation of the classification results. To demonstrate the uncertainties of different measures of LULC classification accuracies, we conducted stochastic simulations for a 2C2F case and a 4C3F case of LULC classification. Moreover, a bootstrap simulation approach for establishing 95% confidence intervals of classifier global accuracies was proposed. The conclusions are as follows:
(1) The classifier global accuracy, which represents the accuracy that can be achieved by using the population to establish the classification rules, is not affected by uncertainties in training or reference data, and should thus be regarded as the standard estimation target in LULC classification.
(2) The reference sample classification accuracy, which is commonly used, is susceptible to uncertainties in the training and reference data and at best can only provide a good estimate of the global accuracy achieved by using a specific training data set.
(3) The training sample accuracy is an unbiased estimator of the classifier global accuracy. By contrast, the mean reference sample accuracy approaches the training sample–based global accuracy, but not the classifier global accuracy. Thus, the training sample confusion matrix should replace the commonly used reference sample confusion matrix in the evaluation of LULC classification results.
(4) Rigorous stochastic simulations demonstrated the practical applicability of the proposed bootstrapping approach to the establishment of confidence intervals of LULC classification accuracies. We recommend using at least 100 bootstrap samples in constructing 95% bootstrap confidence intervals of classifier global accuracies.
(5) Class-specific PAs vary only slightly for large training data sets. By contrast, UAs are affected by the proportions of the training data of individual LULC classes. Thus, considering the a priori probabilities of individual LULC classes in the calculation of the UA is crucial.
Data Availability Statement
The original contributions presented in the study are included in the article/Supplementary Material further inquiries can be directed to the corresponding author.
Author Contributions
KC and YK: conceived and designed the study objectives and methodology. JL, TL, YL, and YS: performed coding with R software and conducted the simulation and analysis. KC: performed the review analysis and was responsible for project administration and manuscript writing.
Funding
This study was supported by the Taiwan Ministry of Science and Technology under grant number MOST-104-2918-I-002-013.
Conflict of Interest
The authors declare that the research was conducted in the absence of any commercial or financial relationships that could be construed as a potential conflict of interest
Acknowledgments
We acknowledge the financial support of the Taiwan Ministry of Science and Technology through a project grant (MOST-104-2918-I-002-013). The corresponding author thanks the staff members at the Center for Southeast Asian Studies of Kyoto University, Japan, for hosting his sabbatical leave and providing an excellent research environment and facilities. This work is an extension of an article presented at the International Society for Photogrammetry and Remote Sensing Geospatial Week 2019 (Cheng et al., 2019).
Supplementary Material
The Supplementary Material for this article can be found online at: https://www.frontiersin.org/articles/10.3389/fenvs.2021.628214/full#supplementary-material
Abbreviations
LULC, land use/land cover; PA, producer’s accuracy; UA, user’s accuracy; OA, overall accuracy.
References
Bauer, M. E., Burk, T. E., Ek, A. R., Coppin, P. R., Lime, S. D., Walsh, T. A., et al. (1994). Satellite inventory of Minnesota forest resources. Photogrammetric Eng. Remote Sensing 60, 287–298.
Champagne, C., McNairn, H., Daneshfar, B., and Shang, J. (2014). A bootstrap method for assessing classification accuracy and confidence for agricultural land use mapping in Canada. Int. J. Appl. Earth Observation Geoinformation 29, 44–52. doi:10.1016/j.jag.2013.12.016
Chen, Y.-C., Chiu, H.-W., Su, Y.-F., Wu, Y.-C., and Cheng, K.-S. (2017). Does urbanization increase diurnal land surface temperature variation? Evidence and implications. Landscape Urban Plann. 157, 247–258. doi:10.1016/j.landurbplan.2016.06.014
Cheng, K.-S., Su, Y.-F., Kuo, F.-T., Hung, W.-C., and Chiang, J.-L. (2008). Assessing the effect of landcover changes on air temperature using remote sensing images-A pilot study in northern Taiwan. Landscape Urban Plann. 85, 85–96. doi:10.1016/j.landurbplan.2007.09.014
Cheng, K. S., Ling, J. Y., Lin, T. W., Liu, Y. T., Shen, Y. C., and Kono, Y. (2019). A new thinking of LULC classification accuracy assessment. Int. Arch. Photogramm. Remote Sens. Spat. Inf. Sci. XLII-2/W13, 1207–1211. doi:10.5194/isprs-archives-XLII-2-W13-1207-2019
Chiang, J.-L., Liou, J.-J., Wei, C., and Cheng, K.-S. (2014). A feature-space indicator kriging approach for remote sensing image classification. IEEE Trans. Geosci. Remote Sensing. 52, 4046–4055. doi:10.1109/tgrs.2013.2279118
Congalton, R. G. (1991). A review of assessing the accuracy of classifications of remotely sensed data. Remote Sensing Environ. 37, 35–46. doi:10.1016/0034-4257(91)90048-b
Congalton, R. G., Oderwald, R. G., and Mead, R. A. (1983). Assessing Landsat classification accuracy using discrete multivariate analysis statistical techniques. Photogrammetry Eng. Remote Sensing 49, 1671–1678.
Czaplewski, R. L. (1994). Variance approximations for assessment of classification accuracy. Fort Collins, CO: Rocky Mountain Forest and Range Experiment Station, 29.
Fan, Y. T. (2016). A stocha stic multispectral images simulation approach and its applications in remote sensing. Master thesis,. Taipei(China): National Taiwan University.
Franklin, S. E., and Wilson, B. A. (1992). A three-stage classifier for remote sensing of mountain environments. Photogrammetric Eng. Remote Sens. 58, 449–454.
Hammond, T. O., and Verbyla, D. L. (1996). Optimistic bias in classification accuracy assessment. Int. J. Remote Sensing 17, 1261–1266. doi:10.1080/01431169608949085
Hay, A. M. (1988). The derivation of global estimates from a confusion matrix. Int. J. Remote Sensing 9, 1395–1398. doi:10.1080/01431168808954945
Herold, M., Scepan, J., and Clarke, K. C. (2002). The use of remote sensing and landscape metrics to describe structures and changes in urban land uses. Environ. Plan. A. 34, 1443–1458. doi:10.1068/a3496
Horowitz, J. L. (2001). “The bootstrap” in Handbook of econometrics. Editors J. J. Heckman, and E. Leamer (New York, NY, United States: North Holland Publishing Company), 5, 3160–3228.
Hsiao, L.-H., and Cheng, K.-S. (2016). Assessing uncertainty in LULC classification accuracy by using bootstrap resampling. Remote Sens. 8, 705. doi:10.3390/rs8090705
Hsiao, L. H. (2013). Assessing uncertainties in landuse/landcover classification using remote sensing images. Master thesis. Taipei (China): National Taiwan University.
Hung, W.-C., Chen, Y.-C., and Cheng, K.-S. (2010). Comparing landcover patterns in Tokyo, Kyoto, and Taipei using ALOS multispectral images. Landscape Urban Plann. 97, 132–145. doi:10.1016/j.landurbplan.2010.05.004
Khatami, R., Mountrakis, G., and Stehman, S. V. (2017). Mapping per-pixel predicted accuracy of classified remote sensing images. Remote Sens. Environ. 191, 156–167. doi:10.1016/j.rse.2017.01.025
Lyons, M. B., Keith, D. A., Phinn, S. R., Mason, T. J., and Elith, J. (2018). A comparison of resampling methods for remote sensing classification and accuracy assessment. Remote Sens. Environ. 208, 145–153. doi:10.1016/j.rse.2018.02.026
Nageswara Rao, P. P., and Mohankumar, A. (1994). Cropland inventory in the command area of Krishnarajasagar project using satellite data. Int. J. Remote Sensing 15, 1295–1305. doi:10.1080/01431169408954162
Olofsson, P., Foody, G. M., Stehman, S. V., and Woodcock, C. E. (2013). Making better use of accuracy data in land change studies: estimating accuracy and area and quantifying uncertainty using stratified estimation. Remote Sens. Environ. 129, 122–131. doi:10.1016/j.rse.2012.10.031
Steele, B. M., Winne, J. C., and Redmond, R. L. (1998). Estimation and mapping of misclassification probabilities for thematic land cover maps. Remote Sens. Environ. 66, 192–202. doi:10.1016/s0034-4257(98)00061-3
Stehman, S. V., and Czaplewski, R. L. (1998). Design and analysis for thematic map accuracy assessment. Remote Sensing Environ. 64, 331–344. doi:10.1016/s0034-4257(98)00010-8
Stehman, S. V. (1997b). Estimating standard errors of accuracy assessment statistics under cluster sampling. Remote Sensing Environ. 60, 258–269. doi:10.1016/s0034-4257(96)00176-9
Stehman, S. V. (2009). Sampling designs for accuracy assessment of land cover. Int. J. Remote Sens. 30, 5243–5272. doi:10.1080/01431160903131000
Stehman, S. V. (1997a). Selecting and interpreting measures of thematic classification accuracy. Remote Sens. Environ., 62, 77–89. doi:10.1016/s0034-4257(97)00083-7
Stehman, S. V. (1995). Thematic map accuracy assessment from the perspective of finite population sampling. Int. J. Remote Sens. 16, 589–593. doi:10.1080/01431169508954425
Teng, S. P., Chen, Y. K., Cheng, K. S., and Lo, H. C. (2008). Hypothesis-test-based landcover change detection using multi-temporal satellite images - A comparative study. Adv. Space Res. 41, 1744–1754. doi:10.1016/j.asr.2007.06.064
Weber, K. T., and Langille, J. (2007). Improving classification accuracy assessments with statistical bootstrap resampling techniques. GIScience & Remote Sens. 44, 237–250. doi:10.2747/1548-1603.44.3.237
Yang, C., Luo, J., Hu, C., Tian, L., Li, J., and Wang, K. (2018). An observation task chain representation model for disaster process-oriented remote sensing satellite sensor planning: a flood water monitoring application. Remote Sens. 10, 375. doi:10.3390/rs10030375
Keywords: stochastic simulation, bootstrap resampling, confidence interval, confusion matrix, accuracy assessment, land-use/land-cover
Citation: Cheng K-S, Ling J-Y, Lin T-W, Liu Y-T, Shen Y-C and Kono Y (2021) Quantifying Uncertainty in Land-Use/Land-Cover Classification Accuracy: A Stochastic Simulation Approach. Front. Environ. Sci. 9:628214. doi: 10.3389/fenvs.2021.628214
Received: 11 November 2020; Accepted: 02 February 2021;
Published: 12 May 2021.
Edited by:
Samy Ismail Elmahdy, American University of Sharjah, United Arab EmiratesReviewed by:
Hwee San Lim, Universiti Sains Malaysia (USM), MalaysiaElfatih Mohamed Abdel-Rahman, University of Khartoum, Sudan
Copyright © 2021 Cheng, Ling, Lin, Liu, Shen and Kono. This is an open-access article distributed under the terms of the Creative Commons Attribution License (CC BY). The use, distribution or reproduction in other forums is permitted, provided the original author(s) and the copyright owner(s) are credited and that the original publication in this journal is cited, in accordance with accepted academic practice. No use, distribution or reproduction is permitted which does not comply with these terms.
*Correspondence: Ke-Sheng Cheng, cnNsYWJAbnR1LmVkdS50dw==