 Chuanzhun Sun
 Diejun Huang3
 Cheng Chen
- 1School of Public Administration, South China Agricultural University, Guangzhou, China
- 2Key Laboratory of Natural Resources Monitoring in Tropical and Subtropical area of South China, Ministry of Natural Resources of the People’s Republic of China, Guangzhou, China
- 3Institute of Culture Tourism and Geography, Guangdong University of Finance and Economics, Guangzhou, China
- 4College of Economics and Management, South China Agricultural University, Guangzhou, China
- 5Leibniz Centre for Agricultural Landscape Research, Working Group “Governance of Ecosystem Services”, Müncheberg, Germany
- 6Technical Centre for Soil, Agriculture and Rural Ecology and Environment, Ministry of Ecology and Environment, Beijing, China
China is the largest manufacturing country globally and currently faces severe environmental problems. China needs to identify a new mode of economic growth to contribute towards environmental protection. Developing the green industry is China’s national strategy to achieve a sustainable path and prevent further degradation of the environment. This study used China’s green food certification enterprise location data to investigate the green food industry’s spatial patterns in 2018 at the agricultural district, provincial, and city levels. Then, using the geographically weighted regression (GWR) method, we evaluated the factors impacting the green food industry’s concentration. Fourteen impact factors were selected from three aspects: socioeconomic, natural, and other factors corresponding to the regional food production potential. Our results showed the following: 1) the structure and species of green food enterprises are simple, and most enterprises are plant products upstream of the industrial chain, with low additional value. There is a large potential to increase the ratio of livestock, poultry, and fishery products; 2) the regional development of the green food industry is not uniform. The green food industry tends to concentrate along the eastern coastline and Yangtze River, and the middle-lower Yangtze Plain, Huang-Huai-Hai Plain, and North East Plain account for 76% of the total production capacity. However, northern China has the highest production ability among single enterprises; 3) regional economies, natural resource conditions, and environmental quality largely impact the concentration of the green food industry. In particular, the green food industry is concentrated in regions with high gross economic levels, highly advantageous natural conditions, and high proportion of cultivated land, except cereal planting areas. Better air quality has a positive influence on the food industry’s concentration.
Introduction
Developing a green industry can help mitigate energy and global climate change by improving resource efficiency (Park and Lee, 2017). Currently, the green industry is considered a new impetus for global economic restructuring and environmental governance (Jacobs, 1993; Adams, 2009; Zhai and An, 2020). With rapid economic development, severe resource and environmental problems have arisen in China. To establish sustainable growth and protect the environment from further deterioration, developing a green industry has become a national strategy (Pan et al., 2011; Yi and Liu, 2015). As a result, the green industry has developed rapidly. Chen et al. (2017) assessed the contributions of the green industry to national development from 2008 to 2012, and found that the share of the value added by the green industry with respect to the gross domestic product (GDP) ranged from 41 to 48%.The definition of green industry varies across countries (Furchtgott-Roth, 2012). In this study, we adopted the definition provided by the “International Green Industry Union,” i.e., green industry is an industry that introduces green production mechanisms, uses clean production technology, reduces raw material and energy consumption, and removes environmental contaminants in production processes.
As an important part of the green industry, the green food industry has grown rapidly in several countries (Misra and Singh, 2016; Willer et al., 2021). Green food is defined as food that is sourced from high-quality environments and produced using specific techniques with strict production quality process control, rendering these products safe for human consumption (Hassan et al., 2020). Existing studies have focused on the economic development aspect of the green food industry (Arthur and Yamoah, 2019; Cardamone, 2020). Cardamone (2020) examined the existence of productivity spillovers across firms in the Italian food manufacturing industry. Arthur and Yamoah (2019) analyzed environmental quality attributes in food-related rural enterprises competitiveness and found that increasingly more products are offering labels, such as “quality,”“green,”“ethical,” and/or “sustainability” to justify the high premiums on their products.
The factors impacting the green food industry are increasingly being studied by numerous researchers, who are particularly interested in how consumer behavior impacts the development of the green food industry. They found that cognition, price, family population structure, income, health consciousness, knowledge, education level, consumer preference, and organic labels are the most important factors affecting consumer behavior (Zepeda and Nie, 2012; Zhu et al., 2013; Nuttavuthisit and Thogersen, 2017; Singh and Verma, 2017; Wang X. et al., 2019; Liang and Lim, 2020). Other researchers have focused on the external influences of the macro environment. These authors identified that the development level of organic food markets, technology, degree of government participation, policy support, and neighborhood effects are positively correlated with the level of development of the green food industry (Bjorkhaug and Blekesaune, 2013; Larsson et al., 2013; Huang et al., 2017). (Ilbery et al., 2016) found that differences in demand are a key factor affecting the green food industry in different areas. However, few studies have focused on the regional heterogeneity in the green food industry. As regional heterogeneity is an important factor driving the equilibrium between supply and demand in large regional markets, it is necessary to conduct this research in a relatively integrated market, such as a country.
Geographical analysis can be used in regional heterogeneity and impact factor studies (Wang J. et al., 2019). In green industry-related studies, impact factor studies always follow three dimensions: economic, environmental, and social (Yi, 2013; Yi and Liu, 2015; Park and Lee, 2017; Zhai and An, 2020). However, in the green food industry, location selection could be strongly related to natural factors and some special factors, but only a few studies have investigated such associations (Lorentz, 2008; Hassan et al., 2020).
The green food industry has rapidly grown in China. Green food was originally proposed by the Ministry of Agriculture at the beginning of the 1990s. The cultivation area of green food production expanded from 0.82 million ha in the 1990s to 11.1 million ha in 2019, accounting for 8.20% of the total farmland area in China (Xu et al., 2020). As a large consumer market and one of the most important food-producing countries, China can serve as a typical example of regional heterogeneity in the green food industry. Zhu (2017) used provincial-level panel data to study the regional heterogeneity and impact factors of China’s green food. However, the provincial-level panel data are relatively coarse, and thus do not reflect this heterogeneity, though there are large differences within provinces. Zhu’s study did not consider the green food industry’s spatial autocorrelation, and the selection of impact indicators excluded natural factors.
In this study, we first used the location data of green certified food enterprises to investigate the spatial patterns of China’s green food industry. We then analyzed the factors impacting the green food industry’s concentration. In impact factor analyses, related studies tend to use the number of regional enterprises as the dependent variable, which ignores the scale and productivity of the enterprises. Therefore, in this study, the regional enterprises production concentration index was chosen as the dependent variable, and 14 factors were chosen as independent variables. This study examined the following questions: 1) what is the status of the structure and distribution features of China’s green food industry? 2) what are the concentration features of the green food industry considering production capacity? and 3) what is the mechanism that impacts the green food industry’s production concentration?
Data Resources and Methods
Data Resources
Green food enterprises are certified by the Green Food Development Center of China, according to the law “Green food brands management stipulation.” These enterprises can be classified into the following four sectors: plant products, processes, livestock and poultry products, and fishery products. We searched all green food records from China’s national enterprise credit information publicity system (http://www.gsxt.gov.cn/index.html) from 2016 to 2018, and obtained 11,674 enterprise records. Then, we built a database of green certified food enterprises in China. Each enterprise record had 26 attributes, including name, category, geographical coordinates, and approved production capacity.
This study covered 31 provinces in mainland China, excluding Hong Kong, Macao, and Taiwan. To better understand the spatial patterns of the green food industry, we used the Chinese mainland agricultural regional division method and classified the study area into nine geographical zones (Liu, 1993, Figure 1): the middle-lower Yangtze Plain (MLYP), northern arid and semiarid region (NASR), Huang-Huai-Hai Plain (HHHP), Sichuan Basin and surrounding regions (SBSR), Northeast China Plain (NECP), Loess Plateau (LP), southern China (SC), Yunnan-Guizhou Plateau (YGP), and Qinghai Tibet Plateau (QTP).
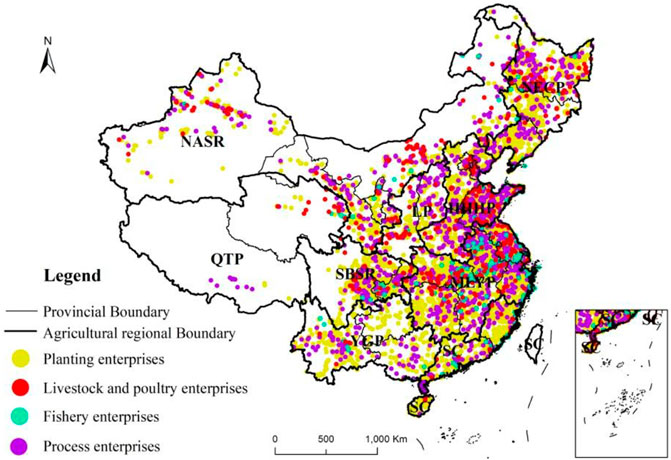
FIGURE 1. Spatial distribution of China’s certified green food enterprises in nine geographical zones.
Methods
Spatial Analysis
This study used spatial analysis methods to address research questions concerning the spatial patterns of the green food industry. The geographic information system (GIS) was used to conduct spatial pattern analysis to identify and compare the agglomeration patterns of green food industries. In particular, a hotspot analysis was used to identify spatial clusters of green food industries at the prefecture city level. The
Production Concentration Analysis
In this study, production concentration was defined as the production capacity of regional enterprises. Each enterprise has an approved production capacity, which is the maximum production of each enterprise. We used this value to calculate the total regional production capacity. Considering the differences in the production capacities of different green food industry sectors, we normalized the approved production of each enterprise to a value between 0–1 using the min-max normalization method. Then, we used the sum of the normalized value within each region as the regional green food industry’s production concentration index (PCI). The PCI emphasizes regional production capacity but ignores the enterprises distribution. Therefore, we introduced the production and enterprise amount index (PEAI) to reflect both production capacity and enterprise distribution. PEAI can be expressed as:
Where
Spatial Regression Analysis
To assess the factors impacting enterprises location selection or industry concentration, a few previous studies used the ordinary least squares (OLS) regression method, although this method ignores the spatial attributes of the data (Yi and Liu, 2015; Cheng, 2016; Park and Lee, 2017; Feng and Wang, 2019). If the data are spatially auto correlated, geographically weighted regression(GWR) needs to be used to include spatial influence (Cheng, 2016). This study used a GWR to detect the relationship between the dependent and explanatory variables. GWR is an extension of the traditional regression. Fotheringham et al. (1998) introduced the spatial information of basic data to the traditional OLS regression equation and considered the spatial weights of the adjacent data (Brunsdon et al., 1998). The GWR method can be represented as:
Where
Where
The weight method was determined using the weight function. The weight of each point can be calculated using a Gaussian function, as shown below.
Where
Dependent Variable
In the regression model, we set the sum of prefecture city-level PCI values as the dependent variable. PCI can reflect the production capacity and scale of enterprises. It is reasonable to use PCI to show the spatial concentration patterns of the green food industry.
Independent Variables
We chose the following three types of independent variables: socioeconomic factors, natural factors, and other factors corresponding to the potential of regional food production (Table 1). Regarding socioeconomic factors, we considered the independent variables previously used (Yi and Liu, 2015; Park and Lee, 2017). We hypothesized that a range of regional socioeconomic factors could potentially influence the spatial patterns of the green food industry. We selected per capita GDP, regional GDP, economic value of regional agricultural production, regional population, and percentage of construction land as socioeconomic factors. The data for these variables were collected from the China City Statistical Yearbook, and the statistical units were prefecture-level cities.
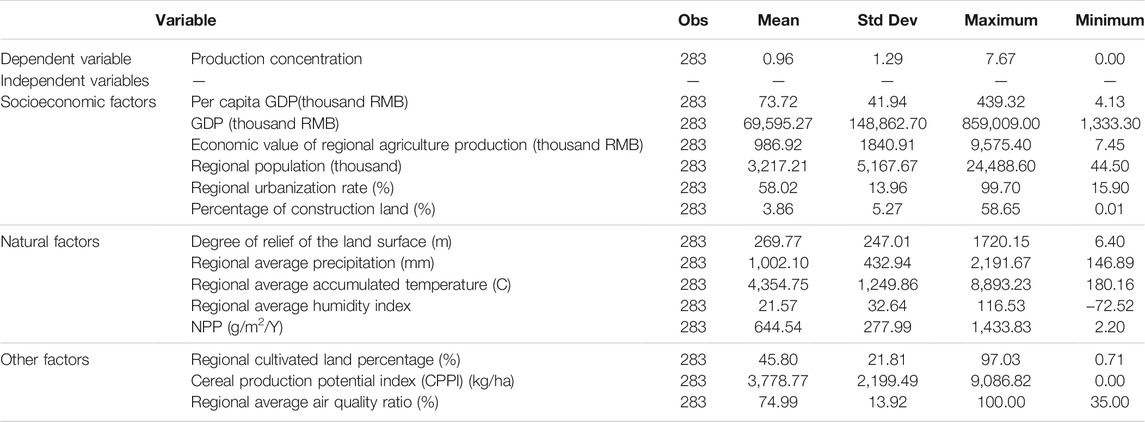
TABLE 1. Descriptive statistics.
Ellison and Glaeser (1997) found that natural advantages can explain approximately 20% of manufacturing industry agglomerations. In addition, the food industry’s raw materials are agricultural products that depend on natural conditions. Therefore, we hypothesized that natural factors have a strong influence on the green food industry’s production concentration. The degree of relief of a land surface can reflect the regional topographic conditions for agricultural production and impact transportation costs. Based on the agricultural production model called the “Global Agro-ecological Zones” (FAO/IIASA, 2012), regional precipitation, accumulated temperature, and humidity index are the most important natural factors affecting agricultural production. Finally, we expected that the production ability of an ecosystem can have a positive impact on the agricultural production potential. Therefore, we selected net primary productivity (NPP) of vegetation as another important index. All natural factor data were collected from the Resource and Environmental Data Cloud Platform (http://www.resdc.cn/) and calculated using GIS software.
Land is an important element of agricultural production (Lorentz, 2008). Therefore, we expected that the area of cultivated land and its production potential would influence regional agricultural production. We used the regional percentage of cultivated land and the cereal production potential index (CPPI, Liu et al., 2015) to reflect the regional cultivated land area and its cereal production potential, respectively. These data were collected from the Resource and Environmental Data Cloud Platform, and the CPPI was calculated using the GAEZ model. Finally, according to the definition of the green industry, we expected that the green food industry would be concentrated in areas with high-quality environments. Therefore, we used the regional average air quality ratio for recent years to reflect the environmental conditions. These data were collected from the China City Statistical Yearbook.
Results
Spatial Pattern of the Green Food Industry
Spatial Distribution Features
There were 11,674 certificated green food enterprises in China in 2018. Among these, the MLYP accounted for the largest proportion, accounting for 40.36% of the total. Within this area, Jiangsu, Anhui, and Zhejiang had the highest proportion of the enterprises. The second and third largest areas were the HHHP and NECP, which accounted for 19.47 and 14.73%, respectively. Within these two areas, Shandong and Heilongjiang had the most number of green food certified enterprises. Of all the enterprises across sectors, 81.94% were plant product enterprises and 12.85% were process enterprises. Only 3.13 and 2.08% of the enterprises were livestock and poultry product and fishery product enterprises, respectively.
Spatial Clustering
Based on the hotspot analysis of the entire green food industry, we found that the green food industry hotspots are mostly distributed in eastern China, particularly in the MLYP, HHHP, and NECP (Figure 2). These three areas have 866 hotspots, accounting for 59.52% of all the hotspots. The hotspots are largely distributed in the Sichuan Basin and its surrounding regions and the northern arid and semiarid regions. Shandong, Yunnan, Liaoning, Anhui, Jiangsu, Zhejiang, and Heilongjiang are the most important provinces in terms of hotspots. The results of the hotspot analysis were consistent with those of the spatial autocorrelation analysis.
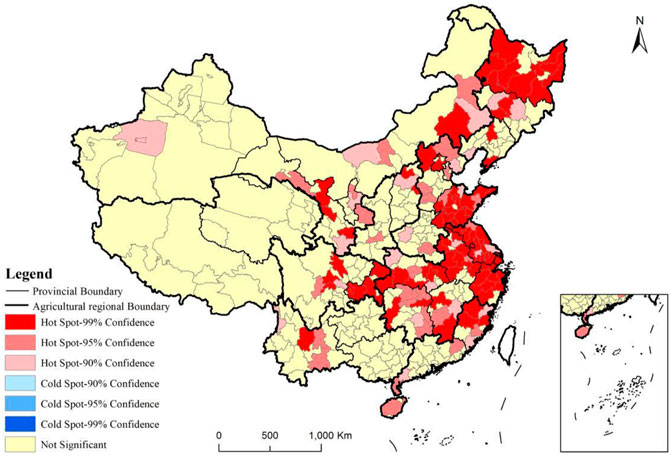
FIGURE 2. Spatial aggregation of the overall green food industry.
From a spectral perspective, the hotspot distribution of plant product enterprises is similar to that of the overall industry (Figure 3). Plant product enterprises are mostly concentrated in eastern China. However, with regard to process enterprises, the hotspots were distributed uniformly among agricultural districts, except for the Qinghai Tibet Plateau. We also found some process enterprises in cold-spots in southern China, distributed in Guangdong and Guangxi provinces. A majority of the hotspots of livestock and poultry product enterprises are distributed north of the Yangtze River, particularly in HHHP and NECP. However, there are some cold-spots at the junction of southern China and MLYP, mostly in the Zhejiang and Fujian provinces. The clustering of the fishery product enterprises was not uniform and occurred mostly in parts of China that were not significant in the hotspot analysis. Only some smal parts had these hotspots, mainly located in MLYP, junction of the northern arid and semiarid regions, and QTP.
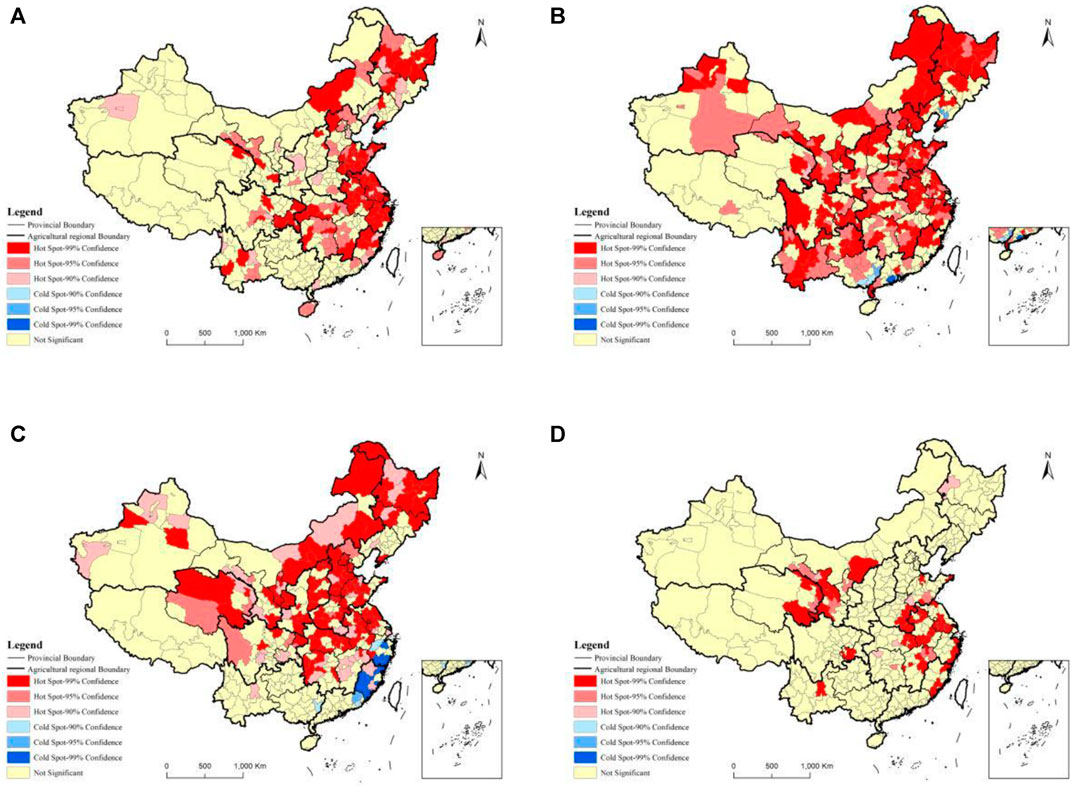
FIGURE 3. Spatial aggregation of the four sectors: (A) plant product enterprises, (B) process enterprises, (C) livestock and poultry product enterprises, and (D) fishery product enterprises.
Production Concentration
The PCI showed a similar tendency to the above-mentioned spatial analysis, but the concentrations differed. The MLYP, HHHP, and NECP had the highest production abilities(Table 2; Figure 4). These areas have a total production concentration of 203.71, accounting for 76% of the total yield in China. From a spectral perspective, the distribution of plant product enterprises is similar to that of the entire green food industry (Figure 5). Specifically, most plant product enterprises are concentrated in the above-mentioned agricultural areas. Regarding process enterprises, the high PCI areas are evenly distributed across China, except for the Qinghai and Tibet provinces. In addition, the livestock and poultry product enterprises high PCI areas are mostly distributed in the northern Yangtze River, including Jiangsu, Anhui, and Hubei provinces, and the eastern part of Gansu Province. The PCI values of fishery product enterprises are relatively low, and the high-value areas are mostly distributed around the coastline and the MLYP region, particularly in Jiangsu, Zhejiang, and Fujian Provinces.
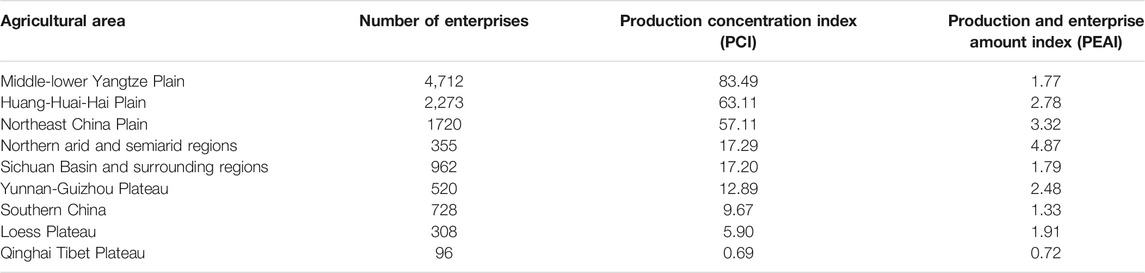
TABLE 2. Production concentrations in different agriculture areas.
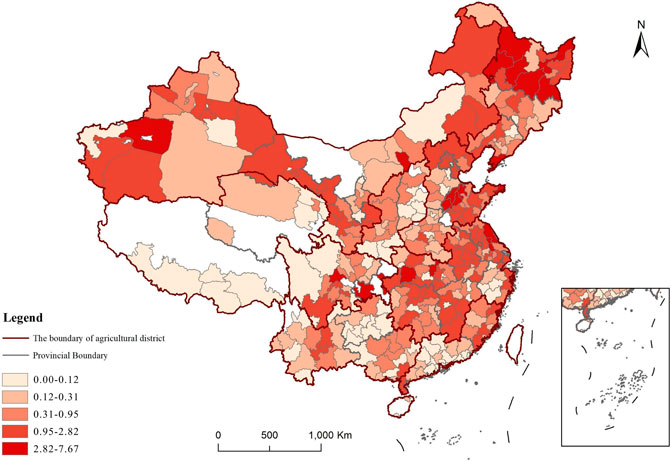
FIGURE 4. Spatial features of the production concentration of the green food industry in China.
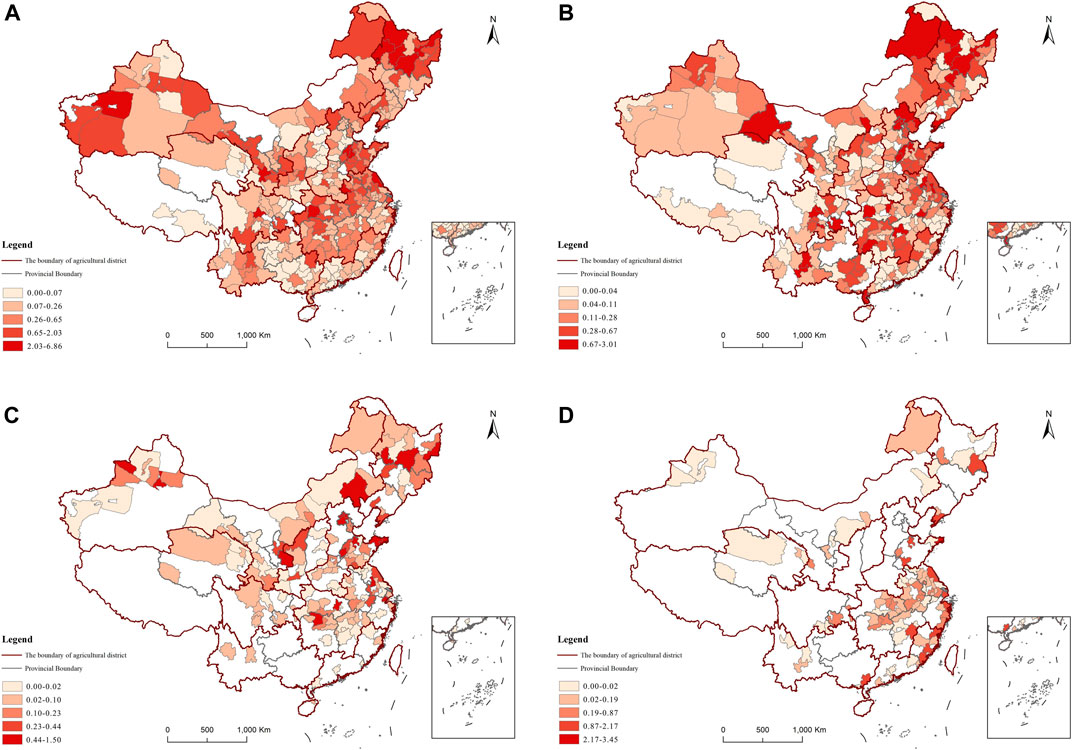
FIGURE 5. Spatial concentration features of the four sectors: (A) plant product enterprises, (B) process enterprises, (C) livestock and poultry product enterprises, and (D) fishery product enterprises.
However, we observed a different trend for PEAI. The northern arid and semiarid regions have the highest PEAI values, indicating that the average production capacity in this area is the highest in China. The NECP and the HHHP have the second and third highest values, respectively, suggesting that these areas also have high average production capacities. Notably, although the MLYP has the highest production concentration value, its PEAI is 1.77, which is only seventh in China. Thus, the average production capacity in this area is relatively low, and the scale of its enterprises is relatively small. At the provincial scale, Shandong, Heilongjiang, Jiangsu, Anhui, and Hubei have the highest production capacities. These provinces have a total production concentration value of 142.14, accounting for 48.67% of the total production. However, the provinces with the highest PEAI were relatively evenly distributed. The top five provinces were Xinjiang, Beijing, Heilongjiang, Guangxi, and Gansu.
Analysis of the Factors Driving the Production Concentration
The results of the GWR are reported in Table 3. Before the GWR analysis, we first used an OLS model to conduct significance and multicollinearity tests for all the independent variables. Based on the OLS analysis, 13 independent variables were statistically significant. Only the percentage of construction land was not significant, according to the F test. Additionally, the economic value of regional agricultural production and the regional population were collinear. We also detected multicollinearity between regional average precipitation, regional average accumulated temperature, and regional average humidity index. Finally, we retained the economic value of regional agricultural production and regional average precipitation, based on their R values.
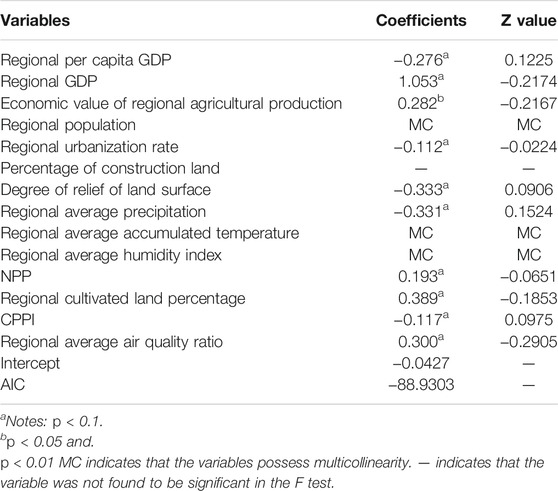
TABLE 3. Results of the GWR.
From a socioeconomic perspective, the green food industry tends to concentrate in regions with higher gross economic levels but lower per capita levels of development. The results obtained by interpreting the coefficients indicated that regional per capita GDP is negatively correlated with the green food industry’s production concentration. The regional urbanization rate was found to be negatively correlated with the production concentration, suggesting that a higher urbanization level leads to lower regional green food production concentrations. In addition, a one percentage point increase in the urbanization rate led to an 11.20% decrease in regional production concentration. The positive coefficient of the relationship between regional GDP and the economic value of regional agricultural production indicated that regions with higher gross economic production are associated with more green food enterprises and higher production capacities, particularly those with higher agricultural economic production.
The green food industry was found concentrated in regions with highly advantageous natural conditions. The GWR results showed that the coefficient of the degree of relief of the land surface was negative, suggesting that a region with greater topographic relief has a lower green enterprise production concentration. The coefficient of NPP was positive, indicating that a region with a higher NPP tends to have a more concentrated green food industry. In addition, a one-unit increase in NPP led to a 19.30% increase in production concentration. The coefficient of the regional average precipitation was negative, indicating that green enterprises tend to concentrate in areas with less precipitation.
The green food industry was found concentrated in areas with higher cultivated land percentages but not in cereal planting areas. In addition, higher air quality had a positive influence on the concentration. The GWR results showed that the coefficient of the regional cultivated land percentage was positive, suggesting that regions with more cultivated land tend to have higher production concentrations. In addition, a 1%increase in the regional cultivated land area led to a 38.90% increase in production concentration. However, the CPPI, which represents the cereal production potential, had a negative coefficient. This suggests that the green food industry tends to be located in areas with higher proportions of cultivated land, but not in cereal planting areas. The positive coefficient of the regional average air quality ratio indicated that the green food industry tends to be located in regions with better air quality.
Discussion
Policy Implication on National Scale
The results of this study reveal some issues in China’s green food industry. First, the structure and species of green food enterprises are simple, and most enterprises are related to plant products. These types of enterprises are upstream in the industry chain and have low additional value. These enterprises are also resource-intensive and consume large amounts of natural resources. Additionally, with economic development in China, there is a large demand for high-quality and diverse green foods that require further processing, particularly livestock, poultry, and fishery products. Currently, the green industry structure is unable to meet these demands (Song, 2011; Zhu, 2017). Second, there are aggregations within green food enterprises. However, the development level differs between different areas. Green food enterprises are concentrated along the eastern coastline and Yangtze River. In the remaining central and western areas, such enterprises are dispersed, which could prevent economy-of-scale effects and industry professionalization.
There are important policy implications associated with two aspects. One is the national green food industry policy. Thus, it is important to optimize industry structure. Specifically, there is a need to increase the proportion of livestock and poultry product and fishery product sectors. Deep processing and high-quality and high-value-added products also need to be developed. The government could support the development of leading regional enterprises to shape the aggregation of the regional green food industry and drive its development. Such activities could include preferential taxes and financial subsidies and incentives (Zhu, 2017).
Developing a green food industry is important for improving food security. Natural and environmental advantages are some of the most important factors for the green food industry. Therefore, on one hand, China should not only encourage an increase in the amount and production capacity of green food enterprises, but also promote high-quality original food sources. For example, more green food facilities can be built, which can grow crops in environmentally friendly conditions with less water, pesticides, and fertilizers. On the other hand, China should stimulate demand for green food. Previous studies have shown that several factors influence green food demands, such as cognition, education level, family population, income, and health consciousness (Zepeda and Nie, 2012; Zhu et al., 2013; Singh and Verma, 2017; Wang X. et al., 2019; Liang and Lim, 2020). The government needs to play an active role in improving people’s income, level, and cognition levels with respect to green food, which could promote mature organic food markets.
Policy Implication on Regional Scale
From a regional perspective, there is a need to balance the supply and demand of green foods among different regions. First, although the number of green food enterprises is the largest in the MLYP, the average production capacity of each enterprise is relatively low, which could hamper the agglomeration effect of the green food industry. Therefore, the enterprise scale in this area can be increased to strengthen the agglomeration effect. Additionally, this area is among the largest economic science and technology areas in China and is also favorable for agriculture. This area has a large market, strong technology support, and high-quality natural conditions. Therefore, it is necessary to stimulate the development of the green food industry. The only disadvantage of this area is that its cash crop planting area is relatively small (Liu et al., 2016) and cannot supply sufficient raw materials. However, this can be offset by regional cooperation and the acquisition of organic raw materials from other regions. Southern China, another economic center of China, has a fewer enterprises and low PCI and PEAI values, indicating that this area also has great potential for developing the green food industry.
Second, the northern arid and semiarid regions have great potential for developing the green food industry. This area has only 355 green food enterprises, but has the highest PEAI. Additionally, the degree of spatial clustering is very low for each prefecture city. It is necessary to enhance regional cooperation and enterprise agglomeration in this area to develop the green food industry. This area has a large advantage in cash crop planting because of its natural conditions (Liu et al., 2016). Therefore, the focus should-be on developing the green food industry’s planting sector. Additionally, this area is also a traditional pasture area of China (Liu et al., 2016). It can also use this advantage to develop livestock and poultry sectors.
Finally, although fishery products are concentrated around the coastline of China and in the MLYP, which has a large amount of water resources, the degree of aggregation is not high in these areas, as shown by the hotspot analysis. It is necessary to increase the degree of aggregation of enterprises to increase the development of the fishery products industry and optimize the green food industry structure throughout the country.
Limitations
In this study, we used the location data of certified green food enterprises to investigate the spatial patterns of China’s green food industry. However, while analyzing its concentration and impact factor, we transformed the point data into planar data at the prefecture level. The data for all independent variables were at the prefecture level. It would be more accurate if the entire analysis used point data. Future work could conduct case studies to verify the green food industry’s temporal and spatial variations and its impact mechanism.
Conclusion
There are numerous green food enterprises in China, and 81.94% of these enterprises are plant product enterprises, with the MLYP accounting for the largest proportion of these enterprises. The hotspot analysis of the green food industry showed that the hotspots were mostly distributed in eastern China, particularly in the MLYP, HHHP, and NECP (Figure 2).
The MLYP, HHHP, and NECP have the highest production capacities. The production from in these three areas accounted for 76% of the total production. However, the PEAI analysis showed that the northern arid and semiarid regions have the highest PEAI, indicating that the average production capacity of a single enterprise in this area is the highest in China. The PEAI also showed that the NECP and HHHP have higher average production capacities. Although the MLYP has the highest production concentration value, with a relatively low PEAI, indicating that the average production ability in this area is relatively low, the scale of its enterprises is relatively small, and the enterprises capability against risks is relatively low.
The GWR analysis showed that the green food industry tends to concentrate in regions with higher gross economic levels but lower per capita levels of development. The results also showed that the green food industry tends to concentrate in regions with highly advantageous natural conditions. In addition, better air quality has a positive influence on the concentration. Additionally, more green food enterprises are located in areas with a higher percentage of cultivated land but not in cereal planting areas.
Data Availability Statement
The original contributions presented in the study are included in the article/supplementary materials, further inquiries can be directed to the corresponding author.
Author Contributions
All authors listed have made a substantial, direct, and intellectual contribution to the work and approved it for publication.
Funding
We are grateful for the financial support of National Key Research and Development Program of China (No. 2019YFC0507802); The National Social Science Fund of China (20CGL063); The Natural Sciences Foundation of China (No. M-0342); Philosophy and Social Science Planning Project of Guangdong Province (No.GD19CYJ14); Natural Science Foundation of Guangdong Province (No. 2018A030310687; No. 2019A1515012149).
Conflict of Interest
The authors declare that the research was conducted in the absence of any commercial or financial relationships that could be construed as a potential conflict of interest.
Publisher’s Note
All claims expressed in this article are solely those of the authors and do not necessarily represent those of their affiliated organizations, or those of the publisher, the editors and the reviewers. Any product that may be evaluated in this article, or claim that may be made by its manufacturer, is not guaranteed or endorsed by the publisher.
References
Adams, W. M. (2009). Green Development: Environment and Sustainability in a Developing World. London, United Kingdom and New York, NY: Routledge.
Arthur, I. K., and Yamoah, F. A. (2019). Understanding the Role of Environmental Quality Attributes in Food-Related Rural enterprise Competitiveness. J. Environ. Manage. 247, 152–160. doi:10.1016/j.jenvman.2019.06.093
Bjorkhaug, H., and Blekesaune, A. (2013). Quantifying Development: Development of New Tools: A Statistical Analysis of Neighbourhood Effects. Geoforum 45, 203–230. doi:10.1201/b15979-14
Brunsdon, C., Fotheringham, A. S., and Charlton, M. (1998). Spatial Nonstationarity and Autoregressive Models. Environ. Plan. A. 30, 957–973. doi:10.1068/a300957
Cardamone, P. (2020). Productivity and Spatial Proximity: Evidence from the Italian Food Industry. Int. Rev. App. Econ. 34, 1465–3486. doi:10.1080/02692171.2020.1732308
Chen, W., Chen, J., Xu, D., Liu, J., and Niu, N. (2017). Assessment of the Practices and Contributions of China's green Industry to the Socio-Economic Development. J. Clean. Prod. 153, 648–656. doi:10.1016/j.jclepro.2016.11.065
Cheng, Z. (2016). The Spatial Correlation and Interaction between Manufacturing Agglomeration and Environmental Pollution. Ecol. Indicators 61, 1024–1032. doi:10.1016/j.ecolind.2015.10.060
Ellison, G., and Glaeser, E. L. (1997). Geographic Concentration in U.S. Manufacturing Industries: A Dartboard Approach. J. Pol. Econ. 105, 889–927. doi:10.1086/262098
FAO/IIASA (2012). Global Agro-Ecological Zones (GAEZ V3. 0). Rome, Italy: IIASA, Laxenburg, Austria and FAO.
Feng, C., and Wang, M. (2019). Journey for green Development Transformation of China's Metal Industry: a Spatial Econometric Analysis. J. Clean. Prod. 225, 1105–1117. doi:10.1016/j.jclepro.2019.04.025
Fotheringham, A. S., Charlton, M. E., and Brunsdon, C. (1998). Geographically Weighted Regression: A Natural Evolution of the Expansion Method for Spatial Data Analysis. Environ. Plan. A. 30, 1905–1927. doi:10.1068/a301905
Furchtgott-Roth, D. (2012). The Elusive and Expensive green Job. Energ. Econ. 34, S43–S52. doi:10.1016/j.eneco.2012.08.034
Getis, A., and Ord, J. K. (1992). The Analysis of Spatial Association by Use of Distance Statistics. Geog. Anal. 24, 189–206. doi:10.1007/978-3-642-01976-0_10
Hassan, M. u., Wen, X., Xu, J., Zhong, J., and Li, X. (2020). Development and Challenges of green Food in China. Front. Agr. Sci. Eng. 7, 56–66. doi:10.15302/j-fase-2019296
Hu, J., Liu, Y., Fang, J., Jing, Y., Liu, Y., and Liu, Y. (2019). Characterizing Pollution-Intensive Industry Transfers in China from 2007 to 2016 Using Land Use Data. J. Clean. Prod. 223, 424–435. doi:10.1016/j.jclepro.2019.03.139
Huang, H.-W., Wu, S.-J., Lu, J.-K., Shyu, Y.-T., and Wang, C.-Y. (2017). Current Status and Future Trends of High-Pressure Processing in Food Industry. Food Control 72, 1–8. doi:10.1016/j.foodcont.2016.07.019
Hurvich, C. M., Simonoff, J. S., and Tsai, C.-L. (1998). Smoothing Parameter Selection in Nonparametric Regression Using an Improved Akaike Information Criterion. J. Roy. Stat. Soc. 60, 271–293. doi:10.1111/1467-9868.00125
Ilbery, B., Kirwan, J., and Maye, D. (2016). Explaining Regional and Local Differences in Organic Farming in England and Wales: A Comparison of South West Wales and South East England: A Comparison of South West Wales and South East England. Reg. Stud. 50, 110–123. doi:10.1080/00343404.2014.895805
Jacobs, M. (1993). The Green Economy: Environment, Sustainable Development and the Politics of the Future. Vancouver, CO: UBC. Press.
Larsson, M., Morin, L., Hahn, T., and Andahl, J. (2013). Institutional Barriers to Organic Farming in Central and Eastern European Countries of the Baltic Sea Region. Agr. Food Econ. 1, 1–20. doi:10.1186/2193-7532-1-5
Liang, R. D., and Lim, W. (2020). Why Do Consumers Buy Organic Food? Results from an S–O–R Model. Asia Pac. J. Mark. Log. 33, 394–415. doi:10.1108/APJML-03-2019-0171
Liu, F., Yan, H. M., Liu, J. Y., Xiao, X. M., and Qin, Y. W. (2016). Spatial Pattern of Land Use Intensity in China in 2000. Acta Geog. Sin. 71, 1130–1143. doi:10.11821/dlxb201607004
Liu, L., Xu, X., and Chen, X. (2015). Assessing the Impact of Urban Expansion on Potential Crop Yield in China during 1990-2010. Food Sec. 7, 33–43. doi:10.1007/s12571-014-0411-z
Lorentz, H. (2008). Production Locations for the Internationalising Food Industry: Case Study from Russia. Br. Food J. 110, 310–334. doi:10.1108/00070700810858718
Misra, R., and Singh, D. (2016). An Analysis of Factors Affecting Growth of Organic Food. Bfj 118, 2308–2325. doi:10.1108/bfj-02-2016-0080
Nuttavuthisit, K., and Thogersen, J. (2017). Yaowawit School Kapong: The Case of Organic Food. Lickel 140, 1–13. doi:10.1108/case.kellogg.2016.000420
Pan, J., Ma, H., and Zhang, Y. (2011). Green Economy and Green Jobs in China: Current Status and Potentials for 2020. Washington, D.C.: Worldwatch Institute.
Park, J.-I., and Lee, S. (2017). Examining the Spatial Patterns of green Industries and the Role of Government Policies in South Korea: Application of a Panel Regression Model (2006-2012). Renew. Sust. Energ. Rev. 78, 614–623. doi:10.1016/j.rser.2017.04.061
Singh, A., and Verma, P. (2017). Factors Influencing Indian Consumers' Actual Buying Behaviour towards Organic Food Products. J. Clean. Prod. 167, 473–483. doi:10.1016/j.jclepro.2017.08.106
Song, G. Y. (2011). Structural Constraints and its Breakthrough in the Development of Chinese Green. Food Industry. Econ. Man. 33, 29–37. In Chinese with English abstract. doi:10.19616/j.cnki.bmj.2011.05.008
Sun, C. Z., Xu, S., Qi, W., Chen, C., Yu, D., Pei, N., et al. (2019). Biodiversity Constraint Indicator Establishment and its Optimization for Urban Growth: Framework and Application. Env. Res. Let. 14, 5006. doi:10.1088/1748-9326/ab55aa
Wang, J., Wang, K., Shi, X., and Wei, Y.-M. (2019b). Spatial Heterogeneity and Driving Forces of Environmental Productivity Growth in China: Would it Help to Switch Pollutant Discharge Fees to Environmental Taxes. J. Clean. Prod. 223, 36–44. doi:10.1016/j.jclepro.2019.03.045
Wang, Q., and Yuan, Q. (2020). Energy-saving and Emission Reduction Potential of the Tobacco Industry: A Case Study of China's 18 Cigarette Enterprises. J. Clean. Prod. 244, 118429. doi:10.1016/j.jclepro.2019.118429
Wang, X., Pacho, F., Liu, J., and Kajungiro, R. (2019a). Factors Influencing Organic Food purchase Intention in Developing Countries and the Moderating Role of Knowledge. Sustainability 11, 209. doi:10.3390/su11010209
Willer, H., Trávníček, J., Meier, C., and Schlatter, B. (2021). The World of Organic Agriculture: Statistics and Emerging Trends 2021. Rheinbreitbach, Germany: Plump Druck & Medien GmbH.
Xu, J., Zhang, Z., Zhang, X., Ishfaq, M., Zhong, J., Li, W., et al. (2020). Green Food Development in China: Experiences and Challenges. Agriculture 10 (12), 614. doi:10.3390/agriculture10120614
Yi, H. (2013). Clean Energy Policies and green Jobs: an Evaluation of green Jobs in U.S. Metropolitan Areas. Energy Policy 56, 644–652. doi:10.1016/j.enpol.2013.01.034
Yi, H., and Liu, Y. (2015). Green Economy in China: Regional Variations and Policy Drivers. Glob. Environ. Change 31, 11–19. doi:10.1016/j.gloenvcha.2014.12.001
Zepeda, L., and Nie, C. (2012). What Are the Odds of Being an Organic or Local Food Shopper? Multivariate Analysis of US Food Shopper Lifestyle Segments. Agric. Hum. Values 29, 467–480. doi:10.1007/s10460-012-9364-z
Zhai, X., and An, Y. (2020). Analyzing Influencing Factors of green Transformation in China's Manufacturing Industry under Environmental Regulation: a Structural Equation Model. J. Clean. Prod. 251, 119760. doi:10.1016/j.jclepro.2019.119760
Zhu, N. (2017). Learning by Investing. Food East. CHN. Econ. Man. 31, 75–79. In Chinese with English abstract. doi:10.4324/9781315619859-9
Keywords: green food industry, spatial distribution pattern, production concentration, impact factors, green economic development
Citation: Sun C, Huang D, Li H, Chen C, Wang C, Li M and Wang Z (2021) Green Food Industry in China: Spatial Pattern and Production Concentration Drivers. Front. Environ. Sci. 9:665990. doi: 10.3389/fenvs.2021.665990
Received: 09 February 2021; Accepted: 14 September 2021;
Published: 29 September 2021.
Edited by:
Adusei Jumah, Central University College, GhanaCopyright © 2021 Sun, Huang, Li, Chen, Wang, Li and Wang. This is an open-access article distributed under the terms of the Creative Commons Attribution License (CC BY). The use, distribution or reproduction in other forums is permitted, provided the original author(s) and the copyright owner(s) are credited and that the original publication in this journal is cited, in accordance with accepted academic practice. No use, distribution or reproduction is permitted which does not comply with these terms.
*Correspondence: Hua Li, ZmF0bWFydGluQHNjYXUuZWR1LmNu