 Huan Zheng
 Yu He
Yu He- 1School of Economics and Management, Chongqing Jiaotong University, Chongqing, China
- 2Research Center for Economy of Upper Reaches of the Yangtse River, Chongqing Technology and Business University, Chongqing, China
This comparative study aims to investigate how China’s environmental protection fee affected firm performance in two separate sample periods, namely 2001–2006 and 2012–2017, as this policy was revised twice in 2003 and 2014. With the Difference-in-Differences (DID) estimation, we find that the second revision of environmental protection fee had a negative impact on heavy polluting firms, while the influence of the first revision seemed to be insignificant. Moreover, the environmental protection fee had a limited impact on other firms, implying that such a policy had achieved its designed effect by precisely governing heavy polluters. Besides, our additional tests show that the environmental protection fee had stronger impacts on non-connected firms and non-SOEs than politically connected firms and SOEs. Our results are robust to various potential endogeneity issues.
Introduction
Over the last 4 decades, China has maintained rapid growth and created an economic miracle. However, such a miracle was at the expense of resource depletion and environmental pollution. This country became a “pollution haven” because of its lax environmental regulations (Dean et al., 2009). Following the developed countries, the Chinese authorities first introduced the environmental protection fee, namely the pollution discharge fee (PRC State Council 1982), to control firms’ discharge of pollutants in 1982. Considered the national economy at that time, this policy had relatively low charge standards. Not surprisingly, such a policy did not achieve its design effect, as evidenced by the fact that China had become the largest CO2 emitter in 2007 (Netherlands Environmental Assessment Agency). The pollution problems forced the authorities to reconsider their environmental regulations and thus largely increased the charge standards of environmental protection fee in 2003 and 2014.
Similar as other environmental regulations, the environmental protection fee can be a double-edged sword, which contributes to sustainable growth but also affects firm operation. There is a considerable debate on the effects of environmental regulation on corporate performance1. The Porter Hypothesis (Porter, 1991; Porter and van der Linde, 1995a; Porter and van der Linde, 1995b) states that a well-designed policy may lead to win-win situations in both social welfare and firm performance as such a policy may stimulate firms’ innovative capabilities, increase their productivity, and thus partly or fully offset the cost of complying with environmental regulation. Nevertheless, other scholars such as Lanoie et al. (2008), Greenstone et al. (2012), and Huang and Liu (2019) argue that environmental regulations impose additional costs for firms and thus worsen corporate performance.
In this paper, we apply a comparative study in two separate sample periods, namely 2001–2006 and 2012–2017, in order to answer three major research questions. Since previous studies observe both positive and negative relationships between environmental regulations and firm performance, we are interested in how the environmental protection fee affects firm operation in China. This policy was designed to follow the polluter-pays principle. In other words, firms releasing pollutants into the environment will be charged, while others without releasing pollutants into the environment will not be affected by this policy. Thus, we apply heavy polluting firms as treated group and environmental friendly firms (namely, firms do not release pollutants into the environment) as control group, and explore the influence of the two revisions (in 2003 and 2014) of the charge standards of the environmental protection fee on corporate performance with Difference-in-Differences (DID) estimations. The second research question we aim to examine whether the two revisions of the environmental protection fee are efficient environmental regulations. We define an efficient environmental regulation as a policy has stronger negative impact on heavy polluters than other firms. To investigate, we further apply normal firms (neither heavy polluters nor environmental friendly firms) as treated group and environmental friendly firms as control group, and re-estimate the potential impacts of the environmental protection fee. The last research question we discuss the different impacts of the environmental protection fee on corporate performance for various firm characteristics, including politically connected and non-connected firms, as well as state owned enterprises (SOEs) and non-SOEs.
We reach several important findings in this study. A negative relationship is observed between environmental protection fee and firm performance for the sample period of 2012–2017. More specifically, heavy polluting firms have worse performance—in terms of lower development capacity, leverage conditions and profitability—than environmental friendly firms after 2014. These firms are more likely to fall into financial distress. Nevertheless, the first revision in 2003 seems to have insignificant influence on firm performance. The possible reason is that the second revision of this policy significantly increases heavy polluting firms’ environmental costs and worsens firm performance. The first revision increases firms’ costs to some extent, but the charge standards are still at relatively low levels and thus present insignificant impacts on firm performance for the sample period of 2001–2006. In addition, the environmental protection fee has insignificantly influence on normal firms for both of the sample periods, with a negative impact on firm development capacity during the sample period of 2012–2017 being the exception. Lastly, our additional tests show that the environmental protection fee seems to have worse impact on non-connected firms than that of connected firms for the sample period of 2012–2017. Also, the environmental protection fee is insignificantly related to the firm performance of SOEs, while negatively associated with non-SOEs over the sample period of 2012–2017. Our results are robust when controlling for potential endogeneity issues.
Our study makes several contributions. First, the impacts of environmental regulations on firm performance have been debated for more than 2 decades without conclusive results. Our study contributes to the literature by furthering the discussion and finding that the China’s environmental protection fee has a negative influence on firm performance. Second, through a comparative study, we demonstrate that the second revision of environmental protection fee significantly affects firm performance, while the influence of the first revision seems to be insignificant. Third, our empirical results show that the environmental protection fee has stronger impacts on heavy polluters than other firms. These results provide robustness for our main tests and also indicate that the environmental protection fee is an efficient environmental regulation as such a policy precisely governs heavy polluters. Finally, this study provides practical suggestions for policymakers. Our sub-sample tests find that the environmental protection fee has negative impacts on non-connected firms and non-SOEs. The possible reason is that non-connected firms and non-SOEs have competitive disadvantage against politically connected firms and SOEs, as the later ones are more likely to acquire funding support from the government and relieve the negative influence of environment regulations. Since non-connected firms and non-SOEs are also important parts of the national economy, the Chinese government should provide more financial support to assist these firms in transformation and upgrading. Given the unique institutional background in China, the above results enhance our understanding of the impact of environmental protection fee on firm performance in the world’s largest emerging market.
The remainder of the paper is organized as follows. In Institutional Background and Literature Review, we briefly discuss the institutional background and the literature on environmental policies. We then describe the empirical design (including data collection, sample description, variables, and regression methodology) of this study in Empirical Design. We report regression results in Regression Results. Finally we provide conclusions in Conclusion.
Institutional Background and Literature Review
Institutional Background-The Environmental Protection Fee
China initially promulgated its environmental protection fee in 1982, namely the Provisional Measures for Collecting Pollution Fees (PRC State Council 1982). This policy was designed to follow the polluter-pays principle, in other words, firms were charged by this policy only if they released pollutants into the environment. The charge amounts is based on the amounts of pollutants firms released into the environment. Since the first version of the environmental protection fee was implemented at the start of the reform and opening-up policy, the Chinese authorities are more concerned about national economic development than environmental protection. Thus, this policy had relatively low charge standards and did not distinguish different kinds of pollutants.
Two decades later, based on 20 years of implementation experience, the Chinese authorities started to realize the limitations of such a policy and thus released the second version (i.e., the first revision) of the environmental protection fee in 2003, namely the Management Regulation on Collection and Use of Pollution Fees (PRC State Council 2003). In the second version, several new concepts were introduced. More specifically, the previous charge on single pollutants was replaced by multi-pollutants, and the notion of pollutant equivalent value was introduced to distinguish different harmful levels of various pollutants. Besides, the charge standards were also increased. For instance, the charge standard of SO2 was 0.04 RMB (Renminbi) per kg in the first version. Through translating the units, we find that the charge standards of SO2 were 0.038 RMB and 0.6 RMB per pollutant equivalent value before and after the first revision.
Although the revision in 2003 increased the fee rates of different pollutants, the charge standards were still at relatively low levels. As a result, the pollution behavior of enterprises was not effectively restrained, and the China’s environment was getting worse. In response to the serious polluting problems, the National Development and Reform Commission released the third version (i.e., the second revision) of the environmental protection fee in 2014, namely the Circular on Relevant Issues Including Adjustment of Pollution Fee Collection Standard (National Development and Reform Commission 2014). Based on the second revision, local governments are entitled to set the local fee rates, which should be no less than 1.2 RMB and 1.4 RMB per pollution equivalent values of air and water pollutants.2
Literature Review
The problem of environmental pollution has attracted public attention in recent decades. Many countries in the world released a number of environmental policies, including laws, administrative regulations, and standards, to control firms’ pollution behavior. It is certain that environmental regulations contribute to environmental protection, while the impacts of these regulations on corporate values seem to be inconclusive. Currently, there are three groups of studies that can be identified based on their results.
One stream of the literature argues that environmental regulation has negative influence on firm performance, as a stringent regulation imposes additional costs and worsens firms’ productivity (Barbera and McConnell, 1990; Gray and Shadbegian, 2003; Lanoie et al., 2008; Greenstone et al., 2012; Huang and Liu, 2019). Through investigating the United States polluting industries, Barbera and McConnell (1990) and Gray and Shadbegian (2003) find that stringent environmental regulation causes a decline in firms’ productivity. Greenstone et al. (2012) further state that stricter air quality regulations are associated with a decline of roughly 2.6 per cent in total factor productivity (TFP) at manufacturing plants. Lanoie et al. (2008) observe a similar result by exploring Canadian manufacturing sector, where environmental regulation has adverse impacts on growth in TFP and a positive lagged effect on productivity. The negative relationship is also detected in China. Huang and Liu (2019) suggest that environmental regulation promotes firm productivity slightly with a lagged effect, and has a harmful impact on firm exports. Moreover, there is a U-shaped relationship with firm exports, and China is to the far left of the inflection point.
Another stream shows a positive relationship between environmental regulation and firm performance. According to the famous Porter Hypothesis (Porter, 1991; Porter and van der Linde, 1995a, Porter and van der Linde, 1995b), a well-designed environmental policy may stimulate firms’ innovative capabilities, increase their productivity, and thus partly or fully offset the cost of complying with environmental regulation. As a result, win-win situations in both social welfare and firm performance can be achieved. Such an argument has been demonstrated in many countries, such as the United States (Jaffe and Palmer, 1997), European countries (Kneller and Manderson, 2012), China (Qi et al., 2014), and 25 member countries in the Organization for Economic Cooperation and Development (OECD) (Johnstone et al., 2010). More specifically, Jaffe and Palmer (1997) find that environmental regulation has a positive impact on R&D expenditures in the United States manufacturing industries. Besides, through investigating China’s industrial firms over the time period of 1990–2010, Qi et al. (2014) observe a positive relationship between corporate or industrial-level environmental performance and firm performance. Ramanathan et al. (2017) further state that firms are more likely to reap the private benefits of sustainability, if they adopt a more dynamic approach to respond to environmental regulations innovatively and take a proactive approach to manage their environmental performance.
In addition to the previous studies, the last stream of literature finds that the impacts of environmental regulations can be different in various situations. For instance, Kahn and Knittel (2003) argue that stringent environmental policies impose firms’ environmental costs and thus should have negative influence on firm performance. Nevertheless, the empirical evidence shows that the United States coal mining firms have negative abnormal returns on the one hand while electricity firms experience positive abnormal returns on the other. Similar results have also been detected when examining the price changes of European Union Emission Allowance (EUA) (Oberndorfer, 2009; Bushnell et al., 2013). Besides, Horváthová (2010) states that environmental regulations are more likely to have positive impacts on firm performance in common law countries than in civil law countries. Zhao et al. (2018) find that different kind of environmental regulations, such as legislative regulation, environmental information disclosure, and administrative regulation, have a variety of impacts on firm performance. In summary, after more than 2 decades’ debate, the influence of environmental regulations on corporate values still remains inconclusive. Against this background, this study joins in the discussion and explores the impacts of the two revisions of China’s environmental protection fee on firm performance.
Empirical Design
Data Collection and Sample Description
The financial data used in this study are extracted from the China Stock Market and Accounting Research (CSMAR) database. As mentioned previously, we apply DID estimation to explore the impact of the two revisions (2014 and 2003) of environmental protection fee on firm performance. Based on the principle of the DID estimation, two separate sample periods, namely 2012–2017 and 2001–2006 (three years before and after each of the revisions), are chosen for four reasons: 1) we choose six years for each of our sample periods, as these sample periods provide us neither too large nor too small sample size; 2) if the sample periods are too long, our empirical analyses may be interfered by other events, such as the Global Financial Crisis in 2008, the China Environmental Protection Tax Law in 2018, the China Resource Tax Law in 2020, and other government policies; 3) if the sample periods are too short, the impact of this policy on sample firms may not be fully manifested; 4) several data are unavailability before 2000 and after 2018.
The original sample includes all the A shares listed on Shanghai Stock Exchange (SHSE) and Shenzhen Stock Exchange (SZSE). A number of firm-year observations were deleted based on the following four criteria: 1) firms in the financial sector, due to differences in regulations; 2) firms listed in the Growth Enterprise Market (GEM), as the lifecycle may significantly affect firm operation (Koh et al., 2015). Most of the listed firms in Chinese stock markets are in maturity stage except those firms listed in the GEM; 3) the first firm-year observation and those firms with less than two consecutive years of financial information, as we need two consecutive years’ observations to calculate change variables; 4) firms with missing or extreme values. Finally, the sample periods of 2012–2017 and 2001–2006 include 2,248 and 1,317 firms, respectively.
Variables
Dependent Variables
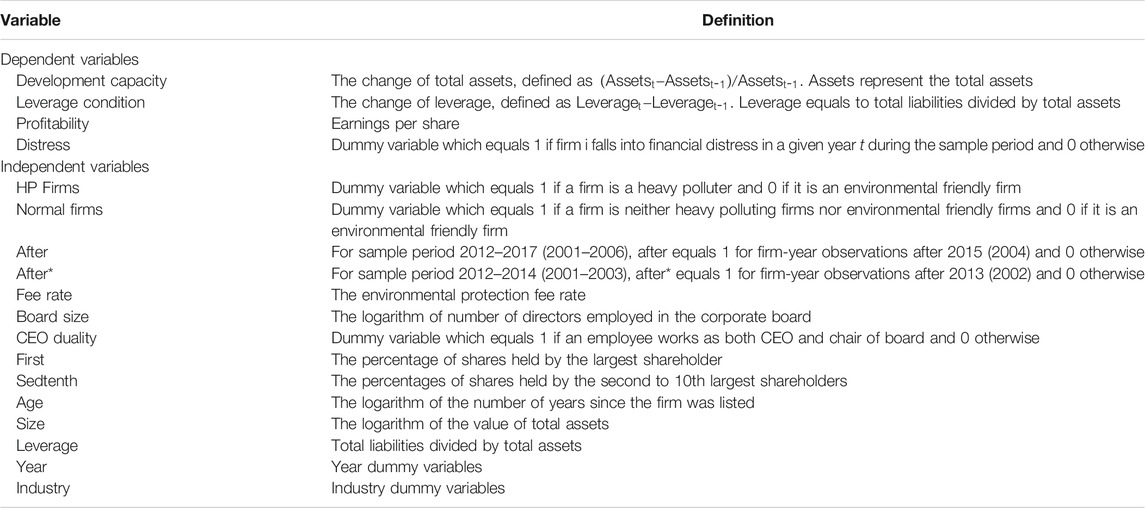
We are interested in how environmental protection fee affects firm performance. Three dependent variables are adopted to capture three aspects of firm performance, including development capability (Assets growth, which is the change of total assets, defined as
Independent Variables
This study applies the DID estimation to explore the impact of environmental protection fee on firm performance. As mentioned previously, this policy follows the polluter-pays principle. In other words, firms are affected only if they discharge pollutants into the environment. Thus, we select the treated and control groups as follows: 1) we apply heavy polluting firms as our treated group. These firms are strongly affected by this policy as they release a large amount of pollutants during their manufacturing process. We follow the China Corporate Environmental Information Disclosure Guidelines (government document) and categorize firms as heavy polluters if they belong to the following sectors: thermal power, steel, cement, electrolytic aluminum, coal, metallurgy, chemical, petrochemical, building materials, paper making, brewing, pharmaceutical, fermentation, textile, leather and mining; 2) besides, we apply environmental friendly firms as our control group. Since there is no official definition on these firms, thus we develop our own definition: firms are defined as environmental friendly if they do not use or release any specified pollutants (including Greenhouse Gas) and do not produce hazardous waste or pollutes water during their manufacturing process. Obviously, these firms are not affected by this policy. Based on the above criteria, we observe 675 (406) heavy polluting firms and 191 (88) environmental friendly firms for the sample periods of 2012–2017 (2001–2006), respectively. Moreover, we adopt two variables, namely Heavy Polluting (HP) Firms and After, to construct the DID estimation. HP Firms is a dummy variable, which equals 1 if a firm is a heavy polluter and 0 if it is an environmental friendly firm. After is also a dummy variable, which takes a value of 1 for firm-year observation after the revision of environmental protection fee and 0 otherwise. Since we have two sample periods (2012–2017 and 2001–2006) in this study, After equals 1 for firm-year observations after 2015 and 2004, and 0 otherwise.
In order to control firms’ corporate governance conditions, we employ four factors: 1) board characteristics, including Board size (the logarithm of number of directors employed in the corporate board) and CEO duality (dummy variable which equals 1 if an employee works as both chief executive officer, CEO, and chair of board, and 0 otherwise); 2) ownership concentration, including First (the percentage of shares held by the largest shareholder) and Sedtenth (the percentages of shares held by the second to 10th largest shareholders). Through investigating 2,980 American firms over the period of 1996–2004, Cheng (2008) states that firms with larger boards have lower variability of corporate performance. Yang and Zhao (2014) find that duality firms outperform non-duality firms by 3–4% when their competitive environments change. In addition, Ma et al. (2010) find that ownership concentration has stronger impacts than any category of ownership in determining performance over Chinese listed firms. The significant influence of corporate governance is also demonstrated in other countries (Earle et al., 2005; Khan et al., 2021).
Besides, a large body of finance literature (e.g., O’Hara and Shaw, 1990; Opler and Titman, 1994; Lennox, 1999 and Poncet et al., 2010) demonstrates that firm financial fundamentals have a significant influence on firm performance. For instance, O’Hara and Shaw (1990) and Lennox (1999) find that fundamental conditions, such as age, size, leverage, and industry sector, are related to firm performance and financial distress. In this study, we adopt three factors to control firm fundamental conditions, which are firm age (Age, the logarithm of years since the firm went public), firm size (Size, the logarithm of firm’s total assets), and leverage ratio (Leverage, the ratio of total debt on total assets).
Regression Methodology
The major objective of this study is exploring how the revisions of environmental protection fee affect firm performance in two sample periods (2012–2017 and 2001–2006). To this end, we utilize the following Ordinary Least Squares (OLS) regression model and Probit regression model for empirical analyses. It is worthwhile mentioning that the OLS regression model is adopted to investigate the impacts of environmental protection fee and other proposed factors on firm development capability, leverage condition, and profitability. In addition, the Probit regression model is applied to explore how firms fall into financial distress with the distressed firm sub–sample. Based on our financial distress measure, we observe a total of 319 and 127 firms falling into distress during the sample periods of 2012–2017 and 2001–2006, respectively.
For dependent variables, we adopt four indicators to capture firm performance, including development capability (Assets growth, which is the change of total assets, defined as
For independent variables, we use HP Firms, After and the interaction term (HP Firms*After) to construct DID estimations, and explore the impacts of environmental protection fee on firm performance. HP Firms is a dummy variable, which equals 1 if a firm is a heavy polluter and 0 if it is an environmental friendly firm. Since we have two sample periods (2012–2017 and 2001–2006) in this study, After equals 1 for firm-year observations after 2015 and 2004, and 0 otherwise. Corporate Governance contains four variables: Board size (the logarithm of number of directors employed in the corporate board), CEO duality (dummy variable which equals 1 if an employee works as both CEO and chair of board, and 0 otherwise), First (the percentage of shares held by the largest shareholder), and Sedtenth (the percentages of shares held by the second to 10th largest shareholders). Fundamental includes three variables: Age (the logarithm of years since the firm went public), Size (the logarithm of firm’s total assets), and Leverage (the ratio of total debt on total assets). Besides, Year and Industry fixed effects are also controlled in the empirical analyses. For the detail of variable definition, see Appendix A.
Summary Statistics
Panel A of Table 1 provide summary statistics for the variables during two separate sample periods (2012–2017 and 2001–2006). It is worthwhile mentioning that the statistics of most variables are based on firm-year observations, excepting Distress and HP Firms, which are based on firm-level observations. Firms during the period of 2012–2017 generally have better development capacity and profitability than the period of 2001–2006. Nevertheless, firms have worse leverage condition and are more likely to fall into financial distress during the period of 2012–2017 than the period of 2001–2006, where the t-tests of differences in mean are −0.0315 and 0.1113, respectively.
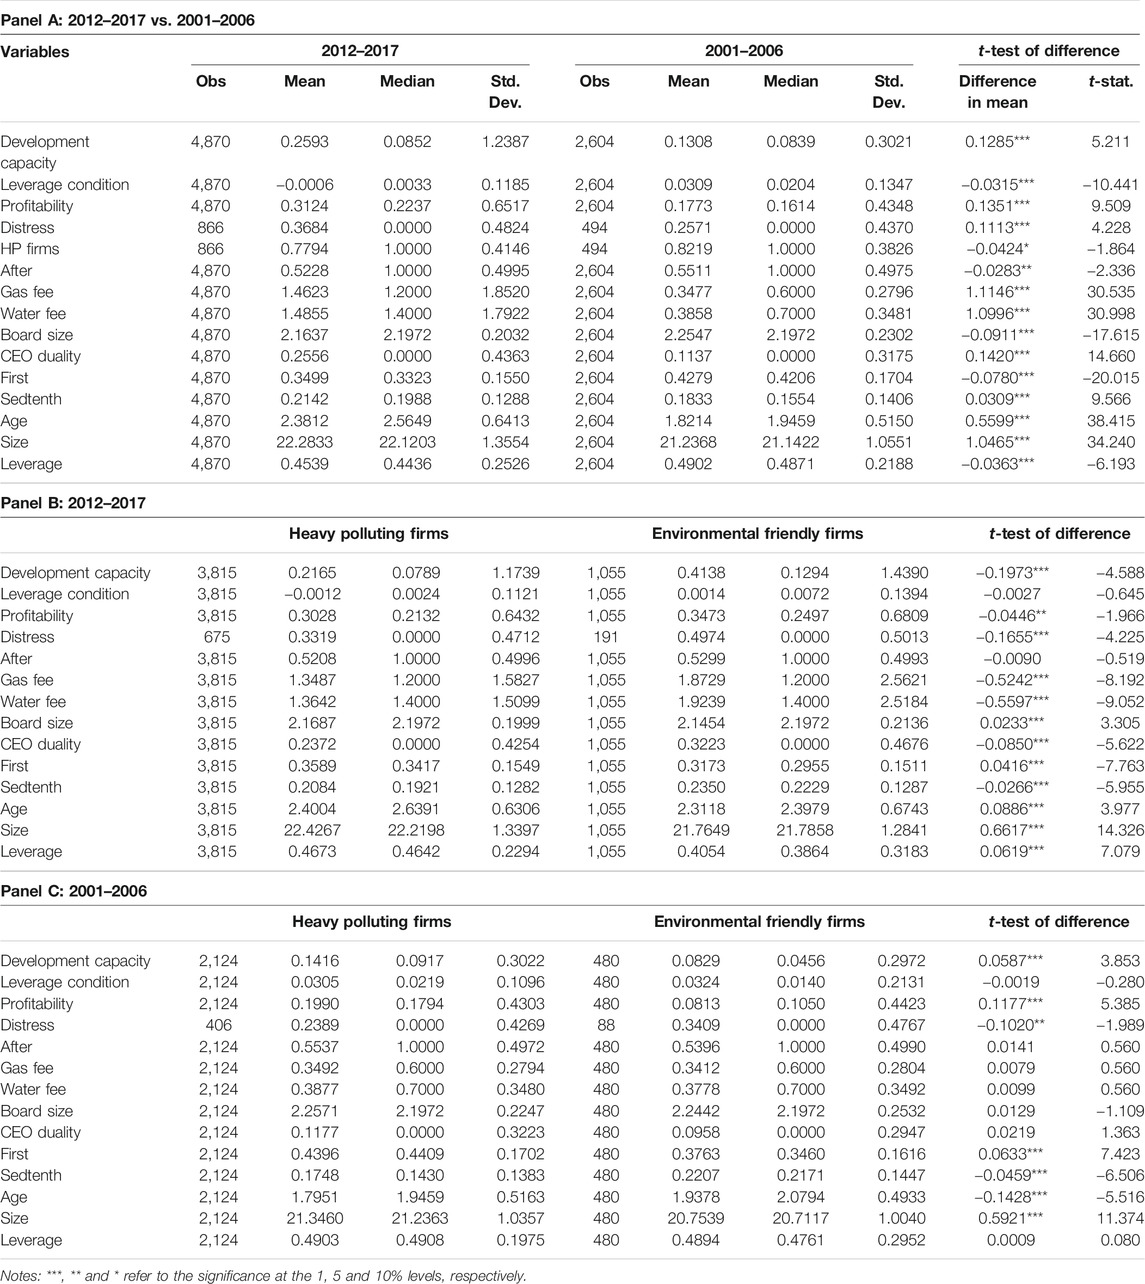
TABLE 1. Summary statistics.This table presents the summary statistics of main variables. The financial data is extracted from the CSMAR database. The study includes two separate sample periods, namely 2012–2017 and 2001–2006. The statistics of most variables are based on firm-year observations, excepting that for Distress and HP Firms, which are based on firm-level observations. For the definitions of variables refer to Appendix A.
Regarding the independent variables, there are 675 (77.94 per cent of 866 firms) and 406 (82.19 per cent of 494 firms) heavy polluting firms during the sample periods of 2012–2017 and 2001–2006, respectively. The Environmental Protection Fee rates, including gas and water fee rates, are significantly larger during the sample period of 2012–2017 than those of the sample period of 2001–2006. Thus, we expect that the revision in 2014 may have stronger impacts on firm performance than that of the revision in 2003. Firms during the period of 2012–2017 have smaller board size and higher CEO duality than the period of 2001–2006. The t-tests of differences in mean of First and Sedtenth are −0.0780 and 0.0309, indicating that firms’ ownership structure became more dispersed during the period of 2012–2017 than the period of 2001–2006. Beside, firms have longer time periods since going public, larger firm size, and lower leverage ratios during the period of 2012–2017 than 2001–2006.
Panel B and C of Table 1 report the results of t-tests of differences in mean between heavy polluters and environmental friendly firms for the sample periods of 2012–2017 and 2001–2006. From Panel B of Table 1, we find that the Environmental Protection Fee rates for environmental friendly firms are larger than those for heavy polluting firms during the sample period of 2012–2017. It should be notice that these results do not mean environmental friendly firms will be charged with higher fee rates. On the contrary, these data show that most environmental friendly (heavy polluting) firms are located in those provinces with higher (lower) fee rates. These results imply that the deterrent effect of the revision in 2014 prompts heavy polluters to locate to those provinces with lower fee rates. However, the revision in 2003 seems do not has such a deterrent effect, as the t-tests of differences of Environmental Protection Fee rates between heavy polluters and environmental friendly firms are statistically insignificant. Thus, these results suggest that the revision in 2014 may have stronger impacts on firm performance than that of the revision in 2003.
Since this study contains two separate sample periods, the Panel A and B of Table 2 report the correlations between main variables during the period of 2012–2017 and 2001–2006, respectively. Although statistically significant in many cases, the correlations between our main variables are generally small. Therefore, the potential problems arising from collinearity between variables are unlikely to be an issue in this study.
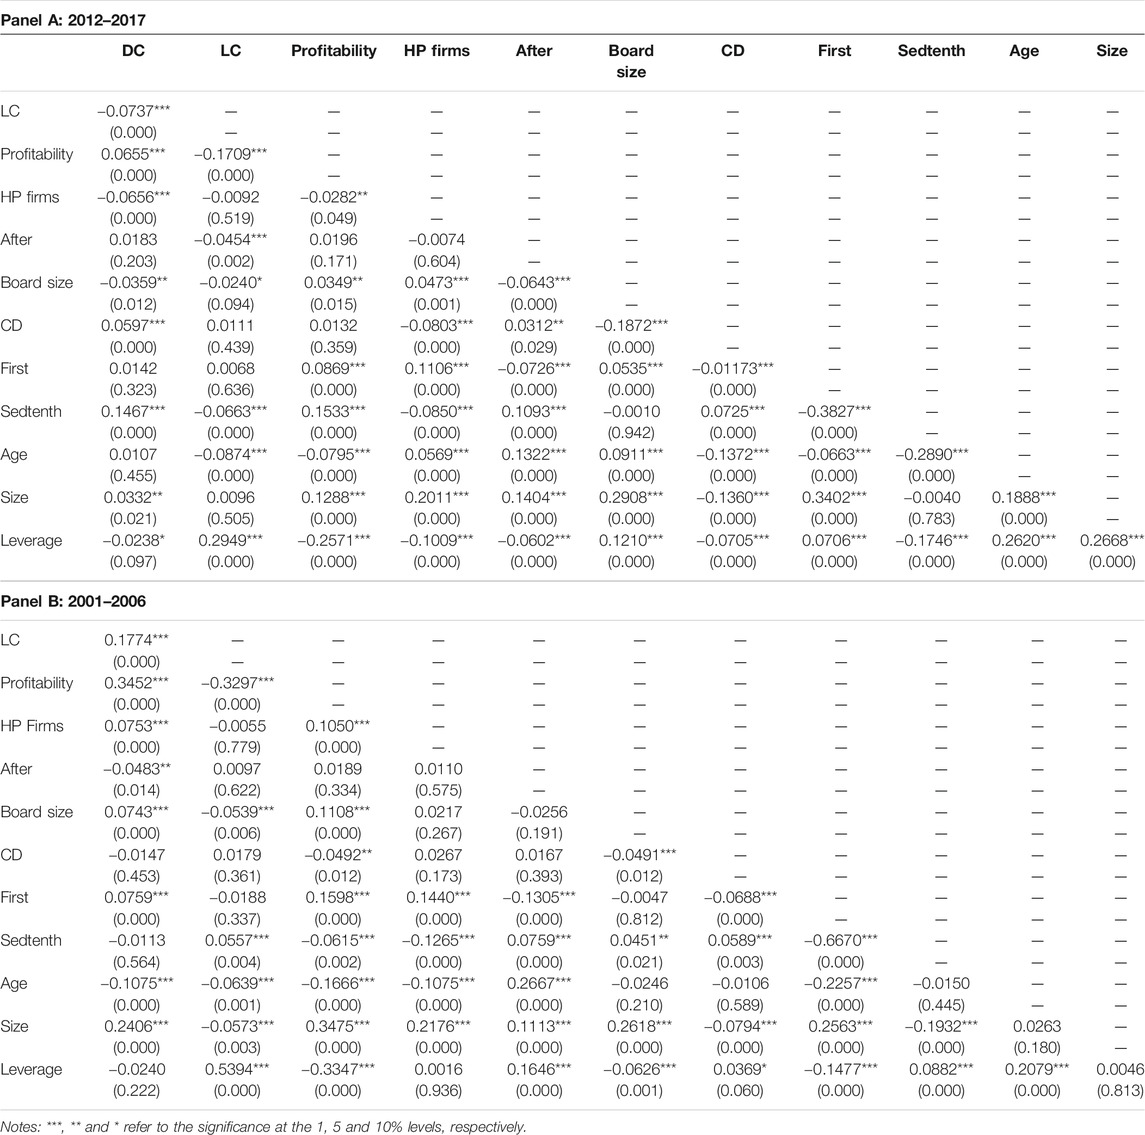
TABLE 2. Correlation matrix.This table presents the correlations between main variables in two separate sample periods. The DC, LC, and CD are short for Development capability, Leverage condition, and CEO duality, respectively. For the definitions of variables refer to Appendix A. P-values are in parentheses.
Regression Results
As mentioned in the introduction section, this study attempts to answer three major research questions: 1) How does the environmental protection fee affect firm operating performance? 2) Are the two revisions of the environmental protection fee efficient environmental regulations? 3) What are the different impacts of the environmental protection fee on corporate performance for various firm characteristics?
Firm Performance
In order to answer the first research question, this study utilizes the OLS regression model and Probit regression model for empirical analysis. The Panel A and B of Table 3 present the empirical results for the sample periods of 2012–2017 and 2001–2006, respectively. Regarding the sample period of 2012–2017, we find that the interaction between HP Firms and After is negatively related to firms’ development capacity, leverage conditions and profitability, and positively associated with financial distress. For the sample period of 2001–2006, the impact on firm performance of the environmental protection fee is statistically insignificant, with a positive impact of the interaction term on firm profitability being the exception. These results indicate that the second revision of environmental protection fee increase firms’ environmental costs—especially for heavy polluting firms—and worsens firm performance, while the first revision seems to have insignificant impacts on firm performance.
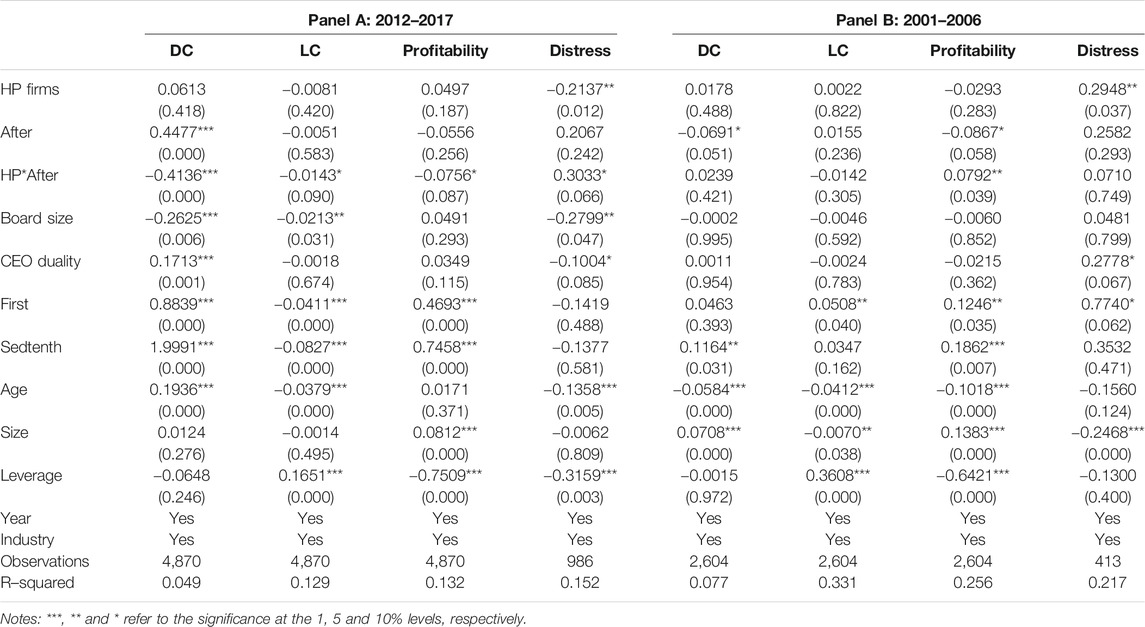
TABLE 3. Firm performance.This table presents the results of firm performance using DID estimations. Firm performance consists of four variables to track firm’s development capability, leverage condition, profitability, and financial distress status. The interaction between HP Firms and After is used to measure the impacts of the two revisions of the environmental protection fee. For the probit regression (column Distress), we report the marginal effect rather than the coefficients. For the definitions of variables refer to Appendix A. P-values are in parentheses.
With respect to corporate governance conditions, Panel A of Table 3 shows that firms with smaller board size and higher CEO duality have better development capacity. Also, Board size and CEO duality are negatively related to firm financial distress. Firms with higher percentage of shares held by the first to 10th largest shareholders generally experience better development capacity and profitability, and lower leverage conditions for the sample period 2012–2017. Meanwhile, ownership concentration factors also have significant impacts on firm performance for the sample period 2001–2006, where a one-unit increase in First (Sedtenth) leads to a 0.1246 (0.1862) unit increase in firm profitability.
Besides, financial fundamentals have different impacts on firm performance between the sample periods of 2012–2017 and 2001–2006. For the sample period of 2012–2017, firm age is positively associated with development capacity, and negatively related to firm leverage condition and financial distress, where a one-unit increase in Age leads to 19.36% increases in Assets growth, as well as 3.79 and 13.58% decrease in Leverage growth and Distress. Larger firms are more likely to experience better profitability. Leverage is demonstrated to have negative influence on profitability and financial distress, where a one-unit increase in Leverage leads to 75.09 and 31.59% decrease in EPS and Distress. Regarding the sample period of 2001–2006, we find that firms with longer time periods of being listed have lower development capacity, leverage condition, and profitability. Larger firm generally have lower leverage condition, better profitability, and lower possibility of falling into financial distress. To be specific, a one-unit increase in Size leads to 13.83% increases in EPS, as well as 0.70 and 24.68% decrease in Leverage growth and Distress. Leverage is negatively related to firm profitability.
The empirical results in Table 3 show that the interaction between HP Firms and After is negatively related to firm performance. However, it is possible that these effects are different at various quantiles of performance measures, while the mean effects are negative. To investigate, we further adopt quantile analyses and report the results in Table 4. We find that the second revision of environmental protection fee has worse impacts on those firms with higher development capacity and leverage condition (per Panel A), while the influence of the first revision still remains insignificant (per Panel B).
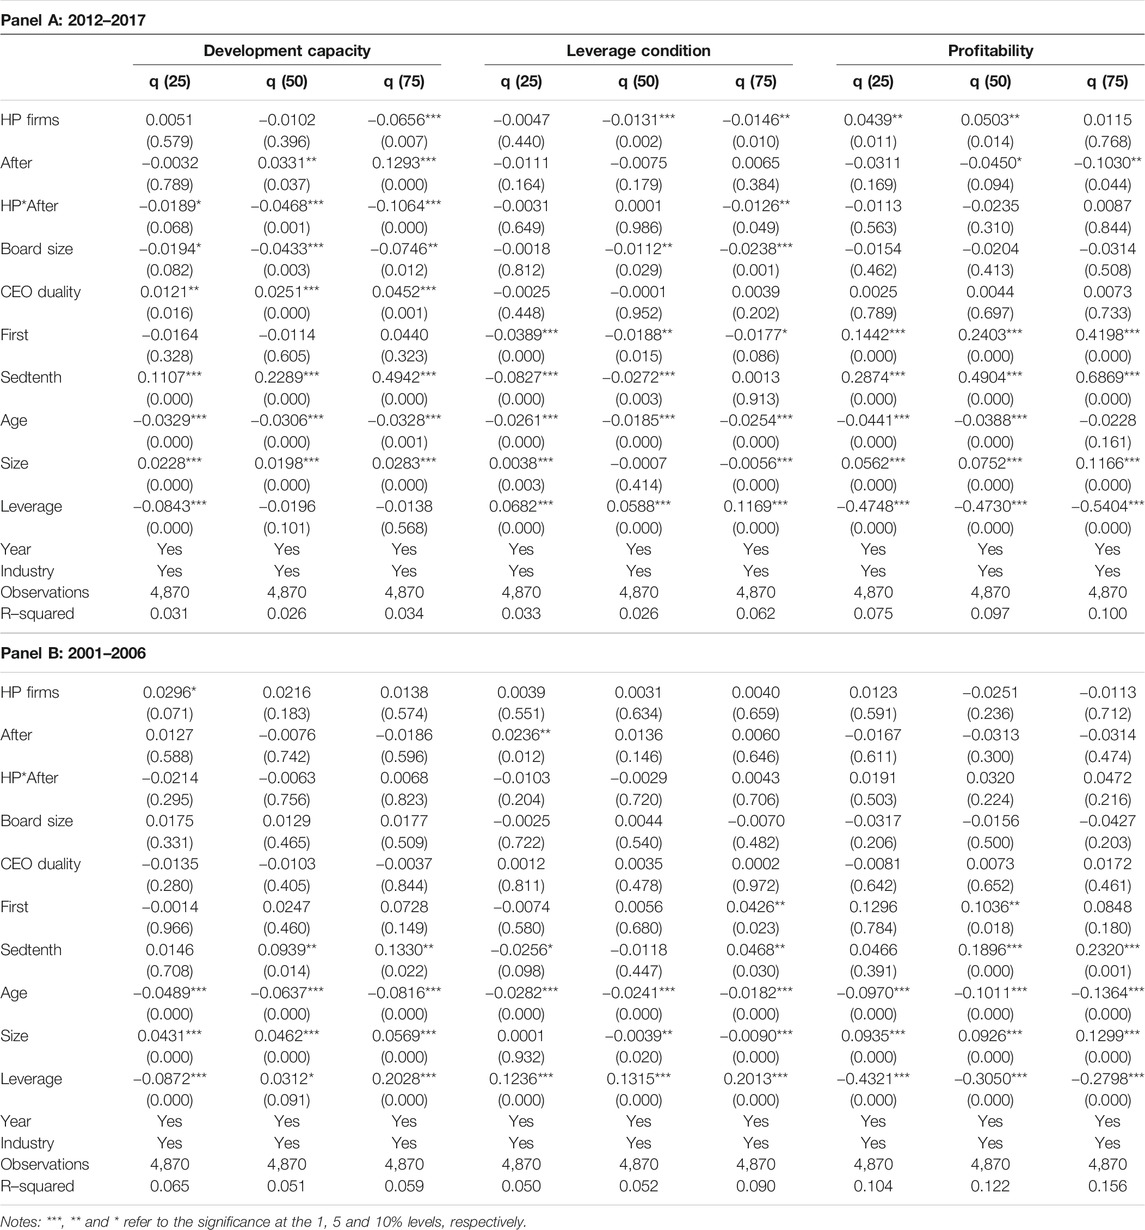
TABLE 4. Quantile analyses.This table presents the results of quantile analyses. For the definitions of variables refer to Appendix A. P-values are in parentheses.
Robustness Test
Other Environmental Regulations
In the previous section, we adopt the DID estimation to investigate the impacts of two revisions of the China’s Environmental Protection Fee on firm performance. It should be notice that other environmental policies that affect Chinese firms should also be controlled for. Since the authorities implemented a lot of environmental regulations (even not major ones) during these years, it is impossible to control for these policy one by one. Thus, we decide to adopt ER (the ratio of GDP on energy, in terms of ten thousand RMB/ton of standard coal equivalent) to measure the overall levels of Chinese environmental regulation during our sample periods. Higher ER value represents more stringent environmental regulation (Ben Kheder and Zugravu, 2008; Ma et al., 2019). After we control for the impacts of other environmental policies, the empirical results (per Table 5) remain the same as those in Table 3, which further confirm our previous findings that the second revision increase heavy polluting firms’ environmental costs and worsens firm performance, while the first revision seems to have insignificant impacts on firm performance.
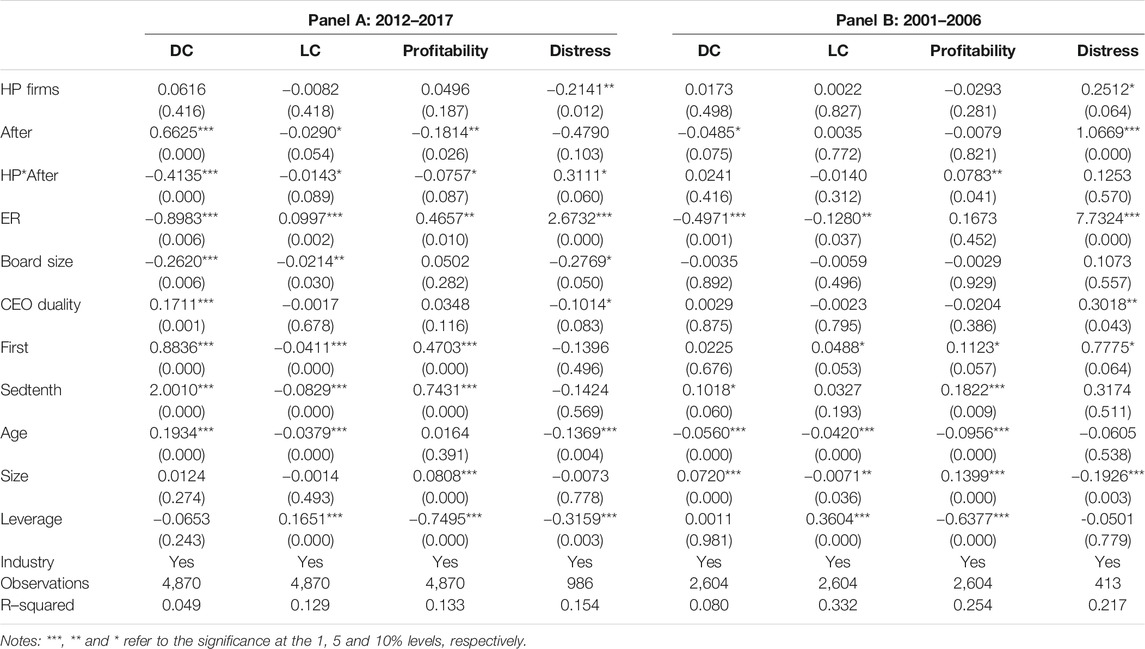
TABLE 5. Other environmental regulations.This table presents the results after we control for other environmental policies. ER is adopted to measure the overall levels of Chinese environmental regulation during our sample periods, which equals to the ratio of GDP on energy (in terms of ten thousand RMB/ton of standard coal equivalent). Higher ER value represents more stringent environmental regulation. In this table, we do not control for year fixed effect, as there is a multicollinearity issue between year fixed effect and ER. For the probit regression (column Distress), we report the marginal effect rather than the coefficients. For the definitions of variables refer to Appendix A. P-values are in parentheses.
Parallel Trend Assumption
Based on the principle of the DID estimation, there should be a common trend between treated and control groups before the implementation of a particular policy. To further verify the main findings in Firm Performance, we artificially assume the two revisions of the environmental protection fee were in 2013 and 2002 and replace the sample periods with 2012–2014 and 2001–2003. Another independent variable, namely After* (dummy variable, which equals 1 for firm-year observations after 2013 and 2002, and 0 otherwise), is adopted for empirical analyses. If the interaction between HP Firms and After* is still significantly related to firm performance, then there is no common trend between treated and control groups before the implementation of a particular policy. As per Table 6, the interaction between HP Firms and After* is insignificantly related to firm performance for both of the sample periods, which demonstrates a common trend between our treated and control groups during 2012–2014 and 2001–2003. Thus, the empirical results provide robustness for our main findings.
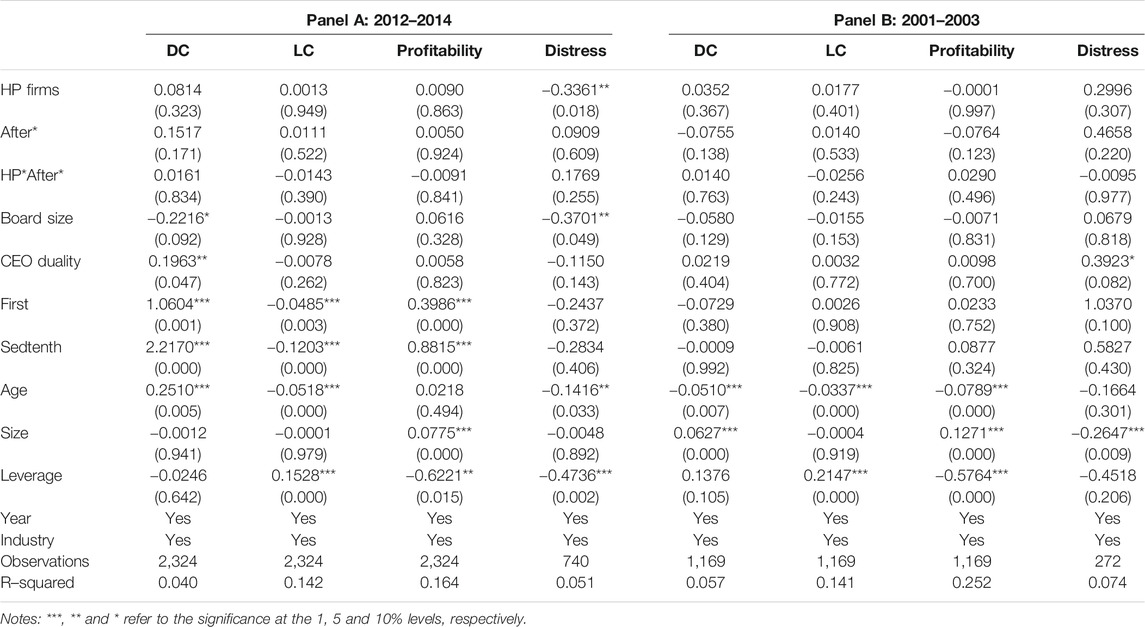
TABLE 6. Robustness test-parallel trend assumption.This table presents the results of robustness test-parallel trend assumption. After* is adopted to replace After and re-estimate the influence of environmental protection fee on firm performance for the sample periods of 2012–2014 and 2001–2003. After* is a dummy variable, which equals 1 for firm-year observations after 2013 and 2002, and 0 otherwise. For the probit regression (column Distress), we report the marginal effect rather than the coefficients. For the definitions of variables refer to Appendix A. P-values are in parentheses.
Environmental Protection Fee Rate
In the previous section, we adopt HP Firms and After to construct DID estimations, and explore the impacts of environmental protection fee on firm performance. After is a dummy variable which takes a value of 1 for firm-year observation after the revisions of environmental protection fee and 0 otherwise. For robustness purpose, we further adopt the environmental protection fee rate to replace After and re-estimate the influence of this policy on firm performance3.
As shown in Table 7, our main findings hold when we use the alternative indicator to estimate the impact of environmental protection fee on firm performance. Specifically, the interaction between HP Firms and Fee Rate is negatively related to firms’ development capacity and positively associated with financial distress for the sample period of 2012–2017. The influence of the first revision of the environmental protection fee (2001–2006) still remains insignificant. These results further confirm our previous finding that the second revision of environmental protection fee increase firms’ environmental costs—especially for heavy polluting firms—and worsens firm performance, while the first revision seems to have insignificant impacts on firm performance.

TABLE 7. Robustness test-environmental protection fee rate.This table presents the results of robustness test-environmental protection fee rate. The environmental protection fee rate is adopted to replace After and re-estimate the influence of environmental protection fee on firm performance. There are different fee rates for various water and gas pollutants. We apply all water and gas fee rates to replace After and achieve similar results. For brevity purpose, we only report the results of water fee. For the probit regression (column Distress), we report the marginal effect rather than the coefficients. For the definitions of variables refer to Appendix A. P-values are in parentheses.
Endogeneity Tests
In the previous section, we control for firm fundamental factors when we explore the impacts of environmental protection fee on the firm performance. Nevertheless, firms with better performance may due to their better fundamental conditions rather than other factors (Albornoz et al., 2009; Cole et al., 2013). To control for the potential endogeneity issue, we replace firm-level with sector-level variables (AveAge, AveSize, and AveLeverage) and repeat our empirical analyses. Table 8 shows that our empirical results almost remain the same as those in Table 3, where the second revision of environmental protection fee increases firms’ environmental costs and worsens firm performance (Panel A: 2012–2017), while the first revision seems to have insignificant impact on firm performance (Panel B: 2001–2006). Corporate governance conditions and firm financial fundamentals also have significant impacts on firm performance. These results suggest that our findings are robust to the potential endogeneity issue.
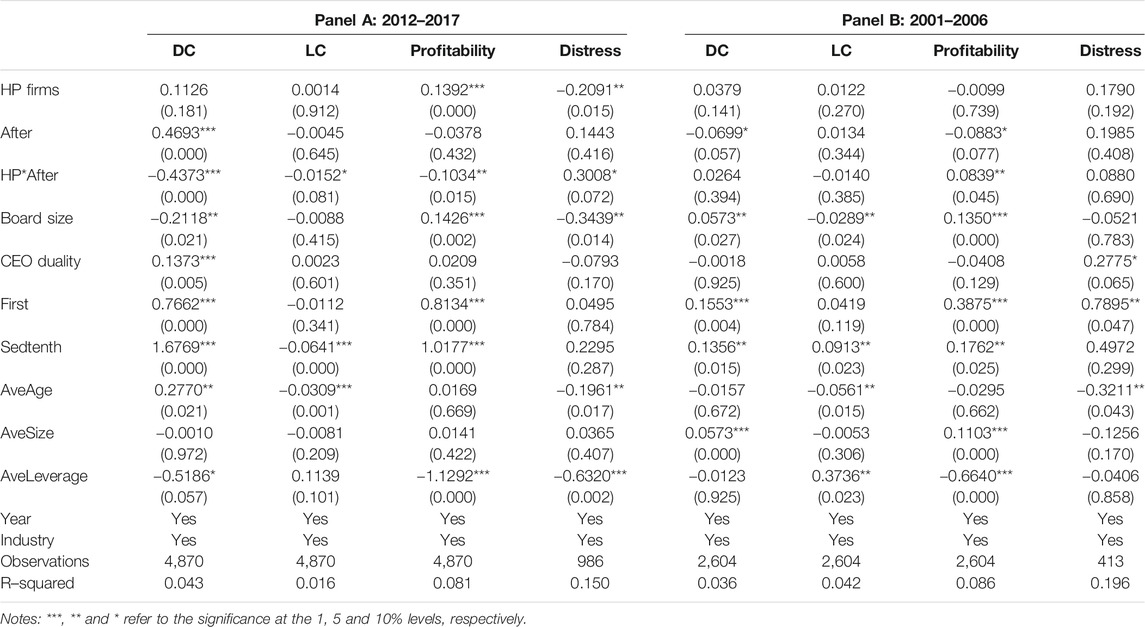
TABLE 8. Endogeneity test–sector average.This table presents the results of endogeneity test–sector average. We utilize sector-level variables (AveAge, AveSize, and AveLeverage) to replace firm-level variables and repeat our empirical analyses. For the probit regression (column Distress), we report the marginal effect rather than the coefficients. For the definitions of variables refer to Appendix A. P-values are in parentheses.
Normal Firms
Regarding the second research question, we discuss whether the two revisions of the environmental protection fee are efficient environmental regulations. As mentioned in Institutional Background-The Environmental Protection Fee, the Environmental Protection Fee policy was designed to follow the polluter-pays principle, in other words, firms were charged by this policy only if they released pollutants into the environment. The charge amounts is based on the amounts of pollutants firms released into the environment. Thus, we define an efficient environmental regulation as a policy has stronger negative impact on heavy polluters than other firms. To investigate, we categorize sample firms into three groups: 1) heavy polluting firms; 2) normal firms; and 3) environmental friendly firms. We define normal firms as those neither belong to heavy polluters nor belong to environmental friendly firms. Obviously, heavy polluters release more pollutants than normal firms. In the previous empirical analyses, we apply heavy polluters and environmental friendly firms as our treated and control groups, and exclude normal firms. In this section, we further use normal firms to replace heavy polluters and re-estimate the impacts of environmental protection fee and other proposed factors on firm performance. Normal Firms (dummy variable, which equals 1 if a firm is neither heavy polluting firms nor environmental friendly firms and 0 if it is an environmental friendly firm) is adopted for empirical analyses, which is a. We observe 1,382 and 823 normal firms for the sample periods of 2012–2017 and 2001–2006, respectively.
From Table 9, we find that the interaction between Normal Firms and After is insignificantly related to firm performance for both of the sample periods, with a negative impact of the interaction term on firm development capacity during the sample period of 2012–2017 being the exception. Thus, the findings support our previous argument that the environmental protection fee is an efficient environmental regulation, which precisely governs heavy polluters rather than other firms. It is worthwhile mentioning that the above empirical analyses also provide robustness for our main tests in Firm Performance, as the results become insignificant after we replace the treated group.
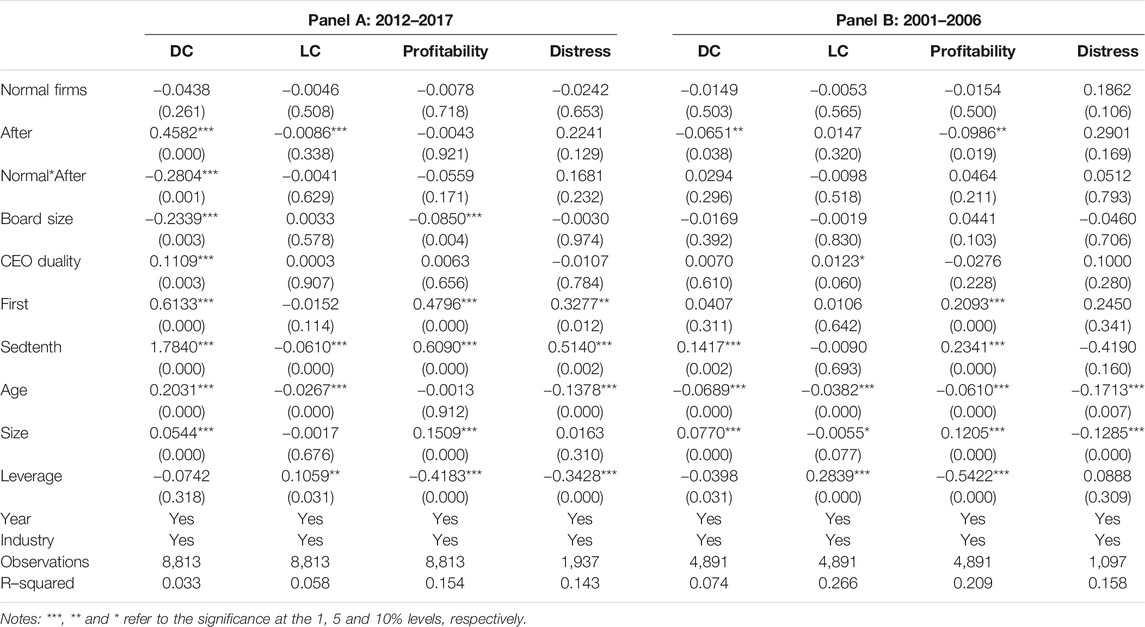
TABLE 9. Normal firm performance.This table presents the results of normal firm performance. We define normal firms as those neither belong to heavy polluters nor belong to environmental friendly firms. Normal Firms is a dummy variable which equals 1 if a firm is neither heavy polluting firms nor environmental friendly firms and 0 if it is an environmental friendly firm. For the probit regression (column Distress), we report the marginal effect rather than the coefficients. For the definitions of variables refer to Appendix A. P-values are in parentheses.
Additional Tests
For the last research question, we divide our firms into several sub-samples, including political connected and non-connected firms, as well as state owned enterprises (SOEs) and non-SOEs4, and re-estimate the different impacts of the environmental protection fee on corporate performance for various firm characteristics.5
Sub-Sample Tests: Politically Connected and Non-Connected Firms
Previous studies (Pargal and Wheeler, 1996; Fryxell et al., 2004) state that political connection plays an important role on corporate operation when environmental regulations come into force. For instance, Fryxell et al. (2004) suggest that compliance with environmental regulation is somewhat lower for firms with political connections than other firms. Moreover, politically connected firms are more likely to acquire funding support from the government to improve their production equipment, and thus achieve lower pollution intensity than those without connections (Pargal and Wheeler, 1996). In this section, we divide our sample into two sub-samples, including connected and non-connected firms, and re-estimate the impacts of environmental protection fee and other proposed factors on firm performance. Following Wu et al. (2012) and Pang and Wang (2020), we define a firm as politically connected if the CEO or Chair of Board is or was a government official6.
As shown in Table 10, environmental protection fee seems to have worse impact on non-connected firms’ development capacity than those of connected firms, as the coefficients of HP Firms*After are −0.4787 and −0.2441, respectively. Nevertheless, the environmental protection fee also worsens non-connected firms’ leverage conditions. Thus, the empirical results suggest that the government should provide more support to relieve the negative impacts of environmental protection fee on non-connected firms.
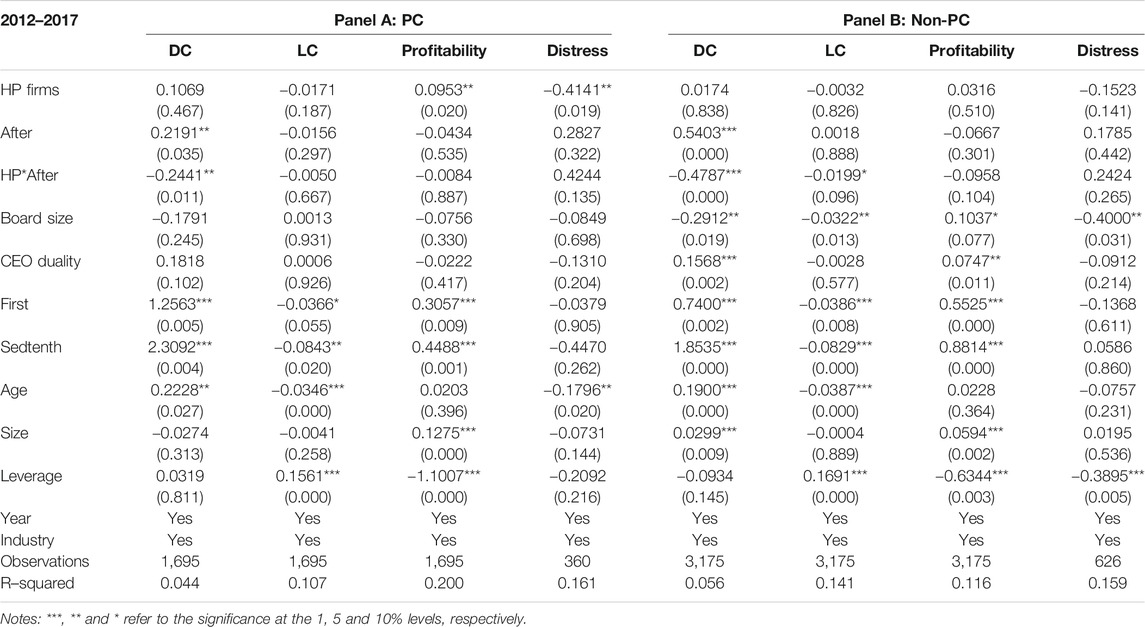
TABLE 10. Subsample tests-Politically connected and non-connected firms.This table presents the results of sub-sample tests: Politically connected and non-connected firms. We define a firm as politically connected if the CEO or Chair of Board is or was a government official. For the sample period of 2001–2006, we find that the environmental protection fee has insignificant influence on firm performance for various sub-samples. In this case, we only report the results of the sample period of 2012–2017 in this section for brevity purpose. For the probit regression (column Distress), we report the marginal effect rather than the coefficients. For the definitions of variables refer to Appendix A. P-values are in parentheses.
Sub-Sample Tests: State Owned Enterprises and Non-SOEs
Another firm characteristic that concerns us is state ownership. China experiences a national-wide economic restructuring since the reform and opening-up policy in 1978, shifting from a centrally planned to a market-oriented economy. The unique re-establishment of China’s stock markets in the early 1990s assisted SOEs to undertake reforms to raise capital. As a result, SOEs obtain a competitive advantage against non-SOEs, as the government becoming both a major stockholder7 (in terms of state ownership) and also the regulator of Chinese stock markets. To examine the different impacts of environmental protection fee, we separate our sample into two sub-samples, including SOEs and non-SOEs.
The empirical results show that the interaction term (HP Firms*After) is insignificantly related to the firm performance of SOEs over the sample period of 2012–2017 (Panel A of Table 11), with a negative impact of the interaction term on firm profitability being the exception. Meanwhile, the environmental protection fee is negatively associated with non-SOEs’ development capacity, and positively related to the likelihood of financial distress (Panel B of Table 11). These results further confirm our argument that SOEs have competitive advantage against non-SOEs. Since non-SOEs are also an important part of the national economy, the Chinese government should provide more financial support and assist them to relieve the negative impacts of environmental regulations.
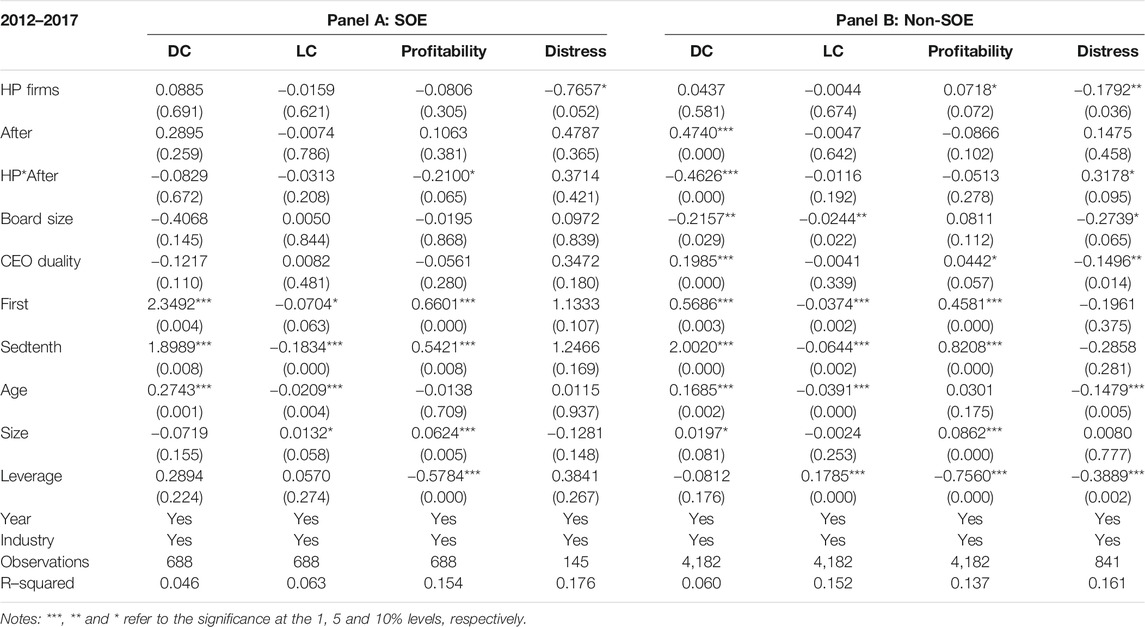
TABLE 11. Subsample tests-SOEs and non-SOEs.This table presents the results of sub-sample tests: SOEs and non-SOEs. For the sample period of 2001–2006, we find that the environmental protection fee has insignificant influence on firm performance for various sub-samples. In this case, we only report the results of the sample period of 2012–2017 in this section for brevity purpose. For the probit regression (column Distress), we report the marginal effect rather than the coefficients. For the definitions of variables refer to Appendix A. P-values are in parentheses.
Conclusion
There is a long-time debate about the relationship between environmental regulation and firm performance. Our study contributes to the literature by furthering the discussion and exploring the influence of environmental regulation in this important transition economy. With two separate sample periods (2001–2006 and 2012–2017) and DID estimation, we answer three major research questions as discussed above. Our empirical results show a negative relationship between the second revision of environmental protection fee and firm performance, as heavy polluting firms had worse development capacity, leverage conditions and profitability, and higher likelihood of falling into financial distress than environmental friendly firms after 2015. Nevertheless, the first revision in 2003 seems to have insignificant influence on firm performance. Besides, the environmental protection fee has insignificantly influence on normal firms for both of the sample periods, implying that the environmental protection fee is an efficient environmental regulation as such a policy precisely governs heavy polluters. Regarding our additional tests, we find that the environmental protection fee has worse impacts on non-connected firms and non-SOEs. Thus, the Chinese government should provide more financial support to assist these firms in transformation and upgrading.
Data Availability Statement
The data analyzed in this study is subject to the following licenses/restrictions: The data that support the findings of this study are available from the CSMAR database. Restrictions apply to the availability of these data, which were used under license for this study. Data are available from Huan Zheng (Chongqing Jiaotong University) and Yu He (Chongqing Technology and Business University) with the permission of the CSMAR database. Requests to access these datasets should be directed to Huan Zheng, aHVhbi56aGVuZ0BjcWp0dS5lZHUuY24=; Yu He, eXUuaGVAY3RidS5lZHUuY24=.
Author Contributions
All authors contributed to conception and design of the study, as well as organized the database. HZ performed the statistical analysis. YH wrote the first draft of the manuscript. All authors wrote sections of the manuscript. Also, all authors contributed to manuscript revision, read, and approved the submitted version.
Funding
This work was supported by the National Social Science Fund of China (19CJY022).
Conflict of Interest
The authors declare that the research was conducted in the absence of any commercial or financial relationships that could be construed as a potential conflict of interest.
Acknowledgments
The authors wish to thank the members of the “Innovation Team of Compound Ecosystem Management in Upper Reaches of Yangtze River” for their comments and support.
Footnotes
1See, for example, Porter (1991), Porter and van der Linde (1995a), Porter and van der Linde (1995b), Kahn and Knittel (2003), Lanoie et al. (2008), Qi et al. (2014), Zhao et al. (2018), Huang and Liu (2019) and Maurel et al. (2019).
2For the details of the fee rates, please refer to the website of the Chinese Ministry of Ecology and Environmental: http://www.mee.gov.cn/.
3As mentioned above, there are different fee rates for various water and gas pollutants. We apply water and gas fee rates to replace After and achieve similar results. For brevity purpose, we only report the results of water fee in Table 7.
4We also consider splitting sample firms into three sub–samples: three main industries, to further explore the different influences of the environmental protection fee on corporate performance. However, we observe too few observations, especially for sub–samples of primary (Agriculture) and tertiary (Service) industries, to complete empirical analyses.
5For the sample period of 2001–2006, we find that the environmental protection fee has insignificant influence on firm performance for various sub-samples, which further confirms our previous findings in Firm Performance. In this case, we only report the results of the sample period of 2012–2017 in this section for brevity purpose.
6Political connection refers to a type of relationship with Chinese authorities, such as Chinese government, China Communist Party Committee, Central Military Commission, Chinese People’s Political Consultative Conference (CPPCC) and National People’s Congress.
7More than 80% of listed firms were SOEs before 2004 and they were still the most powerful participants in markets after the Non-Tradable Share (NTS) reform in 2005. Details of NTS reform please refer to Liu and Tian (2012).
References
Albornoz, F., Cole, M. A., Elliott, R. J. R., and Ercolani, M. G. (2009). In Search of Environmental Spillovers. The World Economy 32 (1), 136–163. doi:10.1111/j.1467-9701.2009.01160.x
Barbera, A. J., and McConnell, V. D. (1990). The Impact of Environmental Regulations on Industry Productivity: Direct and Indirect Effects. J. Environ. Econ. Manag. 18 (1), 50–65. doi:10.1016/0095-0696(90)90051-y
Ben Kheder, S., and Zugravu, N. (2008). The Pollution haven Hypothesis: a Geographic Economy Model in a Comparative Study. FEEM Working Paper No 73, 2008.
Bhattacharjee, A., and Han, J. (2014). Financial Distress of Chinese Firms: Microeconomic, Macroeconomic and Institutional Influences. China Econ. Rev. 30, 244–262. doi:10.1016/j.chieco.2014.07.007
Bushnell, J. B., Chong, H., and Mansur, E. T. (2013). Profiting from Regulation: Evidence from the European Carbon Market. Am. Econ. J. Econ. Pol. 5 (4), 78–106. doi:10.1257/pol.5.4.78
Chan, K. C., and Chen, N.-F. (1991). Structural and Return Characteristics of Small and Large Firms. J. Finance 46 (4), 1467–1484. doi:10.1111/j.1540-6261.1991.tb04626.x
Cheng, S. (2008). Board Size and the Variability of Corporate Performance. J. Financial Econ. 87, 157–176. doi:10.1016/j.jfineco.2006.10.006
Cole, M. A., Elliott, R. J. R., Okubo, T., and Zhou, Y. (2013). The Carbon Dioxide Emissions of Firms: A Spatial Analysis. J. Environ. Econ. Manag. 65 (2), 290–309. doi:10.1016/j.jeem.2012.07.002
Dean, J. M., Lovely, M. E., and Wang, H. (2009). Are Foreign Investors Attracted to Weak Environmental Regulations? Evaluating the Evidence from China. J. Develop. Econ. 90, 1–13. doi:10.1016/j.jdeveco.2008.11.007
Earle, J. S., Kucsera, C., and Telegdy, A. (2005). Ownership Concentration and Corporate Performance on the Budapest Stock Exchange: Do Too many Cooks Spoil the Goulash? Corporate Governance 13 (2), 254–264. doi:10.1111/j.1467-8683.2005.00420.x
Fan, J. P. H., Huang, J., and Zhu, N. (2013). Institutions, Ownership Structures, and Distress Resolution in China. J. Corporate Finance 23, 71–87. doi:10.1016/j.jcorpfin.2013.07.005
Fryxell, G. E., Chung, S. S., and Lo, C. W. H. (2004). Does the Selection of ISO 14001 Registrars Matter? Registrar Reputation and Environmental Policy Statements in China. J. Environ. Manage. 71 (1), 45–57. doi:10.1016/j.jenvman.2004.01.005
Gray, W. B., and Shadbegian, R. J. (2003). Plant Vintage, Technology, and Environmental Regulation. J. Environ. Econ. Manag. 46 (3), 384–402. doi:10.1016/s0095-0696(03)00031-7
Greenstone, M., List, J. A., and Syverson, C. (2012). The Effects of Environmental Regulation on the Competitiveness of U.S. Manufacturing. NBER Working Paper no. 18392, September. doi:10.3386/w18392
Horváthová, E. (2010). Does Environmental Performance Affect Financial Performance? A Meta-Analysis. Ecol. Econ. 70 (1), 52–59. doi:10.1016/j.ecolecon.2010.04.004
Huang, X., and Liu, X. (2019). The Impact of Environmental Regulation on Productivity and Exports: A Firm-Level Evidence from China. Emerging Markets Finance and Trade 55 (11), 2589–2608. doi:10.1080/1540496x.2019.1584556
Jaffe, A. B., and Palmer, K. (1997). Environmental Regulation and Innovation: A Panel Data Study. Rev. Econ. Stat. 79, 610–619. doi:10.1162/003465397557196
Johnstone, N., Haščič, I., and Popp, D. (2010). Renewable Energy Policies and Technological Innovation: Evidence Based on Patent Counts. Environ. Resource Econ. 45, 133–155. doi:10.1007/s10640-009-9309-1
Kahn, S., and Knittel, C. R. (2003). The Impact of the Clean Air Act Amendments of 1990 on Electric Utilities and Coal Mines: Evidence from the Stock Market. Working Paper 118. Berkeley: Centre for the Study of Energy Markets, University of California
Kam, A., Citron, D., and Muradoglu, G. (2008). Distress and Restructuring in China: Does Ownership Matter? China Econ. Rev. 19 (4), 567–579. doi:10.1016/j.chieco.2008.07.002
Khan, M. T., Al-Jabri, Q. M., and Saif, N. (2021). Dynamic Relationship between Corporate Board Structure and Firm Performance: Evidence from Malaysia. Int. J. Finance Econ. 26 (1), 644–661. doi:10.1002/ijfe.1808
Kneller, R., and Manderson, E. (2012). Environmental Regulations and Innovation Activity in UK Manufacturing Industries. Resource Energ. Econ. 34, 211–235. doi:10.1016/j.reseneeco.2011.12.001
Koh, S., Durand, R. B., Dai, L., and Chang, M. (2015). Financial Distress: Lifecycle and Corporate Restructuring. J. Corporate Finance 33, 19–33. doi:10.1016/j.jcorpfin.2015.04.004
Lanoie, P., Patry, M., and Lajeunesse, R. (2008). Environmental Regulation and Productivity: Testing the Porter Hypothesis. J. Prod. Anal. 30 (2), 121–128. doi:10.1007/s11123-008-0108-4
Lennox, C. (1999). Identifying Failing Companies: A Re-evaluation of the Logit, Probit and DA Approaches. J. Econ. Business 51 (4), 347–364. doi:10.1016/s0148-6195(99)00009-0
Lin, X., Zhang, Y., and Zhu, N. (2009). Does Bank Ownership Increase Firm Value? Evidence from China. J. Int. Money Finance 28 (4), 720–737. doi:10.1016/j.jimonfin.2008.12.015
Liu, Q., and Tian, G. (2012). Controlling Shareholder, Expropriations and Firm's Leverage Decision: Evidence from Chinese Non-tradable Share Reform. J. Corporate Finance 18 (4), 782–803. doi:10.1016/j.jcorpfin.2012.06.002
Ma, S., Dai, J., and Wen, H. (2019). The Influence of Trade Openness on the Level of Human Capital in China: on the Basis of Environmental Regulation. J. Clean. Prod. 225, 340–349. doi:10.1016/j.jclepro.2019.03.238
Ma, S., Naughton, T., and Tian, G. (2010). Ownership and Ownership Concentration: Which Is Important in Determining the Performance of China's Listed Firms? Account. Finance 50, 871–897. doi:10.1111/j.1467-629x.2010.00353.x
Maurel, M., Pernet, T., and Zhao, R. (2019). Financial Dependencies, Environmental Regulation, and Pollution Intensity: Evidence From China (No. 19029). Université Panthéon-Sorbonne (Paris 1), Centre d’Economie de la Sorbonne.
Oberndorfer, U. (2009). EU Emission Allowances and the Stock Market: Evidence from the Electricity Industry. Ecol. Econ. 68 (4), 1116–1126. doi:10.1016/j.ecolecon.2008.07.026
O’Hara, M., and Shaw, W. (1990). Deposit Insurance and Wealth Effects: The Value of Being “Too Big to Fail”. J. Finance 45 (5), 1587–1600. doi:10.2307/2328751
Opler, T. C., and Titman, S. (1994). Financial Distress and Corporate Performance. J. Finance 49 (3), 1015–1040. doi:10.1111/j.1540-6261.1994.tb00086.x
Pang, C., and Wang, Y. (2020). Political Connections, Legal Environments and Firm Performance Around the World. Int. J. Finance Econ. forthcoming. doi:10.1002/ijfe.2021
Pargal, S., and Wheeler, D. (1996). Informal Regulation of Industrial Pollution in Developing Countries: Evidence from Indonesia. J. Polit. Economy 104 (6), 1314–1327. doi:10.1086/262061
Poncet, S., Steingress, W., and Vandenbussche, H. (2010). Financial Constraints in china: Firm-Level Evidence. China Econ. Rev. 21 (3), 411–422. doi:10.1016/j.chieco.2010.03.001
Porter, M. E. (1991). America’s green Strategy. Scientific Am. 264 (4), 96. doi:10.1038/scientificamerican0491-168
Porter, M. E., and Linde, C. v. d. (1995b). Toward a New conception of the Environment-Competitiveness Relationship. J. Econ. Perspect. 9 (4), 97–118. doi:10.1257/jep.9.4.97
Porter, M. E., and van der Linde, C. (1995a). Green and Competitive: Ending the Stalemate. Harv. Business Rev. 73 (5), 120–134.
Qi, G. Y., Zeng, S. X., Shi, J. J., Meng, X. H., Lin, H., and Yang, Q. X. (2014). Revisiting the Relationship between Environmental and Financial Performance in Chinese Industry. J. Environ. Manage. 145, 349–356. doi:10.1016/j.jenvman.2014.07.010
Ramanathan, R., He, Q., Black, A., Ghobadian, A., and Gallear, D. (2017). Environmental Regulations, Innovation and Firm Performance: A Revisit of the Porter Hypothesis. J. Clean. Prod. 155, 79–92. doi:10.1016/j.jclepro.2016.08.116
Wang, Z.-J., and Deng, X.-L. (2006). Corporate Governance and Financial Distress: Evidence from Chinese Listed Companies. The Chin. Economy 39 (5), 5–27. doi:10.2753/ces1097-1475390501
Wang, Z., and Li, H. (2007). Financial Distress Prediction of Chinese Listed Companies: A Rough Set Methodology. Chin. Manag. Stud. 1 (2), 93–110. doi:10.1108/17506140710758008
Wu, W., Wu, C., Zhou, C., and Wu, J. (2012). Political Connections, Tax Benefits and Firm Performance: Evidence from China. J. Account. Public Pol. 31 (3), 277–300. doi:10.1016/j.jaccpubpol.2011.10.005
Yang, T., and Zhao, S. (2014). CEO Duality and Firm Performance: Evidence from an Exogenous Shock to the Competitive Environment. J. Banking Finance 49, 534–552. doi:10.1016/j.jbankfin.2014.04.008
Appendix a | variable definition
Keywords: environmental protection fee, firm performance, heavy polluting firms, environmental friendly firms, difference-in-differences estimation
Citation: Zheng H and He Y (2021) The Impacts of Two Revisions of the China’s Environmental Protection Fee on Firm Performance: Evidence From Stock Markets. Front. Environ. Sci. 9:685939. doi: 10.3389/fenvs.2021.685939
Received: 26 March 2021; Accepted: 16 June 2021;
Published: 28 June 2021.
Edited by:
Yanfei Li, Hunan University of Technology and Business, ChinaReviewed by:
Firmin Doko Tchatoka, University of Adelaide, AustraliaMathilde Maurel, UMR8174 Centre d'économie de la Sorbonne (CES), France
Copyright © 2021 Zheng and He. This is an open-access article distributed under the terms of the Creative Commons Attribution License (CC BY). The use, distribution or reproduction in other forums is permitted, provided the original author(s) and the copyright owner(s) are credited and that the original publication in this journal is cited, in accordance with accepted academic practice. No use, distribution or reproduction is permitted which does not comply with these terms.
*Correspondence: Yu He, eXUuaGVAY3RidS5lZHUuY24=