 Wei Shao
 Yufei Yin1,2
 Farhad Taghizadeh-Hesary
- 1School of Economics, Zhejiang University of Finance and Economics, Hangzhou, China
- 2Business School, Huzhou Normal University, Huzhou, China
- 3School of Finance, Zhejiang University of Finance and Economics, Hang Zhou, China
- 4Social Science Research Institute, Tokai University, Hiratsuka, Japan
At present, China’s economy is in a crucial period of economic structural transformation. To alleviate the downward pressure on the economy and explore sustainable growth paths, the Chinese government has issued several environmental regulations. However, the impact of environmental regulation on industrial structure upgrading has not been carefully examined yet. This study utilizes the Pollution Information Transparency Index (PITI) to measure environmental regulation (ER) and examines the impact of ER on industrial structure upgrading (ISU). The sample cities are divided into 36 resource-based cities (RBCs) and 77 non–resource-based cities (NRBCs). The panel data containing 113 cities during 2008–2017 are used in this study. The empirical results show that ER has a significant impact on ISU of RBCs and NRBCs, and robust tests proved the reliability of this result. Analysis of heterogeneity shows ER has a more substantial role in promoting ISU in RBCs and the eastern region. Meanwhile, inside RBCs, ER has a more substantial impact on ISU in growth-RBCs than on that in other RBCs. The mechanism test shows that the mediation effect of technological innovation in RBCs and NRBCs is significant. At last, the impact of ER on ISU has a double-threshold effect in RBCs and a single-threshold effect in NRBCs. With the technological innovation progress, ER produces an increasing effect on ISU of RBCs and NRBCs.
Introduction
Since the reform and opening-up, China has achieved remarkable industrial development, but this is at the cost of environmental pollution. Industrial production emissions are one of the leading causes of environmental pollution (Duzgoren, 2007). Developing countries such as China have realized the importance of achieving coordinated economic growth and environmental protection (Liu and Wang, 2016; Lu et al., 2020a). Hence, the Chinese government has adopted a series of environmental regulation policies to realize industrial structure upgrading and control environmental pollution problems caused by industrial development. The 2020 Environmental Performance Index jointly released by Yale University and Columbia University in the United States shows that China’s air quality and many other indicators have improved. China ranks 120th among 180 countries, with an environmental performance index of 37.3, which has increased by 8.4 percentage points over the past ten years.
As we all know, environmental pollution is a social problem with strong negative externalities and requires local governments’ efforts to overcome the market failure in the treatment of environmental pollution. However, local officials in China are appointed by the higher level government or the central government, and the evaluation system is mainly GDP-oriented (Chen, 2015; Rochlitz et al., 2015). This has led to fierce GDP competition and different efforts of controlling environmental pollution among local governments (Yin et al., 2014). Especially for resource-based cities (RBCs), industrial development relies heavily on natural resources and faces a greater challenge of controlling environmental pollution emissions than non–resource-based cities (NRBCs). To what extent does China’s environmental regulatory policies help promote industrial structure upgrading (ISU), and whether there are different policy effects among cities with different resource endowments? What is the mechanism? These are the major questions addressed in this study.
In addition, with the popularization and development of the Internet and information technology, the public’s awareness of environmental protection has gradually increased. The number of environmental nongovernmental organizations (ENGOs) in China has multiplied since 1994 (the first ENGO, named “Friends of Nature,” was established). The IPEA, as a representative ENGO in China, is committed to promoting information openness and public participation to raise environmental awareness of the public by promoting environmental information disclosure and public environmental information supervision. In 2008, the IPEA and NRDC (an international ENGO) jointly released the PITI1 to evaluate China’s government environmental information disclosure. If a city has a higher PITI score, this city discloses more pollution information, and the public has stronger awareness of environmental information supervision. The PITI reflects the efforts of local governments in environmental governance. Hence, the PITI is classified as an informal environmental regulation. Even though the PITI has been used by some scholars (Tian et al., 2016; Yao and Liang, 2017; Li, 2019), using the PITI to measure environmental regulation is still relatively rare. This article uses the PITI to measure urban-level environmental regulations from the perspective of environmental information disclosure and study the impact of ER on industrial structure upgrading (ISU).
There have been several related studies in the literature about ER and ISU. First is the theoretical debate between “Following cost” hypothesis and “The Porter Hypothesis (PH).” According to “Following cost” hypothesis, ER increases the cost of enterprises’ operation and government management, leads to the decline of production efficiency, and is not beneficial to economic growth (Greenstone, 2001; Blackman and Kildegaard, 2010). The PH posits that reasonable stringency of environmental regulatory policies can increase enterprises’ competitiveness and produce more innovations. Ultimately, it helps enterprises meet the standard of ER and reduce production costs (Porter et al., 1995; Franco and Marin, 2013; Ramanathan et al., 2016; Qiu et al., 2018). Yang et al. (2012) found that ER is conducive to promoting innovations in Taiwanese manufacturing sectors. However, Zhao et al. (2018) used the data of China’s carbon industries as a research sample and found no strong PH effect, and high-intensity ER produces adverse effects on TFP in the long run. Other scholars have found similar findings (Rassier and Earnhart, 2015; Cohen and Tubb, 2018; Lu et al., 2020b).
Second is the examination of the pollution haven hypothesis (PHH). Sun et al. (2017) found that pollution enterprises in developing countries move to countries or regions with a low ER standard. Taking 16 manufacturing industries of 13 European countries as a research sample, Mulatu et al. (2010) confirmed the existence of PHH. Martin (2014) found that if the EU implements a distinction carbon dioxide emission policy, pollution-intensive enterprises will make regional transfers in the EU economy. Liu et al. (2012) and Wu et al. (2019) found that with the ER intensity increasing in China’s developed regions, pollution industries have significant characteristics of moving to the midwest area in China. The third factor includes ER and ISU. Zhu et al. (2019) found that ERs of the steel industry are conducive to improving steel efficiency, and outputs and inputs, based on China’s steel industry data from 2006 to 2013. Taking the data of 30 provinces in China as the sample, Zhang et al. (2020) found that ER is beneficial to ISU in the long run. Meanwhile, other scholars believed that ER produces no obvious impacts on industrial upgrading since research samples’ selection affected the reliability of conclusions (Rubashkina et al., 2015; Zhang et al., 2019).
The related literature has analyzed the relationship between ER and ISU, but some areas still need to be further expanded. On the one hand, whether ER can promote ISU has not yet formed a unified conclusion. Meanwhile, the existing literature uses national-, provincial-, or industry-level data, while the city-level data for research are relatively rare. The cities are the main policy objects of ER in China, and the regional or industrial heterogeneity of ER has been verified (Yuan et al., 2017; Feng and Li, 2020). It is necessary to study the policy effect of ER from the perspective of urban resource endowment.
On the other hand, it is more difficult to accurately measure ER with a single indicator such as enterprise pollution investment, pollution penalty, or their ratio in all corporate investment (Gray et al., 2014; Liao and Shi, 2018). Some studies are also trying to make comprehensive indicators (including SO2 removal rate and solid waste utilization rate) to measure ER (Dam and Scholens, 2012; Zhou et al., 2017). Even though these indicators could be used as a proxy variable to some degree, they only reflect the consequences of ER. In addition, changes in indicator weights will reduce the reliability of the results even if the same comprehensive indicator is used. Solving environmental pollution requires joint efforts of governments, enterprises, and the public. In particular, public participation in environmental governance can effectively address the asymmetry of governments and enterprises in environmental information and supervision, and it has attracted more and more attention in recent years. Hence, using comprehensive indicators including government environmental supervision, corporate emission data, and public evaluation to measure ER is necessary.
Compared to the existing literature, this study makes the following contributions: 1) this study provides a new stream from the perspective of urban resource endowments to study the impact of ER on ISU of RBCs and NRBCs2 in China, to expand the existing literature on economic consequences of ER. 2) The PITI of 113 Chinese cities, including government environmental supervision, enterprise emission data, and public evolution, is chosen to measure ER. As a more comprehensive indicator, the PITI contains more aspects of ER and provides empirical evidence for the positive effect of environmental information disclosure on ISU. 3) The results of heterogeneity analysis show that there is not only a heterogeneous effect between RBCs and NRBCs or in different regions but also a heterogeneous effect inside RBCs. This provides evidence for differentiated environmental regulatory policies. 4) The mediation effect and the threshold effect of technological innovation are examined in this study, and it helps to deepen the understanding of the positive role of technological innovation in the impact of ER on ISU.
The rest of this article is arranged as follows: Section The Mechanism of Environmental Regulation Affecting Industrial Structure Upgrading is analyzing the mechanism of ER affecting ISU; Section Sample Data and Variables is the model design, including variables and data; Section Model and Results Analysis is the empirical analysis; Section Further Discussion is further discussion. Section Conclusion and Policy Recommendations is the conclusions and policy recommendations.
The Mechanism of Environmental Regulation Affecting Industrial Structure Upgrading
This section mainly discusses the direct and indirect effects of ER on ISU, as shown in Figure 1.
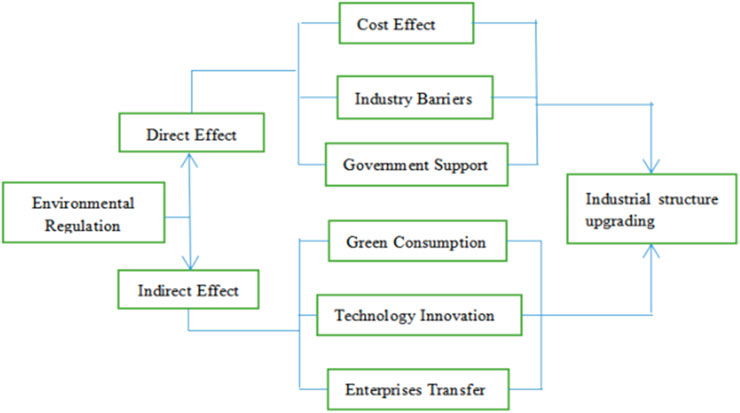
FIGURE 1. The mechanism of ER affecting ISU.
Direct Effect
According to “Following cost” hypothesis, the negative externality of environmental pollution would be transferred into enterprises’ production costs by ER (Millimet et al., 2009). Enterprises are forced to change the original production and management strategies to meet environmental regulatory standards by adjusting the product structure, rationalizing resources’ allocation, and entering or exiting the market. As the intensity of ER increases, it is easier for large-scale pollution-intensive enterprises to achieve internalization of environmental governance cost than small ones because large-scale enterprises can meet the environmental protection standards through buying pollution control equipment and increasing investment in green production technology. However, it is much harder for medium and small enterprises to do what large-scale enterprises have done. The increasing environmental governance cost is more likely to break their break-even point and make profits harder and harder. Eventually, they are forced to quit (Yin et al., 2014). It can be inferred that environmental regulatory policies produce the effects of survival of the fittest on polluting enterprises.
In addition, enterprises’ marginal cost and sunk cost will increase for the sake of green environmental barriers made by ER, when they enter a polluting industry (Ryan, 2012). Green environmental barriers will stop pollution industries from expanding their scale, reduce the ratio of new enterprise entering pollution industries, and produce positive effects on ISU (Cui and Ji, 2011). Meanwhile, governments prefer to make environmental regulation policies to improve the level of green development. These policies such as taxation and subsidies are used to enhance the competitiveness of clean industries and promote the popularization and application of the environmental protection production style in the whole society. As the ratio of clean industries improves, the industry structure will also develop to a higher level.
Indirect Effect
ER improves the public awareness of green consumption and environmental protection. Environmental label products such as energy efficiency and green certification help consumers eliminate the asymmetry of different enterprises’ product information, buy green products, and increase consumers’ green consumption (Lyon and Maxwell, 2003; Bjorner et al., 2004; Lu et al., 2016). The increasing market demand for green products will affect enterprises’ production strategies, promote enterprises to provide more green products, and promote the green transformation of the industrial structure. In addition, there are two methods for pollution enterprises to solve the increasing production cost caused by ER when facing increasingly strict environmental supervision policies in the long run. On the one hand, pollution enterprises improve the production efficiency by green technology innovation to reduce the cost. Technology innovation promotes industrial division and can significantly reduce enterprises’ product cost and utilize sustained power into high-technology industries (Borghesi et al., 2015), thus driving the development of the clean industries and ISU (Chakraborty and Chatterjee, 2017).
On the other hand, moving to regions with lower ER levels could be the second way for pollution enterprises. For economic growth, lower standard environmental regulatory policies are generally made in developing countries. Strict environmental regulatory policies in developed countries lead to the transfer of pollution enterprises to developing countries (Du and Li, 2020). Even though pollution enterprises’ multinational transfer will promote the economic growth of developing countries quickly, it is not favorable to upgrading the industry structure of developing countries in the long run. In addition, this phenomenon also occurs in different areas of a country. Polluting enterprises’ location transfer within a country will not benefit to ISU of economically backward cities.
Sample Data and Variables
Sample Data
In 2008, IPEA and NRDC jointly developed the pollution information transparency index (PITI), including 113 cities in China. Among these 113 cities, 52 cities belong to Eastern China, 31 cities to Central China, and 30 cities to the Western China. The lowest GDP is 12.9 billion RMB (city of Tongchuan). In comparison, the highest GDP is 1,406.9 billion RMB (city of Shanghai), indicating that sample cities are not limited to large-scale cities or small cities and can represent the basic situation of Chinese cities. Meanwhile, there may be heterogeneity for RBCs and NRBCs. According to the National Plan for Sustainable Development of Resource-Based Cities, we divided sample cities into RBCs (36 cities) and NRBCs (77 cities) to analyze the impact of ER on ISU. Hence, annual data of 113 cities are used in this study during the period 2008–2017. The sample data are from the China Statistical Yearbook (2009–2018), the China City Statistical Yearbook (2009–2018), the China Statistical Yearbook of Science and Technology (2009–2018), and CSMAR database.
Dependent Variables
Industrial structural upgrade (ISU) is the dependent variable. Industry structure upgrading is a dynamic process that changes the value of the primary, secondary, and tertiary industries. The critical feature of the industrial structure upgrade is that the growth rate of the tertiary industry is faster than the growth rate of the secondary industry (Wu, 2013). We use the proportion of the output value of the third industry to the second industry to measure ISU because it reflects whether the industrial structure is developing to service-oriented (Zhou et al., 2017).
Explanatory Variable
Environmental regulation (ER): single indicator such as investment in industrial pollution control, total energy consumption, and treatment rate of industrial wastewater and gas (Domazlicky and Weber, 2004; Lanoie et al., 2008; Zhang et al., 2010; Qian and Liu, 2014) can be used. Alternatively, comprehensive indicators (Zhang et al., 2019) can be used as a proxy variable of ER, but it is still more challenging to measure ER. The PITI conducts eight indicators that reflect the information of government environmental supervision, enterprises’ emission, and public participation. Suppose a city has a high PITI score, in that case, it means this city has released more environmental information and more public participation in environmental protection, and made more effects to protect environment. Based on this, this study uses the PITI to measure ER.
Control Variables
The process of industry structure upgrading is more complex, affected by many economic and social factors. In this study, the major influencing factors are introduced in the method of control variable. 1) Investment in fixed assets (INV): According to Xie et al. (2021), the change in investment structure is closely related to green transformation and green development. The ratio of investment in fixed assets to GDP is used to the level of investment in fixed assets. 2) Foreign direct investment (FDI): It is controversial that FDI promotes ISU in the existing literature. FDI brings advanced management mode and technology, and improves the environmental quality of inflow areas (Eskeland and Harrison, 2003; Zhao and Niu, 2013). However, according to the “PHH” hypothesis, List and Co (2000) found that FDI also decreases the environmental quality of inflow areas by transferring pollution enterprises. In view of this, the ratio of FDI to GDP is used to measure the level of FDI. 3) Government intervention (GOV): The local industry structure has largely been affected by governments’ policies (Lin, 2012). According to Pan et al. (2008), the government’s fiscal expenditure ratio to GDP is used to measure GOV. D) Urbanization (UR): Urbanization can promote population flowing and resource agglomeration, and achieve an external economy. There exists a positive correlation between urbanization and ISU (Han et al., 2012). Urbanization is measured by the ratio of the urban population to the total population. Table 1 shows the descriptive statistics of the above variables.
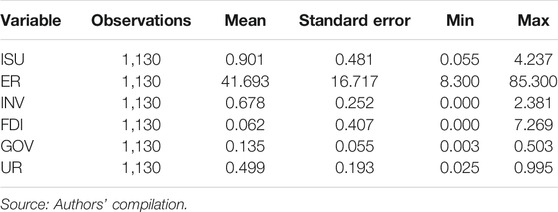
TABLE 1. Major variables’ statistics.
Model and Results Analysis
Model
The panel data model has cross-sectional and time dimensions. Its data capacity is usually large, which can effectively increase the reliability of the regression model and overcome missing variables to some degree. A panel model containing major variables is established in this study. The empirical model is as follows:
where i means the sample city, t means the time, and ISU is the dependent variable, which means industry structure upgrading. X means control variables, and it includes investment in fixed assets (INV): government intervention (GOV), foreign direct investment (FDI), and urbanization (UR); φ means the individual fixation effect; δ means the time fixation effect; and ε means the random error term.
The Test of Multiple Collinearities
Variance inflation is used to detect the collinearity problem of the linear regression model. Table 2 shows the result of variance inflation, and it indicates that the maximum numerical value of variance inflation is 1.95 and the minimum is 1.03. The numerical values of variance inflation of all variables are less than 10. Therefore, it can be inferred that the problem of multiple collinearities among variables is likely to be smaller.

TABLE 2. Variance inflation (VIF).
Empirical Results Analysis
Before examining the impact of ER on industrial structure, we make the LM test and Hausman test for the sample data. The p-values of the LM test and Hausman test are 0.00, and this indicates that the fixed-effects model is available in this study. Table 3 shows the regression results. First, the regression coefficient of ER for ISU in the OLS model is 0.209, and the level of significance is 1% in the whole sample. The OLS model ignores individual effects, which may cause bias in the regression results. Then, we use the fixed-effects model to study the impact of ER on ISU. The regression coefficient of the fixed-effects model is 0.148, and the level of significance is 1%. It shows that ER can produce a positive effect on ISU for sample cities. There exists a possibility of a win-win situation for environmental protection and economic growth.
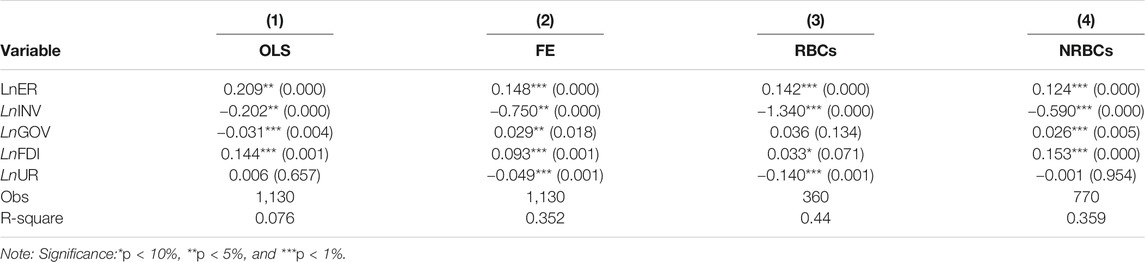
TABLE 3. ER’s influence on the ISU.
In terms of control variables, the regression coefficient of investment in fixed assets (INV) is −0.75, obviously negative. It shows that the increasing ratio of investment in fixed assets will make the capital and investment harder to flow into the third industry, and then it will be difficult to promote industry structure upgrading. Since the reforming and opening-up, many industries have gotten rapid growth and formed a much larger scale in China. However, the overcapacity and low technology level of industries have produced serious pollution problems and set obstacles to upgrade the industrial structure for these industries. The coefficient of FDI is 0.093, and the level of significance is 1%, which shows that FDI plays a positive role in ISU. The strict ER in developed countries drives pollution enterprises to developing countries with low ER standards and reduces environmental quality. In recent years, Chinese governments have realized the importance of environment protection and prefer to attract clean FDI. This is conducive to promoting the spillover effects of technology, management, and capital brought about by FDI (Howell, 2019), and produced a positive effect on ISU. The regression coefficient of government intervention (GOV) is generally positive. Fiscal expenditures have a sustainable influence on industrial structural upgrade by increasing the industry's capital stock and improving labor productivity. The regression coefficient of UR is −0.049, which is statistically significant. It shows that as the speed of UR slowed down in China, the role of UR in promoting ISU has become less and less, and even hindered.
Robustness Test
This article studies the impact of ER on ISU in RBCs and NRBCs, but other factors may affect the reliability of the empirical conclusions. In order to enhance the credibility, the robustness tests are made as follows: 1) Change the regression model: The unobservable variables affecting ISU or the correlation between the dependence variable’s lagged term and individual effects of stochastic disturbance can easily lead to endogenous problems. According to Blundell and bond (1998) and Sebastian (2017), SYS-GMM is more effective as it contains horizontal and difference estimation in a system and uses the lagging variable as an instrument variable. Hence, the SYS-GMM is used as a method of robustness test. 2) Replacing variables of ISU: Scholars have not established a uniformed indicator to measure ISU. Based on this, we remeasured ISU again. According to Yu and Wang (2021), the ratios of the first, second, and third industries are used to measure ISU. This measurement indicator, giving the third industry a higher weight, can more sensitively test the changes in the ratio of the third industry. The measurement indicator is as follows:
where yi means the ratio of i industry in local GDP. The higher the value of STRU, the higher the level of industrial structure is. 3) Replace the variable of ER: The impact of ER on enterprises is reflected in the changes in the discharge of various pollutants. Based on the existing literature and data availability, the annual sulfur dioxide (SO2) emission data of sample cities are used to measure ER in this study. The data are divided by one million tons and then processed by logarithm, named LnER2. The results are shown in Tables 4, 5. The SYS-GMM is used in Table 4. The coefficients of LnER and LnER2 are significant, and they have positive impacts on ISU or STRU. When sample cities were divided into RBCs and NRBCs, ER has a significant positive effect on ISU or STRU of RBCs and NRBCs. To sum up, the results of Tables 4, 5 show that the previous conclusions are stable.
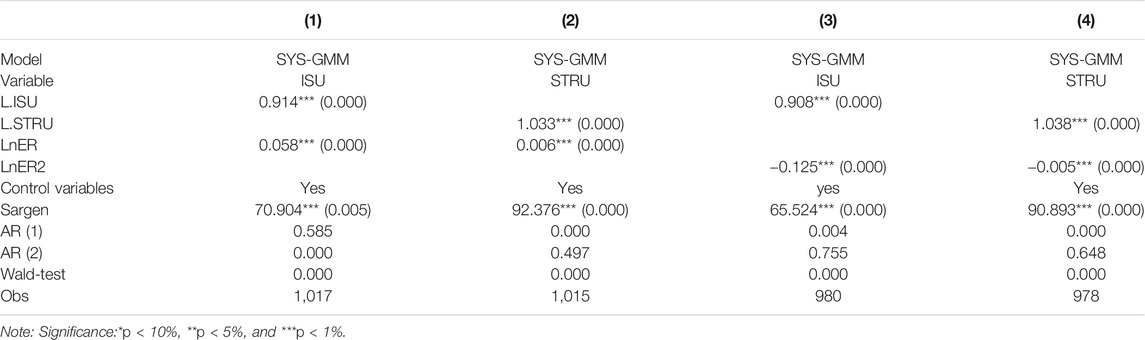
TABLE 4. Robustness test 1.
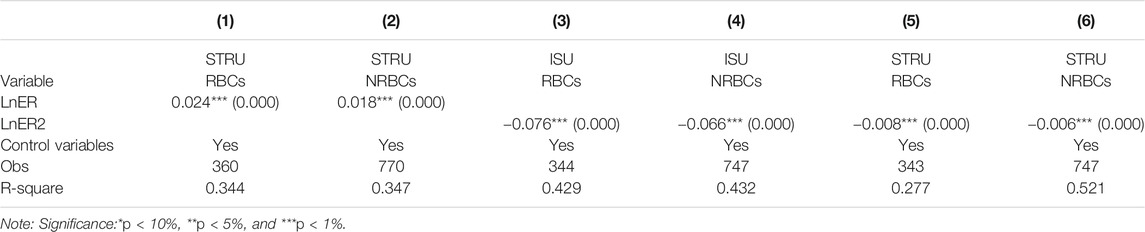
TABLE 5. Robustness test 2.
Heterogeneity Analysis
The previous empirical result has found the positive effect of ER on ISU, but there might exist the heterogeneity effects of ER on ISU in cities with different resource endowment, regions, and growth stages.
Hence, we conduct the heterogeneity analysis from the perspectives of RBCs and NRBCs, spatial heterogeneity, and growth-stage heterogeneity.
RBCs and NRBCs
A resource-based city is a city with mining and processing of natural resources such as minerals and forest as its leading industry ((Martinez-Fernandez et al., 2012). The overexploitation of some RBCs leads to the problems of high energy consumption, high pollution, and high emission projects. Promoting the sustainable development of RBCs is of great significance for building a resource-saving and environment-friendly society. Depending on the National Plan for Sustainable Development of Resource-Based Cities (2013–2020), we divided the sample cities into 36 RBCs and 77 NRBCs. The results are shown in the third and fourth columns of Table 3. The regression coefficient of RBCs and NRBCs are 0.142 and 0.124, respectively, and the significance is 1%. It shows that ER’s positive influence on ISU and the influence on the RBCs are much stronger than those on NRBCs. Compared to NRBCs, RBCs’ economic growth heavily relies on resource-type industries, and the industry structure is relatively simple. The high-energy, high-pollution, and high-emission industries of RBCs produce serious environmental pollution problems. ER has significantly forced the withdrawal of outdated production capacity of RBCs, promoted the flow of production factors from the industrial sector to the tertiary industry, and promoted ISU.
Spatial Heterogeneity
Since there might exist heterogeneity in the impact of ER on ISU in different regions, we divided sample cities into eastern, central, and western regions.3 The empirical results are shown in Table 6. The regression results indicate that regional heterogeneity exists. According to Table 6, the impact of ER on ISU of eastern regions is much stronger than those of ER on ISU of the central and western regions in resource-based cites and NRBCs. The central and western regions with backward economy depend on high-pollution and energy-consumption industries for economic development, which leads local governments prefer economic growth to environmental protection (Yasmeen et al., 2020). Local governments in eastern regions make more efforts to control environmental pollution. Therefore, the impact of ER on ISU is more significant in the eastern region.
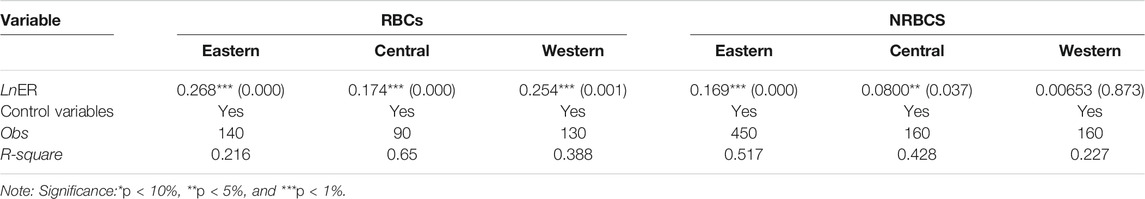
TABLE 6. The impact of ER on ISU from different regions.
Growth-Stage Heterogeneity
According to the National Resource-Based City Sustainable Development Plan (2013–2020), the RBCs are divided into growth, mature, declining, and regenerative cities.4 Resource development is at an early stage in growth cities, but in mature cities, resource exploitation is at a stable level. In declining cities, resources are depleting, but regenerative cities are no longer dependent on natural resources. The difference between these cities may produce different impacts of ER on ISU. The regression result is revealed in Table 7.
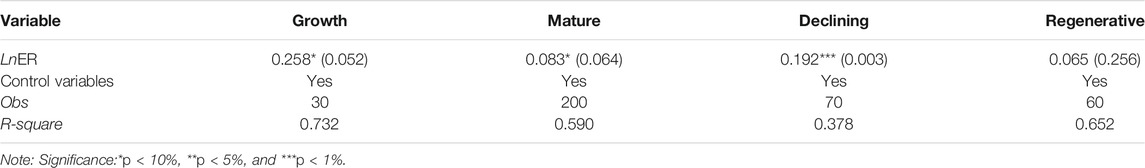
TABLE 7. Discussion on RBCs in different city life cycles.
Table 7 shows that the regression results of growth, mature, and declining cites are significantly positive and that of regenerative cities is not significant. It indicates that there exists growth-stage heterogeneity in RBCs for the impact of ER on ISU. Facing ER, growth cities can actively introduce green production equipment and technologies, formulate environment-friendly and scientific long-term plans for resource extraction, and pay attention to the coordinated development of different industries. In mature cities, resource industries usually occupy the major position in economic development, and the third industry lacks enough attention and development space, which produces the least positive impact of ER on the industrial structure. In declining cities, resource industries have gradually shrunk, environment pollution pressure has risen significantly, and local government has a stronger motivation to upgrade the industrial structure in order to achieve sustainable growth. The impact of ER on declining cities is obvious. Regenerative cities are no longer dependent on natural resources and have undergone green industry transformation through the development of artificial intelligence, big data, new energy, and other industries. Therefore, ER has little impact on ISU in regenerative cities.
Mechanism Test
The previous findings show that ISU of RBCs and NRBCs can be significantly promoted by ER. Then, how does ER produce an effect on ISU? According to Porter et al. (1995), reasonable stringency of environmental regulatory policies is helpful to technological innovations. Taking the expense of pollution control as proxy variable of ER, Rubashkina et al. (2015) found that ER promotes the enterprises’ R&D activities. Turken et al. (2020) found that ER impels enterprises to focus more on green technology innovation in order to reduce emissions. Even though ER will significantly increase production costs in the short time, technological innovation enables enterprises to gain long-term competitive advantage. In addition, technological innovation can promote ISU through upgrading traditional industries, eliminating backward production capacity, and strengthening the coordination in different industries (Debnath, 2015).
The mediation effect model could be used to examine whether explanatory variable affects explained variable through mediation variable (Gonzalez and Mackinnon, 2016). To measure the mediation effect of technological innovation, the mediation effect model is made as follows:
where LnTECH represents technology innovation, LnER represents ER, and LnISU represents ISU. If the coefficients of α, β, and γ are all significant, the mediation effect of technological innovation exists. A number of patent applications and patent inventions, R&D investment, and number of researchers (Fabrizi et al., 2018; Plank and Doblinger, 2018; Dong and Wang, 2019) have been used to measure technology innovation in the existing literature. The full-time equivalent of R&D personnel is suitable for measuring technological innovation in cities due to statistical differences and large data gaps. According to Wang et al. (2018), the number of prefecture-level cities engaged in scientific research and technical service personnel is approximately selected to measure technological innovation.
Table 8 shows that the coefficients of the impact of ER on technological innovation in RBCs and NRBCs are 0.347 and 0.328, respectively, which is statistically significant. Both ER and technological innovation have positive and significant effects on ISU in resource-based cites and NRBCs. Hence, there exists the significant mediation effect of technological innovation between ER and ISU. It also indicates that the innovation compensation effect of ER is more significant than the “follow cost effect,” and it is conducive to stimulating the innovation activities of enterprises and promoting ISU. The ratio of the mediating effect of technological innovation to the total effect is 25.7% for RBCs and 29.1 for NRBCs. It might be caused by the reason that compared to NRBCs, ER of RBCs not only promoted high-pollution enterprises and overcapacity enterprises, which do not meet the environmental standards and quit from the market, but also promoted enterprises’ technological innovation.

TABLE 8. Estimation of the influence of ER on technological innovation.
Further Discussion
The previous empirical results indicate that ER has a significant impact on ISU and there exists the significant heterogeneity between ER and ISU in RBCs and NRBCs. The mediation effect of technological innovation is further confirmed. Meanwhile, there are extensive nonlinear relationships between economic variables (Lu et al., 2019; Serdar and Ismet, 2019). Due to the difference in technological innovation of RBCs and NRBCs, there might be a nonlinear relationship between ER and ISU based on technological innovation. The threshold effect model divides the variables into multiple threshold values according to the variables’ characteristics and studies the relationship between the variables in different intervals. To further study whether the nonlinear relationship between ER and ISU exists, a fixed panel threshold effect model is established as follows:
where LnTECH is the threshold variable, μis is the threshold value, and I (*) is the indicator function.
To test the threshold effects between ER and ISU based on technological innovation, the threshold numbers should be examined first. After taking bootstrap estimation 1,000 times, the results of threshold numbers in RBCs and NRBCs are shown in Table 9. In RBCs, the tests for the single-threshold effect and double-threshold effect are significant, and p-values are 0.06 and 0.03, respectively. However, the test for the three-threshold effect is not significant, and p-value is 0.58. In NRBCs, the test for the single-threshold effect is significant, and p-value is 0.07, while the test for the double-threshold effect is insignificant and p-value is 0.11. The results in Table 9 show that there exist the threshold effects between ER and ISU in RBCs and NRBCs.
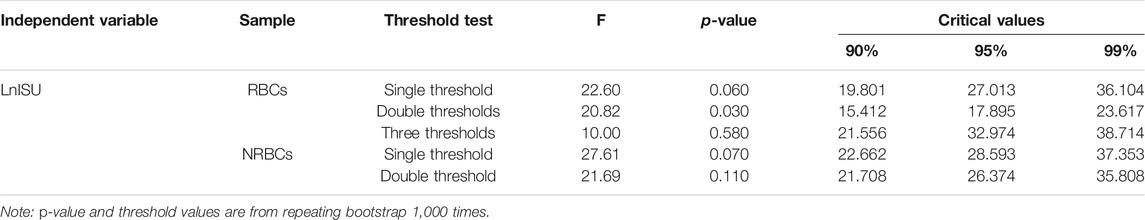
TABLE 9. Test for the existence of threshold.
Table 10 shows the results of the panel threshold effect model for RBCs and NRBCs. In RBCS, when LnTECH ≤ −3.507 (TECH≤0.03), the coefficient of ER is 0.0112, and it indicates that increasing technological innovation can promote the impact of ER on ISU. When −3.507 < LnTECH ≤ −1.020 (0.03 < TECH ≤ 0.3606), the coefficient of ER is 0.0930. When LnTECH ≥ −1.020 (TECH ≥ 0.3606), the coefficient of ER is 0.135. It indicates that with continuous increasing of technological innovation, ER will produce increasing effects on ISU. Compared to NRBCs, RBCs’ economic growth heavily relies on natural resource industries, and other industries develop slowly and have lower proportions in the industrial structure. When technological innovation reaches a certain level, ER can significantly stimulate the compensation effect of technological innovation, promote the development of green and clean industries, and thus promote ISU. Hence, taking more technological innovation can help RBCs to achieve a win-win situation in environment protection and ISU as soon as possible. In NRBCs, when LnTECH ≤ −0.3442 (TECH ≤ 0.7088), the coefficient of ER is 0.101. When LnTECH ≥ −0.3442 (TECH ≥ 0.7088), the coefficient of ER is 0.125. It indicates that with the increasing of technological innovation, ER will produce increasing positive effect on ISU. The threshold value of NRBCs is higher than that of RBCs, which indicates that NRBCs need more technological innovations to release the positive effect of ER on ISU.
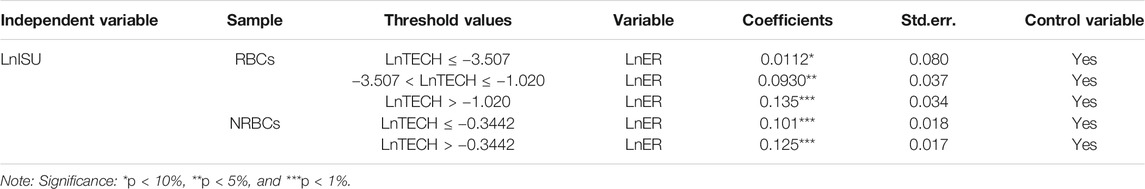
TABLE 10. Panel threshold regression.
Conclusion and Policy Recommendations
In this study, we use the PITI to measure environmental regulation (ER) of 113 cites during 2008–2017 in China. The sample cities are divided into RBCs and NRBCs to study the impact of ER on ISU. Then, we analyze the heterogeneity of spatial and growth-stage heterogeneities in RBCs and NRBCs. Furthermore, the mediation and the threshold effect of technological innovation are examined. The main conclusions are as follows: first, ER has a significant impact on ISU, and robust tests proved the reliability of this result. Second, analysis of heterogeneity shows ER has a stronger role in promoting ISU in RBCs and the eastern region. Meanwhile, inside RBCs, ER has a stronger impact on ISU in growth RBCs than other RBCs. Third, the mechanism test shows that the mediation effect of technological innovation is significant in RBCs and NRBCs. At last, the impact of ER on ISU has a double-threshold effect in RBCs and a single-threshold effect in NRBCs. With the increasing technological innovation, ER produces increasing effect on ISU of RBCs and NRBCs.
Based on the conclusion of this study, some recommendations are discussed as follows. First, local governments should pay more attention to drive ISU by ER. Meanwhile, there exists significant ER difference in Chinese cities. In 2017, the highest PITI score was 81(Wenzhou), while the lowest score was only 19 (Datong). Local governments should make differentiated ER to release compelling effect of ER on ISU. Second, RBCs are facing stronger conflicts between environmental protection and economic growth. RBCs should continue ER and support green and low-carbon industries, promote ISU to get rid of dependence on natural resources, and achieve a win-win situation for economic growth, ISU, and environmental protection. Third, local governments of RBCs and NRBCs should encourage more technological innovation activities by increasing R&D investment, tax incentives, and subsidies, and guide more funds and R&D personnel to green industries. At last, the establishment of the PITI is based on environmental information disclosure, and this study verifies its positive effect on ISU. Local governments should release more environmental information to the public and guide the public to actively participate in environmental protection and improve their environmental awareness.
Data Availability Statement
The original contributions presented in the study are included in the article/Supplementary Material; further inquiries can be directed to the corresponding authors.
Author Contributions
Conceptualization, WS; Formal analysis, WS; Investigation, XB; Methodology, YY; Software, YY; Validation, FT-H; Writing - original draft, WS and YY; Writing - review & editing, XB, FT-H. All authors have read and agreed to the published version of the manuscript.
Conflict of Interest
The authors declare that the research was conducted in the absence of any commercial or financial relationships that could be construed as a potential conflict of interest.
Publisher’s Note
All claims expressed in this article are solely those of the authors and do not necessarily represent those of their affiliated organizations, or those of the publisher, the editors and the reviewers. Any product that may be evaluated in this article, or claim that may be made by its manufacturer, is not guaranteed or endorsed by the publisher.
Footnotes
1http://www.ipe.org.cn/reports/reports.aspx?cid=18336&year=0&key=. It includes “contamination information of daily violations of pollution sources,” “cleaning production audit information,” “concentration information on pollution sources,” “information on sewage charges,” “integrated evaluation information of corporate environmental behavior,” and “acceptance of environmental impact assessment documents for construction projects” The construction project completion environmental protection acceptance results information, “the investigation and verification of the public on environmental issues or corporate pollution of the petition complaints and their processing results,” and “according to the application disclosure” eight aspects.
2The National Plan for Sustainable Development of Resource-Based Cities (2013–2020) promulgated by the State Council on December 3, 2013. http://www.gov.cn/zfwj/2013-12/03/content_2540070.htm (Accessed on May 26, 2021)
3The region division standard is based on the 2017 National Bureau of Statistics.
4Refer to the resource-based city classification in the National Resource-Based City Sustainable Development Plan (2013–2020) published by the State Council of China in 2013.
References
Bjorner, T. B., Hansen, L. G., and Russell, C. S. (2004). Environmental Labeling and Consumers’ Choice-An Empirical Analysis of the Effect of the Nordic Swan. J. Environ. Econ. Manag. 47 (3), 411–434. doi:10.1016/j.jeem.2003.06.002
Blackman, A., and Kildegaard, A. (2010). Clean Technological Change in Developing-Country Industrial Clusters: Mexican Leather Tanning. Environ. Econ. Pol. Stud. 12 (3), 115–132. doi:10.1007/s10018-010-0164-7
Blundell, R., and Bond, S. (1998). Initial Conditions and Moment Restrictions in Dynamic Panel Data Models. J. Econom. 87 (1), 115e143. doi:10.1016/s0304-4076(98)00009-8
Borghesi, S., Cainelli, G., and Mazzanti, M. (2015). Linking Emission Trading to Environmental Innovation: Evidence from the Italian Manufacturing Industry. Res. Pol. 44 (3), 669–683. doi:10.1016/j.respol.2014.10.014
Chakraborty, P., and Chatterjee, C. (2017). Does Environmental Regulation Indirectly Induce Upstream Innovation? New Evidence from India. Res. Pol. 46 (5), 939–955. doi:10.1016/j.respol.2017.03.004
Chen, S. (2015). Environmental Pollution Emissions, Regional Productivity Growth and Ecological Economic Development in China. China Econ. Rev. 35, 171–182. doi:10.1016/j.chieco.2014.08.005
Cohen, M. A., and Tubb, A. (2018). The Impact of Environmental Regulation on Firm and Country Competitiveness: a Meta-Analysis of the porter Hypothesis. J. Assoc. Environ. Resource Economists 5 (2), 371–399. doi:10.1086/695613
Cui, J., and Ji, Y. (2011). “The Environment, Trade and Innovation with Heterogeneous Firms, a Numerical Analysis.” in AAEA Working Paper, Pittsburgh, Pennsylvania, July 24-26, 2011, 103478.
Dam, L., and Scholtens, B. (2012). The Curse of the haven: the Impact of Multinational enterprise on Environmental Regulation. Ecol. Econ. 78 (12), 148e156. doi:10.1016/j.ecolecon.2012.04.011
Debnath, S. C. (2015). Environmental Regulations Become Restriction or a Cause for Innovation - A Case Study of Toyota Prius and Nissan Leaf. Proced. - Soc. Behav. Sci. 195 (3), 324–333. doi:10.1016/j.sbspro.2015.06.360
Domazlicky, B. R., and Weber, W. L. (2004). Does Environmental Protection Lead to Slower Productivity Growth in the Chemical Industry?. Environ. Resource Econ. 28 (3), 301–324. doi:10.1023/b:eare.0000031056.93333.3a
Dong, Z. Q., and Wang, H. (2019). The Effect of Environmental Regulation on green Technology Progress of "local Neighborhood. China’s Ind. Econ. 1 (1), 100–118.
Du, W., and Li, M. (2020). Influence of Environmental Regulation on Promoting the Low-Carbon Transformation of China's Foreign Trade: Based on the Dual Margin of export enterprise. J. Clean. Prod. 244, 118687. doi:10.1016/j.jclepro.2019.118687
Duzgorenaydin, N. (2007). Sources and Characteristics of lead Pollution in the Urban Environment of Guangzhou. Sci. Total Environ. 385 (1), 182–195. doi:10.1016/j.scitotenv.2007.06.047
Eskeland, G. S., and Harrison, A. E. (2003). Moving to Greener Pastures? Multinationals and the Pollution haven Hypothesis. J. Develop. Econ. 70 (1), 1–23. doi:10.1016/s0304-3878(02)00084-6
Fabrizi, A., Guarini, G., and Meliciani, V. (2018). Green Patents, Regulatory Policies and Research Network Policies. Res. Pol. 47, 1018–1031. doi:10.1016/j.respol.2018.03.005
Feng, M., and Li, X. (2020). Evaluating the Efficiency of Industrial Environmental Regulation in China:A Three-Stage Data Envelopment Analysis Approach. J. Clean. Prod. 242, 118535. doi:10.1016/j.jclepro.2019.118535
Franco, C., and Marin, G. (2013). The Effect of Within-Sector, Upstream and Downstream Energy Taxes on Innovation and Productivity. Environ. Resour. Econ. 97 (9), 1–31. doi:10.2139/ssrn.2378884
Gonzalez, O., and Mackinnon, D. P. (2016). A Bifactor Approach to Model Multifaceted Constructs in Statistical Mediation Analysis. Educ. Psychol. Meas. 78 (1), 5–31. doi:10.1177/0013164416673689
Gray, W. B., Shadbegian, R. J., Wang, C., and Meral, M. (2014). Do EPA Regulations Affect Labor Demand? Evidence from the Pulp and Paper Industry. J. Environ. Econ. Manag. 68 (1), 188e202. doi:10.1016/j.jeem.2014.06.002
Greenstone, M. (2001). The Impacts of Environmental Regulations on Industrial Activity: Evidence from the Evidence from the 1970&1977. Clean Air Act Amendments and the Census of Manufactures. Available at: http://www.nber.org/papers/w8484.
Han, X., Wu, P. L., and Dong, W. L. (2012). An Analysis on Interaction Mechanism of Urbanization and Industrial Structure Evolution in Shandong, China. Proced. Environ. Sci. 13 (1), 1291–1300. doi:10.1016/j.proenv.2012.01.122
Howell, A. (2019). Industry Relatedness, FDI Liberalization and the Indigenous Innovation Process in China. Reg. Stud. 54, 1–15. doi:10.1080/00343404.2019.1623871
Lanoie, P., Patry, M., and Lajeunesse, R. (2008). Environmental Regulation and Productivity: Testing the Porter Hypothesis. J. Prod. Anal. 30 (2), 121–128. doi:10.1007/s11123-008-0108-4
Li, C. (2019). How Does Environmental Regulation Affect Different Approaches of Technical Progress?-Evidence from China's Industrial Sectors from 2005 to 2015. J. Clean. Prod. 209, 572–580. doi:10.1016/j.jclepro.2018.10.235
Liao, X., and Shi, X. (2018). Public Appeal, Environmental Regulation and green Investment: Evidence from China. Energy Policy 119, 554–562. doi:10.1016/j.enpol.2018.05.020
Lin, Y. F. (2012). New Structural Economics and the Way of China's Development. China Market 50 (1), 3–8.
List, J. A., and Co, C. Y. (2000). The Effects of Environmental Regulations on Foreign Direct Investment. J. Environ. Econ. Manage. 40 (1), 1–20. doi:10.1006/jeem.1999.1095
Liu, X., and Wang, Q. (2016). An Optimal Emission Mechanism of Sustainability of China: How to Achieve a Win-Win Solution between Economy and Environment?. J. Syst. Sci. Inf. 4 (6), 534–546. doi:10.21078/jssi-2016-534-13
Liu, Q. L., Wang, Q., and Liu, Y. (2012). Study on the Relationship between Economic Growth, International Trade and Pollution Emissions: Empirical Analysis on the SO2 Emissions in the United States and China. China Popul. Resour. Environ. 5 (5), 170–176.
Lu, S., Zhang, X., Wang, J., and Pei, L. (2016). Impacts of Different media on Constructed Wetlands for Rural Household Sewage Treatment. J. Clean. Prod. 127, 325–330. doi:10.1016/j.jclepro.2016.03.166
Lu, S., Bai, X., Li, W., and Wang, N. (2019). Impacts of Climate Change on Water Resources and Grain Production. Technol. Forecast. Soc. Change 143, 76–84. doi:10.1016/j.techfore.2019.01.015
Lu, S., Dai, W., Tang, Y., and Guo, M. (2020a). A Review of the Impact of Hydropower Reservoirs on Global Climate Change. Sci. Total Environ. 711, 134996. doi:10.1016/j.scitotenv.2019.134996
Lu, S., Li, J., Xiao, B., and Guo, M. (2020b). Analysis of Standard Accounting Method of Economic Compensation for Ecological Pollution in Watershed. Sci. Total Environ. 737, 138157. doi:10.1016/j.scitotenv.2020.138157
Lyon, T. P., and Maxwell, J. W. (2003). Self-regulation, Taxation, and Public Voluntary Environmental Agreements. J. Public Econ. 87 (7), 1453–1486. doi:10.1016/s0047-2727(01)00221-3
Martin, R., Muûls, M., PREUX, D. E., Wagner, U. J., and Wagner, Ulrich, J. (2014). Industry Compensation under Relocation Risk: a Firm-Level Analysis of the EU Emissions Trading Scheme. Am. Econ. Rev. 104 (8), 2482–2508. doi:10.1257/aer.104.8.2482
Martinez-Fernandez, C., Wu, C.-T., Schatz, L. K., Taira, N., and Vargas-hernández, J. G. (2012). The Shrinking Mining City: Urban Dynamics and Contested Territory. Int. J. Urban Reg. Res. 36 (2), 245–260. doi:10.1111/j.1468-2427.2011.01094.x
Millimet, D., Roy, S., and Sengupta, A. (2009). Environmental Regulations and Economic Activity: Influence on Market Structure. Annu. Rev. Resour. Econ. 1 (1), 99–118. doi:10.1146/annurev.resource.050708.144100
Mulatu, A., Gerlagh, R., Rigby, D., and Wossink, A. (2010). Environmental Regulation and Industry Location in Europe. Environ. Resource Econ. 45, 459–479. doi:10.1007/s10640-009-9323-3
Pan, H. B., Xia, X. P., and Yu, M. G. (2008). Government Intervention, Political Connection and Mergers and Acquisitions of Local State-Owned Enterprises. Econ. Res. 4 (04), 41–52.
Plank, J., and Doblinger, C. (2018). The Firm-Level Innovation Impact of Public R&D Funding: Evidence from the German Renewable Energy Sector. Energy Policy 113, 430–438. doi:10.1016/j.enpol.2017.11.031
Porter, M. E., Van, Der., and Linde, C. (1995). Toward a New conception of the Environment-Competitiveness Relationship. J. Econ. Perspect. 9 (4), 91–118. doi:10.1257/jep.9.4.97
Qian, z., and Liu, X. C. (2014). Environmental Regulation, Industrial Structure Adjustment and Regional Economic Development. Economist 7 (05), 73–81.
Qiu, L. D., Zhou, M., and Wei, X. (2018). Regulation, Innovation, and Firm Selection: the porter Hypothesis under Monopolistic Competition. J. Environ. Econ. Manage. 92, 638–658. doi:10.1016/j.jeem.2017.08.012
Ramanathan, R., He, Q., Black, A., Ghobadian, A., and Gallear, D. (2016). Environmental Regulations, Innovation and Firm Performance: A Revisit of the Porter Hypothesis. J. Clean. Prod. 155 (2), 79–92. doi:10.1016/j.jclepro.2016.08.116
Rassier, D. G., and Earnhart, D. (2015). Effects of Environmental Regulation on Actual and Expected Profitability. Ecol. Econ. 112, 129–140. doi:10.1016/j.ecolecon.2015.02.011
Rochlitz, M., Kulpina, V., Remington, T., and Yakovlev, A. (2015). Performance Incentives and Economic Growth: Regional Officials in Russia and China. Eurasian Geogr. Econ. 56, 421–445. doi:10.1080/15387216.2015.1089411
Rubashkina, Y., Galeotti, M., and Verdolini, E. (2015). Environmental Regulation and Competitiveness: Empirical Evidence on the Porter Hypothesis from European Manufacturing Sectors. Energy Policy 83 (35), 288–300. doi:10.1016/j.enpol.2015.02.014
Ryan, S. P. (2012). The Costs of Environmental Regulation in a Concentrated Industry. Econometrica 80 (3), 1019–1061. doi:10.3982/ecta6750
Sebastian, Kripfganz. (2017). XTDPDGMM: Stata Module to Perform Generalized Method of Moments Estimation of Linear Dynamic Panel Data Models. Statistical Software Components S458395, Boston College Department of Economics, Revised 08 October 2020. https://ideas.repec.org/c/boc/bocode/s458395.html January 18, 2021).Accessed
Serdar, O., and Ismet, G. (2019). Re-Considering the Fisher Equation for South Korea in the Application of Nonlinear and Linear ARDL Models. Quant. Finance Econom. 3 (1), 75–87. doi:10.3934/QFE.2019.1.75
Sun, C., Zhang, F., and Xu, M. (2017). Investigation of Pollution haven Hypothesis for China: an ARDL Approach with Breakpoint Unit Root Tests. J. Clean. Prod. 161, 153–164. doi:10.1016/j.jclepro.2017.05.119
Tian, X. L., Guo, Q. G., Han, C., and Ahmad, N. (2016). Different Extent of Environmental Information Disclosure Across Chinese Cities: Contributing Factors and Correlation with Local Pollution. Glob. Environ. Change 39, 244–257. doi:10.1016/j.gloenvcha.2016.05.014
Turken, N., Carrillo, J., and Verter, V. (2020). Strategic Supply Chain Decisions under Environmental Regulations: when to Invest in End-Of-Pipe and green Technology. Eur. J. Oper. Res. 283, 601–613. doi:10.1016/j.ejor.2019.11.022
Wang, F. Z., Jiang, T., and Guo, X. C. (2018). Government Quality, Environmental Regulation and Enterprise Green Technological Innovation. Scientific Res. Manage. 39 (01), 26–33.
Wu, J., Wei, Y. D., Chen, W., and Yuan, F. (2019). Environmental Regulations and Redistribution of Polluting Industries in Transitional China: Understanding Regional and Industrial Differences. J. Clean. Prod. 206, 142–155. doi:10.1016/j.jclepro.2018.09.042
Wu, Jinglian. (2013). The Choice of China’s Growth Model. Fourth Edition. Shanghai: Shanghai Far East Publishers.
Xie, L., Li, Z., Ye, X., and Jiang, Y. (2021). Environmental Regulation and Energy Investment Structure: Empirical Evidence from China's Power Industry. Technol. Forecast. Soc. Change 167, 120690. doi:10.1016/j.techfore.2021.120690
Yang, C.-H., Tseng, Y.-H., and Chen, C.-P. (2012). Environmental Regulations, Induced R&D, and Productivity: Evidence from Taiwan's Manufacturing Industries. Resource Energ. Econ. 34 (4), 514–532. doi:10.1016/j.reseneeco.2012.05.001
Yao, S., and Liang, H. (2017). Firm Location, Political Geography, and Environmental Information Disclosure. Appl. Econ. 49, 251–262. doi:10.1080/00036846.2016.1194966
Yasmeen, H., Tan, Q., Zameer, H., Tan, J., and Nawaz, K. (2020). Manuscript Title: Exploring the Impact of Technological Innovation, Environmental Regulations, and Urbanization on Ecological Efficiency of China in the Context of COP21. J. Environ. Manage. 274, 1–9. doi:10.1016/j.jenvman.2020.111210
Yin, K., Wang, R., An, Q., Yao, L., and Liang, J. (2014). Using Eco-Efficiency as an Indicator for Sustainable Urban Development: a Case Study of Chinese Provincial Capital Cities. Ecol. Indicators 36, 665–671. doi:10.1016/j.ecolind.2013.09.003
Yu, X., and Wang, P. (2021). Economic Effects Analysis of Environmental Regulation Policy in the Process of Industrial Structure Upgrading: Evidence from Chinese Provincial Panel Data. Sci. total Environ. 753, 142004. doi:10.1016/j.scitotenv.2020.142004
Yuan, B., Ren, S., and Chen, X. (2017). Can Environmental Regulation Promote the Coordinated Development of Economy and Environment in China's Manufacturing Industry?-A Panel Data Analysis of 28 Sub-sectors. J. Clean. Prod. 149, 11–24. doi:10.1016/j.jclepro.2017.02.065
Zhang, W. B., Zhang, L. Q., and Zhang, K. Y. (2010). Interprovincial Competition Patterns and Evolution of Environmental Regulation Intensity in China: Based on Durbin Fixed Effect Model of Two-Zone System Space. Manage. World 12 (1), 34–44.
Zhang, G. X., Zhang, P. D., Zhang, Z. G., and Li, J. X. (2019). Impact of Environmental Regulations on Industrial Structure Upgrading: an Empirical Study on Beijing-Tianjin-Hebei Region in China. J. Clean. Prod. 238, 1–11. doi:10.1016/j.jclepro.2019.117848
Zhang, M., Sun, X., and Wang, W. (2020). Study on the Effect of Environmental Regulations and Industrial Structure on Haze Pollution in China from the Dual Perspective of independence and Linkage. J. Clean. Prod. 256, 120748. doi:10.1016/j.jclepro.2020.120748
Zhao, Q., and Niu, M. Y. (2013). Influence Analysis of FDI on China's Industrial Structure Optimization. Proced. Comput. Sci. 17 (1), 1015–1022.
Zhao, X., Liu, C., and Yang, M. (2018). The Effects of Environmental Regulation on China's Total Factor Productivity: an Empirical Study of Carbon-Intensive Industries. J. Clean. Prod. 179, 325–334. doi:10.1016/j.jclepro.2018.01.100
Zhou, P., Delmas, M. A., and Kohli, A. (2017). Constructing Meaningful Environmental Indices: a Nonparametric Frontier Approach. J. Environ. Econ. Manage. 85, 21–34. doi:10.1016/j.jeem.2017.04.003
Keywords: environmental regulation, industrial structure upgrading, technological innovation, resource-based cities, Chinese cities
Citation: Shao W, Yin Y, Bai X and Taghizadeh-Hesary F (2021) Analysis of the Upgrading Effect of the Industrial Structure of Environmental Regulation: Evidence From 113 Cities in China. Front. Environ. Sci. 9:692478. doi: 10.3389/fenvs.2021.692478
Received: 08 April 2021; Accepted: 11 June 2021;
Published: 23 July 2021.
Edited by:
Yongping Sun, Hubei University Of Economics, ChinaReviewed by:
Solomon Prince Nathaniel, University of Lagos, NigeriaJingjing Jiang, Harbin Institute of Technology, Shenzhen, China
Copyright © 2021 Shao, Yin, Bai and Taghizadeh-Hesary. This is an open-access article distributed under the terms of the Creative Commons Attribution License (CC BY). The use, distribution or reproduction in other forums is permitted, provided the original author(s) and the copyright owner(s) are credited and that the original publication in this journal is cited, in accordance with accepted academic practice. No use, distribution or reproduction is permitted which does not comply with these terms.
*Correspondence: Xiao Bai, YmFpeGlhb0B6dWZlLmVkdS5jbg==; Farhad Taghizadeh-Hesary, ZmFyaGFkQHRzYy51LXRva2FpLmFjLmpw