 Wiwin Ambarwulan1*
 Irmadi Nahib1
 Widiatmaka Widiatmaka2
 Jaka Suryanta1Sri Lestari Munajati1Yatin Suwarno1Turmudi Turmudi1Mulyanto Darmawan1
 Dewayany Sutrisno1
- 1Geospatial Information Agency, Cibinong, Indonesia
- 2Department of Soil Science and Land Resources, Bogor Agricultural University (IPB University), Bogor, Indonesia
Land degradation (LD) is an important issue worldwide because it affects food production and people’s welfare. Many factors cause land degradation, but in humid tropical areas, erosion is the main factor. More than 100 countries including Indonesia are affected by LD. Watershed management should be prioritized owing to budget constraints, while on the other side, the area affected by LD is very large compared to the size of the existing land area. The middle Citarum sub-watershed (MCSW) is one of the most degraded drylands in Indonesia, where the environment can be considered a typical humid tropical watershed. The objective of this study was to map degraded lands and prioritize restoration using a combined approach of the universal soil loss equation (USLE), the analytical hierarchy process (AHP) and geographic information systems (GIS) in a multiple-criteria decision analysis (MCDA) environment. The severity of LD was estimated quantitatively by analyzing the parameters of land use and land cover, slope, soil erosion, productivity, and management. The results indicated that the MCSW is dominated by the potentially degraded land classes (38%), followed by the degraded land classes (21%). The prioritization of LD restoration is suggested in the area of very high and high degraded land. The method developed in this research work could be adopted as a tool to guide decision-makers toward sustainable land resource management in humid tropical watersheds affected by LD.
1 Introduction
Land degradation (LD) is a dynamic environmental process that can reduce ecosystem functions and disrupts agricultural production. The implications of LD include environmental setbacks and reduced food security as well as diminished sustainable economy (Zhao et al., 2013). LD refers to the reduced or lost biological and economic productivity of agricultural land or forests resulting from human activities (Expert Group on SDG Indicators [IAEG-SDGs], 2016). In the past two decades, LD has affected more than 20% of the vegetated land area and affects more than 1.5 billion people worldwide (United Nations Convention to Combat Desertification [UNCCD], 2017). The global issue of LD has become the target of the Sustainable Development Goals (SDGs).
LD can be caused by physical, chemical, and biological factors of the soil (Brevik et al., 2015), as well as human factors (Khaledian et al., 2017). It has been estimated that around 30% of the world’s land is degraded (Lal, 2015; Nkonya et al., 2016). Bai et al. (2008) have estimated that the area of the degraded land worldwide is 18.1 m km2, 92% of which due to land mismanagement. In the past 45 years, LD has caused world rice yields to decline by an estimated 1.6–2.7% and financial losses to exceed US$ 10.6 billion (Chen et al., 2012). The depletion of natural resources due to LD can occur in dry and subhumid climates alike (Omuto et al., 2014).
Many natural resource processes can cause LD including erosion, deforestation, soil compaction, soil acidity, salting, and desertification (Turner et al., 2016). Among the various forms of LD, water erosion represents the most important form (Hermassi and Amami, 2018). In Indonesia, the main cause of LD is erosion owing to high rainfall intensity. Erosion-induced LD is an environmental problem that occurs worldwide, causing land productivity to decline (García–Ruiz et al., 2013). Indonesia’s land area covers 191.19 m ha, which is dominated by 144.47 m ha (75.60%) of dry land; hence, erosion-induced LD can affect a large area. Indeed, dry land is very vulnerable to erosion and degradation. The area of degraded land in Indonesia in 2018 was estimated at 14 million ha (Indonesian Statistics, 2020), and its restoration will be expensive. Thus, it is necessary to prioritize the handling of land affected by LD. As targeted in the SDGs, degraded land needs to be restored. Funding for watershed restoration is limited, and so it is important to define priority areas in order to optimize the results.
Geographic information systems (GISs) can be used throughout the watershed restoration process. Several studies related to the prioritization of watersheds for conservation actions have been carried out, specifically on soil erosion (Singh et al., 2019; Choudhary et al., 2020), watershed morphometry (Mohammed et al., 2018; Tukura et al., 2021), and the sediment yield index (Jang et al., 2013). Furthermore, Ahmad and Pandey (2018) have used the GIS to map LD. Thus, the GIS can be used to map complex and spatial LD (AbdelRahman, 2014).
Multiple-criteria decision analysis (MCDA) integrates GIS models with decision-making processes and is widely used in complex natural resource and environmental management, including watershed management (Halefom et al., 2019). Many MCDA methods are available, one of which uses the analytical hierarchy process (AHP) (Saaty, 2008) to carry out weighting before being integrated with GIS (Hassan et al., 2015; Widiatmaka et al., 2016). MCDA integrating the AHP with GIS can be applied in the study of LD because the model is very flexible, enabling possible decisions to be made based on both quantitative and qualitative data (Weerakoon, 2014). Many researchers have used MCDA approaches for LD mapping. AbdelRahman et al. (2019) considered soil, slope, rainfall, DEM, land use, and spatial land characteristics. Gessesse et al. (2015) studied LD using the land use/land cover (LULC) dynamics model, while in Iraq, Shareef et al. (2020) combined LULC change with the GIS and AHP model in order to consider LULC parameters such as urban area and vegetation.
Many models have been used to estimate soil loss due to water erosion, one of which is the universal soil loss equation (USLE) (Wischmeier and Smith, 1978). This is one of the most relevant methods for assessing soil loss (Alewell et al., 2019). Several researchers (Kefi et al., 2009; López–García et al., 2020) have integrated the USLE and GIS in their studies.
Citarum watershed is a degraded watershed in Indonesia. It plays an important role in the economy and the lives of the inhabitants of the provinces of West Java, for instance, for water supply for irrigation, industry, and energy supply through electric power generation. The Citarum watershed is one of the most eroded watersheds in Indonesia. Therefore, its conservation needs to be prioritized.
The objective of this research was to estimate the LD caused by soil erosion by applying the USLE along with the GIS and the AHP in MCDA approaches, in order that this degraded land area’s restoration can be prioritized. The MCDA considered five parameters: LULC, soil erosion, slope, management, and productivity. One part of the Citarum watershed, namely, the middle Citarum sub-watershed (MCWS), was chosen as the study area, owing it to having the characteristics of natural resources in a humid tropical environment. Referring to the extent of a degraded land area in Indonesia, this method for prioritization needs to be developed in typical areas so that it can be extended to other areas.
2 Materials and Methods
2.1 Location Description
The MCSW has an extension of 71,091.66 ha or 21.94% of the Citarum watershed. The MCSW is located in Purwakarta Regency, Indonesia. Geographically, the MCSW area extends between 107°13′12.4″–107°35′2.7″ east and 6°26′49.9″–6°46′36.7″ south. The MCSW has a tropical climate with a temperature range of 20–30°C and receives 1,000–4,000 mm of rainfall per year. Some soil types that make up the MCSW are Dystrudepts, Eutrudepts, Hapludalfs, and Hapludands. The MCSW is dominated by a hilly morphology with elevations 200–800 m above sea level and slopes ranging from 3 to 40%.
2.2 Data Input
This study used a topographic map at a scale of 1:25,000 (Indonesian Geospatial Information Agency [IGIA], 2015), monthly rainfall data for 2010–2019 (Meteorological, Climatological, and Geophysical Agency, 2020), a soil map at a scale of 1:50,000 (Indonesian Center for Agricultural Land Resources Research and Development, 2017), a map of the official regional spatial plan (ORSP) of Purwakarta Regency (Development Planning Agency, 2012), and SPOT 6 imagery of May 26, 2019. Maps and image interpretation results were processed with GIS to obtain thematic maps in order to make soil erosion maps, LD maps, and a priority watershed restoration map. Mostly, the data type used in this study is in a vector format.
2.3 Methods
This research was divided into four stages: calculating the weight of each criterion of LD using the AHP model, calculating soil erosion using the USLE model, preparing thematic maps for mapping LD, and making a map of LD and the prioritization of its handling. The research area was divided into three areas with different LULC: protection forests and conservation forests (PFCFs), production forests, and areas protected outside forest areas (PFPO), and cultivation, agriculture/plantation, and other use areas (CAPO). The differentiation between the three areas was based on the fact that the distinctive LULC and area statuses implied differences in the amount of erosion as well as the conservation measures needed. The ORSP map was used to divide the three areas, covering 5.34, 65.58, and 28.97% for PFCF, PFPO, and CAPO, respectively.
2.3.1 Calculating Weight Using the Analytical Hierarchy Process
The LD map was developed based on the parameters: LULC, slope, soil erosion, productivity, and management. The AHP was applied to weight these parameters, via three steps: creating a hierarchy of problem structures, priority analysis by comparing each parameter in pairs to obtain weights, and verification by calculating the consistency in pairwise comparisons. Five experts in the field of land degradation and watershed management were involved in determining the weights. The consistency of expert opinions was verified by determining the consistency ratio value (Saaty, 2008). The weights were given to describe the extent to which each criterion contributed to LD. Five experts were involved in weight estimation to create a pairwise comparison matrix. A scale of 1–9 was used to identify the importance of the LD parameters: if two criteria were equally important, it was given a weight of 1, while a weight of 9 indicated that one criterion was more important than the others. The sub-criteria scoring assessment was based on the weight of each sub-criterion determined by the experts.
2.3.2 Prediction of Erosion Using Universal Soil Loss Equation
Erosion was predicted using the USLE model and was applied spatially using ArcGIS to integrate the parameters of Eq. 1. According to the Indonesian government standard document (Indonesian Ministry of Forestry [IMF], 2013), soil erosion loss (A) is divided into five levels: very severe (A > 480 t ha−1y−1), severe (180 ≥ A ≤ 480 t ha−1y−1), moderate (60 ≥ A< 180 t ha−1y−1), slight (15 ≥ A <60 t ha−1y−1), and very slight (<15 t ha−1y−1).
where A is the average annual soil loss per unit area (t ha−1 y−1), R is the rainfall erosivity factor (MJ mm ha−1 h−1 y−1), K is the soil erodibility factor (t h MJ−1 mm−1), LS is the slope length and slope steepness factor, C is the cover and management factor, and P is the support and conservation practice factor.
Rainfall Erosivity Factor
The annual rainfall values of 2010–2019 were used to calculate the R factor based on monthly rainfall using Eq. 2 (Li et al., 2014). The R factor reflects the impact of raindrops on the ground (Wischmeier and Smith, 1978).
where Pi is the monthly precipitation.
Soil Erodibility Factor
The K factor reflects the rate of soil loss per rainfall erosivity index. The K factor varies from 0 to 1; a low K value indicates less susceptibility to soil erosion. K values were calculated using Eq. 3 (Hammer, 1978).
where M is (very fine sand % + silt %) x (100–clay %), a is the organic matter content (%), b is the soil structure code, and c is the soil permeability code. Analysis of the soil texture and the soil organic content was carried out in the laboratory of the Department of Soil Science, IPB University, Indonesia.
Slope Length and Slope Steepness
LS is the ratio of soil loss on a standard slope with a length of 72.6 feet and a slope of 9%. The values of length (L) and slope (S) can be gathered from the table in Wischmeier and Smith (1978).
Cover and Management Factor
This factor reflects the effect of planting and tillage on soil erosion rates. It ranges from 1 to 0. A value equal to 1 indicates no land cover and is treated as barren land, whereas a value close to 0 indicates a very strong cover effect, the soil being well-protected from erosion. The value of C in this study was obtained from the C index table (Wischmeier and Smith, 1978) and applied to the land use map.
Conservation Practices Factor
This factor is a reflection of the application of soil conservation practices such as planting in strips and terracing. In this study, the p value was obtained from the land cover and the P table (Wischmeier and Smith, 1978) prevailing in Indonesia.
2.3.3 Preparation Input Map for the Land Degradation Map
LULC
The LULC map was obtained from a visual interpretation by on-screen digitizing using ArcGIS 10.6.1 of SPOT 6 satellite imagery. The LULC is classified into 10 classes based on the Indonesian National Standard (SNI) for LULC, specifically SNI No. 7645.1: 2014. The field check has been done on July 2020 for validation. The overall accuracy and a KAPPA analysis were 89.00 and 86.3%, respectively. The 10 classes are forests, shrubs, gardens/moors, plantation, seasonal plants, open land, water bodies, rice fields, settlements, and non-settlement buildings. In this study, LULC was reclassified into five LD classes: very good, good, moderate, bad, and very bad.
Slope
Slope classes were created from the results of the contour layer processing on the topographic map using ArcGIS 10.6.1. The slope class criteria were based on the guidelines P.4/V-Set/2013 (Indonesian Ministry of Forestry [IMF], 2013).
Productivity
Productivity is an important factor when assessing degraded land in agricultural areas. It was calculated based on comparing the productivity achieved by rice and maize with the average productivity under traditional management. The productivity classifications for LD were divided into very high, high, moderate, low, and very low (Indonesian Ministry of Forestry [IMF], 2013).
Management
Management was used to assess LD based on the completeness of parameters: management aspects, the existence of area boundaries, security and supervision, and whether or not counseling is implemented. The management criteria in determining LD were divided into good, moderate, and bad.
2.3.4 Mapping Land Degradation and Prioritizing Restoration
LD was analyzed using five thematic map inputs. Each criterion was reclassified based on the score of each sub-criterion. An overlay was carried out using ArcGIS software on the reclassified thematic map, multiplied by the respective criterion weights generated from the AHP. Subsequently, the LD map was reclassified into five classes: very highly degraded, highly degraded, degraded, potentially degraded, and non-degraded. The prioritization of watershed management is very important in natural resource management, especially in the context of integrated watershed development and limited watershed restoration funding. Planners and decision makers should therefore pay attention to restoration prioritization. In this study, prioritization restoration was carried out by assigning a rating to the level of LD, divided into three classes: high priority, moderate priority, and low priority.
3 Results and Discussion
3.1 Weight of Criteria
The pairwise comparison and weight values of the criteria obtained from the AHP are presented in Table 1. According to the judgments of the five experts, the highest weight values were given to the LULC in the PFCF and PFPO areas, with weights of 0.519 and 0.502, respectively. These high weight values can be explained by the fact that in these two forest areas, changes in the LULC easily cause land to become degraded. Such findings are in line with the results of Narendra et al.’s (2019) research on the island of Lombok, Indonesia, which has similar environmental conditions. In CAPO areas, the highest weights were given to management and productivity, which can be explained by the fact that if mismanagement occurs, the result is decreased land quality and thereby degraded land. Management and productivity are thus important factors in agricultural areas, as also insisted by several researchers (Abera et al., 2020; Han et al., 2020).
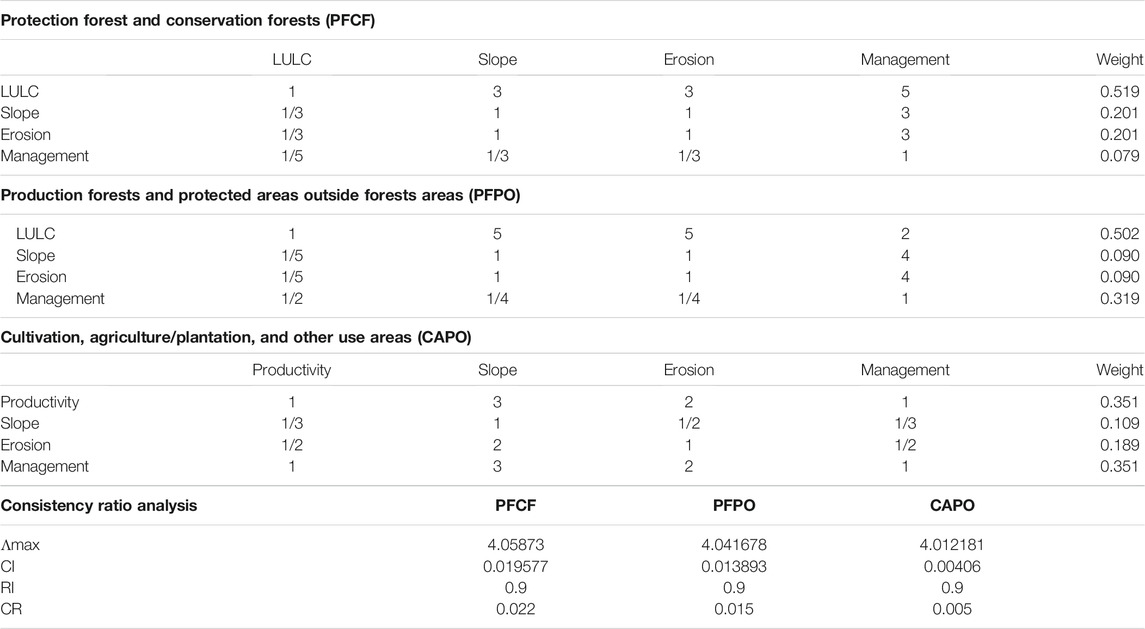
TABLE 1. Calculating Criteria Weights with Consistency Ratio in the MCSW.
AHP is a qualitative approach, in which the primary weakness is subjective and unable to incorporate uncertainty (Hong et al., 2019). The AHP is highly dependent on the selection of appropriate experts to determine the priority scale in pairwise comparisons because it will cause biased opinions among experts (Chen et al., 2021). In this study, anticipation has been done by involving five competent experts in the field of land degradation. This was proved by the consistency of the experts involved in determining the weight, which indicates that this study’s results were very good. Indeed, the consistency ratio was below 10%, as displayed in Table 1.
3.2 Soil Erosion Predicted
The soil erosion predicted using the USLE model in the MCSW, ranging from 0.87 to 495.30 t ha−1 y−1, is presented in Figure 1E and Table 2. The results indicated that soil erosion has a wider range than the soil erosion in Indonesia presented by Adimihardja (2008), which ranges from 35 to 220 t ha−1 y−1. However, the results showed the same trend as recognized by Taslim et al. (2019) in 15 watersheds in Indonesia, where the erosion rate was found to range from 0 to 564 t ha−1 y−1. The large range found in our study suggests high diversity of natural resources, especially LULC. This range of soil erosion was in the humid tropics, as reported by Labrière et al. (2015).
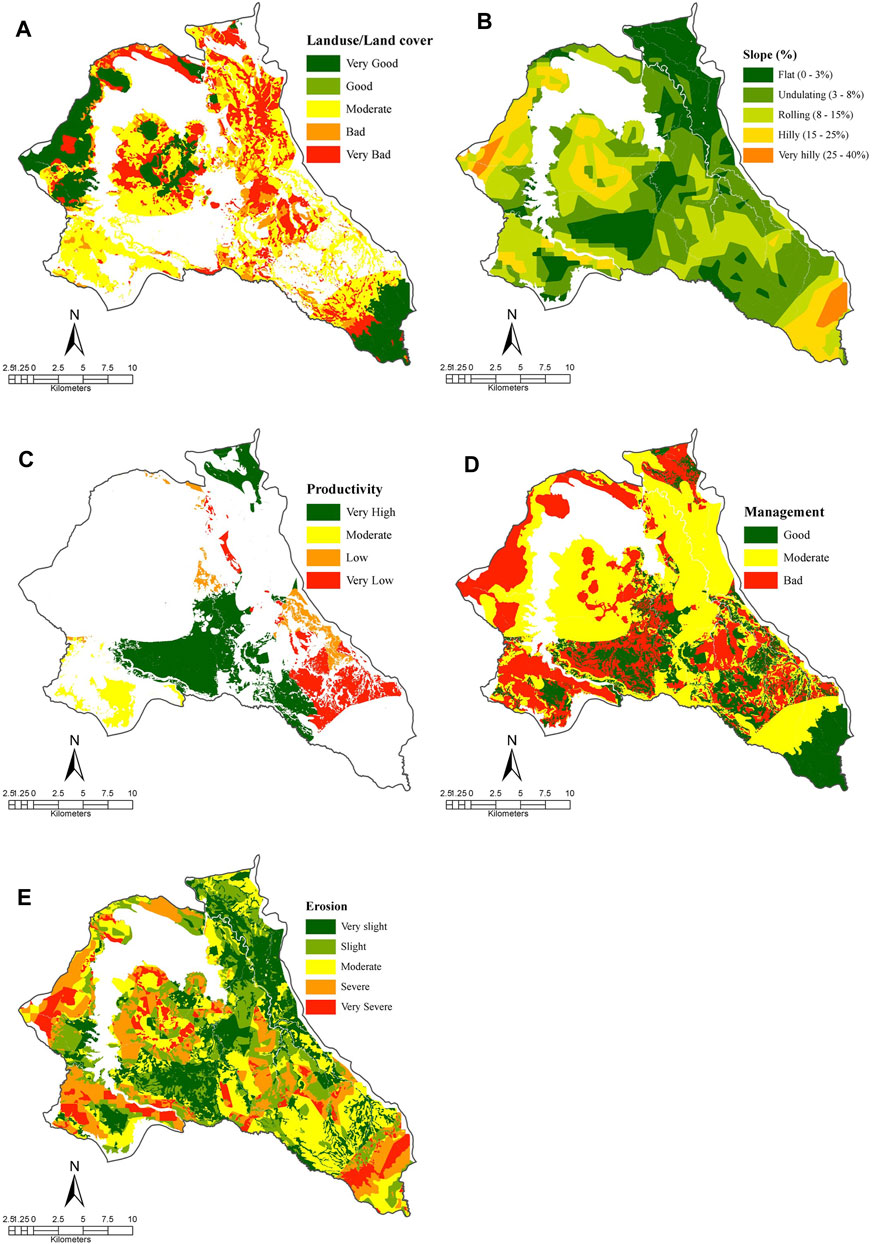
FIGURE 1. Thematic maps for mapping LD.
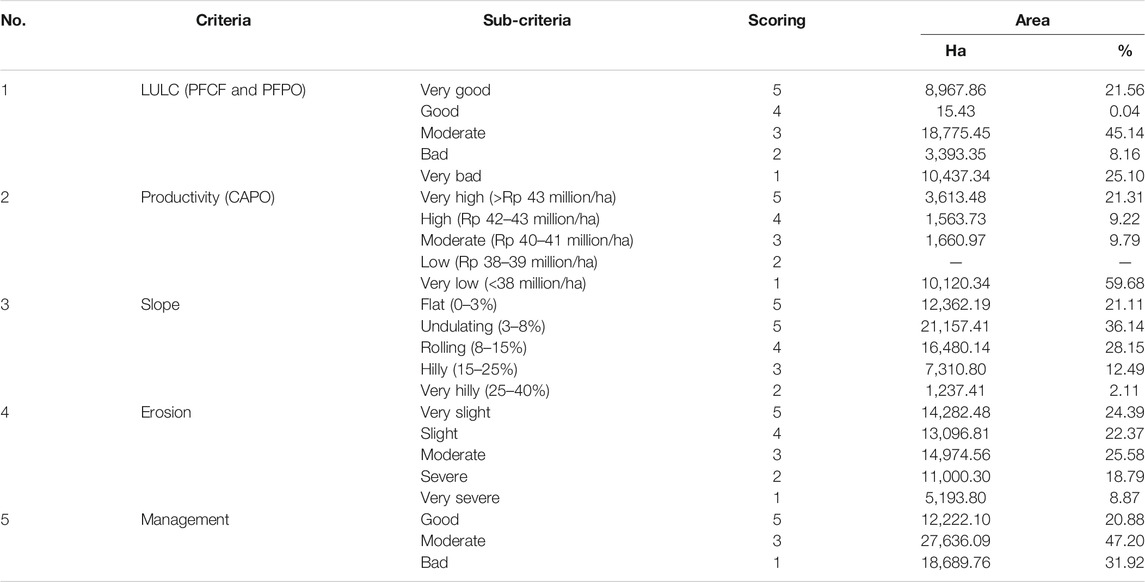
TABLE 2. Selected criteria and sub-criteria involved in the MCSW degraded land classification.
The results indicated that the MCSW was dominated by the light erosion class (15.20–65 t ha−1 y−1), which accounted for 25% and was found in PFPO. The very heavy soil erosion class (>495.30 t ha−1 y−1) was found in 7.30% of the study area and was mainly in the PFPO region. PFPO represents the largest area, occupying 65.58% of the study area. The PFPO region is mainly covered by forests, plantations, non-cultivated vegetation, and shrubs. Based on the USLE factor, the PFPO area is characterized by an LS factor of 1.2, a C factor of 0.05–0.6, and a K factor ranging from 0.18 to 0.21. This area is located on an 8–25% slope. The soil textures were found to be soft and medium. These physical conditions, coupled with human factors, cause this area to face all classes of soil erosion, from very severe to slight, albeit dominated by the former. As has been shown by Vahabi and Nikkami (2008), different soil characteristics influence soil erosion.
The CAPO area was found to be dominated by rice fields and settlements, located on a 0–8% slope. The CAPO area is mostly composed of metamorphic rocks with the main soil types Eutrudepts and Dystrudepts. The soil texture ranges from soft to moderately soft, while soil drainage ranges from good to poor, and soil depth from deep to very deep. This area has a C value of 0.05–0.75, a K factor ranging from 0.06 to 0.32, and an LS factor of 0.25. Consequently, erosion in the CAPO area tends to be quite slight. However, in this environment, which is strongly influenced by human activity, erosion can vary (Dotterweich, 2013).
The PFCF area is located on steep slopes (15–40%) with a coarse to medium-coarse soil texture, good to fast soil drainage, and shallow to deep soil depth. This area is dominated by the protected forest and conservation forest. While the USLE factor in this area is the K value ranging from 0.14 to 0.32, the LS factor was found to be 1–4.25, and the C factor 0.03–0.75. The main soil erosion class in this area was found to be slight. However, the very severe erosion class was found in locations bordering the PFPO area due to land clearing activities, which disturb the forest area and cause soil erosion.
3.3 Thematic Inputs Map and Degraded Land Map
The impacts of LULC, erosion, slope, productivity, and management on LD are presented in Figure 1 and Table 2. The LULC in the MCSW was found to be dominated by plantations (24.23%) and paddy fields (24.62%). The results of the reclassification based on the LULC indicated that MCSW were dominated by the medium-degraded land classes (45%) (Figure 1A; Table 2). The impact of slopes on LD is presented in Figure 1B and Table 2. The result of the reclassification of slope classes indicated that the MCSW is dominated by potentially degraded classes (36.14%) and slightly degraded class (28.15%) land classes. The impact of productivity on LD is presented in Figure 1C and Table 2. The productivity factor was one of the criteria used to assess LD in the CAPO areas. The reclassification of the productivity factor revealed that 59.68% of the MCSW has low productivity, meaning that it is highly degraded. The impact of management on LD is presented in Figure 1D and Table 2. The results of the management factor reclassification showed that 47.20% (CAPO areas) has moderate management factors, followed by 31.92% (PFPO areas) with poor management, rendering these places prone to LD.
3.4 Land Degradation Prioritization
In this article, certain criteria have been specified to study the degree of degradation and then create a map of prioritizing for watershed restoration. The distribution of LD in the MCSW is presented in Figure 2 and Table 3. The results show that the area of degraded land in the MCSW is 29,911.95 ha (48.70%), comprising highly degraded (6.96%), degraded (24.64%), and medium-degraded classes (17.10%). The area of the non-degraded class is 31,506 ha (51.30%), divided into potentially degraded (36.19%) and non-degraded (15.11%). The degradation class map demonstrates that the area with very high LD is distributed around the forest PFPO areas. This class is mainly characterized by very severe and severe erosion classes. Non-degraded areas are concentrated in the CAPO area, distributed in the southern part of the study area and covering 15.85% of the area. The non-degraded class is dominated by paddy fields and settlements where the soil erosion can be described as either slightly eroded or moderately eroded. The dominant LD class in this study area is “potentially degraded” referring to the land that has not yet become degraded, but that has the potential to become degraded due to the changes in the LULC and inappropriate land use management. Indeed, changes in the LULC can cause severe soil erosion and LD (Firdaus et al., 2014). Inappropriate land use management is the main cause of LD, as has been discussed by Mohawesh et al. (2015). Potentially degraded land spreads into the CAPO and PFPO areas dominated by very slight and slight soil erosion.
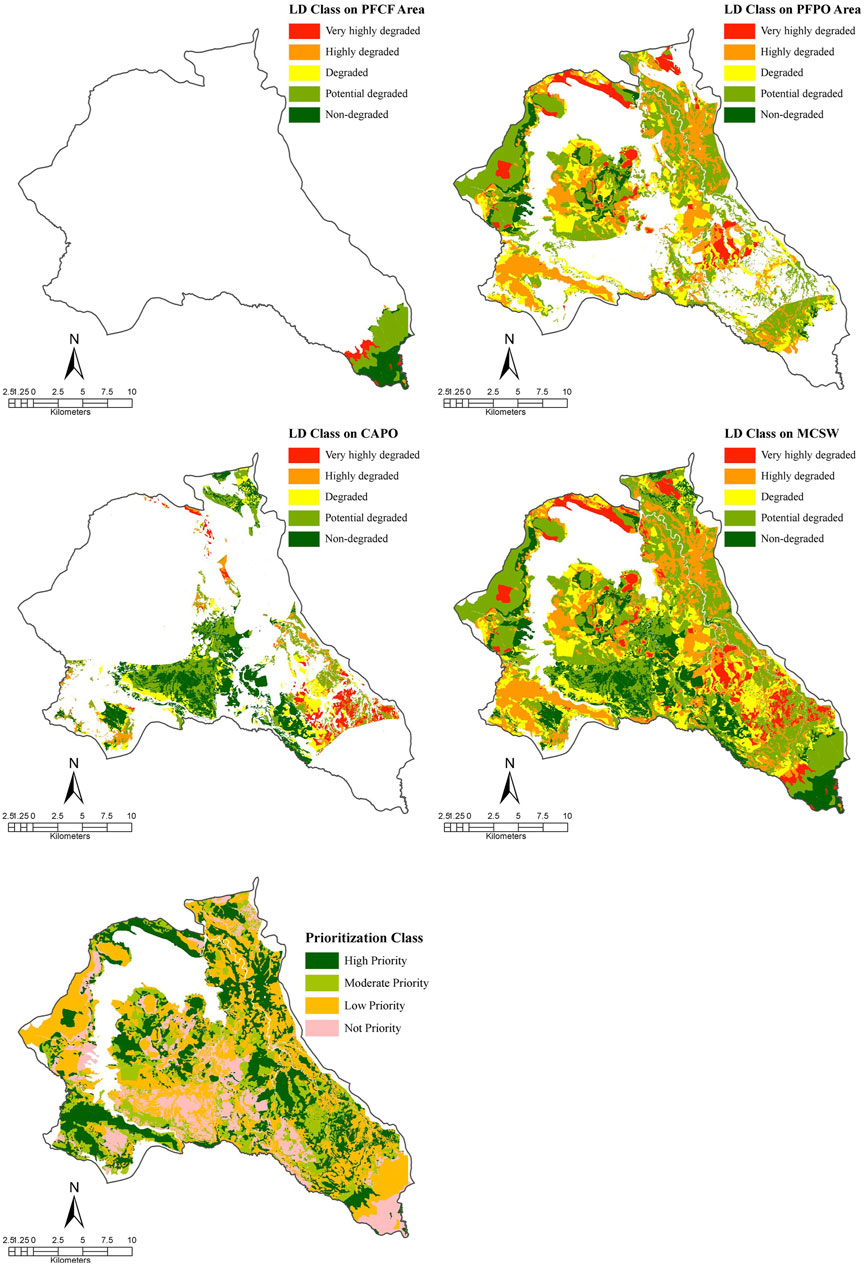
FIGURE 2. LD class map and prioritization map.
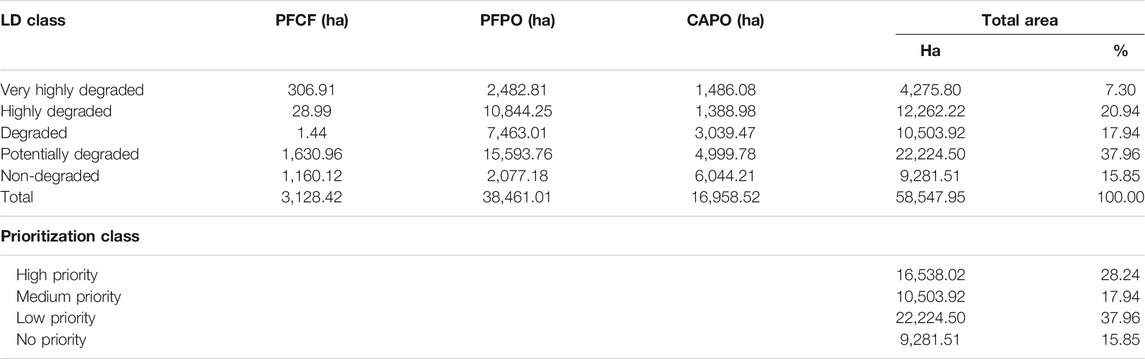
TABLE 3. LD classes and prioritization classes for handling watershed restoration.
The prioritization of watershed management was carried out to identify degraded land with high erosion activity, so that appropriate conservation measures can be taken to minimize soil erosion. The watershed was classified into three priority zones: high priority (highly degraded class and degraded class), medium priority (slightly degraded class), and low priority (potentially degraded class). The prioritization classes can be summarized as follows: 1) high priority, referring to the areas in the MCSW with high soil erosion (28.24%) and hence needing to be prioritized for soil conservation; 2) medium priority (17.94%), characterized by a moderate slope, fine texture, deep solum, good drainage, and metamorphic rocks; and 3) low priority (37.96%), referring to areas facing very light erosion as well as those that are potentially vulnerable, that is, in their existing condition, there is no significant erosion, but if they are not protected, soil erosion will occur. Therefore, soil conservation measures are required to protect against erosion. In our study, prioritization was based on the spatial unit of the LD class. This approach differed from many other studies in watershed prioritization, which have generally been based on prioritizing sub-watershed units (Choudhary et al., 2020). The two approaches are increasingly becoming complementary in watershed management.
4 Conclusion
Most of the study area is characterized by a low rate of soil erosion (38%), while a small part (i.e., 4,275.8 ha, or 7.30%) manifests very severe soil erosion. The resulting map indicates the degree of LD. The results demonstrated that the watershed comprises degraded land (very high, high, and moderate degraded classes), occupying 29,911.95 ha (49%), and non-degraded land (potentially degraded and non-degraded land classes), occupying 31,506 ha (51%) of the study area. The highly degraded class was found to cover an area of 7% of the total area, predominantly in the PFPO areas. The non-degraded class was found to cover an area of 15.85%, particularly in the CAPO areas. The analysis of LD classes and prioritization for handling revealed that 16,538.02 ha (28.24%) of the MCSW areas located on slopes >15% and where soil erosion is very severe or severe need to be treated with soil conservation measures. The results of this study indicate that areas with forest landcover face less LD than cultivated areas, and so forest clearing in cultivation areas needs to be accompanied by land conservation efforts. The study has found that the most significant parameter causing soil erosion–induced LD was LULC as it demonstrated the highest weights in PFCF and PFPO areas. In agricultural areas (CAPO), the highest weights were assigned to the management and productivity parameters. In terms of methodology, the results show the effectiveness of integrating the USLE model with the GIS and AHP in an MCDA environment to map LD classes and the spatial prioritization of watershed restoration. The combination of methodologies used in this study can be used as tools for prioritization management in humid tropical watersheds.
Data Availability Statement
The original contributions presented in the study are included in the article/Supplementary Material further inquiries can be directed to the corresponding author.
Author Contributions
WA and IN were the main contributors of this article, and both contributed to the conceptualization, methodology, analysis, validation, writing the draft, and article preparation. WD, JS, SL, MD, TT, YS, and DS were the contributor members. WD provided support in conceptualization, methodology and analysis, and writing the manuscript. JS, SL, MD, TT, YS, and DS contributed to the field survey and reviewed the manuscript.
Funding
This research was funded by the Geospatial Information Agency, State Budget No 083.01.01.3539.967.001.052.C TA 2020: Spasial Zone Resapan Air pada DAS Citarum (Spatial Water Infiltration Zone in the Citarum Watershed).
Conflict of Interest
The authors declare that the research was conducted in the absence of any commercial or financial relationships that could be construed as a potential conflict of interest.
Publisher’s Note
All claims expressed in this article are solely those of the authors and do not necessarily represent those of their affiliated organizations, or those of the publisher, the editors, and the reviewers. Any product that may be evaluated in this article, or claim that may be made by its manufacturer, is not guaranteed or endorsed by the publisher.
Acknowledgments
The authors wish to thank the Geospatial Information Agency of the Republic of Indonesia, Government of Purwakarta Regency, River Basin Territory Organization or Balai Besar Wilayah Sungai (BBWS) of Citarum-Ciliwung, and National Institute of Aeronautics and Space of Indonesia (LAPAN). We also would like to express our gratitude to the reviewers for their comments and suggestions to this article.
References
AbdelRahman, M. A. E. (2014), Assessment of Land Degradation and Land Use Planning by Using Remote Sensing and GIS Techniques in Chamarajanagar District, Karnataka, Bangalore (India): University of Agricultural Sciences. dissertation.
AbdelRahman, M. A. E., Natarajan, A., Hegde, R., and Prakash, S. S. (2019). Assessment of Land Degradation Using Comprehensive Geostatistical Approach and Remote Sensing Data in GIS-Model Builder. Egypt. J. Remote Sensing Space Sci. 22, 323–334. doi:10.1016/j.ejrs.2018.03.0021110-9823
Abera, W., Assen, M., and Budds, J. (2020). Determinants of Agricultural Land Management Practices Among Smallholder Farmers in the Wanka Watershed, Northwestern highlands of EthiopiaI. Land Use Policy, 99, 104841. doi:10.1016/j.landusepol.2020.104841
Adimihardja, A. (2008). Teknologi Dan Strategi Konservasi Tanah Dalam Kerangka Revitalisasi Pertanian. Pengembangan Inovasi Pertanian 1 (2), 105–124.
Ahmad, N., and Pandey, P. (2018). Assessment and Monitoring of Land Degradation Using Geospatial Technology in Bathinda District, Punjab, India. Solid Earth 9, 75–90. doi:10.5194/se-9-75-2018
Alewell, C., Borrelli, P., Meusburger, K., and Panagos, P. (2019). Using the USLE: Chances, Challenges and Limitations of Soil Erosion Modelling. Int. Soil Water Conservation Res. 7 (3), 1–23. doi:10.1016/j.iswcr.2019.05.004
Bai, Z. G., Dent, D. L., Olsson, L., and Schaepman, M. E. (2008), Global Assessment of Land Degradation and Improvement. 1, Identification by remote sensing. Wageningen: Report 2008/01. ISRIC – World Soil Information.
Brevik, E. C., Cerdà, A., Mataix-Solera, J., Pereg, L., Quinton, J. N., Six, J., et al. (2015). The Interdisciplinary Nature of SOIL. Soil 1, 117–129. doi:10.5194/soil-1-117-2015
Chen, C.-C., McCarl, B., and Chang, C.-C. (2012). Climate Change, Sea Level Rise and rice: Global Market Implications. Climatic Change 110, 543–560. doi:10.1007/s10584-011-0074-0
Chen, J., Chen, S., Fu, R., Wang, C., Li, D., Jiang, H., et al. (2021). Simulation of Water Hyacinth Growth Area Based on Multi-Source Geographic Information Data: An Integrated Method of WOE and AHP. Ecol. Indicators 125, 107574. doi:10.1016/j.ecolind.2021.107574
Choudhary, S., Jaiswal, R. K., Nema, A. K., Thakur, A., and Gangwar, A. (2020). Watershed Prioritization for Soil Conservation Measures Using USPED Model in Nagwan Watershed. Jour. Soi. Wat. Conser. 19 (3), 235–243. doi:10.5958/2455-7145.2020.00032.6
Development Planning Agecy (2012). Purwakarta Regional Spatial Plan 2011-2031. Purwakarta: Development Planning Agecy (Bappeda) of Purwakarta Regency.
Dotterweich, M. (2013). The History of Human-Induced Soil Erosion: Geomorphic Legacies, Early Descriptions and Research, and the Development of Soil Conservation-A Global Synopsis. Geomorphology, 201, 1, 34. doi.org/doi:10.1016/j.geomorph.2013.07.021
Firdaus, R., Nakagoshi, N., Idris, A., and Raharjo, B. (2014). “The Relationship between Land Use/land Cover Change and Land Degradation of a Natural Protected Area in Batang Merao Watershed, Indonesia,” in Designing Low Carbon Societies in Landscapes (Tokyo, Japan: Springer), 239–251. doi:10.1007/978-4-431-54819-5_14
García-Ruiz, J. M., Nadal-Romero, E., Lana-Renault, N., and Beguería, S. (2013). Erosion in Mediterranean Landscapes: Changes and Future Challenges. Geomorphology 198, 20–36. doi:10.1016/j.geomorph.2013.05.023
Gessesse, B., Bewket, W., and Bräuning, A. (2015). Model‐Based Characterization and Monitoring of Runoff and Soil Erosion in Response to Land Use/land Cover Changes in the Modjo Watershed, Ethiopia. Land Degrad. Develop. 26 (7), 711–724. doi:10.1002/ldr.2276
Halefom, A., Teshome, A., and Sisay, E. (2019). GIS-based MCDA Model to Assess Erosion Sensitivity in Gumara Watershed, Blue Nile, Basin Ethiopia. Asian J. Appl. Sci. 12 (2), 61–70. doi:10.3923/ajaps.2019.61.70
Hammer, W. I. (1978). Soil Conservation Report. INS/78/006. Technical Note No. 7. Bogor: Soil Research Institut.
Han, J., Ge, W., Hei, Z., Cong, C., Ma, C., Xie, M., et al. (2020.) Agricultural Land Use and Management Weaken the Soil Erosion Induced by Extreme Rainstorms. Agric. Ecosyst. Environ., 301, 107047. doi:10.1016/j.agee.2020.107047
Hassan, M. S., Mahmud-Ul-Islam, S., and Rahman, M. T. (2015). Integration of Remote Sensing and GIS to Assess Vulnerability of Environmental Degradation in North-Western Bangladesh. Jgis 07, 494–505. doi:10.4236/jgis.2015.75040
Hermassi, T., and Amami, H. (2018). “Evolution of Water and Soil Conservation Interventions in the Merguellil Catchment: Impact on the Agricultural Land protection and the Income of the Local Population,” in Recent Advances in Environmental Science from the Euro-Mediterranean and Surrounding regions.EMCEI 2017. Advances in Science, Technology & Innovation (IEREK Interdisciplinary Series for Sustainable Development). Editors A. Kallel, M. Ksibi, H. Ben Dhia, and N. Khélifi (Cham: Springer). doi:10.1007/978-3-319-70548-4_252
Hong, H., Jaafari, A., and Zenner, E. K. (2019). Predicting Spatial Patterns of Wildfire Susceptibility in the Huichang County, China: an Integrated Model to Analysis of Landscape Indicators. Ecol. Indicators 101, 878–891. doi:10.1016/j.ecolind.2019.01.056
Inter-agency, Expert Group on Sdg Indicators [Iaeg-SDGs] (2016). ‘IAEG-SDGs - SDG Indicators’. Sustainable Development Goals. Available online at: https://unstats.un.org/sdgs/metadata/.
Indonesian Center for Agricultural Land Resources Research and Development (2017). Soil Map Scale 1: 50.000. Bogor: (ICALRRD Agency for Agricultural Research and Development.
Indonesian Geospatial Information Agency [IGIA] (2015). Topographical Map Scale 1:25.000. Bogor: Cibinong.
Indonesian Ministry of Forestry [IMF], (2013). Regulation of the Director General of Watershed Management and Social Forestry Management No. P. 4/V-SET/2013 concerning Technical Guidelines for Compilation of Spatial Data on Critical Land. Jakarta: Indonesian Ministry of Forestry.
Indonesian Statistics (2020). Area of Critical Land by Province and Land Criticality Level in 2006, 2011, 2013, 2018. Available online at: https://www.bps.go.id/dynamictable/2017/02/08/1231/luas-dan-penyebaran-lahan-kritis-menurut-provinsi-tahun-2005-2013-ribu-ha-.html (accessed December, , 2020).
Jang, T., Vellidis, G., Hyman, J. B., Brooks, E., Kurkalova, L. A., Boll, J., et al. (2013). Model for Prioritizing Best Management Practice Implementation: Sediment Load Reduction. Environ. Manage. 51 (1), 209–224. doi:10.1007/s00267-012-9977-4
Kefi, M., Yoshino, K., Zayani, K., and Isoda, H. (2009). Estimation of Soil Loss by Using Combination of Erosion Model and GIS: Case of Study Watersheds in Tunisia. J. Arid Land Stud. 19 (1), 287–290.
Khaledian, Y., Kiani, F., Ebrahimi, S., Brevik, E. C., and Aitkenhead‐Peterson, J. (2017). Assessment and Monitoring of Soil Degradation during Land Use Change Using Multivariate Analysis. Land Degrad. Develop. 28, 128–141. doi:10.1002/ldr.2541
Labrière, N., Locatelli, B., Laumonier, Y., Freycon, V., and Bernoux, M. (2015). Soil Erosion in the Humid Tropics: A Systematic Quantitative Review. Agric. Ecosyst. Environ. 203, 127–139. doi:10.1016/j.agee.2015.01.027
Lal, R. (2015). Restoring Soil Quality to Mitigate Soil Degradation. Sustainability 7, 5875–5895. doi:10.3390/su7055875
Li, L., Wang, Y., and Liu, C. (2014). Effects of Land Use Changes on Soil Erosion in a Fast Developing Area. Int. J. Environ. Sci. Technol. 11, 1549–1562. doi:10.1007/s13762-013-0341-x
López-García, E. M., Torres-Trejo, E., López-Reyes, L., Flores-Domínguez, Á. D., Peña-Moreno, R. D., and López-Olguín, J. F. (2019). Estimation of Soil Erosion Using USLE and GIS in the Locality of Tzicatlacoyan, Puebla, México. Soil Water Res. 15, 9–17. doi:10.17221/165/2018-SWR
Meteorological, Climatological, and Geophysical Agency (2020). (BMKG) Online Data, Central of Database. Only in Certain Cities/Districts). Available online at online: https://dataonline.bmkg.go.id/admin/(accessed October 10).
Mohammed, A., Adugna, T., Adugna, T., and Takala, W. (2018). Morphometric Analysis and Prioritization of Watersheds for Soil Erosion Management in Upper Gibe Catchment. J.Degrade.Min.Land Manage. 06 (1), 1419–1426. doi:10.15243/jdmlm.2018.061.1419
Mohawesh, Y., Taimeh, A., and Ziadat, F. (2015). Effects of Land Use Changes and Soil Conservation Intervention on Soil Properties as Indicators for Land Degradation under a Mediterranean Climate. Solid Earth 6, 857–868. doi:10.5194/se-6-857-2015
Narendra, B. H., Widiatmaka, , , Kusmana, C., Karlinasari, L., and Machfud, (2019), Critical Land Mapping for the Development of Biomass-Based Energy in East Lombok Regency, Indonesia, IOP Conf. 444 Series: Earth and Environmental Science, July 03-August 12, 2019. Bistok, UK: IOP Publiser, 314, 012072. doi:10.1088/1755-1315/314/1/012072
Nkonya, E., Braun, J. V., Mirzabaev, A., Le, Q., Kwon, H. Y., and Kirui, O. (2016). Concepts and Methods of Global Assessment of the Economics of Land Degradation and Improvement Economics of Land Degradation and Improvement—A Global Assessment for Sustainable Development. Berlin, Germany: Springer, P15–P32.
Omuto, C. T., Balint, Z., and Alim, M. S. (2014). A Framework for National Assessment of Land Degradation in the Drylands: a Case Study of Somalia. Land Degrad. Develop. 25, 105–119. doi:10.1002/ldr.1151
Saaty, T. L. (2008). Decision Making with the Analytic Hierarchy Process. Ijssci 1 (1), 83–98. doi:10.1504/ijssci.2008.017590
Shareef, M. A., Ameen, M. H., and Ajaj, Q. M. (2021). Change Detection and GIS-Based Fuzzy AHP to Evaluate the Degradation and Reclamation Land of Tikrit City, Iraq. Geodesy and Cartography 46 (4), 194–203. doi:10.3846/gac.2020.11616
Singh, G., Singh, R. M., Singh, S., Kumar, A. R. S., Jaiswal, R. K., Chandola, V. K., et al. (2019). Multicriteria Analytical Hierarchical Process-Based Decision Support System for Critical Watershed Prioritization of Andhiyarkhore Catchment. Indian J. Soil Conservation 47 (3), 263–272.
Taslim, R., Mandala, M., Mandala, M., and Indarto, I. (2019). Pengaruh Luas Penggunaan Lahan Terhadap Laju Erosi : Studi Pada Beberapa Das Di Wilayah Tapal Kuda Jawa Timur (The Effect of Land Use on Erosion Rate: a Study at Several Watersheds in Tapal Kuda Region, East Java). Jppdas 3 (2), 141–158. doi:10.20886/jppdas.2019.3.2.141-158
Tukura, N. G., Akalu, M. M., Hussein, M., and Befekadu, A. (2021). Morphometric Analysis and Sub-watershed Prioritization of Welmal Watershed, Ganale-Dawa River Basin, Ethiopia: Implications for Sediment Erosion. J. Sediment. Environ. 6, 121–130. doi:10.1007/s43217-020-00039-y
Turner, K. G., Anderson, S., Gonzales-Chang, M., Costanza, R., Courville, S., Dalgaard, T., et al. (2016). A Review of Methods, Data, and Models to Assess Changes in the Value of Ecosystem Services from Land Degradation and Restoration. Ecol. Model. 319, 190–207. doi:10.1016/j.ecolmodel.2015.07.017
United Nations Convention to Combat Desertification [Unccd], (2017). Global Land Outlook. 1st ed. Bonn. Available online at https://www.unccd.int/actions/global-land-outlook-glo.
Vahabi, J., and Nikkami, D. (2008). Assessing Dominant Factors Affecting Soil Erosion Using a Portable Rainfall Simulator. Int. J. Sediment Res. 23 (4), 376–386. doi:10.1016/s1001-6279(09)60008-1
Weerakoon, K. (2014). Suitability Analysis for Urban Agriculture Using GIS and Multi-Criteria Evaluation. Int. J. Agric. Sci. Tech. (Ijast) 2 (2), 69. doi:10.14355/ijast.2014.0302.03
Widiatmaka, A. W., Setiawan, Y., and Walter, C. (2016). Assessing the Suitability and Availability of Land for Agriculture in Tuban Regency, East Java, Indonesia. Appl. Environ. Soil Sci. 2016, 1–13. doi:10.1155/2016/7302148
Wischmeier, W. H., and Smith, D. D. (1978). Predicting Rainfall Erosion Losses: A Guide to Conservation Planning (No. 537). Oregon US: Department of Agriculture, Science and Education Administration, Oregon State University.
Keywords: erosion, LULC, MCDA, prioritization, USLE
Citation: Ambarwulan W, Nahib I, Widiatmaka W, Suryanta J, Munajati SL, Suwarno Y, Turmudi T, Darmawan M and Sutrisno D (2021) Using Geographic Information Systems and the Analytical Hierarchy Process for Delineating Erosion-Induced Land Degradation in the Middle Citarum Sub-Watershed, Indonesia. Front. Environ. Sci. 9:710570. doi: 10.3389/fenvs.2021.710570
Received: 17 May 2021; Accepted: 11 October 2021;
Published: 10 November 2021.
Edited by:
Mohamed Kefi, Centre de Recherches et des Technologies des Eaux, TunisiaReviewed by:
Shareful Hassan, UNDP, BangladeshTaoufik Hermassi, Institut National de la Recherche en Génie Rural, Eaux et Forêts, Tunisia
Copyright © 2021 Ambarwulan, Nahib, Widiatmaka, Suryanta, Munajati, Suwarno, Turmudi, Darmawan and Sutrisno. This is an open-access article distributed under the terms of the Creative Commons Attribution License (CC BY). The use, distribution or reproduction in other forums is permitted, provided the original author(s) and the copyright owner(s) are credited and that the original publication in this journal is cited, in accordance with accepted academic practice. No use, distribution or reproduction is permitted which does not comply with these terms.
*Correspondence: Wiwin Ambarwulan, d19hbWJhcnd1bGFuQHlhaG9vLmNvbQ==, d2l3aW4uYW1iYXJ3dWxhbkBiaWcuZ28uaWQ=