Abstract
Drought is a natural phenomenon caused by a shortage of water resources and has a great impact on agriculture, the economy, and the environment. To study the Spatio-temporal distribution and explore the zonal patterns of drought, this paper took the Yunnan-Guizhou Plateau (YGP) as the research region, selected the air temperature, relative humidity, sunshine duration, wind speed, and precipitation data from 47 meteorological stations on the YGP. First, the standardized precipitation evapotranspiration index (SPEI) was calculated, and then the Spatio-temporal distribution of YGP drought was analyzed with the SPEI, Mann–Kendall test, and principal component analysis (PCA). Finally, the correlations between the average SPEI, drought characteristics extracted from the SPEI, and longitude/elevation/latitude were analyzed with the linear regression method, and then the zonal patterns of the YGP drought were obtained. The results revealed that the annual and seasonal SPEI values mainly decreased. Because the first component of the SPEI (the largest eigenvalue makes it the most important component) in annual and winter had a poor relationship with longitude/elevation, its correlation was weak, while the average SPEI values in other seasons were significantly correlated with longitude/elevation (α = 0.001), and the absolute value of the correlation coefficient was between 0.6879–0.9453. Except for PC1 in annual and winter, PC1 and PC2 were significantly correlated with longitude/elevation (α = 0.001), and the absolute value of the correlation coefficient was between 0.5087–0.9501. The duration, severity, intensity, frequency of drought were significantly correlated with longitude/elevation (α = 0.001) in most situations. The average SPEI values and drought characteristics showed a good multivariate linear correlation with longitude, latitude, and elevation, indicating that drought exhibited strong zonal patterns. This study will provide new ideas for drought research and technical support for regional industrial layouts, planting structure adjustments, and drought and disaster reduction.
Introduction
Recent studies have demonstrated that global climate change has altered precipitation and temperature in different regions (Almazroui et al., 2016; Vinnarasi and Dhanya, 2016; Sung et al., 2017; Salman et al., 2017; Sa’adi et al., 2017; Pour et al., 2018; Tao et al., 2018) and affected the entire hydrological system (Zahabiyoun et al., 2013), thereby increasing the frequency and intensity of drought events (Sung and Chung, 2014; Ahmed et al., 2015; Zhang et al., 2017; Mohsenipour et al., 2018). Furthermore, drought substantially impacts agriculture, the economy, and the ecological environment (Wilhite, 2005; Xiao et al., 2016; Fang et al., 2018; Fang et al., 2019; Huang et al., 2019).
As a result, an increasing number of researchers have studied droughts around the world. Under RCP8.5, global drought will continue to increase (Prudhomme et al., 2014; Chanda and Maity, 2017). In particular, a substantial increase is predicted in most parts of Africa, South America, and Asia (Chanda and Maity, 2017). Moreover, the return period of drought characteristics in North America and Asia will decrease the most by the middle of the century, while South America and Australia will experience the largest decline by the end of the century (Wu et al., 2021). On a smaller scale, many scholars used the Mann–Kendall test, principal component analysis (PCA), and other methods to analyze the spatial-temporal distribution of drought indicators [the Palmer drought severity index (PDSI), the standardized precipitation index (SPI), the standardized precipitation evapotranspiration index (SPEI), etc.] and/or drought characteristics (duration, severity, intensity, frequency, etc.) of South Korea (Azam et al., 2018), Syria (Mathbout et al., 2018), Northeast China (Fu et al., 2018), Southwest China (Wang et al., 2018), the Loess Plateau (Liu et al., 2016), Inner Mongolia (Huang et al., 2015), Turkey (Danandeh Mehr and Vaheddoost, 2020), Northeast Algeria (Merabti et al., 2018), Oklahoma (Tian and Quiring, 2019), Hungary (Alsafadi et al., 2020), Oman (El Kenawy et al., 2020), and South-central Asia (Adnan et al., 2016). The research results for the Yunnan-Guizhou Plateau (YGP) and its adjacent areas showed that the annual (SPEI12) and seasonal (SPEI3) droughts in Southwest China decreased from 1968 to 2018; the drought in the southern region was severe, and the drought frequency increased (Tang et al., 2021). In addition, the frequency, duration, and severity of drought in Southwest China have increased significantly in the past 40 years (Wang M. et al., 2021). According to the revised reconnaissance drought index (RDI) and Mann–Kendall methods, the RDI of the YGP declined annually and in summer, autumn, and winter, indicating that the severity of drought was increasing, but the opposite pattern was observed in spring. However, these trends were not significant, and there was no mutation on the YGP from 1960 to 2013 (Cheng Q. et al., 2020). From 1960 to 2017, the drought in spring and autumn in Guizhou increased, and the drought in summer and winter decreased (Wang Y. et al., 2021). From 1961 to 2015, the annual, summer, and autumn SPI of Yunnan significantly decreased, and there was an obvious drought trend in the Lancang River and Nanpan River Basins (Li Y. et al., 2019). The above research results show that many researchers have analyzed the temporal and spatial distribution of drought on a global scale or in a small region, but there are few studies specifically on the YGP. Therefore, the analysis of the temporal and spatial distribution of drought on the YGP will further enrich the research results in this area.
Drought is a natural phenomenon caused by a shortage of water resources. Therefore, drought is closely related to meteorological elements such as precipitation (precipitation is considered in many drought indicators). However, meteorological elements such as precipitation have strong zonal patterns. For example, the precipitation in Sichuan (Zeng et al., 2016) and Hengduan Mountain (Yu et al., 2018) is influenced by elevation and latitude. In addition, there is a similar relationship for potential evapotranspiration (PET). For example, with the decline in elevation, the PET in the Xitugou Basin (Cheng W. J. et al., 2020) and Qilian Mountain (Yang et al., 2019) of China gradually increased. The above research results showed that the magnitude of meteorological elements related to drought (precipitation, PET, etc.) are related to their location. Does drought exhibit similar patterns? On a global scale, there are humid, semihumid, semiarid, and arid areas all over the world. On a regional scale, Mohammadi et al. (2020) found that extreme drought events occurred in the eastern Andes; Nuri Balov and Altunkaynak (2020) found that the drought characteristics of the West Black Sea and the Euphrates River basin in Turkey have a certain correlation with elevation. These studies have fully analyzed the spatial variation characteristics of drought and preliminarily explored the relationship between drought and elevation, but the research on the role of longitude and latitude is insufficient [since meteorological elements such as precipitation are related to longitude and latitude (Yu et al., 2018), it is necessary to study the relationship between drought and longitude and latitude]; in addition, there are few studies on the zonal patterns of drought. Therefore, to investigate the zonal patterns of drought, this paper uses the YGP as the study area based on the temporal and spatial distribution of drought, focuses on the relationship between drought and its characteristics and elevation/longitude/latitude, and analyzes the spatial patterns of drought. This research is different from previous research, providing a more in-depth study on the temporal and spatial distribution characteristics of drought. Specifically, this study incorporates the temporal and spatial distribution characteristics of drought to clarify its relationship with elevation/longitude/latitude. This study will provide new ideas for drought research and technical support for regional industrial layouts, planting structure adjustments, and drought and disaster reduction.
Study Area
The YGP is located between 22.52–31.21°N and 100.03–111.33°E in Southwest China, including the eastern part of Yunnan Province, the entire Guizhou Province, the northwestern part of Guangxi, and the provincial borders of Sichuan, Hubei, Hunan, and Chongqing. The YGP is adjacent to the Qinghai–Tibet Plateau and Hengduan Mountains. The rich and diverse natural environment of the YGP results in high biodiversity (rich species of plants and animals) and high cultural diversity (a large number of ethnic minorities). The YGP has a subtropical monsoon climate as a whole, with simultaneous rain and heat and distinct dry and wet seasons. The southern region has a tropical monsoon climate due to its low elevation and latitude, which is strongly affected by the South Asian monsoon. At the same time, because it is located on the low-latitude plateau, there is no severe cold in winter and no intense heat in summer. In addition, affected by topography, the YGP climate also has obvious vertical zonal characteristics and local climate characteristics. The YGP is at the intersection of south–north- and northeast–southwest-trending mountain ranges in China. The elevation is between 45 and 6,740 m and is higher in the northwest and lower in the southeast; that is, the elevation gradually decreases with increasing longitude. The YGP is the fourth largest plateau in China.
Data Description
There are many meteorological stations in the study area, but the starting years of the data of each meteorological station are different. Moreover, some meteorological stations lack measurements for a certain period of time, so it is necessary to cut off the meteorological data in the study area uniformly to ensure that the starting and ending years of the data of each meteorological station are consistent and the data within the study time range are complete. Therefore, to investigate the zonal characteristics of drought, the monthly air temperature, relative humidity, sunshine duration, wind speed, and precipitation of 47 meteorological stations with relatively long observation times and relatively complete observation records (shown in Figure 1) were selected for the present study. The data records, sourced from the China Meteorological Data Network (http://data.cma.cn/), covered the period from January 1971 to December 2013. In addition, prior to the release of meteorological data, the China Meteorological Data Service Center carried out strict quality control, and the data had good homogeneity.
FIGURE 1
Methods
To study the zonal pattern of drought, this study selected the meteorological data of the YGP and used the SPEI as the drought index on time scales of 1, 3, 6, and 12 months. Then, the quantitative method of Tang et al. (2021) was used to analyze the temporal and spatial distribution of the SPEI and the dependence of the characteristics of drought on the variation in longitude, latitude, and elevation on an annual scale (represented by the SPEI on a 12-months time scale ending in December in each year), during spring (from March to May, represented by the SPEI on a 3-months time scale ending in May in each year), summer (from June to August, represented by the SPEI on a 3-months time scale ending in August in each year), autumn (from September to November, represented by the SPEI on a 3-months time scale ending in November in each year), winter (from December to February of the following year, represented by the SPEI on a 3-months time scale ending in February in each year), the rainy season (from May to October, represented by the SPEI on a 6-months time scale ending in October in each year), and the dry season (from November to February of the following year, represented by the SPEI on a 6-months time scale ending in April).
SPEI
To analyze drought events, a drought index should first be selected. However, due to the different subjects and purposes, researchers have proposed numerous drought indices. As listed in the technical report of the World Meteorological Organization (WMO, 1975; 2016), there are as many as 58 drought indices from different countries (Wang et al., 2019). Among the many indices, the PDSI (Palmer, 1965), SPI (McKee et al., 1993), and SPEI (Vicente-Serrano et al., 2010a) are widely used. Among these, the PDSI and SPI have some defects and assumptions (Guttman, 1998; Vicente-Serrano et al., 2010a). The SPEI combines the advantages of the multi-timescale SPI and the sensitivity of the PDSI. In addition, the index considers not only the water shortage caused by precipitation reduction but also the water shortage caused by high evapotranspiration (Yang et al., 2020). Therefore, the SPEI is an effective drought index and is widely used in the context of global and regional climate change (Beguería et al., 2014; Jin et al., 2019; Danandeh Mehr et al., 2020; Danandeh Mehr and Vaheddoost, 2020). Therefore, the SPEI is selected as the drought index in the present study.
The SPEI is obtained by normalizing the cumulative probability of the difference between precipitation (P) and PET series. First, the Penman–Monteith (PM) method was used to calculate the monthly PET of the stations on the YGP; the difference between the monthly P and PET of each station was calculated, and the cumulative series of the difference on different time scales (at 1, 3, 6, and 12 months) were obtained. Different probability density functions were used to fit the series of different time scales to obtain a distribution function. Finally, the distribution functions at different stations on different time scales were standardized to obtain the SPEI values on different time scales. Detailed steps for calculating the SPEI (Vicente-Serrano et al., 2010a; Vicente-Serrano et al., 2010b; Vicente-Serrano et al., 2011a; Vicente-Serrano et al., 2011b) are shown as follows:
In this paper, the PM method (Allen et al., 1998), recommended by the Food and Agriculture Organization of the United Nations, is used to calculate the PET. Although the calculation of this method is more complex and requires considerable data, the calculation result is more accurate.where PET is the potential evapotranspiration (mm day−1), is the net radiation at the vegetation surface (MJ m−2 day−1), is the soil heat flux density (MJ m−2 day−1), is the slope vapor pressure curve (kPa°C−1), is the psychrometric constant (kPa°C−1), is the mean daily air temperature at 2 m height (°C), is the wind speed at 2 m height (m s−1), is the saturation vapor pressure (kPa), and is the actual vapor pressure (kPa).
The differences of the th year and th month arewhere and denote year and month, respectively.
The cumulant of different time scales ( denotes the temporal scale; = 1, 3, 6, 12) can be calculated according to Eq. 2.where is the order number, is the initial year, and and represent the integer and modulus of , respectively.
Because the of each station is different, this paper uses dozens of probability density functions to fit the cumulant of different time scales. Then, according to the Kolmogorov–Smirnov test, this paper selects the cumulative distribution function and calculates the cumulative probability . Finally, the SPEI is calculated as standardized values of cumulative probability :where is the standard normal distribution.
This paper uses the grading standard of the SPEI proposed by Danandeh Mehr et al. (2020). In addition, Danandeh Mehr et al. (2020) found that there is little difference between the SPI and SPEI corresponding to cumulative probabilities of 0.15–0.85; moreover, the residual with cumulative probability equal to 0.5 is almost equal to 0. In addition, many researchers have identified SPEI values less than 0 as indicative of drought (Banimahd and Khalili, 2013; Tan et al., 2015; Li X. et al., 2019). Therefore, this paper also takes SPEI equal to 0 as the critical value for dividing drought and wet conditions. The grading standard is shown in Table 1.
TABLE 1
| Level | Drought category | SPEI threshold |
|---|---|---|
| 0 | Non-drought | 0 ≤ SPEI |
| 1 | Mild drought | −0.99 < SPEI < 0 |
| 2 | Moderate drought | −1.42 < SPEI < −1.00 |
| 3 | Severe drought | −1.82 < SPEI < −1.43 |
| 4 | Extreme drought | SPEI ≤ −1.83 |
Drought classes.
Mann–Kendall Test
The Mann–Kendall test (Mann, 1945; Kendall, 1975) is a nonparametric statistical test, also known as a distribution-free test. Its advantage is that it does not require samples to follow a specific distribution, nor is it subject to interference from a small number of outliers. Therefore, it is widely used in the trend detection of hydrometeorological factors (Huang et al., 2013; Wang et al., 2013; Sayemuzzaman and Jha, 2014). The calculation steps are as follows (Yu et al., 2018).
The Mann–Kendall test statistic is calculated aswhere is the length of the data and and are the data values in time series and , respectively. In addition, is the sign function of .
The variance is computed aswhere is the number of tied groups and denotes the number of ties of extent . A tied group is a set of sample data having the same value. In cases where the sample size , the standard normal test statistic is computed using Eq. 10:
The time series increases when the statistical variable is greater than 0 and decreases when is less than 0. There is a significant trend at the given confidence level α = 0.05 when the absolute value of is greater than Zα/2.
PCA
PCA is a widely used spatiotemporal analysis method. It can use a few linearly uncorrelated principal components to explain most of the total variance in the original data according to the calculation results of the covariance matrix and corresponding eigenvalues and eigenvectors (Raziei et al., 2009) without causing extreme loss of information (Zhao et al., 2012; Polong et al., 2019). Therefore, according to drought indices such as the SPI or SPEI, a large number of scholars have used PCA to study the temporal and spatial variations in drought (Gocic and Trajkovic, 2014; Guo et al., 2018; Aryal and Zhu, 2021). As a result, PCA is also used to analyze the temporal and spatial variation characteristics of drought in this paper. The SPEI of the YGP is expressed as , where k represents the number of stations and i represents the length of time. Therefore, the linear combination of principal components is expressed as follows (Polong et al., 2019):where Y is a new orthogonal and linear uncorrelated variable that explains most of the total variance. The coefficient of linear combination is called the “load,” which represents the correlation between the original data and the corresponding principal component time series. The number of principal components is determined according to eigenvalues and cumulative variability. For example, the cumulative variability adopted by Raziei et al. (2009), Gunda et al. (2016), Gocic and Trajkovic (2014), Portela et al. (2015), Santos et al. (2010) was 54.96, 67/69, 68–69, 80.1, and 67–77%, respectively. Since different researchers adopt different standards, 70% is used in the present study as the standard to select the principal component. To visualize the spatial pattern of drought, the inverse distance weighting method is used to interpolate the principal components in ArcMap 10.0.
Characteristics of Drought
Drought can typically be characterized by four characteristics: duration, severity, intensity, and frequency (Mishra and Singh, 2010; Kimosop, 2019). The calculation methods are as follows:
Zero was used as the criterion to determine whether drought occurred in this study (as shown in Table 1); i.e., when the SPEI was less than 0, this value indicated the occurrence of drought. Drought duration represents the sum of the duration of each drought event (unit: month), and D in Figure 2 is the duration of each drought event.
FIGURE 2
Drought severity is the sum of the SPEI of each drought event (the filled-in area in Figure 2). The smaller the drought severity is, the more severe the drought.where D represents the drought duration and S represents the drought severity.
Drought intensity is the ratio of drought severity to the duration of each drought event.where I represents the drought intensity.
Drought frequency is the ratio of the number of drought occurrences to the total number.where F represents the drought frequency, represents the number of drought occurrences (i.e., the number of SPEIs that are smaller than 0), and represents the total number.
Multiple Linear Regression
In this paper, multiple linear regression is used to analyze the relationship between the average SPEI and drought characteristics and longitude, latitude, and elevation. This method is simple and easy to use. The mathematical equation is as follows (Chatzithomas et al., 2015):where is the dependent variable. , , and are the independent variables, which are latitude, longitude, and elevation, respectively. , , and are the coefficients of the variables, while is the intercept. The closer the absolute value of R is to 1, the better the fitting of the multiple linear regression equation. From a statistical point of view, the smaller the significance p value is, the more reliable the correlation between the variables in the sample and the variables in the population and the better the fitting of the multiple linear regression equation.
Results
Based on the SPEI calculation results, this paper first analyzes the temporal and spatial distribution of the SPEI and then investigates the zonal patterns of drought on the YGP, i.e., the variation pattern of drought according to longitude, latitude, and elevation.
Spatiotemporal Variation in the SPEI and its Relationship With Longitude and Elevation
In this paper, the SPEI was calculated based on the above-described method for 3-months (representing the drought index in spring, summer, autumn, and winter), 6-months (representing the drought index during the rainy and dry seasons), and 12-months (representing the annual drought index) time scales. The characteristics of spatiotemporal variation were then analyzed (as shown in Figure 3).
FIGURE 3
Figure 3 shows that the annual and seasonal SPEI values mainly decreased throughout the YGP area, although this trend was not significant at most stations. In addition, the spatial distributions of multiyear averages of annual and seasonal SPEI values were complex. In particular, the annual average SPEI values in the northwestern and southern sections of the YGP were relatively large, whereas those in the remaining areas were relatively small, and the SPEI values of most stations were smaller than 0, indicating the occurrence of drought; the average SPEI in spring was greater in the eastern section of the YGP and smaller in the western section, and the SPEI values of most stations were less than 0, indicating the occurrence of drought in most areas of the study region during spring. The SPEI values in summer were greater in the western section of the YGP and smaller in the eastern section of the YGP. Except for one station, the SPEI values of all other stations during summer were greater than 0, indicating that drought did not occur in most of the study area during summer. The average SPEI in autumn was greater in the northwestern section of the YGP and smaller in other sections of the YGP, and the SPEI values of most stations were greater than 0, indicating that drought did not occur in most areas of the YGP in autumn. The average SPEI in winter was relatively small in the central part of the YGP and relatively large in other parts of the YGP, and the SPEI values of all stations were less than 0, indicating the occurrence of drought in winter. The average SPEI during the rainy season was greater in the western part of the YGP and smaller in the eastern part of the YGP, and the SPEI values of all stations were greater than 0, indicating that there was no drought in the entire study area during the rainy season. The average SPEI during the dry season was relatively high in the eastern section of the YGP and smaller at most stations in the western section of the YGP, and the SPEI values of all the stations were less than 0, indicating the occurrence of drought on the YGP during the dry season.
In summary, the annual and seasonal SPEI values decreased to different degrees in most areas, indicating that drought might be aggravated. In addition, from the perspective of the multiyear average SPEI, mild drought occurred for the 12-months time scale in most areas throughout the year, and primarily mild drought conditions occurred for the 3-months time scale in part of the YGP during spring and autumn. No drought occurred in most regions during summer or the rainy season. However, drought on 3-months and 6-months timescales occurred throughout the YGP region during winter and the dry season, and drought conditions were mild in winter and moderate during the dry season.
Further analysis of Figure 3 reveals that the annual and seasonal averages of the SPEI vary with the range. Therefore, this paper analyzed the correlation between the annual and seasonal averages of the SPEI and the longitude and elevation (as shown in Figure 4).
FIGURE 4
Figure 4 shows that, except for the annual average SPEI, the correlation between the average SPEI of other seasons and longitude is contrary to that of elevation. In particular, the average SPEI in spring and during the dry season had a significant positive correlation with longitude and a significant negative correlation with elevation. The average SPEI in summer, autumn, and during the rainy season had a significant negative correlation with longitude and a significant positive correlation with elevation. In general, except for the annual average SPEI and the average SPEI in winter, the average SPEI in spring, summer, autumn, and during the drought and rainy seasons was significantly correlated with elevation and longitude. In addition, the correlation between the average SPEI and longitude was higher than that between the average SPEI and elevation (except during the dry season).
Spatial and Temporal Variability of Droughts Derived From PCA
According to the PCA method, the annual eigenvalues and cumulative variability of the SPEI of the YGP and each timescale were first calculated (as shown in Figure 5). The results show that except for annual variability, the contribution rate of the cumulative variability of the first three principal components in other seasons exceeded 70%. Therefore, the first three principal components can reflect the spatial changes in YGP drought. Figures 6, 7 show the principal components and time coefficients of drought annually and in each season, respectively.
FIGURE 5
FIGURE 6
FIGURE 7
The contribution rate of the cumulative variability of the first principal component was between 32 and 89%, which was much greater than that of other principal components. Therefore, it was considered that the spatial distribution of PC1 was the main distribution type of YGP drought. Except for PC1 at a few stations being greater than 0 in spring and autumn, PC1 at other time scales was less than 0, indicating that the drought and precipitation changes annually and in each season were consistent, showing wet and rainy conditions or drought and little rain throughout the year. In addition, the high value centers of PC1 were mainly distributed in the east and west of the YGP, reflecting that these areas were sensitive centers of drought and precipitation changes, with frequent interannual dry and wet alternations and large change ranges (the left side of Figure 6). Except for the time coefficient of PC1 in autumn, which weakly decreased, the time coefficient of PC1 on other time scales increased (Figure 7). The spatial distribution and time coefficient of PC1 showed that the drought of the YGP was becoming increasingly serious. The contribution rate of the cumulative variability of the second principal component was between 3 and 22%, which was also a typical spatial distribution type of YGP drought. Except for the dry season, the positive values of other time scales were mainly located in the west of YGP, and the negative values were mainly located in the east of YGP, indicating that the drought and precipitation changes in the east and west of YGP were opposite, and the east and west were the sensitive centers of drought and precipitation changes (the middle of Figure 6). The time coefficient of PC2 in the spring and rainy seasons increased, and the time coefficient of PC2 at other time scales decreased (Figure 7), indicating that the drought and precipitation changes on the YGP increased. The contribution rate of the cumulative variability of the third principal component was between 2 and 9%, accounting for a small proportion. The spatial distribution of PC3 on the YGP was complex, in which the patterns annually and in autumn and winter were similar, and the negative values were mainly located in the southeast of the YGP. The negative value in spring was mainly located in the middle of the YGP. The negative values in summer and the rainy season were mainly located in the northeast of the YGP. The negative values in the dry season were mainly located in the west of the YGP (the right side of Figure 6). The distribution of PC3 on the YGP showed that the drought and wet changes were the opposite in different regions. The time coefficient of PC3 annually and in the rainy and dry seasons decreased, while that in other seasons increased (Figure 7).
Figure 6 shows that the spatial distributions of the first two principal components were different in the eastern and western YGP. Therefore, this paper also analyzed their relationship with longitude and elevation (as shown in Table 2). Table 2 shows that except for the annual and winter seasons, PC1 in other seasons had a significant correlation with longitude and elevation at the significance level of α = 0.001. There was a significant correlation between PC2 and longitude and elevation at the significance level α = 0.001. For PC3, the correlation was weak. Overall, the spatial distribution of the first two principal components of the YGP drought had a good correlation with longitude and elevation. It is worth noting that these relationships do not reflect the correlation type (positive or negative correlation) of YGP drought with longitude and elevation. This is because the principal component only reflects the spatial distribution pattern of drought. It is necessary to reflect the relationship between drought and longitude and elevation, which needs to be multiplied by the time coefficient (as shown in Figure 8 and Table 3).
TABLE 2
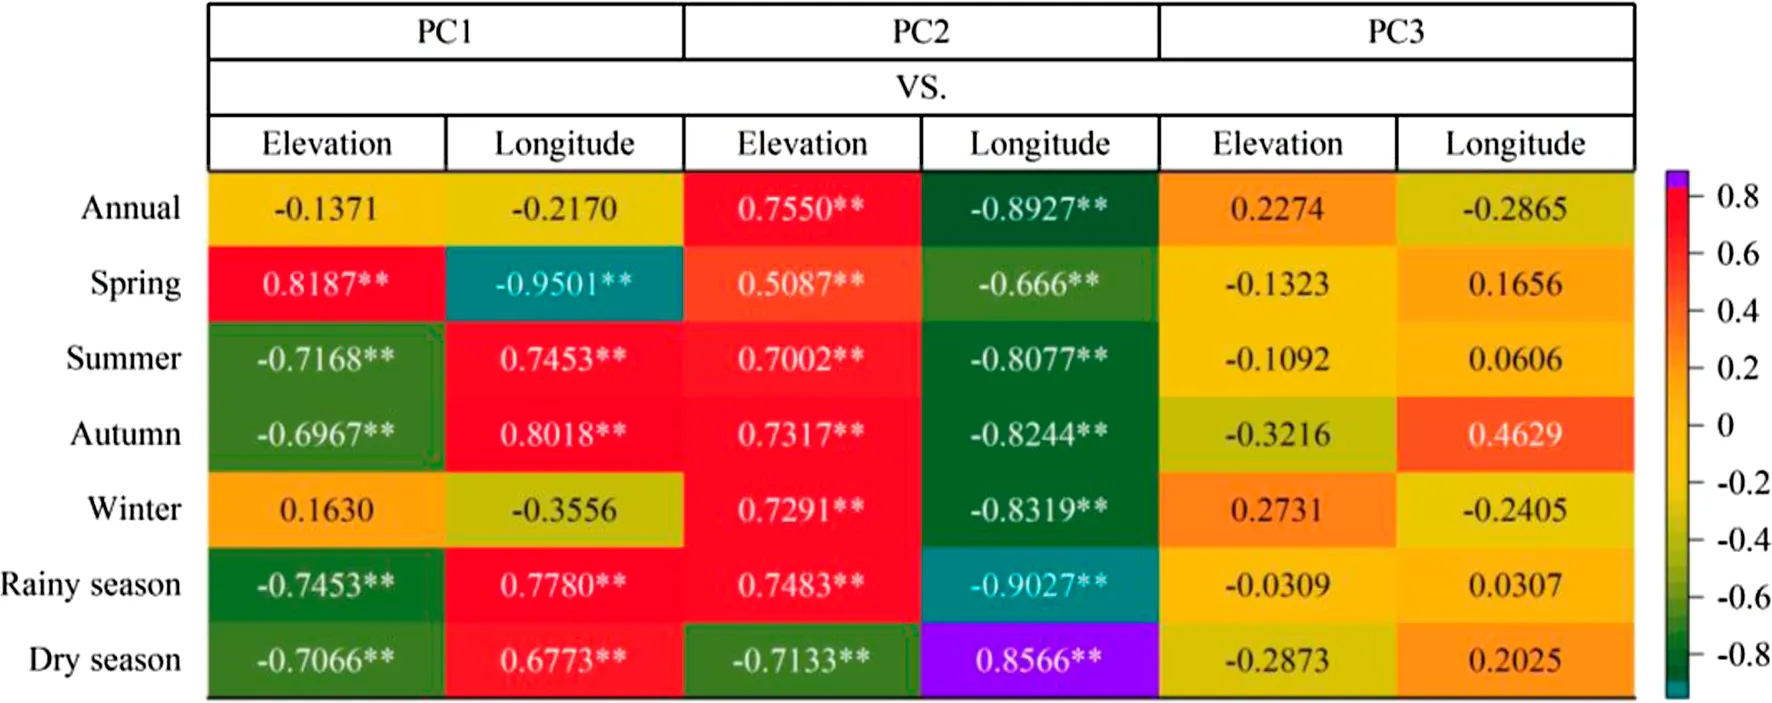 |
Linear correlation coefficients R between the first three principal components of the YGP and longitude and elevation.
FIGURE 8
TABLE 3
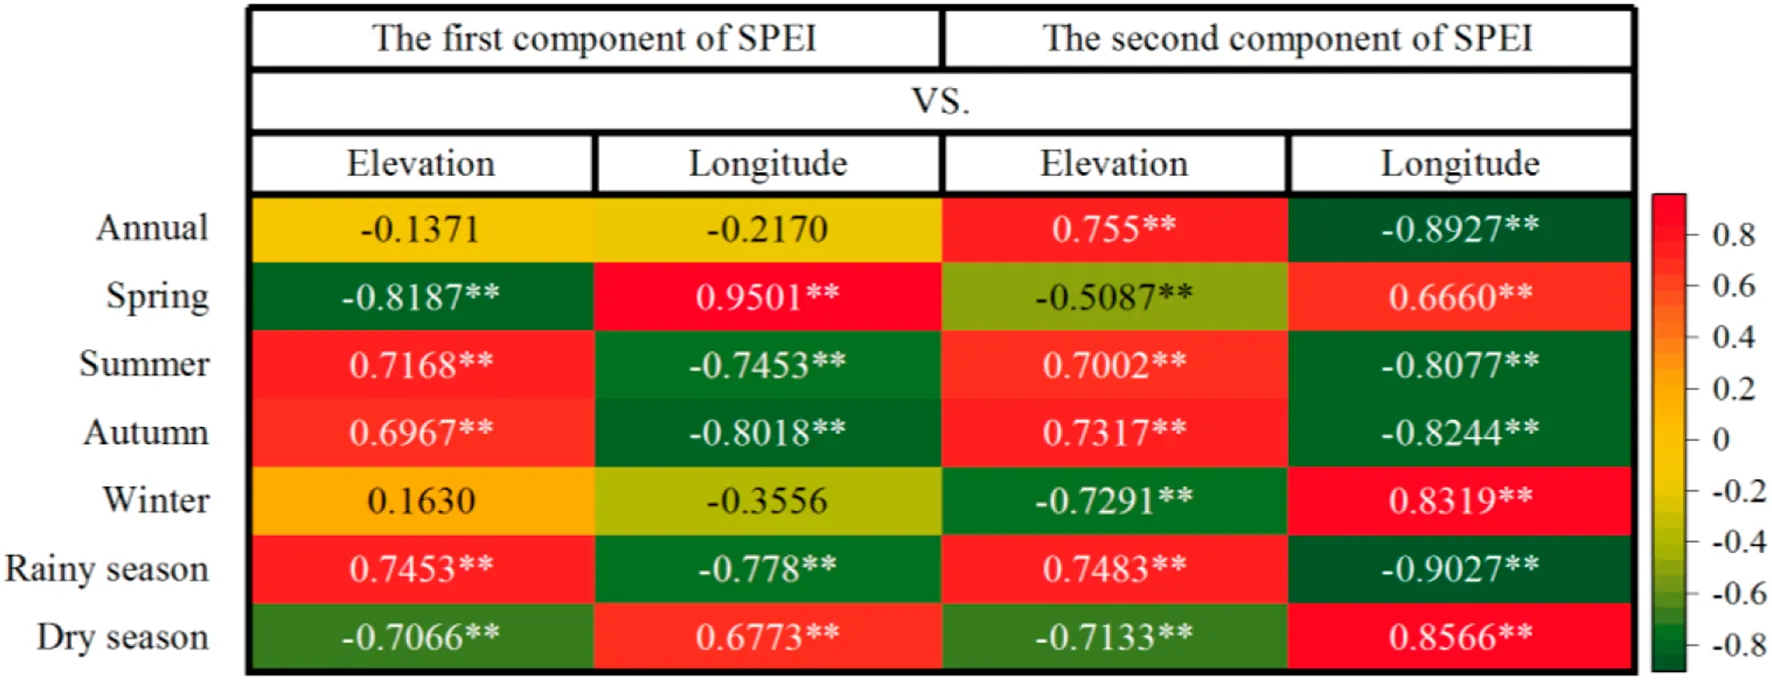 |
Linear correlation coefficient R between the first two components of the SPEI and longitude and elevation.
The above analysis showed that the first two principal components had a good correlation with longitude and elevation. Therefore, the first two components of the SPEI were inversely calculated according to PC1 and PC2 and the corresponding time coefficients (as shown in Figure 8). Figure 8 shows that except for annually and in winter, the first component of the SPEI in other seasons was related to longitude and elevation. The second component of the SPEI was related to longitude and elevation on each time scale (as shown in Table 3). Because the eigenvalue of PC1 was the largest, the first component of the SPEI played a major role. Hence, although the second component of the annual and winter SPEI had a good relationship with longitude and elevation, the overall relationship was poor (as shown in Figure 4).
The Relationship Between the Characteristics of Drought and Longitude/Elevation
In this paper, the SPEI was first calculated on a 1-month time scale according to the SPEI method. Then, based on the calculated SPEI on the 1-month time scale, the calculation method for drought characteristics was used to calculate the four drought characteristics—duration, severity, intensity (as shown in Figure 9), and frequency. Finally, the zonal patterns of the four characteristics of drought, i.e., the correlations between drought and longitude and elevation, were analyzed.
FIGURE 9
According to the statistical analysis of drought duration, the drought duration series were different at different stations. Therefore, this study used the average drought duration for analysis (as shown in Figures 9, 10). Figures 9, 10 show that the average drought duration at each station is significantly correlated with longitude and elevation (confidence level α = 0.001), and the correlation between average drought duration and longitude was higher than that between average drought duration and elevation. The above analysis shows that with increasing longitude or decreasing elevation, the average drought duration decreases.
FIGURE 10
Drought severity indicates the severity of each drought event. According to the above method, the severity of each drought event is calculated (the drought severity is the corresponding series of drought durations), and then the correlations between the average drought severity and the longitude and elevation of each station are analyzed (as shown in Figures 9, 11). Figures 9, 11 show that the average drought severity on the YGP was significantly correlated with longitude and elevation at a confidence level of α = 0.001, the average drought severity had a positive correlation with longitude and a negative correlation with elevation, and the correlation between average drought severity and longitude was higher than that between average drought severity and elevation. The above analysis reveals that with increasing longitude or decreasing elevation, the average drought severity increases.
FIGURE 11
Based on the calculated drought severity and drought duration, this study first calculated the drought intensity for each drought event and then analyzed the correlation between the average drought intensity and the longitude and elevation (as shown in Figures 9, 12). Figures 9, 12 show that the mean drought intensity had a significant negative correlation with longitude at a confidence level of α = 0.01 but had no significant correlation with elevation. In other words, with increasing longitude, the average drought intensity decreased.
FIGURE 12
Drought frequency reflects the drought situation in the YGP area. In this study, we obtained the annual and seasonal drought frequencies according to the calculation method of drought frequency and analyzed the correlation between these frequencies and longitude and elevation (as shown in Figure 13). Figure 13 shows that there is a significant correlation between drought frequency and longitude and elevation at a confidence level of α = 0.001 (except for the annual drought frequency and the drought frequency in winter). Moreover, drought frequency in spring and during the dry season was negatively correlated with longitude and positively correlated with elevation; the drought frequency in summer and autumn and during the rainy season was positively correlated with longitude and negatively correlated with elevation; and the correlation between drought frequency and longitude was higher than that between drought frequency and elevation. The above analysis shows that as longitude increased or elevation decreased, the drought events increased (increased drought frequency) in summer and autumn and during the rainy season with more precipitation, and the drought events decreased (reduced drought frequency) in spring and during the dry season with less precipitation. In other words, except for the annual drought frequency and drought frequency in winter, the drought frequencies varied with changes in longitude and elevation.
FIGURE 13
In addition to analyzing the frequency of drought events, this paper also analyzed the correlation between the frequency of each drought grade (including mild, moderate, severe, and extreme drought, as shown in Table 1) and the longitude and elevation (as shown in Table 4). Table 4 shows that the annual and seasonal frequencies of most drought grades were significantly correlated with longitude and elevation (confidence level α = 0.001); i.e., the frequency of each drought grade varied with changes in longitude and elevation.
TABLE 4
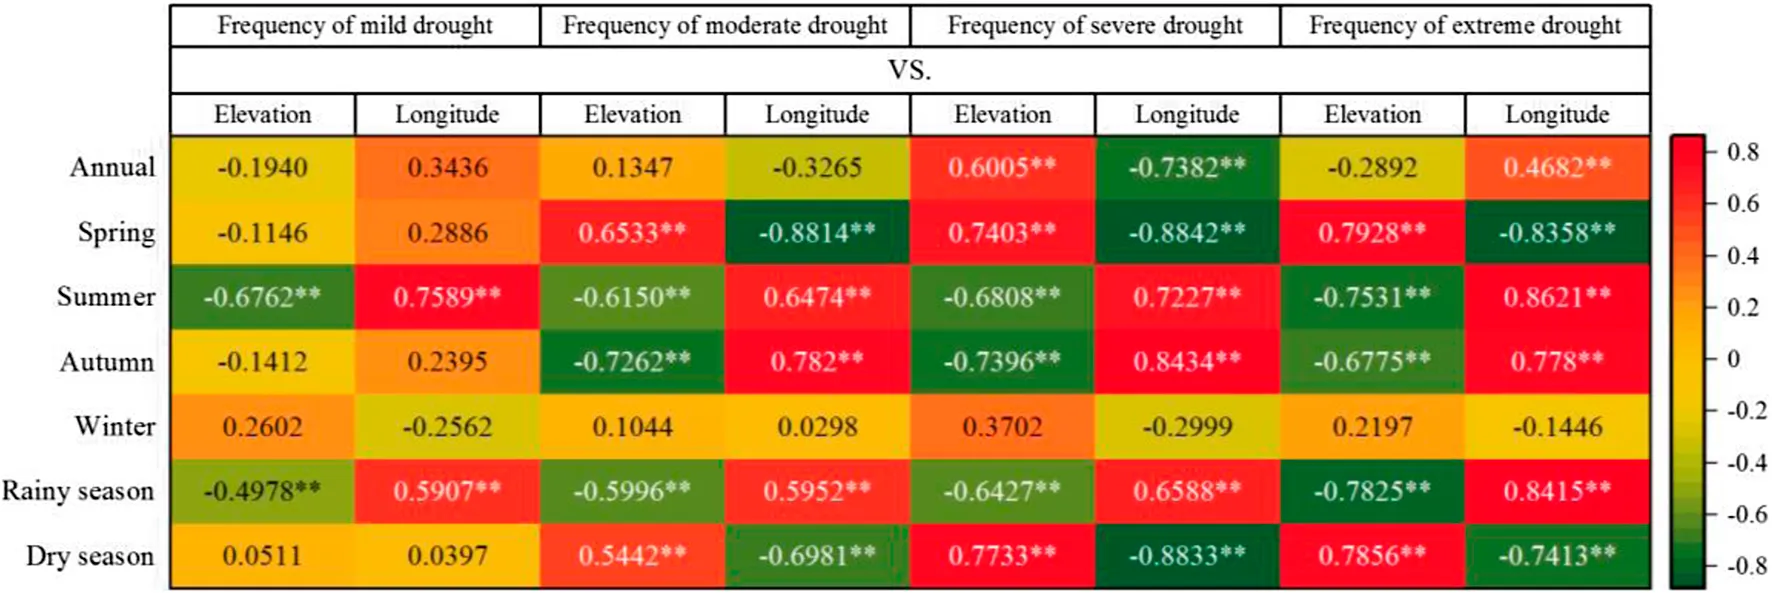 |
Linear correlation coefficient R between the frequency of each drought grade and the longitude and elevation.
The sum of the SPEI values of the drought events during the study period also indicates the drought conditions in various regions. Therefore, this paper also analyzed the correlation between the annual and seasonal SPEI sum of the drought events and the longitude and elevation (as shown in Figure 14). Figure 14 shows that, except for the annual SPEI sum and the SPEI sum in winter, the correlation between the SPEI sum and longitude was opposite to that between the SPEI sum and elevation (confidence level α = 0.001), and the correlation between the SPEI sum and longitude was higher than that between the SPEI sum and elevation. In other words, with changes in longitude and elevation, the annual and seasonal SPEI sums also changed.
FIGURE 14
In addition, this study analyzed the correlation between the SPEI sum of each drought grade and the longitude and elevation (as shown in Table 5). Table 5 shows that the SPEI sums of most drought grades exhibited significant correlations with longitude and elevation (confidence level α = 0.001); i.e., with changes in longitude and elevation, the SPEI sums of different drought grades changed in different regions.
TABLE 5
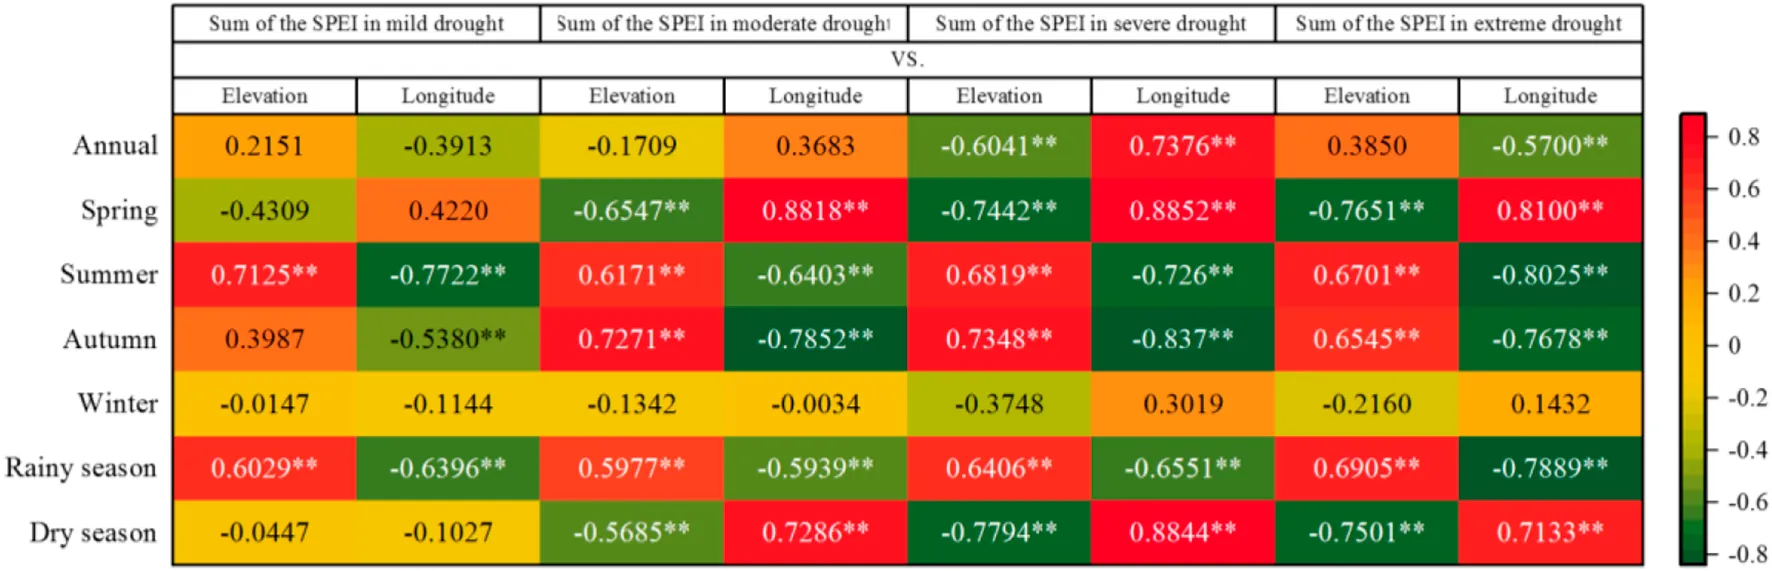 |
Linear correlation coefficient R of the SPEI and the longitude and elevation of different drought classes.
Zonal Patterns of Drought
The above results mainly assess the relationships between the average SPEI and drought characteristics and longitude and elevation. To analyze the zonal patterns of drought, this paper studies not only the relationship with longitude and elevation but also the relationship with latitude. However, the relationship between the average SPEI and drought characteristics and latitude is poor, so this paper uses multiple linear regression methods (as shown in Table 6). Table 6 shows that, except for the average SPEI in winter, drought intensity, drought frequency, and the sums of the annual and winter SPEI values, the other indicators have a strong correlation with longitude, latitude, and elevation. In other words, the YGP’s drought characteristics exhibited strong zonal patterns.
TABLE 6
| Coefficients | ||||||||
|---|---|---|---|---|---|---|---|---|
| Multiple R | F | p-value | Intercept | Variable latitude | Variable longitude | Variable elevation | ||
| Average SPEI | Annual | 0.5701 | 6.90 | 6.77E−04 | 2.27E+00 | −2.40E−03 | −2.03E−02 | −8.07E−05 |
| Spring | 0.9522 | 139.40 | 3.56E−22 | −2.24E+01 | −2.72E−02 | 2.17E−01 | −1.84E−04 | |
| Summer | 0.8392 | 34.12 | 1.91E−11 | 1.04E+01 | −4.01E−02 | −8.18E−02 | 1.82E−04 | |
| Autumn | 0.8937 | 56.88 | 5.14E−15 | 8.79E+00 | 7.71E−02 | −1.03E−01 | 5.90E−05 | |
| Winter | 0.3997 | 2.73 | 5.58E−02 | 3.43E+00 | −2.44E−02 | −3.12E−02 | −1.00E−04 | |
| Rainy season | 0.8305 | 31.86 | 5.29E−11 | 7.31E+00 | 1.03E−02 | −6.49E−02 | 1.23E−04 | |
| Dry season | 0.7398 | 17.33 | 1.59E−07 | −5.02E+00 | −7.57E−03 | 4.28E−02 | −2.36E−04 | |
| Average of the drought duration | 0.8128 | 27.90 | 3.56E−10 | 2.51E+01 | 8.55E−02 | −2.29E−01 | −3.03E−05 | |
| Average of the drought severity | 0.7979 | 25.11 | 1.52E−09 | −1.71E+01 | −5.79E−02 | 1.54E−01 | −3.64E−05 | |
| Average of the drought intensity | 0.5156 | 5.19 | 3.78E−03 | 1.60E+00 | −1.10E−02 | −1.92E−02 | −3.90E−05 | |
| Drought frequency | Annual | 0.3251 | 1.69 | 1.83E−01 | 4.23E−01 | 3.50E−03 | 9.16E−05 | 7.40E−06 |
| Spring | 0.9614 | 174.84 | 4.16E−24 | 6.65E+00 | 1.07E−02 | −6.04E−02 | 5.72E−05 | |
| Summer | 0.8925 | 56.10 | 6.51E−15 | −3.37E+00 | 1.08E−02 | 3.20E−02 | −5.93E−05 | |
| Autumn | 0.8789 | 48.68 | 7.03E−14 | −2.43E+00 | −2.48E−02 | 3.37E−02 | −2.06E−05 | |
| Winter | 0.4518 | 3.68 | 1.92E−02 | 8.59E−01 | 1.80E−02 | −5.27E−03 | 5.04E−05 | |
| Rainy season | 0.8443 | 35.59 | 1.01E−11 | −1.68E+00 | −2.12E−03 | 1.97E−02 | −4.45E−05 | |
| Dry season | 0.7886 | 23.57 | 3.54E−09 | 2.51E+00 | 9.19E−03 | −1.93E−02 | 5.83E−05 | |
| Sum of the SPEI in drought event | Annual | 0.3960 | 2.67 | 5.97E−02 | −9.40E+00 | −1.51E+00 | −1.41E+00 | −6.18E−03 |
| Spring | 0.9527 | 140.97 | 2.86E−22 | −1.50E+03 | −2.36E−02 | 1.36E+01 | −1.19E−02 | |
| Summer | 0.8762 | 47.39 | 1.09E−13 | 8.46E+02 | −3.91E+00 | −7.49E+00 | 9.81E−03 | |
| Autumn | 0.9176 | 76.33 | 2.93E−17 | 5.14E+02 | 3.19E+00 | −6.06E+00 | 5.03E−03 | |
| Winter | 0.2715 | 1.14 | 3.43E−01 | 1.31E+02 | −8.64E−01 | −1.42E+00 | −8.99E−03 | |
| Rainy season | 0.8710 | 45.04 | 2.51E−13 | 8.62E+02 | −2.17E+00 | −8.50E+00 | 1.83E−02 | |
| Dry season | 0.8643 | 42.32 | 6.80E−13 | −8.31E+02 | 6.40E−01 | 6.73E+00 | −2.44E−02 | |
Multiple linear regression analysis of average SPEI and drought characteristics with longitude and latitude and elevation.
Discussion
The annual and seasonal SPEI values of the YGP primarily declined, indicating that drought in the YGP area became increasingly severe. In addition, overall, the spatial distributions of the annual average SPEI and the average SPEI in winter were relatively complex. The average SPEI values in spring and during the dry season were greater in the eastern part of the YGP and smaller in the western part of the YGP, whereas those in summer and autumn and during the rainy season were smaller in the eastern part of the YGP and greater in the western part of the YGP. Furthermore, the annual average SPEI and the average SPEI in spring were less than 0 at most stations, indicating that drought occurred in most areas of the YGP, whereas the average SPEI values in summer and autumn were the opposite; the average SPEI values of all stations were less than 0 in winter and during the dry season, indicating that drought occurred in the entire YGP area, whereas no drought occurred during the rainy season. This outcome occurred because southwestern China has a subtropical and temperate monsoon climate with an extremely uneven seasonal distribution of precipitation. Precipitation during the rainy and dry seasons accounted for 80–90% and 10–20% of the annual precipitation, respectively (Zhao, 1997). This outcome indicates that variation in precipitation is the primary cause of drought on the YGP (Xu et al., 2015). Xu et al. (2015) found that the SPI and SPEI values of the YGP significantly decreased. In addition, the drying trend is also evident in southwestern China (Liu et al., 2015). The above results are consistent with the results of this study and help elucidate the causes of drought on the YGP.
Except for the annual average SPEI and the average SPEI in winter, the average SPEI was significantly correlated with longitude and elevation at a confidence level of α = 0.001. Moreover, the average SPEI values were positively correlated with longitude and negatively correlated with elevation in spring and during the dry season, whereas the average SPEI values were negatively correlated with longitude and positively correlated with elevation in summer and autumn and during the rainy season. From the perspective of PCA, the first two principal components were significantly correlated with longitude and elevation at the confidence level of α = 0.001. In addition, the first two components of the SPEI also showed a good relationship with longitude and elevation. Although the second component of the SPEI had a significant correlation with longitude and elevation at the confidence level of α = 0.001 on all time scales, the relationship between the SPEI and longitude and elevation was poor annually and in spring because the first component was dominant. From the perspective of drought characteristics, average drought duration and average drought severity had a significant correlation with longitude and elevation (confidence level α = 0.001). Average drought duration was negatively correlated with longitude and positively correlated with elevation, average drought severity was positively correlated with longitude and negatively correlated with elevation, and drought intensity was negatively correlated with longitude at a confidence level of α = 0.01 and was nonsignificantly correlated with elevation. Because drought severity and drought duration were relatively small in high-longitude or low-elevation areas and were relatively large in low-longitude or high-elevation areas, the weak correlation between the ratio of these two factors and longitude and elevation was reasonable. Except for the annual drought frequency and drought frequency in winter, drought frequency was significantly correlated with longitude and elevation at a confidence level of α = 0.001. Moreover, drought frequency was negatively correlated with longitude and positively correlated with elevation in spring and during the dry season, whereas drought frequency was positively correlated with longitude and negatively correlated with elevation in summer and autumn and during the rainy season. The annual and seasonal frequencies of most drought grades were significantly correlated with longitude and elevation at a confidence level of α = 0.001. Zhang et al. (2013) showed that the elevation in southwestern China has some impact on the frequency of extreme drought during the monsoon period; except for the annual SPEI sum of drought and the SPEI sum in winter, the SPEI sums of drought were significantly correlated with longitude and elevation, and the SPEI sums were positively correlated with longitude and negatively correlated with elevation in spring and during the dry season, whereas the SPEI sums were negatively correlated with longitude and positively correlated with elevation in summer and autumn and during the rainy season. The above analysis indicates that both the multiyear average SPEI and the characteristics of drought are strongly correlated with longitude and elevation, and in most cases, their correlation with longitude was higher than that with elevation. In addition, from multiple linear regression analysis, the average SPEI and drought characteristics have a good relationship with longitude, latitude, and elevation in most cases, indicating that drought on the YGP has zonal patterns. The zonal patterns of the YGP drought may be caused by changes in precipitation in the region. Previous studies have shown that annual precipitation in southwestern China, the Qinghai–Tibet Plateau, and the Hengduan Mountains was related to latitude and elevation (Lu et al., 2007; Tao et al., 2016; Yu et al., 2018). Therefore, drought and its characteristic values on the YGP have a good correlation with longitude, latitude, and elevation; that is, drought shows zonal patterns.
Conclusion
Based on meteorological data, the temporal and spatial distribution of drought on the YGP and the relationships between drought characteristics and longitude, latitude, and elevation were calculated and analyzed by SPEI, the Mann–Kendall test, PCA, linear regression, and multiple linear regression. The results show that the SPEI of the YGP is decreasing, and the drought is becoming increasingly severe. In addition, the spatial changes in SPEI in each season are different, but SPEI values in seasons are consistent spatially except annually and in winter; thus, YGP drought and its characteristics have a good correlation with elevation and longitude, indicating that YGP drought may be affected by elevation and longitude. The multiple linear regression results verify this conclusion, that is, YGP drought in most seasons is affected by elevation and longitude. In addition, it is also affected by latitude, showing strong zonal patterns. Taking the YGP as the research area and the SPEI as the drought index, based on the analysis of the temporal and spatial distribution of YGP drought, this paper focuses on the relationship between drought and its characteristics and longitude and elevation and reveals the zonal patterns of YGP drought. The results may have certain limitations (regionality), but this article shows that drought has zonal patterns, which may be similar in other parts of the world. Therefore, the research results of this paper can provide new ideas for drought analysis in other regions and provide a scientific basis for industrial layout, planting structure adjustment, and drought relief.
Statements
Data availability statement
The original contributions presented in the study are included in the article/supplementary materials, further inquiries can be directed to the corresponding authors.
Author contributions
HY calculated, analyzed and wrote this article. LW provided research ideas. MY prepared the data.
Funding
This work was supported by Youth Project of the Applied Basic Research Programs of Science and Technology Department in Yunnan Province under grant number 2014FD022.
Acknowledgments
We greatly appreciate suggestions from anonymous referees for the improvement of our paper. Thanks also to the editorial staff.
Conflict of interest
The authors declare that the research was conducted in the absence of any commercial or financial relationships that could be construed as a potential conflict of interest.
Publisher’s note
All claims expressed in this article are solely those of the authors and do not necessarily represent those of their affiliated organizations, or those of the publisher, the editors and the reviewers. Any product that may be evaluated in this article, or claim that may be made by its manufacturer, is not guaranteed or endorsed by the publisher.
References
1
AdnanS.UllahK.ShoutingG. (2016). Investigations into Precipitation and Drought Climatologies in South Central Asia with Special Focus on Pakistan over the Period 1951-2010. J. CLIMATE29, 6019–6035. 10.1175/jcli-d-15-0735.1
2
AhmedK.ShahidS.HarunS. b.WangX.-j. (2015). Characterization of Seasonal Droughts in Balochistan Province, Pakistan. Stoch. Environ. Res. Risk Assess.30, 747–762. 10.1007/s00477-015-1117-2
3
AllenR. G.PereiraL. S.RaesD.SmithM. (1998). “Crop Evapotranspiration. Guidelines for Computing Crop Water Requirements,”. FAO Irrigation and Drainage Paper 56 (Rome: FAO).
4
AlmazrouiM.SaeedF.IslamM. N.AlkhalafA. K. (2016). Assessing the Robustness and Uncertainties of Projected Changes in Temperature and Precipitation in AR4 Global Climate Models over the Arabian Peninsula. Atmos. Res.182, 163–175. 10.1016/j.atmosres.2016.07.025
5
AlsafadiK.MohammedS. A.AyugiB.SharafM.HarsányiE. (2020). Spatial-Temporal Evolution of Drought Characteristics over Hungary between 1961 and 2010. Pure Appl. Geophys.177, 3961–3978. 10.1007/s00024-020-02449-5
6
AryalY.ZhuJ. (2021). Spatial and Temporal Variability of Drought Patterns over the Continental United States from Observations and Regional Climate Models. J. Meteorol. Res.35, 295–312. 10.1007/s13351-021-0045-y
7
AzamM.MaengS.KimH.LeeS.LeeJ. (2018). Spatial and Temporal Trend Analysis of Precipitation and Drought in South Korea. Water10, 765. 10.3390/w10060765
8
BanimahdS. A.KhaliliD. (2013). Factors Influencing Markov Chains Predictability Characteristics, Utilizing SPI, RDI, EDI and SPEI Drought Indices in Different Climatic Zones. Water Resour. Manage.27, 3911–3928. 10.1007/s11269-013-0387-z
9
BegueríaS.Vicente-SerranoS. M.ReigF.LatorreB. (2014). Standardized Precipitation Evapotranspiration index (SPEI) Revisited: Parameter Fitting, Evapotranspiration Models, Tools, Datasets and Drought Monitoring. Int. J. Climatol.34, 3001–3023. 10.1002/joc.3887
10
ChandaK.MaityR. (2017). Assessment of Trend in Global Drought Propensity in the Twenty-First Century Using Drought Management Index. Water Resour. Manage.31, 1209–1225. 10.1007/s11269-017-1571-3
11
ChatzithomasC.AlexandrisS.KaravitisC. (2015). Multivariate Linear Relation for Precipitation: a New Simple Empirical Formula. Stud. Geophys. Geod59 (2), 325–344. 10.1007/s11200-013-1162-6
12
ChengQ.GaoL.ZhongF.ZuoX.MaM. (2020a). Spatiotemporal Variations of Drought in the Yunnan-Guizhou Plateau, Southwest China, during 1960-2013 and Their Association with Large-Scale Circulations and Historical Records. Ecol. Indicators112, 106041. 10.1016/j.ecolind.2019.106041
13
ChengW. J.XiH. Y.SiJ. H.LiA. L. (2020b). Study of Evapotranspiration Estimation and Drought Characteristics of Watershed in Low Coteau Area of Hexi Inland River. Arid Zone Res.37 (5), 1105–1115. (in Chinese).
14
Danandeh MehrA.SormanA. U.KahyaE.Hesami AfsharM. (2020). Climate Change Impacts on Meteorological Drought Using SPI and SPEI: Case Study of Ankara, Turkey. Hydrological Sci. J.65, 254–268. 10.1080/02626667.2019.1691218
15
Danandeh MehrA.VaheddoostB. (2020). Identification of the Trends Associated with the SPI and SPEI Indices across Ankara, Turkey. THEOR. APPL. CLIMATOL139, 1531–1542. 10.1007/s00704-019-03071-9
16
El KenawyA. M.Al BuloshiA.Al-AwadhiT.Al NasiriN.Navarro-SerranoF.AlhatrushiS.et al (2020). Evidence for Intensification of Meteorological Droughts in Oman over the Past Four Decades. Atmos. Res.246, 105126. 10.1016/j.atmosres.2020.105126
17
FangW.HuangS.HuangQ.HuangG.MengE.LuanJ. (2018). Reference Evapotranspiration Forecasting Based on Local Meteorological and Global Climate Information Screened by Partial Mutual Information. J. Hydrol.561, 764–779. 10.1016/j.jhydrol.2018.04.038
18
FangW.HuangS.RenK.HuangQ.HuangG.ChengG.et al (2019). Examining the Applicability of Different Sampling Techniques in the Development of Decomposition-Based Streamflow Forecasting Models. J. Hydrol.568, 534–550. 10.1016/j.jhydrol.2018.11.020
19
FuQ.ZhouZ.LiT.LiuD.HouR.CuiS.et al (2018). Spatiotemporal Characteristics of Droughts and Floods in Northeastern China and Their Impacts on Agriculture. Stoch Environ. Res. Risk Assess.32, 2913–2931. 10.1007/s00477-018-1543-z
20
GocicM.TrajkovicS. (2014). Spatiotemporal Characteristics of Drought in Serbia. J. Hydrol.510, 110–123. 10.1016/j.jhydrol.2013.12.030
21
GundaT.HornbergerG. M.GilliganJ. M. (2016). Spatiotemporal Patterns of Agricultural Drought in Sri Lanka: 1881-2010. Int. J. Climatol.36, 563–575. 10.1002/joc.4365
22
GuoH.BaoA.LiuT.JiapaerG.NdayisabaF.JiangL.et al (2018). Spatial and Temporal Characteristics of Droughts in Central Asia during 1966-2015. Sci. Total Environ.624, 1523–1538. 10.1016/j.scitotenv.2017.12.120
23
GuttmanN. B. (1998). Comparing the Palmer Drought Index and the Standardized Precipitation Index. J. Am. Water Resour. Assoc34, 113–121. 10.1111/j.1752-1688.1998.tb05964.x
24
HuangJ.XueY.SunS.ZhangJ. (2015). Spatial and Temporal Variability of Drought during 1960-2012 in Inner Mongolia, north China. Quat. Int.355, 134–144. 10.1016/j.quaint.2014.10.036
25
HuangJ.ZhangJ.ZhangZ.XuC.-Y. (2013). Spatial and Temporal Variations in Rainfall Erosivity during 1960-2005 in the Yangtze River basin. Stoch Environ. Res. Risk Assess.27, 337–351. 10.1007/s00477-012-0607-8
26
HuangS.WangL.WangH.HuangQ.LengG.FangW.et al (2019). Spatio-temporal Characteristics of Drought Structure across China Using an Integrated Drought index. Agric. Water Manag.218, 182–192. 10.1016/j.agwat.2019.03.053
27
JinL.ZhangJ.WangR.ZhangM.BaoY.GuoE.et al (2019). Analysis for Spatio-Temporal Variation Characteristics of Droughts in Different Climatic Regions of the Mongolian Plateau Based on SPEI. Sustainability11, 5767. 10.3390/su11205767
28
KendallM. G. (1975). Rank Correlation Measures. London: Charles Griffin.
29
KimosopP. (2019). Characterization of Drought in the Kerio Valley Basin, Kenya Using the Standardized Precipitation Evapotranspiration Index: 1960−2016. Singapore J. Trop. Geogr.40 (2), 239–256. 10.1111/sjtg.12270
30
LiX.ShaJ.WangZ.-L. (2019b). Comparison of Drought Indices in the Analysis of Spatial and Temporal Changes of Climatic Drought Events in a basin. Environ. Sci. Pollut. Res.26, 10695–10707. 10.1007/s11356-019-04529-z
31
LiY.WangZ.ZhangY.LiX.HuangW. (2019a). Drought Variability at Various Timescales over Yunnan Province, China: 1961-2015. THEOR. APPL. CLIMATOL138, 743–757. 10.1007/s00704-019-02859-z
32
LiuX.WangS.ZhouY.WangF.LiW.LiuW. (2015). Regionalization and Spatiotemporal Variation of Drought in China Based on Standardized Precipitation Evapotranspiration Index (1961-2013). Adv. Meteorology2015, 1–18. 10.1155/2015/950262
33
LiuZ.WangY.ShaoM.JiaX.LiX. (2016). Spatiotemporal Analysis of Multiscalar Drought Characteristics across the Loess Plateau of China. J. Hydrol.534, 281–299. 10.1016/j.jhydrol.2016.01.003
34
LuC. X.WangL.XieG. D.LengY. F. (2007). Altitude Effect of Precipitation and Spatial Distribution of Qinghai-Tibetan Plateau. J. Mountain Sci.25 (6), 655–663. (in Chinese).
35
MannH. B. (1945). Nonparametric Tests against Trend. Econometrica13, 245–259. 10.2307/1907187
36
MathboutS.Lopez-BustinsJ. A.Martin-VideJ.BechJ.RodrigoF. S. (2018). Spatial and Temporal Analysis of Drought Variability at Several Time Scales in Syria during 1961-2012. Atmos. Res.200, 153–168. 10.1016/j.atmosres.2017.09.016
37
McKeeT. B.DoeskenN. J.KleistJ. (1993). “The Relationship of Drought Frequency and Duration to Time Scales,” in Preprints, Eighth Conf. on Applied Climatology, Anaheim, CA, 17-22 January 1993 (Amer.Meteor. Soc.), 179–184.
38
MerabtiA.MartinsD. S.MeddiM.PereiraL. S. (2018). Spatial and Time Variability of Drought Based on SPI and RDI with Various Time Scales. Water Resour. Manage.32, 1087–1100. 10.1007/s11269-017-1856-6
39
MishraA. K.SinghV. P. (2010). A Review of Drought Concepts. J. Hydrol.391, 202–216. 10.1016/j.jhydrol.2010.07.012
40
MohammadiB.VaheddoostB.Danandeh MehrA. (2020). A Spatiotemporal Teleconnection Study between Peruvian Precipitation and Oceanic Oscillations. Quat. Int.565, 1–11. 10.1016/j.quaint.2020.09.042
41
MohsenipourM.ShahidS.ChungE.-S.WangX.-j. (2018). Changing Pattern of Droughts during Cropping Seasons of Bangladesh. Water Resour. Manage.32, 1555–1568. 10.1007/s11269-017-1890-4
42
Nuri BalovM.AltunkaynakA. (2020). Spatio-temporal Evaluation of Various Global Circulation Models in Terms of Projection of Different Meteorological Drought Indices. ENVIRON. EARTH SCI.79. 10.1007/s12665-020-8881-0
43
PalmerW. C. (1965). “Meteorological Droughts,”. Weather Bureau Research Paper 45 (Washington DC: U.S. Department of Commerce), 58.
44
PolongF.ChenH.SunS.OngomaV. (2019). Temporal and Spatial Evolution of the Standard Precipitation Evapotranspiration index (SPEI) in the Tana River Basin, Kenya. THEOR. APPL. CLIMATOL138, 777–792. 10.1007/s00704-019-02858-0
45
PortelaM. M.ZelenákovaM.SantosJ. F.PurczP.SilvaA. T.HlavatáH. (2015). Drought Analysis in Slovakia: Regionalization, Frequency Analysis and Precipitation Thresholds. WIT Trans. Ecol. Environ.197, 237–248. 10.2495/RM150211
46
PourS. H.ShahidS.ChungE.-S.WangX.-J. (2018). Model Output Statistics Downscaling Using Support Vector Machine for the Projection of Spatial and Temporal Changes in Rainfall of Bangladesh. Atmos. Res.213, 149–162. 10.1016/j.atmosres.2018.06.006
47
PrudhommeC.GiuntoliI.RobinsonE. L.ClarkD. B.ArnellN. W.DankersR.et al (2014). Hydrological Droughts in the 21st century, Hotspots and Uncertainties from a Global Multimodel Ensemble experiment. Proc. Natl. Acad. Sci. USA111, 3262–3267. 10.1073/pnas.1222473110
48
RazieiT.SaghafianB.PauloA. A.PereiraL. S.BordiI. (2009). Spatial Patterns and Temporal Variability of Drought in Western Iran. Water Resour. Manage.23, 439–455. 10.1007/s11269-008-9282-4
49
Sa’adiZ.ShahidS.ChungE. S.IsmailT. (2017). Projection of Spatial and Temporal Changes of Rainfall in Sarawak of Borneo Island Using Statistical Downscaling of CMIP5 Models. Atmos. Res.197, 446–460.
50
SantosJ. F.Pulido-CalvoI.PortelaM. M. (2010). Spatial and Temporal Variability of Droughts in Portugal. Water Resour. Res.46, W03503. 10.1029/2009wr008071
51
SayemuzzamanM.JhaM. K. (2014). Seasonal and Annual Precipitation Time Series Trend Analysis in North Carolina, United States. Atmos. Res.137, 183–194. 10.1016/j.atmosres.2013.10.012
52
SungJ. H.ChungE.-S. (2014). Development of Streamflow Drought Severity-Duration-Frequency Curves Using the Threshold Level Method. Hydrol. Earth Syst. Sci.18, 3341–3351. 10.5194/hess-18-3341-2014
53
SungJ. H.ChungE. S.LeeB.KimY. (2017). Meteorological hazard Risk Assessment Based on the Detection of Trends and Abrupt Changes in the Precipitation Characteristics of the Korean Peninsula. Theor. Appl. Climatol.127 (1), 305–326. 10.1007/s00704-015-1581-0
54
TanC.YangJ.LiM. (2015). Temporal-spatial Variation of Drought Indicated by SPI and SPEI in Ningxia Hui Autonomous Region, China. Atmosphere6, 1399–1421. 10.3390/atmos6101399
55
TangH.WenT.ShiP.QuS.ZhaoL.LiQ. (2021). Analysis of Characteristics of Hydrological and Meteorological Drought Evolution in Southwest China. Water13, 1846. 10.3390/w13131846
56
TaoH.DiopL.BodianA.DjamanK.NdiayeP. M.YaseenZ. M. (2018). Reference Evapotranspiration Prediction Using Hybridized Fuzzy Model with Firefly Algorithm: Regional Case Study in Burkina Faso. Agric. Water Manag.208, 140–151. 10.1016/j.agwat.2018.06.018
57
TaoJ.DongJ. X.LiuG. L.ZhangG. L.ZhuJ. T.SongW. J.et al (2016). Characteristics of Temperature and Precipitation Change along Increasing Elevation in Different Agriculture Regions of Southwest China. Chin. J. Agrometeorology37 (4), 379–389. (in Chinese).
58
TianL.QuiringS. M. (2019). Spatial and Temporal Patterns of Drought in Oklahoma (1901-2014). INT. J. CLIMATOL39, 3365–3378. 10.1002/joc.6026
59
Vicente-SerranoS. M.BegueríaS.López-MorenoJ. I. (2010a). A Multiscalar Drought Index Sensitive to Global Warming: The Standardized Precipitation Evapotranspiration Index. J. Clim.23, 1696–1718. 10.1175/2009jcli2909.1
60
Vicente-SerranoS. M.BegueríaS.López-MorenoJ. I.AnguloM.El KenawyA. (2010b). A New Global 0.5° Gridded Dataset (1901-2006) of a Multiscalar Drought Index: Comparison with Current Drought Index Datasets Based on the Palmer Drought Severity Index. J. Hydrometeorol.11, 1033–1043. 10.1175/2010jhm1224.1
61
Vicente-SerranoS. M.BegueríaS.López-MorenoJ. I. (2011a). Comment on "Characteristics and Trends in Various Forms of the Palmer Drought Severity Index (PDSI) during 1900-2008" by Aiguo Dai. J. Geophys. Res.116, D19112. 10.1029/2011JD016410
62
Vicente-SerranoS. M.López-MorenoJ. I.GimenoL.NietoR.Morán-TejedaE.Lorenzo-LacruzJ.et al (2011b). A Multiscalar Global Evaluation of the Impact of ENSO on Droughts. J. Geophys. Res.116, D20109. 10.1029/2011JD016039
63
VinnarasiR.DhanyaC. T. (2016). Changing Characteristics of Extreme Wet and Dry Spells of Indian Monsoon Rainfall. J. Geophys. Res. Atmos.121, 2146–2160. 10.1002/2015jd024310
64
WangM.DingZ.WuC.SongL.MaM.YuP.et al (2021a). Divergent Responses of Ecosystem Water-Use Efficiency to Extreme Seasonal Droughts in Southwest China. Sci. Total Environ.760, 143427. 10.1016/j.scitotenv.2020.143427
65
WangW.XingW.YangT.ShaoQ.PengS.YuZ.et al (2013). Characterizing the Changing Behaviours of Precipitation Concentration in the Yangtze River Basin, China. Hydrol. Process.27, 3375–3393. 10.1002/hyp.9430
66
WangY.LiuG.GuoE. (2019). Spatial Distribution and Temporal Variation of Drought in Inner Mongolia during 1901-2014 Using Standardized Precipitation Evapotranspiration Index. Sci. Total Environ.654, 850–862. 10.1016/j.scitotenv.2018.10.425
67
WangY.WangZ.ZhangZ.ShenD.ZhangL. (2021b). The Best-Fitting Distribution of Water Balance and the Spatiotemporal Characteristics of Drought in Guizhou Province, China. THEOR. APPL. CLIMATOL143, 1097–1112. 10.1007/s00704-020-03469-w
68
WangZ.LiJ.LaiC.HuangZ.ZhongR.ZengZ.et al (2018). Increasing Drought Has Been Observed by SPEI_pm in Southwest China during 1962-2012. THEOR. APPL. CLIMATOL133, 23–38. 10.1007/s00704-017-2152-3
69
WilhiteD. A. (2005). Drought and Water Crises: Science, Technology, and Management Issues. Boca Raton, FL: CRC Press.
70
WMO (1975). Drought and Agriculture. WMO Technical Note No 138. Geneva Switzerland: WMO-No 392, 127.
71
World Meteorological Organization (WMO) and Global Water Partnership (GWP) (2016). “Handbook of Drought Indicators and Indices,” in Integrated Drought Management Programme (IDMP), Integrated Drought Management Tools and Guidelines Series 2. Editors SvobodaM.FuchsB. A.Geneva.
72
WuC.J.-F. YehP.ChenY. Y.LvW.HuB. X.HuangG.et al (2021). Copula-based Risk Evaluation of Global Meteorological Drought in the 21st century Based on CMIP5 Multi-Model Ensemble Projections. J. Hydrol.598, 126265. 10.1016/j.jhydrol.2021.126265
73
XiaoM.ZhangQ.SinghV. P.LiuL. (2016). Transitional Properties of Droughts and Related Impacts of Climate Indices in the Pearl River basin, China. J. Hydrol.534, 397–406. 10.1016/j.jhydrol.2016.01.012
74
XuK.YangD.YangH.LiZ.QinY.ShenY. (2015). Spatio-temporal Variation of Drought in China during 1961-2012: A Climatic Perspective. J. Hydrol.526, 253–264. 10.1016/j.jhydrol.2014.09.047
75
YangY.ChenR.SongY.HanC.LiuJ.LiuZ. (2019). Sensitivity of Potential Evapotranspiration to Meteorological Factors and Their Elevational Gradients in the Qilian Mountains, Northwestern China. J. Hydrol.568, 147–159. 10.1016/j.jhydrol.2018.10.069
76
YangY.GanT. Y.TanX. (2020). Spatiotemporal Changes of Drought Characteristics and Their Dynamic Drivers in Canada. Atmos. Res.232, 104695. 10.1016/j.atmosres.2019.104695
77
YuH.WangL.YangR.YangM.GaoR. (2018). Temporal and Spatial Variation of Precipitation in the Hengduan Mountains Region in China and its Relationship with Elevation and Latitude. Atmos. Res.213, 1–16. 10.1016/j.atmosres.2018.05.025
78
ZahabiyounB.GoodarziM. R.BavaniA. R. M.AzamathullaH. M. (2013). Assessment of Climate Change Impact on the Gharesou River Basin Using SWAT Hydrological Model. Clean. Soil Air Water41 (6), 601–609. 10.1002/clen.201100652
79
ZengW.YuZ.WuS.QinJ. (2016). Changes in Annual, Seasonal and Monthly Precipitation Events and Their Link with Elevation in Sichuan Province, China. Int. J. Climatol.36, 2303–2322. 10.1002/joc.4496
80
ZhangL.JiaoW.ZhangH.HuangC.HuangQ.TongQ. (2017). Studying Drought Phenomena in the Continental United States in 2011 and 2012 Using Various Drought Indices. Remote Sensing Environ.190, 96–106. 10.1016/j.rse.2016.12.010
81
ZhangM.HeJ.WangB.WangS.LiS.LiuW.et al (2013). Extreme Drought Changes in Southwest China from 1960 to 2009. J. Geogr. Sci.23, 3–16. 10.1007/s11442-013-0989-7
82
ZhaoG.MuX.HörmannG.FohrerN.XiongM.SuB.et al (2012). Spatial Patterns and Temporal Variability of Dryness/wetness in the Yangtze River Basin, China. Quat. Int.282, 5–13. 10.1016/j.quaint.2011.10.020
83
ZhaoJi. (1997). Chinese Physical Geography. 3rd ed.Beijing: Higher Education Press. (in Chinese).
Summary
Keywords
Yunnan-Guizhou Plateau, longitude, elevation, zonal patterns, drought
Citation
Yu H, Wang L and Yang M (2021) Zonal Patterns of Meteorological Drought on the Yunnan-Guizhou Plateau, China. Front. Environ. Sci. 9:722285. doi: 10.3389/fenvs.2021.722285
Received
08 June 2021
Accepted
20 September 2021
Published
14 October 2021
Volume
9 - 2021
Edited by
Ahmed Kenawy, Mansoura University, Egypt
Reviewed by
Safwan Mohammed, University of Debrecen, Hungary
Ali Danandeh Mehr, Antalya Bilim University, Turkey
Updates
Copyright
© 2021 Yu, Wang and Yang.
This is an open-access article distributed under the terms of the Creative Commons Attribution License (CC BY). The use, distribution or reproduction in other forums is permitted, provided the original author(s) and the copyright owner(s) are credited and that the original publication in this journal is cited, in accordance with accepted academic practice. No use, distribution or reproduction is permitted which does not comply with these terms.
*Correspondence: Long Wang, ynndwl@126.com
This article was submitted to Interdisciplinary Climate Studies, a section of the journal Frontiers in Environmental Science
Disclaimer
All claims expressed in this article are solely those of the authors and do not necessarily represent those of their affiliated organizations, or those of the publisher, the editors and the reviewers. Any product that may be evaluated in this article or claim that may be made by its manufacturer is not guaranteed or endorsed by the publisher.