 Xiaoping Li1
 Yuan Yu
 Xunpeng Shi
 Xin Hu
- 1School of Economics, Zhongnan University of Economics and Law, Wuhan, China
- 2Australia-China Relations Institute, University of Technology Sydney, Sydney, NSW, Australia
- 3School of Architecture and Built Environment, Deakin University, Geelong, VIC, Australia
China is the largest producer of carbon in the world. China’s construction industry has received widespread attention in recent years due to its environmental issues. However, little research has been conducted to investigate the environmental efficiency of the domestic part of this industry. As the foreign contribution is beyond China’s control, identification of domestic carbon emissions is necessary to formulate effective policy interventions. Based on a multi-regional input‐output model, this study attempts to reduce the statistical bias associated with international trade, thereby obtaining a more accurate indicator of domestic carbon emission intensity. This study aims to reveal the change in the domestic carbon emission intensity of China’s construction industry during 2000–2014 and analyze the reason behind it. The results show that, first, both the constructed intensity indicator and commonly used measures of carbon emission intensity have exhibited a decreasing trend over the study period. However, the former has been consistently larger than the latter. Moreover, this difference first increased and then suddenly decreased after a particular year. Second, although the domestic carbon emission intensity shows a gradually declining trend, it has moved from second to first in global rankings, implying that China’s domestic construction industry’s carbon emission efficiency, while falling, lags behind other major economies. Third, the structural decomposition results reveal that changes in direct production emission intensity are the leading causes of the decline in domestic carbon emission intensity. In contrast, a change in the intermediate input structure led to an increase in the emission intensity in China’s construction industry. In addition, the enormous gaps of domestic carbon emission intensity in the construction industry between China and the selected countries are mainly attributable to the difference in the intermediate input structure. The study suggests that China’s construction industry needs to promote high value-added output, optimize intermediate input structure, and improve energy and emission efficiency.
Introduction
The global climate crisis necessitates more effective reductions in carbon emissions. China is the largest CO2 emitter in the world and has received increasing attention from the international community in this regard. In response, the Chinese government has specified the goal of reaching peak carbon emissions by 2030and committed to reducing the emission intensity to a value that is 60–65% lower than the 2005 levels by the year 2030 (Chen et al., 2019a). China has recently made an announcement in the UN General Assembly describing its vision to achieve carbon neutrality by 2060 (The Chinese Government, 2020). The attainment of such ambitious climate goals would require the development and implementation of vigorous policies, as well as the strengthening of existing measures.
The construction industry is a typical example of an energy-intensive sector that is particularly becoming a cause of great concern in China. On the one hand, it produces the second-highest amount of carbon, with the record that its embodied carbon input contributed 32% to the increase in total carbon emissions during 1992–2012 (Hou et al., 2020). On the other hand, it represents a backbone industry in China’s economic development, accounting for approximately 7% of the gross domestic product (GDP) and creating over 55 million jobs (NBSC, 2019). Given the vast population, massive urbanization, and the ongoing modernization process, the ensuring excessive construction projects would make the emissions mitigation tasks even more challenging (Wu et al., 2018). Therefore, to better balance the emission reduction tasks and output demands, targeted measures should be formulated to lower the carbon emission intensity of China’s construction industry.
Accurately measuring the carbon emission intensity of domestic production has been particularly challenging due to the proliferation of the global value chain (GVC), usually characterized by extensive intra-product division across countries. With the deepening of trade, production networks often extend to multiple countries. As Johnson and Noguera (2012) pointed out, intermediate goods transactions could explain about 67% of the global trade volume. In China’s construction industry, 27% of the inputs are imported products (Huang et al., 2018). Another noticeable phenomenon is the transfer of pollution across the boundaries (Han et al., 2018). This implies that China’s construction industry not only induces value-added and pollution emissions from domestic upstream production but also induces value-added and pollution emissions from abroad through import channels.
Considering that traditional emission intensity does not distinguish between country sources, it is difficult to measure the emissions per unit of domestic value-added, which could easily result in misleading policy design. However, the reconsideration of carbon emission intensity in the context of GVC has not yet been investigated in the previous literature.
The present attempts to fill this gap in research by constructing a new indicator called domestic carbon emission intensity (DCEI), which excludes foreign intermediate inputs and the associated emissions. In particular, this study uses the multi-regional inputoutput (MRIO) model and the structural decomposition analysis (SDA) method to analyze the changes in the DCEI of China’s construction industry during 2000–2014. Furthermore, some cross-country comparative analyses of DCEI were carried out to provide a more thorough picture of the Chinese construction industry. The considerable references and policy implications that may follow from the empirical results of this study are expected to enhance the carbon emission efficiency of China’s construction industry.
This study extends previous studies in this field from the following three aspects: 1) by separating domestic and foreign contents, this study proposes an analytical framework for measuring domestic carbon emission intensity that is applicable to various sectors; 2) this study uses the most recent data from the World InputOutput Database (WIOD) to measure the DCEI of China’s construction industry during 2000–2014; 3) it analyzes the drivers of DECI variation and the gap between China and other global Frontier economies, thus expanding this type of research to 2014.
The remainder of this study is organized as follows. Literature Review provides a brief review of the relevant literature. The methodology and data are presented in Methodology and Data. Results and Discussion presents the results and discussion of the study. The final section presents the main conclusions of the study.
Literature Review
As reported by Zhou et al. (2020), industry-related changes in China’s carbon emission intensities are mostly shaped by the construction industry. A growing body of literature has focused on carbon mitigation in China’s construction industry. One noticeable feature of this industry is its intensive industrial linkages, which describe the dependence of different economic sectors on each other’s supply and demand (Zhang L. et al., 2019). With the prevalence of GVC, these complicated industrial linkages have broadened to involve various sectors in countries, resulting in misleading traditional measures (Xu et al., 2021). Therefore, it is essential to reevaluate China’s construction industry’s environmental performance from a more integrated production chain perspective. The literature relevant to this study covers the following two main categories.
Carbon Emission Evaluation and Decomposition Analysis
Considerable research efforts have been devoted to evaluating the construction industry’s carbon emissions with varying research scopes. At the macro level, Huang et al. (2018) compared the construction industry’s carbon emissions performance in 40 countries and observed that China is the world’s largest contributor to construction carbon emissions. In China, the carbon emissions in the construction sector have been investigated in different ways, such as process-based life cycle assessment (Chen et al., 2017), inputoutput analysis (Zhang Y. et al., 2019), and hybrid analysis (Zhang and Wang, 2016; Chen et al., 2017; Zhang Y. et al., 2019). At the megaregion level, Qi et al. (2020) estimated the induced pollution emissions in the export of the Yangtze River Delta region through a four-level analytical framework and found that the environmental impact in the construction sector had the largest growth rate and contributed the most to the increase in cross-regional environmental emissions.
In addition, some researchers have identified the factors contributing to carbon emission changes and quantified their contributions. For example, Shi et al. (2017) examined the driving factors of carbon emission changes in China’s construction industry during 1995–2009 using the SDA method. The total final demand has been the leading cause of the increase in the emissions while the energy intensity has led to the highest decrease in the emissions associated with China’s construction industry. Following a life cycle perspective, Wu et al. (2019) applied the logarithmic mean divisia index (LMDI) method to evaluate the drivers of carbon emissions within China’s construction industry during 2000–2015. It was observed that the extraction and manufacturing of raw materials accounted for 58% of the life cycle carbon emissions. Thus, improving energy efficiency as well as lowering emission factors was proposed.
Most existing literature on carbon emission intensity conducted the decomposition analysis, with the index decomposition analysis (IDA) being one of the most intensively used methods (Zhao et al., 2021). However, one major limitation of the IDA approach is that it only considers the driver’s direct impact and disregards the indirect impact of the drivers. In contrast, the SDA method addresses this issue by capturing both direct and indirect effects (Hoekstra and Van den Bergh, 2003). As mentioned above, many studies have utilized the SDA method for total carbon emission decomposition analysis. For example, Wang et al. (2017a) and Wang et al. (2017b) explored the changes in carbon emission intensity at national and sectoral levels, respectively, using the SDA method. Dong et al. (2018) combined SDA and quantile regression to analyze the drivers of changes in China’s carbon emission intensities. Su and Ang (2020) employed the SDA and attribution analysis methods to investigate Singapore’s aggregate carbon intensity at different levels, including the final demand, sector, and transmission levels.
Although the above literature has enriched our understanding of decomposition analysis on carbon intensity by covering many levels, few designs enable both temporal and cross-country comparisons of carbon intensities.
Value-Added Accounting Perspective
With the prevalence of GVC, the misleading quality of traditional statistics has been verified universally with the expansion of intermediate product trade (Johnson and Noguera, 2012). As mentioned before, intermediate inputs and value-added in a certain stage are exported and counted as the cost of the next stage of production, resulting in double-counting problems and statistical biases. This is especially true for countries located downstream of the GVC, such as China (Koopman et al., 2014). A typical example is the iPhone production case. China, the largest exporter of the iPhone, completes the final step of production as a processing hub. However, China gains only 1.8% of the price of each iPhone. In terms of gross calculations, China’s actual economic profits from export trade are far less than those reported using traditional statistics (Kremer et al., 2011).
As Wang et al. (2018) suggested, the deepening GVC system has challenged conventional wisdom on value creation and emissions generation in a given industry in any country. However, studies on carbon emission intensity against the background of GVC are relatively rare (Xiao et al., 2020), particularly in the construction industry. In terms of value measurement, domestic value-added has become a reliable and popular measure of a country’s true economic profits (Xu et al., 2021). In the area of pollution generation, the complexity of GVC makes it difficult to attribute responsibility for domestic and foreign emissions, thus exacerbating the difficulty of formulating sound environmental governance policies. More recent literature has shown that the energy consumption or carbon emissions resulting from a country’s demand are closely associated with the extent, manner, and location of the importing country’s engagement in GVC in addition to its own level of green production (Meng et al., 2018; Wang et al., 2020).
Nevertheless, these limited studies have focused almost exclusively on aggregate indicators rather than intensity or efficiency indicators. Analysis of trends in intensity indicators within the context of GVC has been lacking. One exception is the study conducted by Xiao et al. (2020), which measured the carbon intensities in aggregated demand and further differentiated the demand routes within the context of GVC. However, Xiao et al. (2020) decomposed aggregate emissions instead of intensity indicators for the impact mechanism analysis.
A brief review of the extant literature shows that there are still some gaps in the decomposition analysis of carbon emission intensity from a GVC perspective. As reported by Hung et al. (2019), ongoing vertical specialization and globalization have made the construction industry’s supply chain span an increasing number of economies and have accelerated the displacement of environmental impacts. Therefore, it is important to gain a comprehensive understanding of the carbon emission intensity of China’s construction industry from the GVC trade perspective.
Methodology and Data
Domestic Emissions per Domestic Value-added
As mentioned above, three common approaches are widely used to estimate embodied emissions in the construction field: process-based analysis, hybrid analysis, and inputoutput analysis (Zhang and Wang, 2016). Owing to the distinct research processes and characteristics of these methods, they have been adopted in various studies. Moreover, the construction industry has a strong link with the rest of the economy, particularly its input suppliers. Therefore, the inputoutput approach is more feasible when analyzing both direct and indirect environmental impacts (Acquaye and Duffy, 2010).
The single-region inputoutput (SRIO) model has been commonly adopted to evaluate environmental impacts for quite some time (Nansai et al., 2009; Shan et al., 2017). However, considering the chains of intermediate inputs and final products, the MRIO model would be more effective from a global perspective (Wiedmann, 2009). This method combines bilateral trade data at the sectoral level, which facilitates the identification of relationships between different countries/regions as well as between various sectors in different countries/regions. Therefore, it is a powerful tool for tracking value-added or pollution emissions amidst the surge in international trade (Zhao et al., 2021).
To facilitate intuitive illustration, this section assumes a simplified MRIO model that includes only two countries and two sectors throughout the world (Table 1). This assumption and its findings can be easily extended to a real-world case where there are n countries and/or regions and m sectors. The countries and sectors are denoted using superscripts (s and r) and subscripts (1 and 2), respectively. Letters in the upper case denote the matrix, and lowercase letters denote an element of the corresponding matrix or some numerical value.
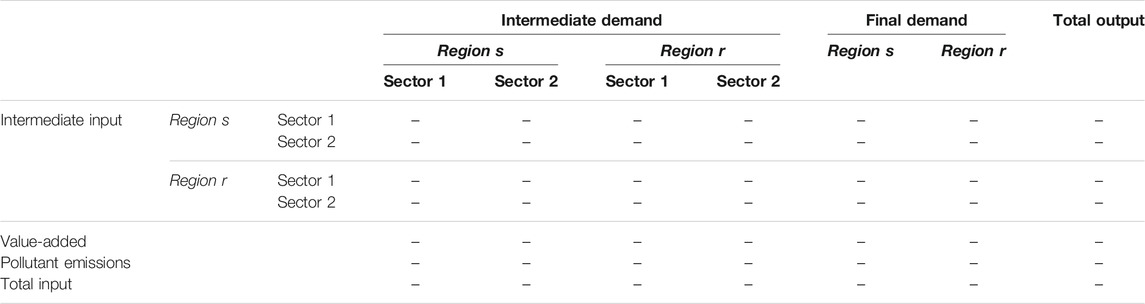
TABLE 1. Illustration of inter-regional inputoutput table (two countries and two sectors).
Additionally, this study defines the intermediate input coefficient matrix as
Let the parameter
where
Since the value-added (or pollutant emissions) can be expressed as the product of the industry output and the value-added coefficient (or emissions coefficient), this relationship can be used to quantitatively compute value-added (or pollutant emissions). Taking the value-added as an example, it can be expressed as follows1:
To further track the value creation induced by the final demand in different sectors, Eq. 7 can be translated into a 4 × 4 square form:
In addition, the value creation in each sector can be derived using the row summation of Eq. 8, and the value creation induced by the final demand can be obtained through the column summation of Eq. 8. Since final demand induces domestic value creation through the use of domestic inputs and foreign inputs, it accordingly induces foreign value creation as well. To isolate the domestic value-added component of the final product, we take the example of the final demand in sector 1 of country s. Assuming that the superscript u denotes any given country and the subscript i represents any given sector, the value-added induced by the final demand in sector 1of country s can be expressed as follows.
It can be observed that the value in the final demand of sector 1 for country
Analogously, the pollutant emissions caused by the demand for final demand can be obtained by substituting the value-added coefficient vector
Thus, for sector 1 of country
Given that country
This implies that the higher the value of
Structural Decomposition Analysis Method
Changes in DCEI During Different Periods
Considering that static measurements of DCEI cannot capture the effects of drivers on changes in emission intensity, this study further applies the SDA method to elaborate the inter-temporal changes of sector 1 in country s. To depict this dynamic process, this study defines the indicator
For the sake of convenience, the four matrices are detailed as follows:
where
Consequently, the change in DCEI (
To eliminate the limitation that the decomposition results are not unique because of the different ordering of elements in the SDA process, this study uses the geometric average method suggested by Xu and Dietzenbacher (2014) to estimate the size of each part. First, the symmetrical form of Eq. 15 can be constructed as below.
Second, the geometric average of these two parts is calculated as below.
Finally, the index
Changes in Differences in DCEI Between Various Countries
The SDA method can also be used to capture the variance in the DCEI of the two countries for a given period. For example, during period t, the difference in DCEI between country
Furthermore, taking the geometric average of Eqs 18, 19, this study also facilitates the traceability of the drivers of the difference in DCEI across various countries/regions based on the bipolar decomposition that has been described in Eq. 17.
Data
This study investigates CO2 emissions and value-added induced by the final demand for China’s construction industry during 2000–2014. In addition, four developed countries (the United States, Japan, France, and Germany) were selected for further cross-country comparisons. These countries have been among the world’s leaders in terms of the final demand scale, as well as their carbon emission efficiency in the construction industry. In particular, the United States, although not very efficient, is included in this analysis on the basis that its final demand scale is merely lower than that of China.
The SRIO model can only explain the total emissions of an economy. It fails to measure the foreign value-added and total emissions caused by the construction industry. Moreover, due to the fact that the data for each country has been published during different years, single-region inputoutput tables cannot be used for consistent cross-country comparisons. With the improvement of inputoutput data, many studies have started to use multi-regional inputoutput tables such as WIOD or Eora to address environmental issues in the context of global value chains. However, the Eora data have a negative final output scenario, contrary to our economic intuition. Therefore, we chose the WIOD database, a more widely used database in the prevailing literature, for our research analysis.
The core database of WIOD is the World InputOutput Tables (WIOT), which includes 28 member countries of the European Union and 15 other important economies, including the United States and China. All other countries are classified into the rest of the world (RoW) region. The 43 economies directly accounted for 90.8 and 85.8% of the world’s GDP in 2000 and 2014, respectively. Moreover, their production outputs accounted for 89.9 and 84.1% of the global production output in 2000 and 2014, respectively (WIOD, 2016). Accordingly, the WIOT can effectively depict the patterns of production technology and domestic (or international) trade. These economies accounted for 82.1 and 78.4% of the world’s carbon emissions in 2000 and 2014, respectively (WIOD, 2016). Therefore, it is adequate to adopt these WIOT sequences and environmental accounts provided by the WIOD to study the impacts of economic operations on natural resources and the environment in different countries or regions.
Results and Discussion
This section first provides an overview of DVA and DCE of China’s construction industry over the study period, followed by a comparison between DCEI and total carbon emission intensity (TCEI) of this sector. This section then analyzes the factors influencing the changes in China’s construction DCEI by utilizing the SDA technique. Furthermore, this section discusses the differences in DCEI between China and other major construction countries (the United States, Japan, France, and Germany) to analyze and bridge the gap between international and domestic carbon efficiency.
DVA and DCE of China’s Construction Industry
By plugging the data into Eqs 8, 9, the final output of China’s construction industry and its domestic part during 2000–2014 were measured (Figure 1). The total final output of China’s construction industry increased from 231.5 billion United States$ in 2000–2775.6 billion United States$ in 2014, with its DVA part increasing from 202.2 billion United States$ in 2000–2410.6 billion United States$ in 2014. Both parameters maintained an increasing trend throughout the study period, with nearly identical growth rates. By plugging the data into Eqs 10, 11, the values of the total induced carbon emissions from China’s construction industry and its domestic part during 2000–2014 were calculated (Figure 2). The total carbon emissions induced by the final output increased from 864.1 million tons in 2000 to 4.1 billion tons in 2014, with its DCE part increasing from 814.3 million tons in 2000 to 3.8 billion tons in 2014. These two parameters also maintained consistent growth over the entire study period and exhibited similar growth rates.
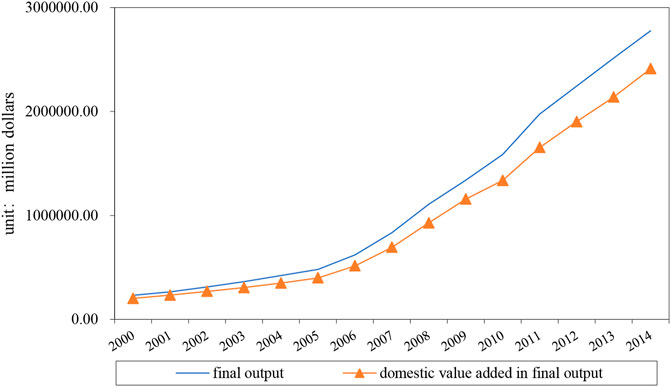
FIGURE 1. The final output and domestic value-added in the final output of China’s construction industry during 2000–2014.
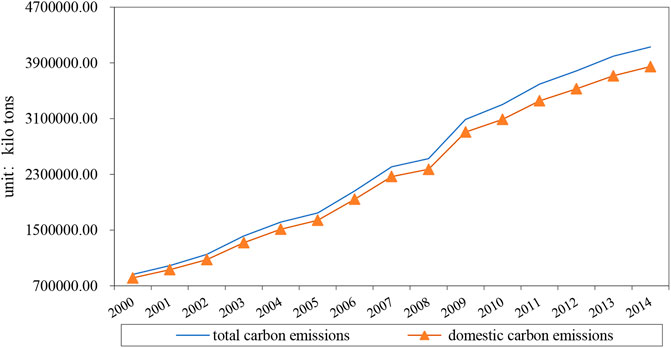
FIGURE 2. The total carbon emissions and the domestic carbon emissions of China’s construction industry during 2000–2014.
Combining the two results, it can be observed that regardless of the year, the estimation results under the gross value method were higher than those under the domestic-only accounting method. As mentioned before, this deviation is caused by the ever-increasing decentralization of global production and trade liberalization. Without the capability to distinguish value-added sources, traditional estimation methods tend to overestimate domestic value creation, as well as domestic-induced carbon emissions. Another interesting point that can be intuitively understood from the graph is that the gross final output overestimates the domestic component to a greater extent than total carbon emissions. This may imply a persistent bias between traditional carbon intensity and pure domestic carbon intensity. Accordingly, the constructed DCEI can serve as an essential basis for depicting China’s pure-domestic construction market’s economic and environmental performance.
DCEI of China’s Construction Industry
Total carbon emission intensity is a commonly used measure in existing studies, and it is usually defined as the amount of carbon emissions per unit of output. As highlighted earlier, both the emissions and output measurements have become complicated in the context of GVC, and this study attempts to reduce such statistical bias. The indicator DCEI constructed in Domestic Emissions Per Domestic Value Added enables us to better understand the true carbon intensity of domestic production in China’s construction industry than the traditional indicator TCEI.
Figure 3 provides an overview of the DCEI and TCEI of China’s construction industry during 2000–2014. On the whole, both indicators have exhibited a significant decline, except for a brief rise during 2002–2004 and a short stagnation during 2008–2009. The TCEI fell from 3.7 kg/$ in 2000 to 1.5 kg/$ in 2014, which represents a decrease of 59.5%. At the domestic level, the carbon intensity fell from 4.0 kg/$ in 2000 to 1.6 kg/$ in 2014, which represents a decrease of 60%. Moreover, the value of DCEI has been consistently larger than that of TCEI, suggesting that the domestic carbon emission efficiency of China’s construction industry is actually worse than its global environmental performance.
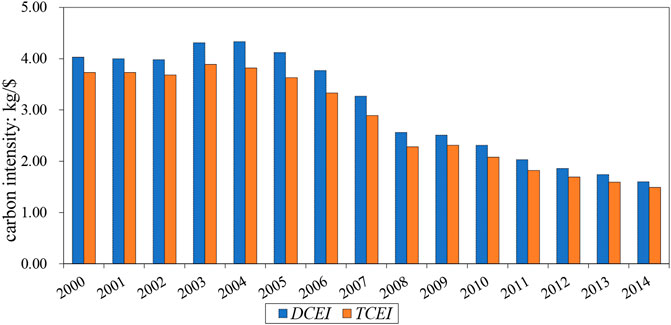
FIGURE 3. DCEI and TCEI of China’s construction industry during 2000–2014.
This is in accordance with the conclusions implied by Huang et al. (2018), who showed that China’s construction industry imports 27% of its intermediate inputs, which only release 5% of its total carbon emissions. Combined with the fact that a tiny percentage of the industry’s final products are exported, the vast majority of the construction carbon emissions would eventually be absorbed domestically. Therefore, the domestic production of China’s construction industry exhibits more extensive characteristics. This implies that the TCEI underestimates the carbon intensity of domestic production to some extent and overestimates its environmental efficiency.
On the positive side, however, the gap between these two indicators was observed to be narrowing during the study’s later phases. The numerical difference peaked at 0.5 kg/$ in 2005 and then continued to decrease until it reached 0.1 kg/$ in 2014. This may indicate that China’s construction industry’s domestic carbon emission efficiency has gradually improved recently, considerably bridging the gap with the rest of the world.
Table 2 reports the final output and DCEI in China’s construction industry over the study period. Generally, as mentioned in the previous subsection, the final output in China’s construction industry has been expanding, while its DCEI has been diminishing. However, these two parameters have one feature in common: China has consistently ranked the highest in the world in terms of both these parameters. Besides, the global ranking of DCEI surpassed that of the final output. Taken together, China’s construction industry has been big in economic output, but not excellent in carbon efficiency.
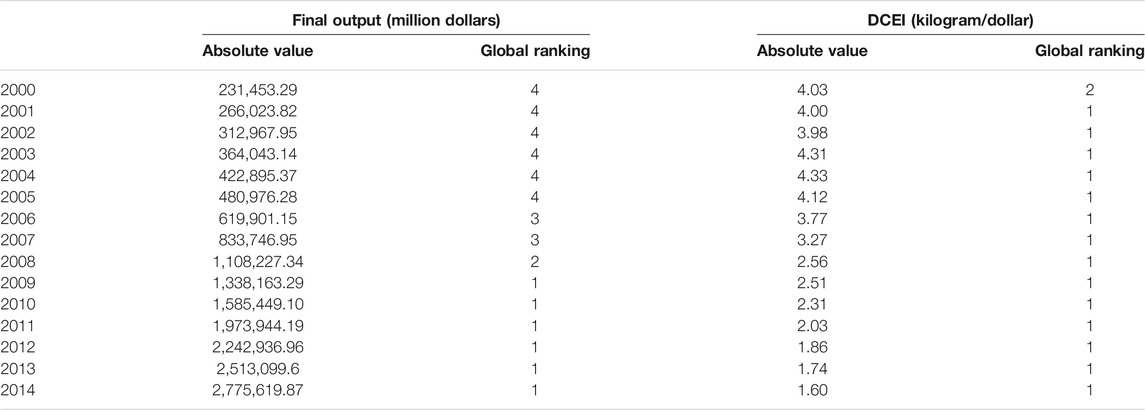
TABLE 2. Final output and DCEI of China’s construction industry during 2000–2014.
Furthermore, to better visualize the carbon emission efficiency of China’s construction industry, the DCEI of China and the seven major construction countries are depicted in Figure 4. Overall, the construction DCEI in all the countries declined over the study period, indicating an overall improvement in clean technology at the global level. In these samples, all developed countries have a lower DCEI than developing countries. France had the lowest DCEI, with a value of 0.1 kg/$ in 2014, which represents only 6.7% of China’s construction DCEI. In terms of changes in DCEI, the decrease in DCEI was also greater in developing countries than in developed countries. In fact, China’s construction industry has made the most progress in carbon efficiency, reducing DCEI by 2.4 kg/$. Despite this remarkable improvement, it has still maintained its top ranking throughout the world. Therefore, the green development of China’s construction industry is not optimal.
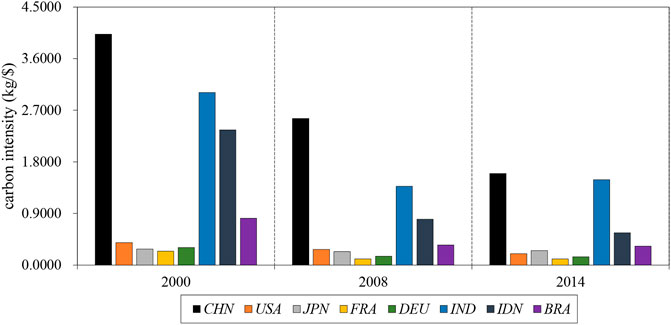
FIGURE 4. DCEI of the world’s major construction countries in the years 2000, 2008, and 2014.
Decomposition of DCEI of China’s Construction Industry
As discussed above, the DCEI of China’s construction industry has been ranked first globally, indicating significant room for the improvement of carbon efficiency through targeted measures. Based on Eqs 13–17, the changes in DCEI during the entire study period and subperiods can be decomposed into the effects of three factors: the direct production emission intensity, the value-added coefficient, and the intermediate input structure, as displayed in Figure 5.
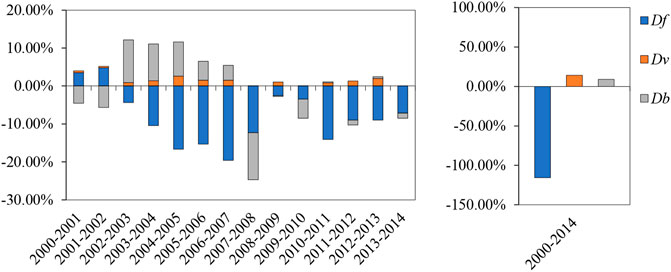
FIGURE 5. SDA results of changes in DCEI of China’s construction industry during 2000–2014.
Throughout the study period, the direct production emission intensity effect contributed the most to the decrease in the DCEI of China’s construction industry, driving a drop of approximately 115.6%. High direct production emission intensity adversely alters the environment, meaning that this factor’s decrease promotes a reduction in DCEI. According to Figure 5, the effect of direct production emission intensity on the decline of DCEI was negative before 2002 and positive thereafter. This phenomenon is possibly closely related to a sharp improvement in cleanliness in many industries in China. With the implementation of environmental regulations such as the Law of the People’s Republic of China on Promoting Cleaner Production in 2003 (Hicks and Dietmar, 2007), the emission intensities of the sectors located upstream of the construction industry have decreased significantly.
Additionally, the construction industry is typically in great need of intermediate inputs from domestic upstream industries. For example, the construction industry accounts for approximately 70% of cement products and 25% of steel products in China (Shi et al., 2017). Consequently, through the transmission along with the production chains, the domestic emissions caused by one unit of final output would reduce drastically. Consequently, the domestic emissions caused by one unit of final output reduce drastically via transmission along the production chains.
In fact, many initiatives have shown that China has endeavored to improve energy efficiency to save energy and reduce emissions. For example, the Chinese government set the goal of a 20% reduction in national energy intensity against the 2006 levels in the 11th Five-Year Plan (Liu et al., 2018). From Figure 6, it is evident that the direct production emission intensity of all sectors maintained a downward trend, especially during the 11th Five-Year Plan period. Such a recent decline shows the effective management of energy efficiency, which should be sustained. For the construction industry itself, China implemented a national energy-efficient design standard for commercial buildings by setting the goal of reducing energy use by up to 50% compared to preexisting buildings. In addition, for large-scale public buildings, a range of targeted regulations concerning energy statistics, energy consumption information disclosure, and energy monitoring systems have been developed and implemented since 2007.
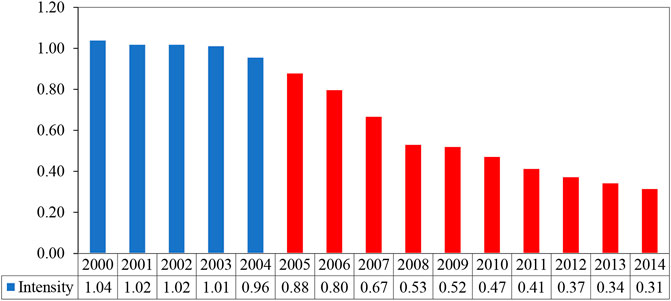
FIGURE 6. Weighted direct production emission intensity of China’s domestic industry during 2000–2014.
The impact of the intermediate input structure was slightly more complicated. Overall, this factor contributed to a 9.0% increase in DCEI. Although this value was much smaller than that of the direct production emission intensity, it did not mean that it had a weak influence on the carbon intensity. It can be observed from Figure 5 that during each subperiod, the impact of the intermediate input structure was slightly weaker than that of the direct production emission factor but much stronger than that of the value-added rate factor. In fact, the relatively low total effect arose from the offset of the different effects at different subperiods. Basically, the intermediate input structure effect contributed negatively towards the decrease in DCEI from 2002 to 2007; however, its contribution was positive during other time periods. That implies that it played a significant role in lowering the carbon efficiency of China’s construction industry in the period after China’s accession to the WTO and before the 2008 subprime mortgage crisis.
From the perspective of historical development, the overall competitiveness of China’s construction industry was relatively inadequate during 2002–2007. In the face of fierce competition brought about by China’s opening up, the construction sector has exhibited characteristics of high energy consumption and low value-added acquisition capacity along the production chain, eventually resulting in high carbon emission intensity. However, after the subprime mortgage crisis, with the decay of foreign competitors and the implementation of the four trillion stimulus plan, the Chinese construction industry, which had become increasingly competitive, switched to the development mode of low energy consumption and high profitability acquisition. Therefore, subject to contrasting effects at each stage, the overall impact is relatively weak.
The role of the value-added coefficient is of particular note, as it adversely affects the reduction of DCEI in China’s construction industry. As shown in Figure 5, the change in the value-added rate resulted in a total increase of 14.0% in DCEI relative to the base period. The explanation for this may lie in the following points: On the one hand, according to the inputoutput theory, the input of one industry is mainly composed of intermediate input and primary input (i.e., value-added). With China’s opening up to the outside world, a large influx of foreign capital has intensified competition between domestic industries. To fulfill the demands of discerning customers and improve the quality of goods and services, the proportion of foreign intermediate inputs has continued to increase during the domestic industrial development process, which has squeezed the primary input (value-added) space (Kim and Xin, 2021). Accordingly, there has been a substantial reduction in the value-added coefficients of most domestic sectors.
As shown in Figure 7, only 13 sectors’ value-added coefficients achieved a positive shift out of 56 domestic departments. On the other hand, with the decline in value-added coefficient of the domestic upstream sector, the extent of domestic value-added by one unit towards the final output of the construction sector was bound to decline. Therefore, specific policies are required to prevent further decline in the domestic value-added coefficient.
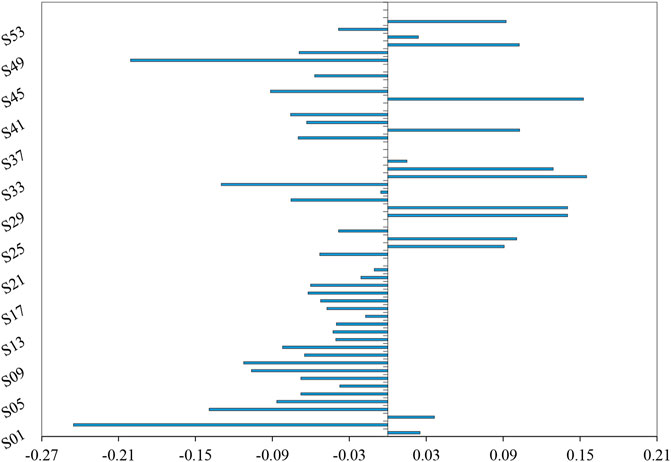
FIGURE 7. The change in the value-added coefficients of China’s domestic industries during 2000–2014.
Comparison in Construction DCEI of China and Selected Countries
Based on Eqs 18, 19, this section employs the SDA approach to further identify the drivers for the large gaps in the DCEI of the construction industry between China and other major construction countries. The results are presented in Figure 8.
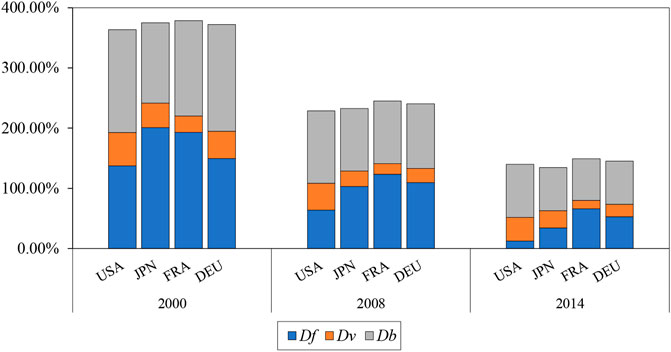
FIGURE 8. SDA results of DCEI differences between China and selected countries in the years 2000, 2008, and 2014.
The decomposition results of cross-country comparisons show that the construction intermediate input structure was the primary cause of the variation in DCEI between China and the selected countries. On average, this factor index could explain 43.0, 46.0, and 52.9% of the inter-country gaps in DCEI in 2000, 2008, and 2014, respectively.
One critical reason is that there has been a much greater demand for new buildings and infrastructure projects in China due to the ongoing modernization and urbanization wave. These new construction activities would inevitably induce massive upstream carbon emissions through the increasing demand for basic raw materials, which are typically carbon-intensive (Huang et al., 2018). In contrast, developed economies generally focus more on maintenance and repair (M&R) activities in the construction industry, which are relatively low carbon and high value-added. For example, Chen et al. (2019b) observed that the United States construction industry absorbs intermediate inputs mostly from repairing works such as the renting of M&R activities. However, China will maintain this considerable demand for new and sophisticated buildings for the foreseeable future. For instance, as a multitrillion-dollar infrastructure program, China’s BeltRoad Initiative will definitely trigger more demand for new construction activities.
In addition, China’s urbanization rate reached 60.3% in 2019, which is still much smaller than 82.5 and 91.7% in the United States and Japan, respectively (World Bank, 2020). Therefore, it might not be practical to reduce the negative impact of intermediate input structures on DCEI gaps by limiting the demand for new construction activities (Zhang et al., 2021). Given that upstream suppliers play a tremendously important role, it will be useful to improve the environmental performance of the construction industry by promoting low-carbon production technology within upstream sectors and optimizing the industrial structure. Regarding the construction industry itself, innovative construction technologies, such as off-site construction and low-carbon building materials such as wood, should be given higher priority.
The second most influential factor was the difference in direct production emission intensities. On average, it accounted for 45.7, 42.3, and 29.2% of the international gaps in the DCEI in 2000, 2008, and 2014, respectively. According to Peng et al. (2016), China’s carbon emissions intensities were estimated to be 2.4 times greater than the world’s average level in 2007, primarily due to its coal-dominated energy consumption pattern. In 2014, coal consumption constituted 66.0% of China’s primary energy consumption, while for the United States, Japan, France, and Germany, it accounted for 19.7, 27.7, 3.8, and 24.9%, respectively (BP, 2015). Although the share of coal use in China fell to 58.2% in 2018 (BP, 2019), the effect of such a slight decline on environmental efficiency would be quite limited. Coal causes more pollution emissions under the same energy demand, given that coal has a higher pollutant emission factor than other fossil fuels such as oil and natural gas (Jiang et al., 2019).
To optimize the energy structure, the Chinese government imposed a cap on coal consumption at 4.2 billion tons before 2020, and at the same time, the use of nonfossil fuels was set to account for 15% (Wu et al., 2018). However, compared with developed countries, clean energy still accounts for a small proportion of total energy in China, making it difficult to completely replace coal when meeting the growing demand for energy consumption in the short term. To control coal consumption without negatively affecting economic development, policy-makers should take active measures, such as reducing the coal share in the energy mix, encouraging the use of clean energy sources, and improving energy efficiency.
Another factor was the difference in value-added coefficients, which could only explain 11.3, 11.8, and 18.0% of these regional DCEI gaps in 2000, 2008, and 2014, respectively. The low value-added rate in China’s construction industry has been expanding the international gap in environmental efficiency, reinforcing the above finding. Policy guidance is needed to close the gap in value-added rates between China and advanced economies. For example, although outsourcing and importing intermediate inputs are conducive to the national economy through the “learning by doing” effect, encouraging deep processing after import trade is equally essential. In addition, enhancing the labor force’s skill training and promoting technological innovation will help to upgrade China’s capacity for supplying high-value-added products.
Comparisons of Construction Intermediate Input Structure Across Countries
As discussed in the previous subsection, the intermediate input structure was the most critical factor for China’s higher DCEI than other economies, and its effect has grown over time. This subsection comparatively examines the construction intermediate input structures of China and the selected countries. Figure 9 depicts the distinct differences in the construction intermediate input structure between China and the four selected countries. Compared with other countries, China’s construction industry relies more on primary products, manufacturing, electricity, gas, and water collection industries, but less on the service industry when absorbing intermediate inputs.
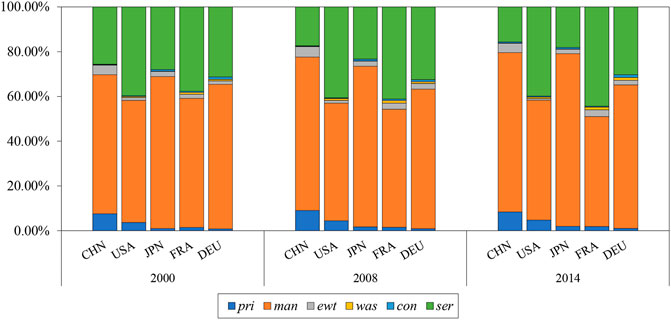
FIGURE 9. Differences in the construction intermediate input structure between China and selected countries in the years 2000, 2008, and 2014. Note: pri represents the primary product industry including four sectors (S01-S04); man represents the manufacturing industry including 19 sectors (S05-S23); ewt represents electricity, gas, and water collection sectors (S24-S25); was represents the waste collection sector (S26); con represents construction industry (S27); ser represents the service industry including 29 sectors (S28-S56).
Consider the difference between China and the United States as an example. In 2000, the proportions of China’s construction intermediate inputs transformed from the primary product, manufacturing, electricity, gas, and water collection sectors, and the service industry in China was 3.9% higher, 7.5% higher, 3.0% higher, and 14.1% lower than those of the United States, respectively. These gaps have widened. In 2014, the ratios of construction intermediate inputs converted from the primary product, manufacturing, electricity, gas, and water collection sectors, and the service industry in China was 3.6% higher, 17.7% higher, 3.4% higher, and 24.2% lower than those in the United States
From the perspective of industry characteristics, in general, the service industry has the advantages of higher value-added rate and lower pollution emissions compared with the primary product, manufacturing, electricity, gas, and water collection sectors. Consequently, the development mode of construction intermediate input structures has seriously hindered the reduction of its DCEI in China. More emphasis should be placed on transforming and optimizing the construction intermediate input structure to narrow the specific gap with other economies. In addition, as a highly profitable and environmentally friendly industry, the service industry has great potential for improving the domestic environmental performance of China’s construction industry. Therefore, there is an urgent need for China’s construction industry to raise the share of input from the service sector by utilizing more research and development (R&D) products and brand operation services, rather than high pollution production links.
Conclusions and Policy Implications
Given the tremendous amount of carbon emissions from the construction industry, reducing the carbon intensity is imperative to achieve China’s ambitious carbon mitigation targets. In the context of GVC, it is easy to disambiguate the value-added source and destination of carbon emissions when studying the carbon intensity of an industry in a country. This may create misleading information for policy interventions, which can only be effective for domestic production.
In this study, we rigorously extracted the domestic value-added and domestic carbon emission components from the total carbon emissions. Furthermore, using the SDA technique, the changes in DCEI during different periods, as well as the changes in differences of DCEI across various countries, can be decomposed into the effects of three influencing factors: direct production emission intensity, value-added coefficient, and intermediate input structure.
Several key findings are provided. First, for China’s construction industry, the commonly used TCEI and the constructed DCEI have been declining over the entire research period. Nevertheless, the values of TCEI have always been smaller than those of DCEI, revealing that China’s domestic construction production has worse emission performance compared to its international suppliers.
Second, although the DCEI of China’s construction industry has decreased significantly, it has moved from second to first in terms of global rankings. That is, the carbon efficiency of China’s construction industry, while improving, lags behind other major economies of the world. Therefore, China’s construction industry shows the typical characteristic of being large in economic outputs, but relatively poor in environmental efficiency.
Third, the cross-year decomposition analysis reveals that changes in direct production emission intensity (principally from upstream sectors) and intermediate input structure are the key factors for reducing DCEI in China’s construction industry. Specifically, the former has a promoting effect, while the latter has an inhibitory effect. Finally, compared with other major construction countries, China’s poor environmental performance is chiefly attributable to its extensive mode of intermediate input structure, which is too biased towards high pollution and low value-added products.
In light of the above findings, some useful recommendations for policy-makers are provided. First, emphasis should be placed on optimizing the construction intermediate input structure. This can be achieved through two policy instruments. One involves promoting innovative and low-carbon building structures. With the massive demand for new and complex buildings in China, there are many opportunities to promote innovative building structures. For example, compared with the conventional brick concrete structure or shear-wall structure, the steel structure, encouraged in recent years, consumes less cement while meeting the needs of high-rise, long-span buildings. The other instrument involves promoting the development and utilization of low-carbon and recyclable building materials. The intermediate input structure transformation could also be strengthened by reducing the dependence on high energy consumption and carbon-intensive products and enhancing construction services.
Second, there is an urgent need for the construction industry and its upstream sectors to employ clean production technologies. From the perspective of China’s energy consumption structure, limiting coal consumption, improving energy efficiency, and encouraging sustainable energy sources should be prioritized. In addition, to promote clean innovation and technological development, the government should provide sufficient support for capital investment, such as financial subsidies and tax reductions, to relevant enterprises.
Finally, raising the value-added coefficients of the involved industries is also an important part of the efforts directed towards the mitigation of emissions. In other words, the construction industry should upgrade the capacity to provide high value-added products. To fulfill this purpose, the government should improve the talent training mechanism, enabling lower-level workers to improve vocational skills. Additionally, policies should strengthen intellectual property protection, encourage the transformation of R&D results into products, and promote cooperation between industries and research institutes.
Due to the constraints regarding data availability, the main limitation of this study is that the data used were confined between 2000 and 2014. Therefore, future studies should work on strengthening the research effort by revising these data-related issues. In addition, this study can be extended to analyze other pollutant emissions or other important industries in various countries.
Data Availability Statement
The original contributions presented in the study are included in the article/Supplementary Material, further inquiries can be directed to the corresponding author.
Author Contributions
XL and YY: writing original draft preparation, conceptualization, methodology, software. XS: writing review and editing. YY and XH: validation. All authors contributed to the article and approved the submitted version.
Funding
The authors gratefully acknowledge the financial support provided by the Major Project of National Social Science Foundation of China (grant number 18ZDA038).
Conflict of Interest
The authors declare that the research was conducted in the absence of any commercial or financial relationships that could be construed as a potential conflict of interest.
The handling editor declared a past co-authorship with one of the authors XS.
Publisher’s Note
All claims expressed in this article are solely those of the authors and do not necessarily represent those of their affiliated organizations, or those of the publisher, the editors and the reviewers. Any product that may be evaluated in this article, or claim that may be made by its manufacturer, is not guaranteed or endorsed by the publisher.
Footnotes
1The dot product between the two matrices here represents the corresponding elements of the two for multiplication.
2The superscript T represents the transpose of the matrix. Since the SDA decomposition form is not unique, this paper defines
References
Acquaye, A. A., and Duffy, A. P. (2010). Input-output Analysis of Irish Construction Sector Greenhouse Gas Emissions. Building Environ. 45, 784–791. doi:10.1016/j.buildenv.2009.08.022
Chen, J., Shen, L., Shi, Q., Hong, J., and Ochoa, J. J. (2019a). The Effect of Production Structure on the Total CO2 Emissions Intensity in the Chinese Construction Industry. J. Clean. Prod. 213, 1087–1095. doi:10.1016/j.jclepro.2018.12.203
Chen, J., Shen, L., Song, X., Shi, Q., and Li, S. (2017). An Empirical Study on the CO2 Emissions in the Chinese Construction Industry. J. Clean. Prod. 168, 645–654. doi:10.1016/j.jclepro.2017.09.072
Chen, J., Shi, Q., Shen, L., Huang, Y., and Wu, Y. (2019b). What Makes the Difference in Construction Carbon Emissions between China and USA? Sust. Cities Soc. 44, 604–613. doi:10.1016/j.scs.2018.10.017
Dong, F., Yu, B., Hadachin, T., Dai, Y., Wang, Y., Zhang, S., et al. (2018). Drivers of Carbon Emission Intensity Change in China. Resour. Conservation Recycling 129, 187–201. doi:10.1016/j.resconrec.2017.10.035
Han, L., Han, B., Shi, X., Su, B., Lv, X., and Lei, X. (2018). Energy Efficiency Convergence across Countries in the Context of China's Belt and Road Initiative. Appl. Energ. 213, 112–122. doi:10.1016/j.apenergy.2018.01.030
Hicks, C., and Dietmar, R. (2007). Improving Cleaner Production through the Application of Environmental Management Tools in China. J. Clean. Prod. 15, 395–408. doi:10.1016/j.jclepro.2005.11.008
Hou, H. M., Bai, H. T., Ji, Y. J., Wang, Y., and Xu, H. (2020). A Historical Time Series for Inter-industrial Embodied Carbon Transfers within China. J. Clean. Prod. 264, 121738. doi:10.1016/j.jclepro.2020.121738
Huang, L., Krigsvoll, G., Johansen, F., Liu, Y., and Zhang, X. (2018). Carbon Emission of Global Construction Sector. Renew. Sust. Energ. Rev. 81, 1906–1916. doi:10.1016/j.rser.2017.06.001
Hung, C. C. W., Hsu, S.-C., and Cheng, K.-L. (2019). Quantifying City-Scale Carbon Emissions of the Construction Sector Based on Multi-Regional Input-Output Analysis. Resour. Conservation Recycling 149, 75–85. doi:10.1016/j.resconrec.2019.05.013
Jiang, T., Huang, S., and Yang, J. (2019). Structural Carbon Emissions from Industry and Energy Systems in China: An Input-Output Analysis. J. Clean. Prod. 240, 118116. doi:10.1016/j.jclepro.2019.118116
Johnson, R. C., and Noguera, G. (2012). Accounting for Intermediates: Production Sharing and Trade in Value Added. J. Int. Econ. 86, 224–236. doi:10.1016/j.jinteco.2011.10.003
Kim, M., and Xin, D. (2021). Export Spillover from Foreign Direct Investment in China during Pre- and post-WTO Accession. J. Asian Econ. 75, 101337. doi:10.1016/j.asieco.2021.101337
Koopman, R., Wang, Z., and Wei, S.-J. (2014). Tracing Value-Added and Double Counting in Gross Exports. Am. Econ. Rev. 104, 459–494. doi:10.1257/aer.104.2.459
Liu, B., Wang, D., Xu, Y., Liu, C., and Luther, M. (2018). A Multi-Regional Input-Output Analysis of Energy Embodied in International Trade of Construction Goods and Services. J. Clean. Prod. 201, 439–451. doi:10.1016/j.jclepro.2018.08.029
Meng, B., Peters, G. P., Wang, Z., and Li, M. (2018). Tracing CO2 Emissions in Global Value Chains. Energ. Econ. 73, 24–42. doi:10.1016/j.eneco.2018.05.013
Nansai, K., Kagawa, S., Suh, S., Fujii, M., Inaba, R., and Hashimoto, S. (2009). Material and Energy Dependence of Services and its Implications for Climate Change. Environ. Sci. Technol. 43, 4241–4246. doi:10.1021/es8025775
Peng, S., Zhang, W., and Sun, C. (2016). 'Environmental Load Displacement' from the North to the South: A Consumption-Based Perspective with a Focus on China. Ecol. Econ. 128, 147–158. doi:10.1016/j.ecolecon.2016.04.020
Qi, X., Mao, X., Huang, X., Wang, D., Zhao, H., and Yang, H. (2020). Tracing the Sources of Air Pollutant Emissions Embodied in Exports in the Yangtze River Delta, China: A Four-Level Perspective. J. Clean. Prod. 254, 120155. doi:10.1016/j.jclepro.2020.120155
Shan, Y., Guan, D., Liu, J., Mi, Z., Liu, Z., Liu, J., et al. (2017). Methodology and Applications of City Level CO 2 Emission Accounts in China. J. Clean. Prod. 161, 1215–1225. doi:10.1016/j.jclepro.2017.06.075
Shi, Q., Chen, J., and Shen, L. (2017). Driving Factors of the Changes in the Carbon Emissions in the Chinese Construction Industry. J. Clean. Prod. 166, 615–627. doi:10.1016/j.jclepro.2017.08.056
Wang, H., Ang, B. W., and Su, B. (2017a). A Multi-Region Structural Decomposition Analysis of Global CO 2 Emission Intensity. Ecol. Econ. 142, 163–176. doi:10.1016/j.ecolecon.2017.06.023
Wang, H., Ang, B. W., and Su, B. (2017b). Multiplicative Structural Decomposition Analysis of Energy and Emission Intensities: Some Methodological Issues. Energy 123, 47–63. doi:10.1016/j.energy.2017.01.141
Wang, L., Yue, Y., Xie, R., and Wang, S. (2020). How Global Value Chain Participation Affects China's Energy Intensity. J. Environ. Manage. 260, 110041. doi:10.1016/j.jenvman.2019.110041
Wang, Q., Hang, Y., Su, B., and Zhou, P. (2018). Contributions to Sector-Level Carbon Intensity Change: An Integrated Decomposition Analysis. Energ. Econ. 70, 12–25. doi:10.1016/j.eneco.2017.12.014
Wiedmann, T. (2009). A Review of Recent Multi-Region Input-Output Models Used for Consumption-Based Emission and Resource Accounting. Ecol. Econ. 69, 211–222. doi:10.1016/j.ecolecon.2009.08.026
Wu, P., Song, Y., Zhu, J., and Chang, R. (2019). Analyzing the Influence Factors of the Carbon Emissions from China's Building and Construction Industry from 2000 to 2015. J. Clean. Prod. 221, 552–566. doi:10.1016/j.jclepro.2019.02.200
Wu, Y., Chau, K. W., Lu, W., Shen, L., Shuai, C., and Chen, J. (2018). Decoupling Relationship between Economic Output and Carbon Emission in the Chinese Construction Industry. Environ. Impact Assess. Rev. 71, 60–69. doi:10.1016/j.eiar.2018.04.001
Xiao, H., Sun, K., Tu, X., Bi, H., and Wen, M. (2020). Diversified Carbon Intensity under Global Value Chains: A Measurement and Decomposition Analysis. J. Environ. Manage. 272, 111076. doi:10.1016/j.jenvman.2020.111076
Xu, X., Wang, Q., Ran, C., and Mu, M. (2021). Is burden Responsibility More Effective? A Value-Added Method for Tracing Worldwide Carbon Emissions. Ecol. Econ. 1, 181.
Xu, Y., and Dietzenbacher, E. (2014). A Structural Decomposition Analysis of the Emissions Embodied in Trade. Ecol. Econ. 101, 10–20. doi:10.1016/j.ecolecon.2014.02.015
Zhang, L., Liu, B., Du, J., Liu, C., and Wang, S. (2019a). CO2 Emission Linkage Analysis in Global Construction Sectors: Alarming Trends from 1995 to 2009 and Possible Repercussions. J. Clean. Prod. 221, 863–877. doi:10.1016/j.jclepro.2019.02.231
Zhang, S., Li, Z., Ning, X., and Li, L. (2021). Gauging the Impacts of Urbanization on CO2 Emissions from the Construction Industry: Evidence from China. J. Environ. Manage. 288, 112440. doi:10.1016/j.jenvman.2021.112440
Zhang, Y., Yan, D., Hu, S., and Guo, S. Y. (2019b). Modelling of Energy Consumption and Carbon Emission from the Building Construction Sector in China, a Process-Based LCA Approach. Energy Policy 134, 110949. doi:10.1016/j.enpol.2019.110949
Zhang, Z., and Wang, B. (2016). Research on the Life-Cycle CO 2 Emission of China's Construction Sector. Energy and Buildings 112, 244–255. doi:10.1016/j.enbuild.2015.12.026
Zhao, Y., Cao, Y., Shi, X., Zhang, Z., and Zhang, W. (2021). Structural and Technological Determinants of Carbon Intensity Reduction of China's Electricity Generation. Environ. Sci. Pollut. Res. 28, 13469–13486. doi:10.1007/s11356-020-11429-0
Keywords: domestic carbon emission intensity, cross-country comparisons, construction, China, global value chain
Citation: Li X, Yu Y, Shi X and Hu X (2021) Tracking the Domestic Carbon Emission Intensity of China’s Construction Industry: A Global Value Chain Perspective. Front. Environ. Sci. 9:728787. doi: 10.3389/fenvs.2021.728787
Received: 22 June 2021; Accepted: 16 August 2021;
Published: 15 September 2021.
Edited by:
Yongping Sun, Hubei University Of Economics, ChinaReviewed by:
Ye Cao, Beijing Institute of Technology, ChinaSolomon Prince Nathaniel, University of Lagos, Nigeria
Copyright © 2021 Li, Yu, Shi and Hu. This is an open-access article distributed under the terms of the Creative Commons Attribution License (CC BY). The use, distribution or reproduction in other forums is permitted, provided the original author(s) and the copyright owner(s) are credited and that the original publication in this journal is cited, in accordance with accepted academic practice. No use, distribution or reproduction is permitted which does not comply with these terms.
*Correspondence: Yuan Yu, c29maWFfeXV5dWFuQDEyNi5jb20=