 Xuyang Wang
 Yuqiang Li
 Yulong Duan1,2
 Lilong Wang
- 1Northwest Institute of Eco-Environment and Resources, Chinese Academy of Sciences, Lanzhou, China
- 2Naiman Desertification Research Station, Northwest Institute of Eco-Environment and Resources, Chinese Academy of Sciences, Tongliao, China
- 3School of Resources and Environment, University of Chinese Academy of Sciences, Beijing, China
- 4School of Environmental and Municipal Engineering, Lanzhou Jiaotong University, Lanzhou, China
- 5College of Agriculture, Inner Mongolia University for Nationalities, Tongliao, China
Stock estimates are critical to quantifying carbon and nitrogen sequestration, quantifying greenhouse gas emissions, and understanding key biogeochemical processes (i.e., soil carbon and nutrient cycling). Many studies have assessed soil organic matter and nutrients in different ecosystems. However, the spatial distribution of carbon and nitrogen and the key influencing factors in arid desert steppe remain unclear. Here, we investigated the soil organic carbon (SOC) and soil total nitrogen (STN) to a depth of 100 cm at 126 sites in a desert steppe in northwestern China. SOC and STN contents decreased with increasing depth; the highest average SOC and STN contents were 12.70 and 0.65 g kg−1 in the surface 5 cm, and the lowest were from 80 to 100 cm (4.49 and 0.16 g kg−1, respectively). SOC density (SOCD) and STN density (STND) to a depth of 100 cm averaged 8.94 and 0.45 kg m−2, respectively. The top 1 m of the soils stored approximately 1,041 Tg SOC and 52 Tg STN in the study area. Geostatistical analysis showed strong and moderate spatial autocorrelation for SOCD in different soil layers, but the autocorrelation for STND gradually weakened with increasing depth. SOCD and STND decreased from southwest to northeast in the study area, along an elevation gradient. Both were significantly positively correlated with topographic variables, precipitation, and the normalized-difference vegetation index, but negatively correlated with temperature and aridity. More than 40% of the SOCD and STND spatial variation was explained by elevation, which was the dominant factor. The data and high-resolution maps from this study will support future soil carbon and nitrogen analyses.
1 Introduction
The most recent report of the Intergovernmental Panel on Climate Change (Cubasch et al., 2013) confirmed that the global climate is warming. The emission of greenhouse gases (CO2, CH4, NOx, and chlorofluorocarbons) and other anthropogenic driving factors have become the main cause of climate warming since the early 20th century, and the magnitude of the increase of the global average surface temperature during the 21st century and beyond will depend on the cumulative emission of CO2.
The soil carbon pool is the largest and most active carbon pool in terrestrial ecosystems and is an important source of atmospheric greenhouse gases. The global soil organic carbon (SOC) pool is about 1,550 Pg, which is twice the atmospheric carbon pool and three times the biological carbon pool (Lal, 2004). Thus, slight changes in the SOC pool will significantly affect the atmospheric carbon content; for example, a change of only 10% of the SOC pool is equivalent to 30 years of CO2 releases caused by human activities (Kirschbaum, 2000). In addition, a slight increase in the rate of soil carbon oxidation caused by an increase in temperature will increase the atmospheric CO2 concentration (Davidson and Janssens, 2006).
The rate of SOC accumulation depends strongly on the net primary productivity of plants, which in most ecosystems is mainly limited by nitrogen (N) (Jobbágy and Jackson, 2000). Therefore, as major components of the global carbon and nitrogen cycles, SOC and soil total nitrogen (STN) interact to affect the atmospheric concentration of greenhouse gases and global climate change, and understanding their amounts and how those amounts are changing has become a hot topic in global climate change research (Batjes, 1996; Reeves, 1997; Bronson et al., 2004; Liu et al., 2012; Stockmann et al., 2013; Lehmann and Kleber, 2015; Wang et al., 2019). Accurately quantifying SOC and STN storage and its spatial distribution have great significance for the carbon and nitrogen sink capacity of the world’s soils and for research on global carbon and nitrogen cycles (Minasny et al., 2013, 2017; Adhikari et al., 2014).
Accurate measurement of the spatial pattern of SOC and STN storage can provide a scientific basis for sustainable soil utilization and management (Zhang et al., 2012). Since soil sampling sites are finite and sparsely distributed, any quantitative description of soil properties relies on prediction models (Piccini et al., 2014). One simple method is to allocate the average SOC and STN stocks to each map unit of a given soil type (Bohn, 1982; Berg and Reich, 1993; Batjes, 1996; Arrouays et al., 2001), life zone (Post et al., 1982), or vegetation or ecosystem type (Jobbágy and Jackson, 2000; Bernoux et al., 2002). However, the use of constant values within each map unit ignores the large spatial heterogeneity of SOC and STN within and between map units (Adhikari et al., 2014; Yang et al., 2016). Spatial interpolation provides a more effective method to map the spatial pattern of soil properties by extrapolating from discrete sample data (Schloeder et al., 2001). Spatial heterogeneity has been most often quantified using geostatistical methods, as the approach is relatively objective and provides robust mapping capabilities (Armstrong and Dowd, 1997).
Most landscape-scale assessments of SOC have focused on grasslands (Wang et al., 2009; Kamarudin et al., 2019), agricultural landscapes (Lacoste et al., 2014; Piccini et al., 2014), and sandy land (Zuo et al., 2010; Li et al., 2018). Many factors affect the spatial variability of SOC, such as hydrothermal conditions (e.g., temperature and precipitation; Post et al., 1982; Wang S. et al., 2017; Wang et al., 2019), soil properties (e.g., soil type, texture and moisture, Homann et al., 1995; Wang et al., 2002; Zinn et al., 2005), topographic factors (e.g., elevation, slope aspect, and slope; Tsui et al., 2004; Garten et al., 2006; Seibert et al., 2007; Wiesmeier et al., 2014), and vegetation conditions (e.g., vegetation types, cover, and productivity; Wang et al., 2000; Fang et al., 2012; Yang et al., 2014; Xin et al., 2016).
Drylands, which are defined as sites with <500 mm mean annual precipitation (Noy-Meir, 1973), are significant components of the terrestrial ecosystem. They cover more than one-third of the Earth’s land surface and account for 36% of the world’s carbon stocks (Campbell et al., 2008; Pointing and Belnap, 2012). In addition, Koyama et al. (2019) note that this land may play an increasingly important role in the future as “these ecosystems can be more responsive to elevated CO2 than others because net primary productivity is mostly limited by water availability.” The main land cover type in drylands is steppe, which represents an important global C pool, amounting to 8% of the total reservoir (IPCC, 2001). Zhao et al. (2018) reported that desert soils exhibit higher atmospheric CO2 fixation capacity than meadow soils. Desert steppe is widely distributed in northwestern China, where it covers an area of about 6.56 × 10⁷ ha (Chang et al., 2013).
The Hexi Corridor in northwestern China is a typical arid region, where represents a desert steppe ecosystem. It occupies a transitional zone between desert and oases or between desert and grassland (Figure 1). This region has unique features, such as a high soil gravel content, limited precipitation, low vegetation cover, and serious wind erosion, and the vegetation plays a prominent role in maintaining a stable ecological environment and productivity (Wang et al., 2014). The desert steppe vegetation in the Hexi Corridor is dominated by small xerophytic shrubs or subshrubs with shallow roots (Wang et al., 2013), which results in small biomass and low soil C and N inputs. Compared with other typical steppes, the unique characteristics of the Hexi Corridor’s desert steppe may lead to high variation of SOC and STN storage, but few studies have focused on this desert steppe. The desert steppe ecosystem in arid regions is very fragile and vulnerable to natural and anthropogenic disturbances, leading to an increase of atmospheric CO2.
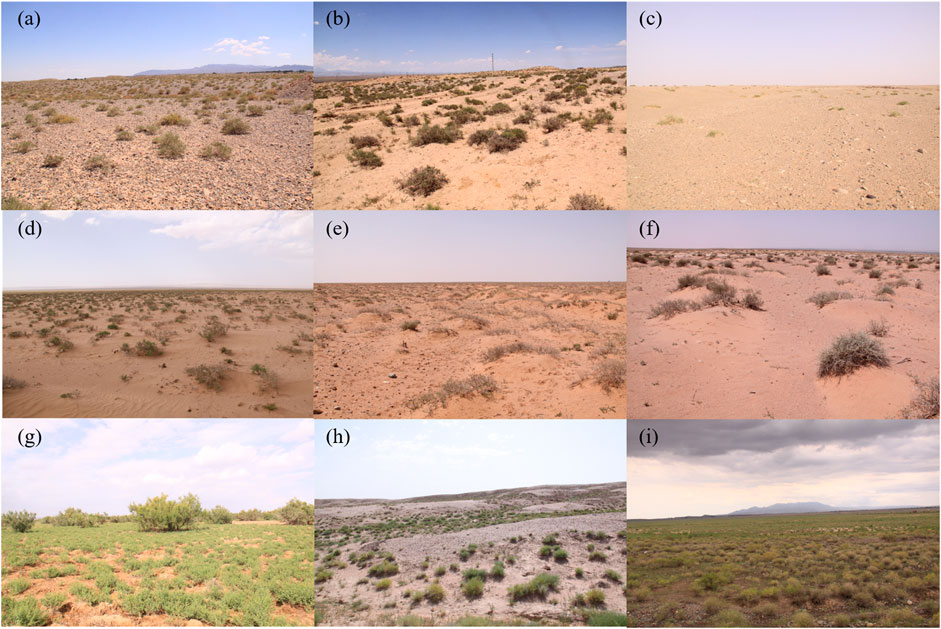
FIGURE 1. Typical landscapes of the desert steppe in the Hexi Corridor, northwest China. Photo source: The authors’ personal photographs.
Despite the ecological importance of this region, its soil C and nutrient values and their distribution are poorly understood. To improve our understanding of this region, we defined several research questions: 1) What is the spatial heterogeneity of SOC and STN and their density at a regional scale? 2) How do these variables vary with soil depth? 3) What is the spatial pattern of SOC and STN density and stocks in this area? 4) What factors control the spatial heterogeneity of SOC and STN? Our specific study objectives were to 1) quantify the spatial heterogeneity of SOC and STN in the soils of the region’s desert steppe, 2) clarify the spatial distribution and stocks of SOC and STN, and 3) analyze the factors that control the spatial distribution of SOC and STN. Our results enrich understanding of regional biogeochemical processes (i.e., soil carbon and nutrient cycling), and provide a valuable baseline for future research on the long-term evolution of SOC and STN.
2 Materials and Methods
2.1 Description of the Study Area
The study area is located in the middle part of the Hexi Corridor, on the northern slope of the Qilian Mountains, in northwestern China (Figure 2). The region has a typical desert climate with cold winters and hot, dry summers, and is classified as BWK in the Koppen climatic classification (Yang et al., 2014). The regional average annual air temperature ranges from 5 to 9°C (Wang et al., 2014). The annual average precipitation varies from 50 mm in the southeast to 250 mm in the northwest, of which 70–80% falls from June to August. The main soil types are Calcic-Orthic Aridosols according to the Chinese Soil Taxonomy, which are equivalent to the Aridosols and Entisols in the USDA soil taxonomy (GCST, 2001). The soil thickness ranges from 0.2 to 1.5 m, and most soils contain a large amount of gravel (0.5–6.0 cm in diameter), especially below a depth of 30 cm. Vegetation cover is low, and ranges from 5 to 15%. The dominant plant species comprise small shrubs and sub-shrubs, such as Asterothamnus alyssoides, Artemisia capillaris, Achnatherum inebrians, Artemisia scoparia, Bassia dasyphylla, Carex tristachya, Nitraria sphaerocarpa, Reaumura soongorica, Salsola passerina, Sympegma regelii, and Suaeda glauca (Yang et al., 2014).
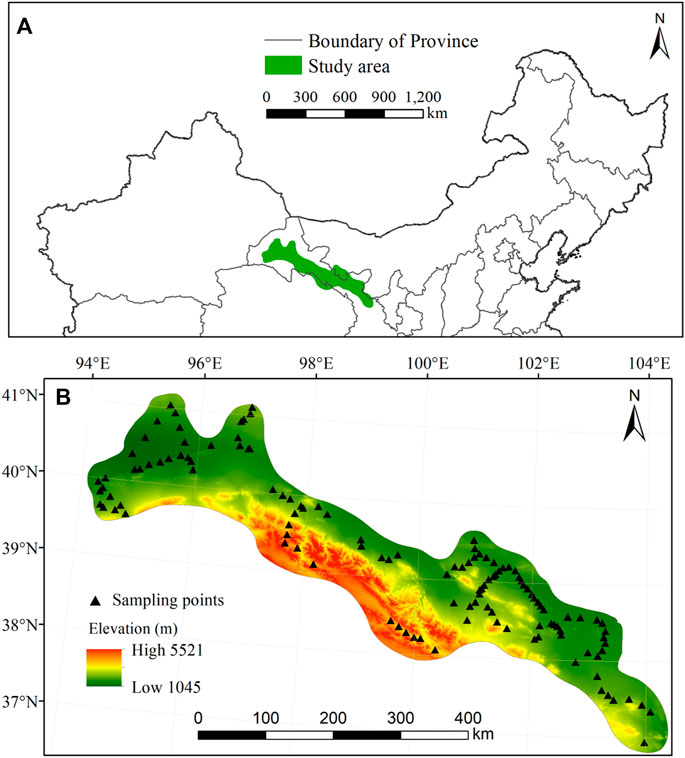
FIGURE 2. Locations of the study area and the 126 sampling sites, which are superimposed on a digital elevation model with 500 m resolution.
2.2 Soil Sampling and Laboratory Analysis
In the desert steppes of the Hexi Corridor, we manually collected soil samples at 126 sites from July to August 2019. First, we established a 10 m × 10 m plot at each site, then collected the soil samples randomly at 15 sampling points within each plot. The samples were divided into depth ranges of 0–5, 5–10, 10–20, 20–40, 40–60, 60–80, and 80–100 cm. The samples were then bulked to prepare a composite sample for each layer. However, due to the large amount of gravel in the study area, the sampling depth for some samples were less than 100 cm. We combined the samples that we were able to obtain to produce one composite sample for each depth range, yielding a total of 851 composite samples (rather than 126 samples × 7 depths = 882 samples). In addition, we collected three undisturbed 100 cm3 soil cores (replicates) at each site at each depth to estimate the dry soil bulk density at that depth.
In the laboratory, the samples were air-dried and passed through a 2 mm sieve to remove roots and other coarse debris, and then ground to pass through a 0.25 mm mesh. Due to a shortage of funds for our research, the SOC concentrations were determined using the Walkley-Black dichromate wet oxidation procedure (Nelson and Sommers, 1982) rather than by dry combustion. Since this wet oxidation can typically oxidize about 90% of organic matter compared with the dry combustion method, we multiplied the measured SOC values by a correction coefficient of 1.1 (Kalembasa and Jenkinson, 1973; Soon and Abboud, 1991; Wang S. et al., 2017). The STN concentrations was determined using the Kjeldahl procedure (Bremner, 1960). The 100 cm3 cores were dried for 48 h at 105°C for bulk density measurement (Blake and Hartge, 1986). The soil particle sizes were defined according to the international soil particle size classification standard: clay (<0.002 mm), silt (0.002–0.02 mm), fine sand (0.02–0.2 mm), and coarse sand (0.2–2 mm). The contents of these size classes were determined using a MS2000 laser particle size analyzer (Malvern Instruments, Malvern, United Kingdom). The pH values of the soil samples were determined using a glass electrode pH meter (1:2.5, soil: deionized water).
2.3 Calculations of Soil Organic Carbon and Soil Total Nitrogen Stocks
The soil organic carbon density (SOCD, in kg C m−2) and soil total nitrogen density (STND in kg C m−2) to a depth of 100 cm for an individual sample were calculated by the equations of Batjes (1996):
where k represents the soil layer, SOC and STN represent the SOC and STN concentrations (g kg−1), Di is the thickness of soil layer i (m), and vf is the volumetric fraction occupied by coarse fragments >2 mm (%) (Cools and De Vos, 2010).
2.4 Environmental Variables
A suite of 10 environmental variables representing climate, topography, and vegetation were collected to identify the regional-scale factors that controlled the spatial pattern of SOC and STN in the study area’s desert steppes. All environmental variables were uniformly converted into raster data with a spatial resolution of 500 m using version 10.3 of the ArcMap GIS software (http://www.esri.com). We obtained data from the Data Center for Resources and Environmental Sciences, Chinese Academy of Sciences (http://www.resdc.cn) for five climatic variables: mean annual precipitation (MAP), mean annual temperature (MAT), Thornthwaite’s moisture index (TMI), aridity index (ARI, which equals evaporation/precipitation), and cumulative annual temperature (CAT). The climatic datasets originally had a cell size of 1,000 m and were resampled to 500 m using a nearest-neighbor strategy. We also chose four topographic variables: elevation, slope, ground roughness, and profile curvature. These values were derived from the Shuttle Radar Topography Mission (SRTM) digital elevation model (DEM; https://www2.jpl.nasa.gov/srtm/). For our final variable, we derived the monthly normalized-difference vegetation index (NDVI) dataset at a 1 km spatial resolution from the SPOT/VEGETATION NDVI satellite remote sensing data, which is generated using the 10 days maximum value composite method (Xu, 2018). The same method was used to generate the NDVI data during the growing season (April to September) in 2019.
2.5 Geostatistical and GIS Analyses
Geostatistics has proven to be an effective method to study the spatial variability and patterns of soil properties (Wang, 1999). The spatial variation of each regionalized geostatistical variable is usually quantified using the semi-variogram γ(h), which can be defined as half of the statistically expected squared difference between paired data values z (x) and z (x + h) with a lag distance h:
where E represents the statistical expectation, and z (x) and z (x + h) represent the paired data values being compared over a lag distance of h (Reese, 2001). We used four semi-variogram models (linear, spherical, exponential, and Gaussian) to describe the semi-variograms, and used three eigenvalues (range, sill, and nugget) to describe these models. To fit the best model, we calculated two indices to assess the effectiveness of the predictive map, namely the mean error (ME) and the root-mean-square standardized error (RMSSE):
where n represents the sample size,
2.6 Statistical Analysis
Kolmogorov-Smirnov test was used to examine the normality of the SOC, STN, and BD data, and used Pearson’s correlation coefficient (r) to relate the dependent variables SOC and STN to the independent quantitative variables. We defined significance at p < 0.05. Detecting multicollinearity is important because while multicollinearity does not reduce the explanatory power of the model, it does reduce the statistical significance of the independent variables. The variance inflation factor (VIF) and tolerance were two closely related statistics for diagnosing collinearity in multiple regression, and the stepwise regression was used to eliminate multicollinearity factors. The above methods were all carried out in version 22.0 of the SPSS software (https://www.ibm.com/analytics/spss-statistics-software). We applied redundancy analysis (RDA), a constrained ordination method developed by van den Wollenberg (1977), to investigate the proportion of the variability in SOC and STN that could be explained by the environmental variables. We used version 5.0 of the Canoco software (http://www.canoco5.com/) to perform this analysis. The significance of the eigenvalues of the first canonical axis and of all axes together were tested by means of 1,000 Monte-Carlo permutations.
3 Results
3.1 Descriptive Statistics
Table 1 summarizes the SOC and STN contents and the BD for the samples. Both concentrations were highly variable, with SOC ranging from 0.47 to 336.61 g kg−1 and STN ranging from 0.02 to 7.78 g kg−1 for the top 20 cm of the soil. SOC concentrations ranged from 0.24 to 41.48 g kg−1 and STN concentrations ranged from 0.01 to 2.72 g kg−1 in the deeper soil layers. The mean SOC and STN concentrations generally decreased with increasing depth, except that the SOC concentration in the 80–100 cm soil layer was higher than that in the 60–80 cm soil layer. The SOC and STN data were positively skewed at all soil depths. Compared with SOC and STN, BD varied less among the depths, although it increased with increasing soil depth, with mean values of 1.44 g cm−3 to a depth of 20 cm and 1.51 g cm−3 to a depth of 100 cm.
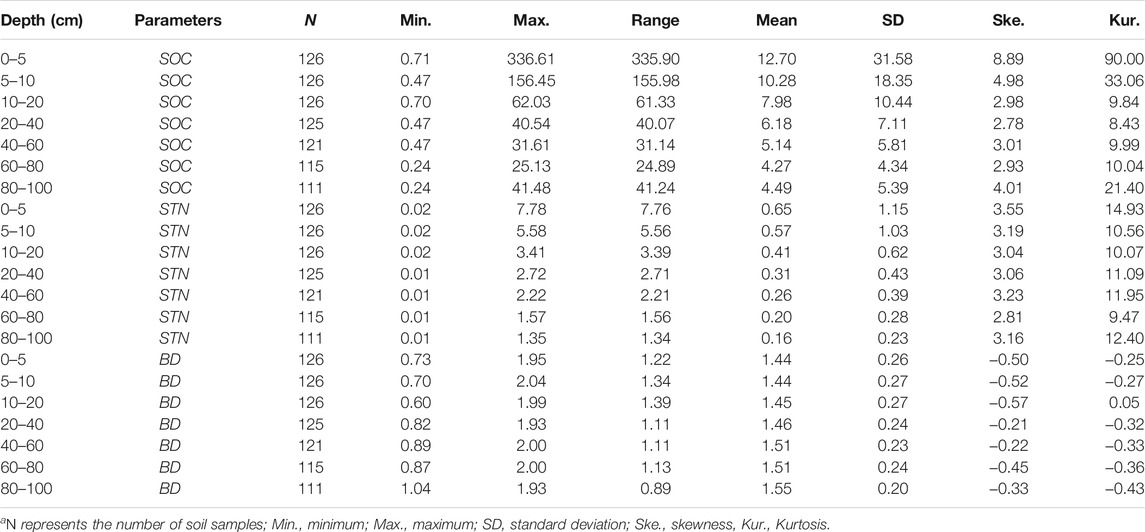
TABLE 1. Descriptive statistics for the soil organic carbon (SOC) concentration (g kg−1), soil total nitrogen (STN) concentration (g kg−1), and bulk density (BD) (g cm−3) across the 100 cm profile.a
3.2 Geostatistical Analysis of Soil Organic Carbon Density and Soil Total Nitrogen Density
Table 2 shows the best-fit semi-variogram models for the seven soil layers. The theoretical models efficiently revealed the spatial variability of both SOCD and STND because the ME values were all near 0 and the RMSSE values were all close to 1. The optimal SOCD and STND models were Gaussian in most soil layers, except for the layers from 5 to 10 cm and 10–20 cm for SOCD and 10–20 cm for STND. In the classification by Cambardella and Karlen (1999), nugget to sill ratios <25%, 25–75% and >75% represent strong, moderate, and weak spatial autocorrelation, respectively. Most of the nugget to sill ratios for SOCD ranged from 0.9 to 23.2%, which indicates strong spatial autocorrelation, except for the SOCD from 5 to 10 cm and 20–40 cm (29.2 and 28.3%, respectively), which indicates moderate spatial autocorrelation. The values of the nugget to sill ratio for STND decreased from 25.3 to 10.3% in the top 20 cm of the soil, then increased from 22.9 to 79.2% with increasing depth, indicating that the upper soil showed stronger spatial autocorrelation than the deeper soil, with the spatial autocorrelation gradually weakening with increasing depth.
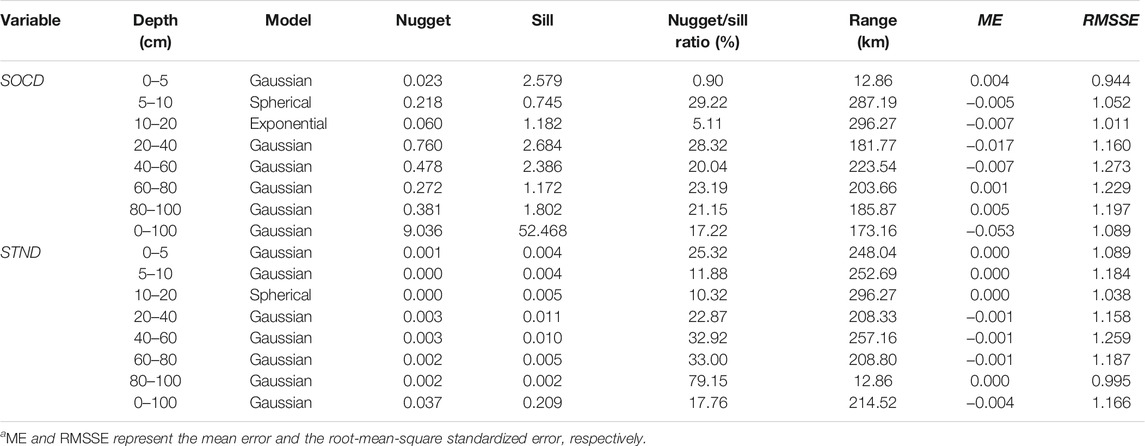
TABLE 2. Semi-variogram model parameters for the soil organic carbon density (SOCD) and soil total nitrogen density (STND) to a depth of 100 cm.a
3.3 Correlations With the Influencing Factors
Figure 3 shows that SOC was significantly positively correlated with STN at all depths in the soil profile. SOCD and STND both showed significant positive correlations with the topographic variables (i.e., elevation, slope, ground roughness, and curvature) across the entire soil profile (p < 0.01), except for nonsignificant correlations between SOCD and curvature at depths of 0–5 cm and 80–100 cm and between STND at a depth of 80–100 cm (Table 3). This suggests that SOC and STN tend to accumulate on steep slopes at high elevations in the desert steppes. For the climatic variables, SOCD and STND were significantly positively correlated with MAP and TMI, but significantly negatively correlated with ARI and air temperature (both MAT and CAT). NDVI was significantly positively correlated with SOCD and STND in all soil layers. For the different grain size grades, SOCD and STND were significantly negatively correlated with the coarse sand content, but significantly positively correlated with the silt content, whereas the correlations with the fine sand content were not significant and the positive correlations with the clay content were only significant at depths greater than 20 cm, indicating that the coarse sand and silt contents in the desert soil were more likely than the other particle sizes to determine the SOC and STN concentrations. In addition, SOCD and STND were negatively correlated with soil pH, and the correlations were significant in the topsoil for SOCD, versus all depths for STND.
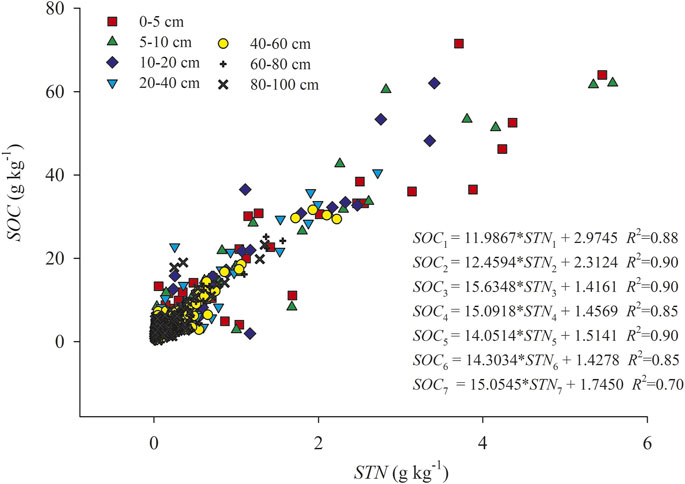
FIGURE 3. Scatterplots for the relationships between the soil organic carbon (SOC) and soil total nitrogen (STN) concentrations in the different soil layers. SOC values 1 to 7 correspond to depths from 0 to 5 cm to 80–100 cm, respectively. All regressions were statistically significant (p < 0.05).
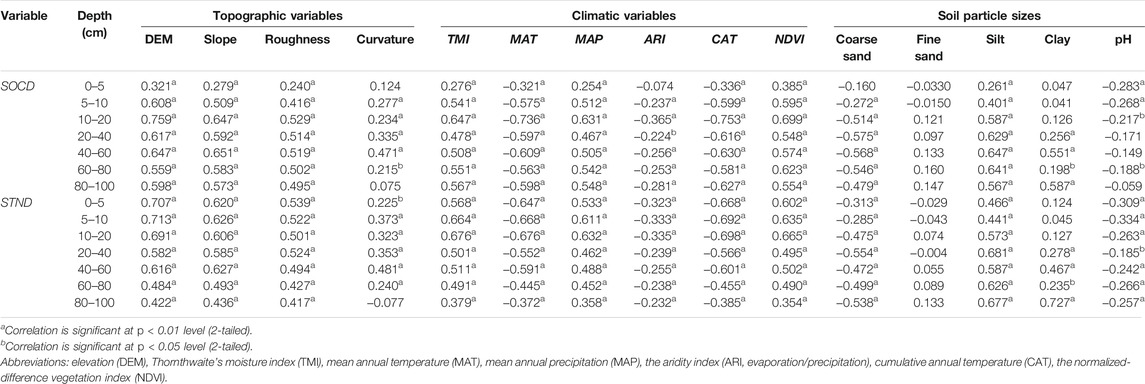
TABLE 3. Pearson’s correlation coefficients for the relationships between soil organic carbon density (SOCD) and soil total nitrogen density (STND) and their influencing factors.
3.4 Spatial Aggregation of Soil Organic Carbon Density and Soil Total Nitrogen Density
The spatial pattern maps created by ordinary kriging showed that SOCD and STND decreased from southwest to northeast in the desert steppes of the Hexi Corridor (Figures 4, 5), suggesting a gradient effect. The highest SOCD and STND values were mainly located in the high-elevation areas of the Qilian Mountains in the southwest. In contrast, the low values were found towards the northeastern edge of the study area at lower elevations. According to the zonal statistics, the total SOCD and STND to a depth of 100 cm averaged 8.94 and 0.45 kg m−2, respectively, and the soils stored approximately 1,041 Tg SOC and 52 Tg STN within the top 1 m for the entire study area.
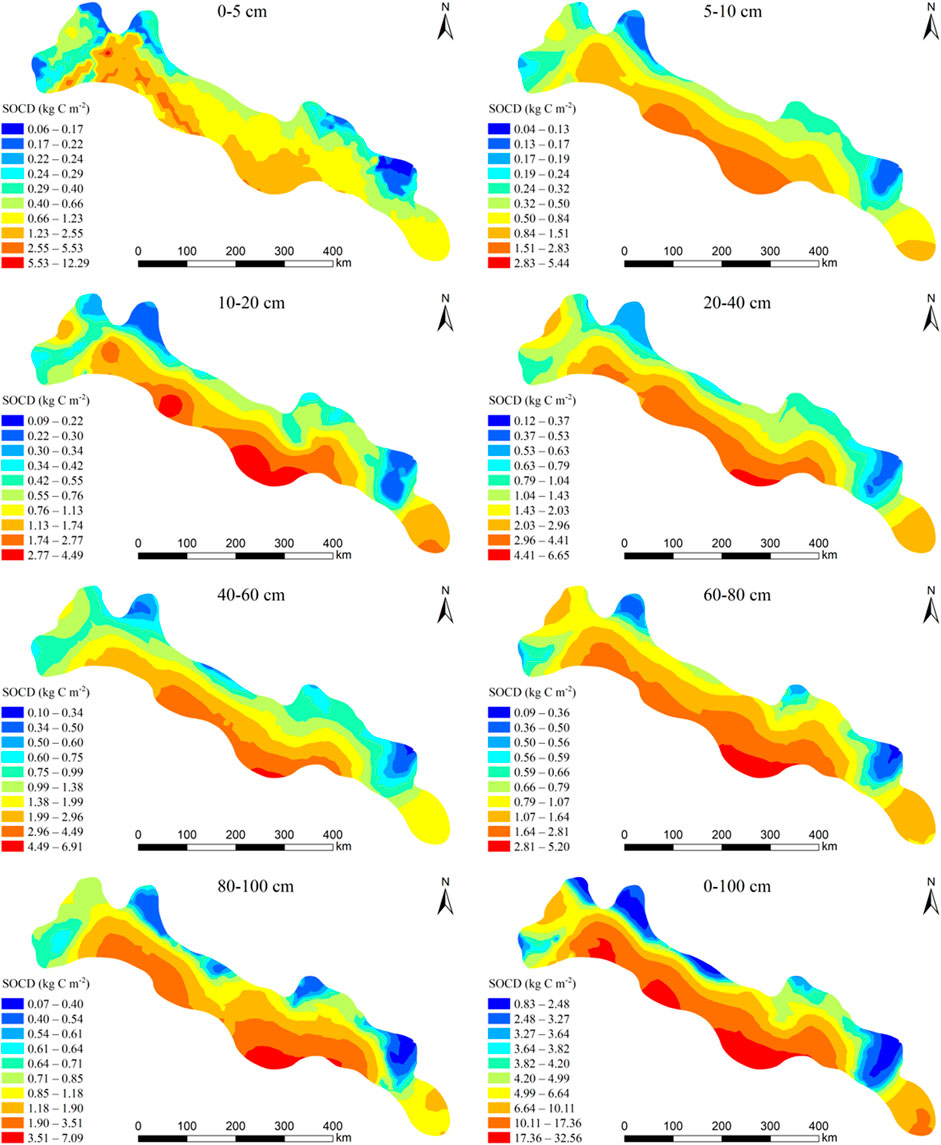
FIGURE 4. Spatial pattern of soil organic carbon density (SOCD) for the different soil layers in the desert steppe area of the Hexi Corridor, in northwestern China. Ranges of SOCD were calculated using the natural breaks method.
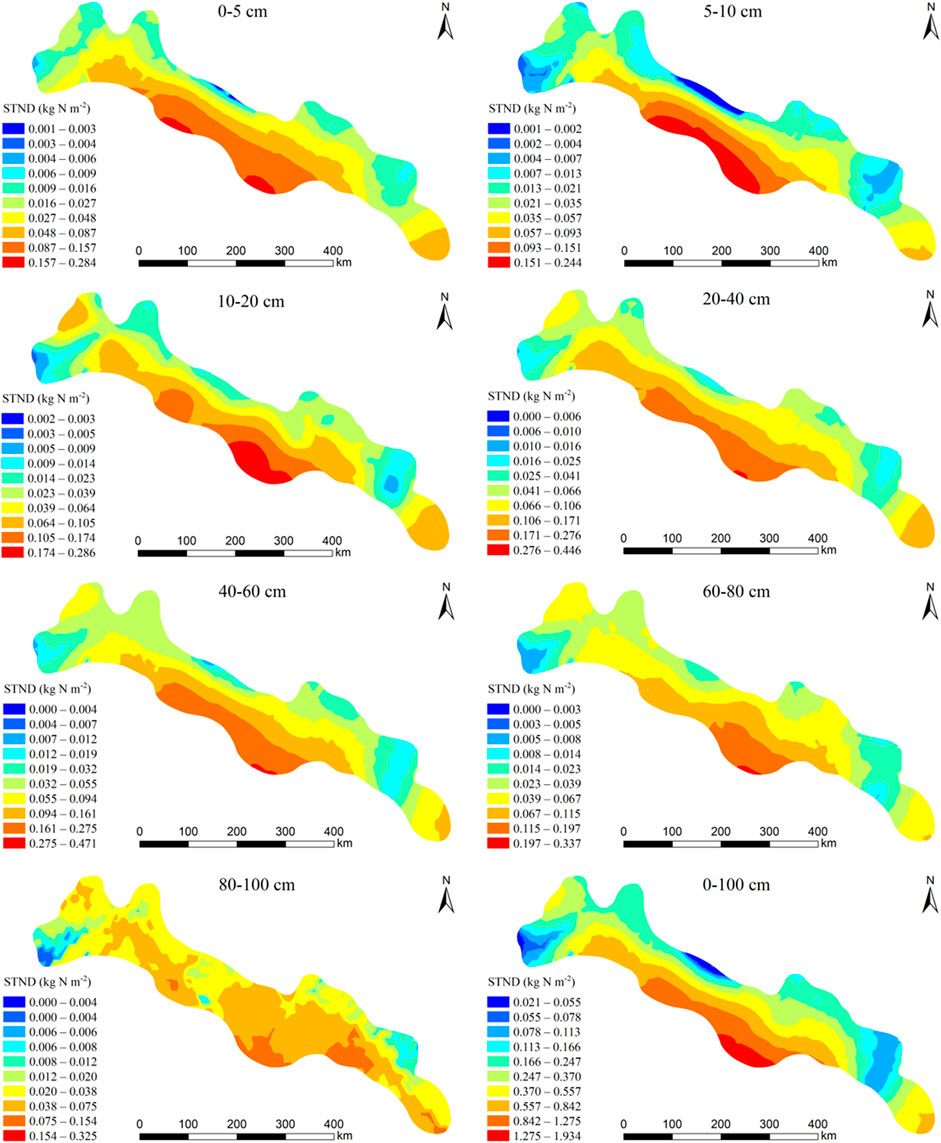
FIGURE 5. Spatial pattern of soil total nitrogen density (STND) for the different soil layers in the desert steppe area of the Hexi Corridor, in northwestern China. Ranges of SOCD were calculated using the natural breaks method.
3.5 Effects of Environmental Factors on the Spatial Variation of Soil Organic Carbon Density and Soil Total Nitrogen Density
After stepwise regression analysis, five environmental variables including Dem, NDVI, Slope, ARI and MAP were selected for further analysis of their effects on the spatial variation of SOCD and STND. The tolerance of these 5 variables were all greater than 0.1, and VIF were all less than 10, indicating that there is no multicollinearity between five environmental variables (Hair et al., 2009). Figure 6 shows the RDA ordination results for SOCD and STND to a depth of 100 cm and the influencing factors. The cumulative percentage of the variance of the dependent variables (SOCD and STND) explained by the influence factors totaled 51.2% for the first two axes. SOCD and STND were both positively associated with topographic factors (i.e., elevation and slope), as well as with NDVI, and MAP. In contrast, SOCD and STND were both negatively associated with ARI. Furthermore, we used a partial Monte Carlo permutation test to evaluate the contributions of each environmental factor to the variation of SOCD and STND (Table 4). Elevation explained the largest proportion of the variation in SOCD and STND (43.5%), and also had the highest contribution rate (84.9%). The influences of NDVI and slope were statistically significant, but much smaller (<5% of the variation explained). The effects of the other influencing factors were small and not statistically significant. This indicated that elevation was the dominant environmental driver for the spatial variation of SOCD and STND in the desert steppes of the Hexi Corridor.
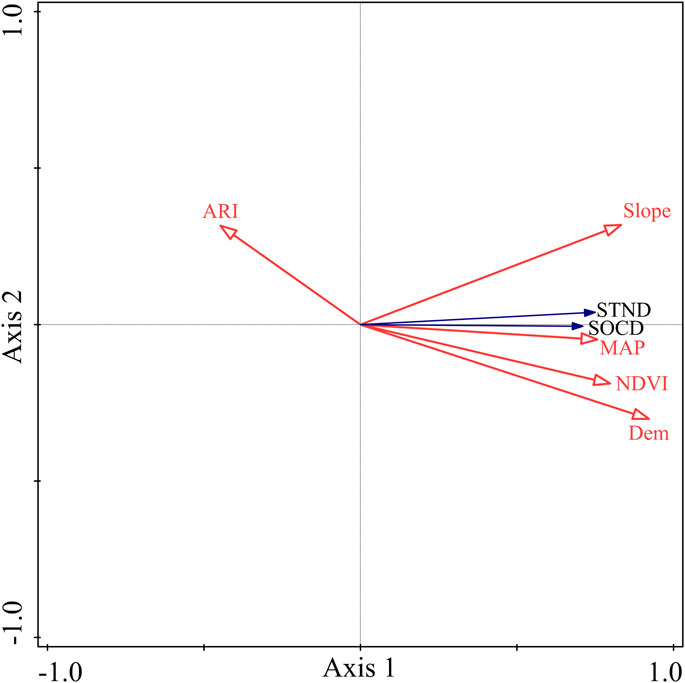
FIGURE 6. Redundancy analysis ordination diagram for soil organic carbon density (SOCD) and soil total nitrogen density (STND) to a depth of 100 cm and the associated influence factors. Abbreviations: ARI, the aridity index (evaporation/precipitation); CAT, cumulative annual temperature; DEM, elevation; MAT, mean annual temperature, NDVI, the normalized-difference vegetation index; MAP, mean annual precipitation; TMI, Thornthwaite’s moisture index.
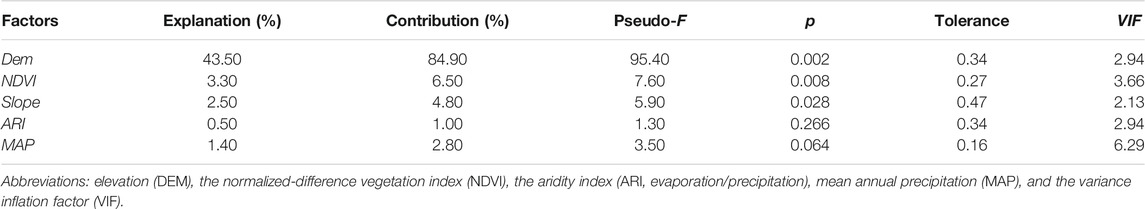
TABLE 4. The proportions of the variation explained (explanation rate) and contribution of the influencing factors to variations of soil organic carbon density (SOCD) and soil total nitrogen density (STND) to a depth of 100 cm in the redundancy analysis.
4 Discussion
4.1 Spatial Distribution (Vertical and Horizontal) of Soil Organic Carbon and Soil Total Nitrogen
In this typical desert steppe area, SOC and STN decreased with increasing depth in the soil. This trend was most likely caused by the decomposition of plant residues, which were primarily distributed on or near the soil surface (Sheikh et al., 2009). Higher organic C and N contents were also found in topsoil elsewhere in the world, such as in cropland and grassland ecosystems in southeastern Germany (Wiesmeier et al., 2013), a subalpine forested catchment on Mt. Taiyue, China (Wang T. et al., 2017), in eastern Australia (Hobley et al., 2015), in the eastern Swiss Alps (Zollinger et al., 2013), in the state of Bavaria in southeastern Germany (Wiesmeier et al., 2014), in Piracicaba, Brazil (Gmach et al., 2020), and in disturbed Carex tussock wetland of Momoge National Natural Reserve, China (Qi, et al., 2021). This suggests that the surface soil participates most actively in C sequestration (Li et al., 2013).
In the present study, SOCD and STND to a depth of 100 cm showed vertical spatial heterogeneity both as a function of depth and along the elevation gradient. Strong and moderate spatial dependence for SOCD and STND were found in most soil layers, except for STND in the lowest layer (80–100 cm). Previous research suggested moderate spatial dependence for SOC in the surface and middle soil layers (the upper 40 cm) in southern African savannas (Wang et al., 2009), subalpine forested catchments on Mt. Taiyue in China (Wang T. et al., 2017), and in a typical catchment on China’s Loess Plateau (Li et al., 2013). The spatial autocorrelation for SOCD in our study was relatively high (with a mean of 18.3% for the nugget/sill ratio), that’s may be attributed to differences in topography and geomorphology as well as differences in the size of the study area. In addition, the upper soil layers showed stronger spatial autocorrelation than the bottom layers, and the spatial autocorrelation gradually weakened with increasing depth in the soil. The surface soil is more likely to be disturbed by extrinsic factors and human activities, which was consistent with the results of a previous study (Wang T. et al., 2017).
4.2 Topography Effects on Spatial Variation of Soil Organic Carbon Density and Soil Total Nitrogen Density
Topography plays a prominent role in soil formation and evolution, and affects the litter decomposition rate due its effects on hydrothermal conditions, which in turn affects the amount of soil nutrients (Adhikari et al., 2014; Li et al., 2015; Martin et al., 2014). Therefore, there has generally been a close relationship between soil properties and topographic variables (Garten and Hanson, 2006; Seibert et al., 2007; Yang et al., 2016; Wang S. et al., 2017a; Wang T. et al., 2017). Our study demonstrated that SOCD and STND were significantly positively correlated with the topographic variables (i.e., elevation, slope, ground roughness, and curvature). Among them, elevation was the dominant topographic factor for the spatial patterns of both SOCD and STND, which agrees with previous studies (Li et al., 2012; Yang et al., 2014; Tashi et al., 2016; Wang T. et al., 2017). This could be because low temperatures at high elevations will inhibit the decomposition of soil organic matter and promote the accumulation of soil organic matter (Bot and Benites, 2005; Leifeld et al., 2005). However, some previous studies have shown no significant correlation between SOCD and elevation in broad-leaved temperate forests and subtropical coniferous forests (Sheikh et al., 2009), wetlands (Li and Shao, 2014), dammed fields (Zhao et al., 2017), and the agro-pastoral ecotone of northern China (Wang et al., 2019). This inconsistent result may be due to the narrow range of elevation, very different vegetation and patterns of vegetation distribution along elevation gradients, and a lower BD at higher elevations (Powers and Schlesinger, 2002; Sheikh et al., 2009). In addition, SOCD and STND had significant positive correlations with slope in this study, which agrees with previous research in Spain and China (Tsui et al., 2004; Wang J. et al., 2012; Yang et al., 2016). In contrast, a negative correlation between slope and SOC was found in Netherlands (Hall, 1983). Slope influences the surface transport of water and the products of decomposition, which in turn leads to spatial variability of soil nutrients (Gonzalez and Zak, 1994). In the present study, the significant positive effect of slope on SOCD and STND could be explained by the higher soil moisture on steeper slopes, since snowmelt in the Qilian Mountains provides ample water in our study area, and abundant soil moisture promotes vegetation growth in areas with steep slopes.
4.3 Effects of Climate Variables on the Spatial Variation of Soil Organic Carbon Density and Soil Total Nitrogen Density
The air temperature and precipitation can both change soil nutrient inputs by affecting vegetation growth, and control the C outputs through microbial decomposition of soil organic matter (Post et al., 1982). Therefore, temperature and precipitation are critical climatic variables that affect the spatial distribution of SOC and STN on a regional scale (Follett et al., 2012; Saiz et al., 2012). In the present study, CAT and MAP had significant negative and positive effects, respectively, on both SOCD and STND. Notably, there was a significant positive correlation between elevation and MAP (r = 0.65, p < 0.01), but a significant negative correlation between elevation and MAT (r = 0.89, p < 0.01). These correlations support our conclusion that elevation controls soil nutrients more strongly than temperature and precipitation in our study area, which agrees with the results of Wang Z. et al. (2012) and Wang S. et al. (2017).
4.4 Vegetation Effects on Spatial Variation of Soil Organic Carbon Density and Soil Total Nitrogen Density
NDVI is a good indicator of vegetation cover and an effective indicator for monitoring changes in vegetation. A higher NDVI means better vegetation cover and higher canopy density, which is conducive to the deposition of litter, thereby promoting the accumulation of SOC (Xin et al., 2016). Thus, NDVI is a major factor that affects the SOC and STN contents (Jobbágy and Jackson, 2000; Wang et al., 2000). Furthermore, NDVI has a high ability to predict SOC and STN contents because it reflects vegetation productivity and biomass (Bronson et al., 2004; Liu et al., 2012; Wang et al., 2013). In the present study, we also found a significant positive correlation between NDVI and both SOCD and STND. These findings suggest that remote sensing technology can potentially be used to predict SOC and STN at a regional scale in our study area.
4.5 Effects of Soil Particle Size on the Spatial Variation of Soil Organic Carbon Density and Soil Total Nitrogen Density
Many previous studies have confirmed that fine-textured (clay) soils have higher SOC and STN contents than coarse-textured (sand) soils (Jobbágy and Jackson, 2000; Tan et al., 2004; Meersmans et al., 2008, 2009). In the present study, the silt content was significantly positively correlated with SOCD and STND at all depths, but significantly negatively correlated with the coarse sand content, which was consistent with previous studies (Zinn et al., 2005; Li and Shao, 2014; Wang et al., 2019). This result is likely to be mainly due to the strong agglomeration of fine soil particles, which provides physical protection for soil organic matter (Baritz et al., 2010). Although the near-surface clay content was not significantly correlated with SOCD or STND, there were significant positive correlations for both variables at depths below 20 cm. This may be because of the very low clay contents in the top 20 cm of the soil. In addition, increased water retention by the finer particles promotes plant growth and thereby provides more inputs of soil organic matter. On the other hand, this water-retention can inhibit the decomposition of soil organic matter by soil microbes in an anaerobic environment.
5 Conclusion
We explored the spatial distribution (vertical and horizontal) of SOCD and STND across a large area of typical desert steppe in northern China. SOCD and STND decreased from southwest to northeast in the study area, which was consistent with the gradient of elevation (i.e., with higher elevations in the southwest). Elevation was the dominant environmental factor that influenced the spatial variation of SOCD and STND. SOC and STN tend to accumulate on steep slopes and high elevations in the desert steppes of the Hexi Corridor. The coarse sand and silt contents in the study area’s desert soils were more likely to determine SOC and STN. SOCD and STND were negatively correlated with soil pH, and SOC and STN of topsoil were therefore susceptible to the effects of pH in the desert steppe soils. NDVI was significantly positively correlated with both SOCD and STND, it is a feasible measure to increase soil carbon and nitrogen storage through vegetation restoration. In addition, remote sensing technology can potentially be used to predict SOC and STN at a regional scale in typical desert steppe. These results improve our understanding of the spatial distribution of soil C and N and the key driving factors responsible for this distribution. As a result, they will support efforts to predict soil C and nutrient accumulation in the desert steppes of the Hexi Corridor.
Data Availability Statement
The original contributions presented in the study are included in the article/Supplementary Material further inquiries can be directed to the corresponding author.
Author Contributions
XW, and YL conceived and designed the experiments; XW, YL, YD, LW, and XL performed the sample collection; YN, and MY performed the laboratory analysis; and XW analyzed the data and wrote the paper. All authors read and approved the paper before submission.
Funding
This research was supported by the Second Tibetan Plateau Scientific Expedition and Research (STEP) program (Grant No. 2019QZKK0305), the National Key R&D Program of China (2017YFA0604803), and the National Natural Science Foundation of China (grant Nos, 32001214 and 31971466).
Conflict of Interest
The authors declare that the research was conducted in the absence of any commercial or financial relationships that could be construed as a potential conflict of interest.
Publisher’s Note
All claims expressed in this article are solely those of the authors and do not necessarily represent those of their affiliated organizations, or those of the publisher, the editors and the reviewers. Any product that may be evaluated in this article, or claim that may be made by its manufacturer, is not guaranteed or endorsed by the publisher.
References
Adhikari, K., Hartemink, A. E., Minasny, B., Bou Kheir, R., Greve, M. B., and Greve, M. H. (2014). Digital Mapping of Soil Organic Carbon Contents and Stocks in Denmark. PLoS One 9 (8), e105519. doi:10.1371/journal.pone.0105519
Armstrong, M., and Dowd, P. A. (1997). Geostatistical Simulations. Technometrics 39 (3), 343. doi:10.1080/00401706.1997.10485145
Arrouays, D., Deslais, W., and Badeau, V. (2001). The Carbon Content of Topsoil and its Geographical Distribution in France. Soil Use Manage 17 (1), 7–11. doi:10.1111/j.1475-2743.2001.tb00002.x
Baritz, R., Seufert, G., Montanarella, L., and van Ranst, E. (2010). Carbon Concentrations and Stocks in forest Soils of Europe. For. Ecol. Manag. 260 (3), 262–277. doi:10.1016/j.foreco.2010.03.025
Batjes, N. H. (1996). Total Carbon and Nitrogen in the Soils of the World. Eur. J. Soil Sci. 47 (2), 151–163. doi:10.1111/j.1365-2389.1996.tb01386.x
Berg, E. V. D., and Reich, P. (1993). Organic Carbon in Soils of the World. Soil Sci. Soc. Am. J. 57 (4), 269–273. doi:10.2136/sssaj1993.03615995005700010034x
Bernoux, M., da Conceição Santana Carvalho, M., Volkoff, B., and Cerri, C. C. (2002). Brazil's Soil Carbon Stocks. Soil Sci. Soc. Am. J. 66 (3), 888–896. doi:10.2136/sssaj2002.8880
Blake, G., and Hartge, K. (1986). “Bulk Density,” in Methods of Soil Analysis Part I: Physical and Mineralogical Methods. Editor A. Klute, 463–478.
Bohn, H. L. (1982). Estimate of Organic Carbon in World Soils. Soil Sci. Soc. Am. J. 40 (3), 468–470.
Bot, A., and Benites, J. (2005). The Importance of Soil Organic Matter: Key to Drought-Resistant Soil and Sustained Food Production (No. 80). Rome: Food & Agriculture Org.
Bremner, J. M. (1960). Determination of Nitrogen in Soil by the Kjeldahl Method. J. Agric. Sci. 55, 11–33. doi:10.1017/s0021859600021572
Bronson, K. F., Zobeck, T. M., Chua, T. T., Acosta-Martinez, V., van Pelt, R. S., and Booker, J. D. (2004). Carbon and Nitrogen Pools of Southern High plains Cropland and Grassland Soils. Soil Sci. Soc. Am. J. 68 (5), 1695–1704. doi:10.2136/sssaj2004.1695
Cambardella, C. A., and Karlen, D. L. (1999). Spatial Analysis of Soil Fertility Parameters. Precis. Agric. 1 (1), 5–14. doi:10.1023/a:1009925919134
Campbell, A., Miles, L., Lysenko, I., Huges, A., and Gibbs, H. (2008). Carbon Storage in Protected Areas. Technical Report. Cambridge, U.K: UNEP World Conservation Monitoring Center.
Chang, Z., Zhu, S., Han, F., Zhong, S., and Wang, Q. (2013). Responses of Plants' Phenology to Climate Warming in the Desert Area in Northwestern China. Ajfst 5 (4), 500–505. doi:10.19026/ajfst.5.3298
Cools, N., and De Vos, B. (2010). Manual on Methods and Criteria for Harmonized Sampling, Assessment, Monitoring and Analysis of the Effects of Air Pollution on Forests. Hamburg: United Nations Economic Commission for Europe (UNECE), ICP Forests.Sampling and Analysis of Soil. Manual Part X
Cubasch, U., Wuebbles, D., Chen, D., Facchini, M. C., Frame, D., Mahowald, N., et al. (2013). “The Physical Science Basis,” in Contribution of Working Group I to the Fifth Assessment Report of the Intergovernmental Panel on Climate Change. Editors T. F. Stocker, D. Qin, G-K. Plattner, M. Tignor, S. K. Allen, J. Boschunget al. (Cambridge/New York: Cambridge University Press).
Davidson, E. A., and Janssens, I. A. (2006). Temperature Sensitivity of Soil Carbon Decomposition and Feedbacks to Climate Change. Nature 440 (7081), 165–173. doi:10.1038/nature04514
Fang, X., Xue, Z., Li, B., and An, S. (2012). Soil Organic Carbon Distribution in Relation to Land Use and its Storage in a Small Watershed of the Loess Plateau, China. Catena 88 (1), 6–13. doi:10.1016/j.catena.2011.07.012
Follett, R. F., Stewart, C. E., Pruessner, E. G., and Kimble, J. M. (2012). Effects of Climate Change on Soil Carbon and Nitrogen Storage in the US Great Plains. J. Soil Water Conservation 67 (5), 331–342. doi:10.2489/jswc.67.5.331
Garten, C. T., and Hanson, P. J. (2006). Measured forest Soil C Stocks and Estimated Turnover Times along an Elevation Gradient. Geoderma 136 (1), 342–352. doi:10.1016/j.geoderma.2006.03.049
GCST (Group of Chinese Soil Taxonomy) (2001). Chinese Soil System Classification. Beijing, China: China Agricultural Science and Technology Press.
Gmach, M. R., Kaiser, K., Cherubin, M. R., Cerri, C. E., and Neto, M. S. (2020). Soil Dissolved Organic Carbon Responses to Sugarcane Straw Removal. Soil Use Manage 00, 1–12. doi:10.1111/sum.12663
Gonzalez, O. J., and Zak, D. R. (1994). Geostatistical Analysis of Soil Properties in a Secondary Tropical Dry forest, St. Lucia, West Indies. Plant Soil 163 (1), 45–54. doi:10.1007/bf00033939
Hair, J. F., Black, W., Babin, B., and Anderson, R. E. (2009). Multivariate Data Analysis. 7th edition. London: Prentice-Hall.
Hall, G. F. (1983). “Pedology and Geomorphology,” in Pedogenesis and Soil Taxonomy: I. Concepts and Interactions. Editors L.P. Wilding, N.E. Smeck, and G.F. Hall (Amsterdam, Netherlands: Elsevier Science Publishers Besloten Vennootshap met Beperkte Aansprak-elijkhed), 117–140. doi:10.1016/s0166-2481(08)70600-7
Hobley, E., Wilson, B., Wilkie, A., Gray, J., and Koen, T. (2015). Drivers of Soil Organic Carbon Storage and Vertical Distribution in Eastern Australia. Plant Soil 390 (1-2), 111–127. doi:10.1007/s11104-015-2380-1
Homann, P. S., Sollins, P., Chappell, H. N., and Stangenberger, A. G. (1995). Soil Organic Carbon in a Mountainous, Forested Region: Relation to Site Characteristics. Soil Sci. Soc. America J. 59 (5), 1468–1475. doi:10.2136/sssaj1995.03615995005900050037x
IPCC (2001). Climate Change 2001: The Scientific Basis. Contribution of Working Group I to the Third Assessment Report of the Intergovernmental Panel on Climate Change. Cambridge, UK and New York, USA: Cambridge University Press.
Jobbágy, E. G., and Jackson, R. B. (2000). The Vertical Distribution of Soil Organic Carbon and its Relation to Climate and Vegetation. Ecol. Appl. 10, 423–436. doi:10.1890/1051-0761(2000)010[0423:tvdoso]2.0.co;2
Kalembasa, S. J., and Jenkinson, D. S. (1973). A Comparative Study of Titrimetric and Gravimetric Methods for the Determination of Organic Carbon in Soil. J. Sci. Food Agric. 24 (9), 1085–1090. doi:10.1002/jsfa.2740240910
Kamarudin, K. N., Tomita, M., Kondo, K., and Abe, S. S. (2019). Geostatistical Estimation of Surface Soil Carbon Stock in Mt. Wakakusa Grassland of Japan. Landscape Ecol. Eng. 15 (2), 215–221. doi:10.1007/s11355-019-00370-1
Kirschbaum, M. U. F. (2000). Will Changes in Soil Organic Carbon Act as a Positive or Negative Feedback on Global Warming? Biogeochemistry 48 (1), 21–51. doi:10.1023/a:1006238902976
Koyama, A., Harlow, B., and Evans, R. D. (2019). Greater Soil Carbon and Nitrogen in a Mojave Desert Ecosystem after 10 Years Exposure to Elevated CO2. Geoderma 355, 113915. doi:10.1016/j.geoderma.2019.113915
Lacoste, M., Minasny, B., McBratney, A., Michot, D., Viaud, V., and Walter, C. (2014). High Resolution 3D Mapping of Soil Organic Carbon in a Heterogeneous Agricultural Landscape. Geoderma 213, 296–311. doi:10.1016/j.geoderma.2013.07.002
Lal, R. (2004). Soil Carbon Sequestration Impacts on Global Climate Change and Food Security. Science 304 (5677), 1623–1627. doi:10.1126/science.1097396
Lehmann, J., and Kleber, M. (2015). The Contentious Nature of Soil Organic Matter. Nature 528 (7580), 60–68. doi:10.1038/nature16069
Leifeld, J., Bassin, S., and Fuhrer, J. (2005). Carbon Stocks in Swiss Agricultural Soils Predicted by Land-Use, Soil Characteristics, and Altitude. Agric. Ecosyst. Environ. 105 (1), 255–266. doi:10.1016/j.agee.2004.03.006
Li, B., Tang, H., Wu, L., Li, Q., and Zhou, C. (2012). Relationships between the Soil Organic Carbon Density of Surface Soils and the Influencing Factors in Differing Land Uses in Inner Mongolia. Environ. Earth Sci. 65 (1), 195–202. doi:10.1007/s12665-011-1082-0
Li, D., and Shao, M. a. (2014). Soil Organic Carbon and Influencing Factors in Different Landscapes in an Arid Region of Northwestern China. Catena 116, 95–104. doi:10.1016/j.catena.2013.12.014
Li, F. B., Lu, G. D., Zhou, X. Y., Ni, H. X., Xu, C.-C., Yue, C., et al. (2015). Elevation and Land Use Types Have Significant Impacts on Spatial Variability of Soil Organic Matter Content in Hani Terraced Field of Yuanyang County, China. Rice Sci. 22 (1), 27–34.
Li, M., Zhang, X., Zhen, Q., and Han, F. (2013). Spatial Analysis of Soil Organic Carbon in Zhifanggou Catchment of the Loess Plateau. PLoS One 8 (12), e83061. doi:10.1371/journal.pone.0083061
Li, Y., Wang, X., Niu, Y., Lian, J., Luo, Y., Chen, Y., et al. (2018). Spatial Distribution of Soil Organic Carbon in the Ecologically Fragile Horqin Grassland of Northeastern China. Geoderma 325, 102–109. doi:10.1016/j.geoderma.2018.03.032
Liu, W., Chen, S., Qin, X., Baumann, F., Scholten, T., Zhou, Z., et al. (2012). Storage, Patterns, and Control of Soil Organic Carbon and Nitrogen in the Northeastern Margin of the Qinghai-Tibetan Plateau. Environ. Res. Lett. 7 (3), 035401. doi:10.1088/1748-9326/7/3/035401
Martin, M. P., Orton, T. G., Lacarce, E., Meersmans, J., Saby, N. P. A., Paroissien, J. B., et al. (2014). Evaluation of Modelling Approaches for Predicting the Spatial Distribution of Soil Organic Carbon Stocks at the National Scale. Geoderma 223-225 (1), 97–107. doi:10.1016/j.geoderma.2014.01.005
Meersmans, J., Ridder, F. D., Canters, F., Baets, S. D., and Molle, M. V. (2008). A Multiple Regression Approach to Assess the Spatial Distribution of Soil Organic Carbon (SOC) at the Regional Scale (Flanders, Belgium). Geoderma 143 (1), 1–13. doi:10.1016/j.geoderma.2007.08.025
Meersmans, J., Wesemael, B. V., Ridder, F. D., and Molle, M. V. (2009). Modelling the Three-Dimensional Spatial Distribution of Soil Organic Carbon (SOC) at the Regional Scale (Flanders, Belgium). Geoderma 152 (1), 43–52. doi:10.1016/j.geoderma.2009.05.015
Minasny, B., Malone, B. P., McBratney, A. B., Angers, D. A., Arrouays, D., Chambers, A., et al. (2017). Soil Carbon 4 Per Mille. Geoderma 292, 59–86. doi:10.1016/j.geoderma.2017.01.002
Minasny, B., McBratney, A. B., Malone, B. P., and Wheeler, I. (2013). Digital Mapping of Soil Carbon. Adv. Agron. 118 (3), 4. doi:10.1016/b978-0-12-405942-9.00001-3
Nelson, D. W., and Sommers, L. E. (1982). “Total Carbon, Organic Carbon and Organic Matter,” in Methods of Soil Analysis, Part 2. Editors A.L. Page, R. H. Miller, and D.R. Keeney. 2nd ed. (Madison, WI, USA: American Society of Agronomy), 539–577.
Noy-Meir, I. (1973). Desert Ecosystems: Environment and Producers. Ann. Rev. Ecol. Syst. 4, 25e51. doi:10.1146/annurev.es.04.110173.000325
Piccini, C., Marchetti, A., and Francaviglia, R. (2014). Estimation of Soil Organic Matter by Geostatistical Methods: Use of Auxiliary Information in Agricultural and Environmental Assessment. Ecol. Indicators 36, 301–314. doi:10.1016/j.ecolind.2013.08.009
Pointing, S. B., and Belnap, J. (2012). Microbial Colonization and Controls in Dryland Systems. Nat. Rev. Microbiol. 10, 551–562. doi:10.1038/nrmicro2831
Post, W. M., Emanuel, W. R., Zinke, P. J., and Stangenberger, A. G. (1982). Soil Carbon Pools and World Life Zones. Nature 298 (5870), 156–159. doi:10.1038/298156a0
Powers, J. S., and Schlesinger, W. H. (2002). Relationships Among Soil Carbon Distributions and Biophysical Factors at Nested Spatial Scales in Rain Forests of Northeastern Costa Rica. Geoderma 109 (3), 165–190. doi:10.1016/s0016-7061(02)00147-7
Qi, Q., Zhang, D., Zhang, M., Tong, S., and An, Y. (2021). Spatial Distribution of Soil Organic Carbon and Total Nitrogen in Disturbed carex Tussock Wetland. Ecol. Indic. 120 (23). doi:10.1016/j.ecolind.2020.106930
Reese, R. A. (2001). “Geostatistics for Environmental Scientists3,” in Editors R. Webster, and M.A. Oliver (New York: John Wiley & Sons), 52, 407.
Reeves, D. W. (1997). The Role of Soil Organic Matter in Maintaining Soil Quality in Continuous Cropping Systems. Soil Tillage Res. 43 (1-2), 131–167. doi:10.1016/s0167-1987(97)00038-x
Saiz, G., Bird, M. I., Domingues, T., Schrodt, F., Schwarz, M., Feldpausch, T. R., et al. (2012). Variation in Soil Carbon Stocks and Their Determinants across a Precipitation Gradient in West Africa. Glob. Change Biol. 18 (5), 1670–1683. doi:10.1111/j.1365-2486.2012.02657.x
Schloeder, C. A., Zimmerman, N. E., and Jacobs, M. J. (2001). Comparison of Methods for Interpolating Soil Properties Using Limited Data. Soil Sci. Soc. Am. J. 65 (2), 470–479. doi:10.2136/sssaj2001.652470x
Seibert, J., Stendahl, J., and Sørensen, R. (2007). Topographical Influences on Soil Properties in Boreal Forests. Geoderma 141, 139–148. doi:10.1016/j.geoderma.2007.05.013
Sheikh, M. A., Kumar, M., and Bussmann, R. W. (2009). Altitudinal Variation in Soil Organic Carbon Stock in Coniferous Subtropical and Broadleaf Temperate Forests in Garhwal Himalaya. Carbon Balance Manag. 4 (1), 6. doi:10.1186/1750-0680-4-6
Soon, Y. K., and Abboud, S. (1991). A Comparison of Some Methods for Soil Organic Carbon Determination. Commun. Soil Sci. Plant Anal. 22 (9-10), 943–954. doi:10.1080/00103629109368465
Stockmann, U., Adams, M. A., Crawford, J. W., Field, D. J., Henakaarchchi, N., Jenkins, M., et al. (2013). The Knowns, Known Unknowns and Unknowns of Sequestration of Soil Organic Carbon. Agric. Ecosyst. Environ. 164, 80–99. doi:10.1016/j.agee.2012.10.001
Tan, Z. X., Lal, R., Smeck, N. E., and Calhoun, F. G. (2004). Relationships between Surface Soil Organic Carbon Pool and Site Variables. Geoderma 121 (3), 187–195. doi:10.1016/j.geoderma.2003.11.003
Tashi, S., Singh, B., Keitel, C., and Adams, M. (2016). Soil Carbon and Nitrogen Stocks in Forests along an Altitudinal Gradient in the Eastern Himalayas and a Meta-Analysis of Global Data. Glob. Change Biol. 22 (6), 2255–2268. doi:10.1111/gcb.13234
Tsui, C. C., Chen, Z. S., and Hsieh, C. F. (2004). Relationships between Soil Properties and Slope Position in a lowland Rain forest of Southern Taiwan. Geoderma 123 (1-2), 131–142. doi:10.1016/j.geoderma.2004.01.031
van den Wollenberg, A. L. (1977). Redundancy Analysis an Alternative for Canonical Correlation Analysis. Psychometrika 42, 207–219. doi:10.1007/bf02294050
Wang, H., Hall, C. A. S., Cornell, J. D., and Hall, M. H. P. (2002). Spatial Dependence and the Relationship of Soil Organic Carbon and Soil Moisture in the Luquillo Experimental Forest, Puerto Rico. Landsc. Ecol. 17 (8), 671–684. doi:10.1023/a:1022962116313
Wang, J., Pan, X., Liu, Y., Zhang, X., and Xiong, Z. (2012a). Effects of Biochar Amendment in Two Soils on Greenhouse Gas Emissions and Crop Production. Plant Soil 360 (1-2), 287–298. doi:10.1007/s11104-012-1250-3
Wang, J. R., Letchford, T., Comeau, P., and Kimmins, J. P. (2000). Above- and Below-Ground Biomass and Nutrient Distribution of a Paper Birch and Subalpine Fir Mixed-Species Stand in the Sub-boreal Spruce Zone of British Columbia. For. Ecol. Manage. 130 (1), 17–26. doi:10.1016/s0378-1127(99)00193-0
Wang, L., Okin, G. S., Caylor, K. K., and Macko, S. A. (2009). Spatial Heterogeneity and Sources of Soil Carbon in Southern African Savannas. Geoderma 149 (3), 402–408. doi:10.1016/j.geoderma.2008.12.014
Wang, M., Su, Y.-Z., Yang, R., and Yang, X. (2013). Allocation Patterns of above- and Belowground Biomass in Desert Grassland in the Middle Reaches of Heihe River, Gansu Province, China. Chin. J. Plant Ecol. 37, 209–219. (in Chinese). doi:10.3724/sp.j.1258.2013.00021
Wang, M., Su, Y., and Yang, X. (2014). Spatial Distribution of Soil Organic Carbon and its Influencing Factors in Desert Grasslands of the Hexi Corridor, Northwest China. Plos One 9 (4), e94652. doi:10.1371/journal.pone.0094652
Wang, S., Zhuang, Q., Wang, Q., Jin, X., and Han, C. (2017a). Mapping Stocks of Soil Organic Carbon and Soil Total Nitrogen in Liaoning Province of China. Geoderma 305, 250–263. doi:10.1016/j.geoderma.2017.05.048
Wang, T., Kang, F., Cheng, X., Han, H., Bai, Y., and Ma, J. (2017b). Spatial Variability of Organic Carbon and Total Nitrogen in the Soils of a Subalpine Forested Catchment at Mt. Taiyue, China. Catena 155, 41–52. doi:10.1016/j.catena.2017.03.004
Wang, X., Li, Y., Gong, X., Niu, Y., Chen, Y., Shi, X., et al. (2019). Storage, Pattern and Driving Factors of Soil Organic Carbon in an Ecologically Fragile Zone of Northern China. Geoderma 343, 155–165. doi:10.1016/j.geoderma.2019.02.030
Wang, Z., Liu, G.-B., Xu, M.-X., Zhang, J., Wang, Y., and Tang, L. (2012b). Temporal and Spatial Variations in Soil Organic Carbon Sequestration Following Revegetation in the Hilly Loess Plateau, China. Catena 99, 26–33. doi:10.1016/j.catena.2012.07.003
Wang, Z. Q. (1999). Geostatistics and its Application in Ecology, Vol. 35. Beijing: Science Press, 150–189.96
Wiesmeier, M., Barthold, F., Spörlein, P., Geuß, U., Hangen, E., Reischl, A., et al. (2014). Estimation of Total Organic Carbon Storage and its Driving Factors in Soils of Bavaria (Southeast Germany). Geoderma Reg. 1, 67–78. doi:10.1016/j.geodrs.2014.09.001
Wiesmeier, M., Hübner, R., Barthold, F., Spörlein, P., Geuß, U., Hangen, E., et al. (2013). Amount, Distribution and Driving Factors of Soil Organic Carbon and Nitrogen in Cropland and Grassland Soils of Southeast Germany (Bavaria). Agric. Ecosyst. Environ. 176, 39–52. doi:10.1016/j.agee.2013.05.012
Xin, Z., Qin, Y., and Yu, X. (2016). Spatial Variability in Soil Organic Carbon and its Influencing Factors in a Hilly Watershed of the Loess Plateau, China. Catena 137, 660–669. doi:10.1016/j.catena.2015.01.028
Xu, X. L. (2018). Spatial Distribution Dataset of Monthly Vegetation index (NDVI) in China. Resources and Environment Science Data Center, Chinese Academy of Sciences Data Registration and Publication System. doi:10.12078/2018060602
Yang, L., Qi, F., Zhu, A.-X., Shi, J., and An, Y. (2016). Evaluation of Integrative Hierarchical Stepwise Sampling for Digital Soil Mapping. Soil Sci. Soc. America J. 80 (3), 637–651. doi:10.2136/sssaj2015.08.0285
Yang, R., Su, Y., Wang, M., Wang, T., Yang, X., Fan, G. P., et al. (2014). Spatial Pattern of Soil Organic Carbon in Desert Grasslands of the Diluvial-Alluvial plains of Northern Qilian Mountains. J. Arid Land 6 (002), 136–144. doi:10.1007/s40333-013-0200-0
Zhang, S., Huang, Y., Shen, C., Ye, H., and Du, Y. (2012). Spatial Prediction of Soil Organic Matter Using Terrain Indices and Categorical Variables as Auxiliary Information. Geoderma 171-172, 35–43. doi:10.1016/j.geoderma.2011.07.012
Zhao, B., Li, Z., Li, P., Xu, G., Gao, H., Cheng, Y., et al. (2017). Spatial Distribution of Soil Organic Carbon and its Influencing Factors under the Condition of Ecological Construction in a Hilly-Gully Watershed of the Loess Plateau, China. Geoderma 296, 10–17. doi:10.1016/j.geoderma.2017.02.010
Zhao, K., Kong, W., Wang, F., Long, X.-E., Guo, C., Yue, L., et al. (2018). Desert and Steppe Soils Exhibit Lower Autotrophic Microbial Abundance but Higher Atmospheric CO2 Fixation Capacity Than Meadow Soils. Soil Biol. Biochem. 127, 230–238. doi:10.1016/j.soilbio.2018.09.034
Zinn, Y. L., Lal, R., and Resck, D. V. S. (2005). Texture and Organic Carbon Relations Described by a Profile Pedotransfer Function for Brazilian Cerrado Soils. Geoderma 127 (1), 168–173. doi:10.1016/j.geoderma.2005.02.010
Zollinger, B., Alewell, C., Kneisel, C., Meusburger, K., Gärtner, H., Brandová, D., et al. (2013). Effect of Permafrost on the Formation of Soil Organic Carbon Pools and Their Physical-Chemical Properties in the Eastern Swiss Alps. Catena 110, 70–85. doi:10.1016/j.catena.2013.06.010
Zuo, X. A., Zhao, X. Y., Zhao, H. L., Guo, Y. R., Zhang, T. H., and Cui, J. Y. (2010). Spatial Pattern and Heterogeneity of Soil Organic Carbon and Nitrogen in Sand Dunes Related to Vegetation Change and Geomorphic Position in Horqin Sandy Land, Northern China. Environ. Monit. Assess. 164 (1-4), 29–42. doi:10.1007/s10661-009-0872-2
Keywords: spatial pattern, soil organic carbon, soil total nitrogen, geostatistics, environmental variables, desert steppe
Citation: Wang X, Li Y, Duan Y, Wang L, Niu Y, Li X and Yan M (2021) Spatial Variability of Soil Organic Carbon and Total Nitrogen in Desert Steppes of China’s Hexi Corridor. Front. Environ. Sci. 9:761313. doi: 10.3389/fenvs.2021.761313
Received: 19 August 2021; Accepted: 04 October 2021;
Published: 15 October 2021.
Edited by:
Z. Y. Yuan, Institute of Soil and Water Conservation (CAS), ChinaReviewed by:
Juanli Chen, Mianyang Normal University, ChinaHanbo Yun, University of Copenhagen, Denmark
Zhao Fang, Institute of Soil and Water Conservation (CAS), China
Copyright © 2021 Wang, Li, Duan, Wang, Niu, Li and Yan. This is an open-access article distributed under the terms of the Creative Commons Attribution License (CC BY). The use, distribution or reproduction in other forums is permitted, provided the original author(s) and the copyright owner(s) are credited and that the original publication in this journal is cited, in accordance with accepted academic practice. No use, distribution or reproduction is permitted which does not comply with these terms.
*Correspondence: Yuqiang Li, bGl5cUBsemIuYWMuY24=