 Sarah Köbke1
 Hongxing He
 Matthias Böldt
 Haitao Wang
 Mehmet Senbayram
 Klaus Dittert
- 1Section of Plant Nutrition and Crop Physiology, Department of Crop Science, University of Göttingen, Göttingen, Germany
- 2Department of Biological and Environmental Sciences, University of Gothenburg, Gothenburg, Sweden
- 3Department of Geography, McGill University, Montreal, QC, Canada
- 4Institute of Crop Science and Plant Breeding, Grass and Forage Science/Organic Agriculture, University of Kiel, Kiel, Germany
- 5Institute of Applied Plant Nutrition, University of Göttingen, Göttingen, Germany
- 6Institute of Plant Nutrition and Soil Science, Faculty of Agriculture, University of Harran, Sanliurfa, Turkey
Oilseed rape (Brassica napus L.) is an important bioenergy crop that contributes to the diversification of renewable energy supply and mitigation of fossil fuel CO2 emissions. Typical oilseed rape crop management includes the use of nitrogen (N) fertilizer and the incorporation of oilseed rape straw into soil after harvest. However, both management options risk increasing soil emissions of nitrous oxide (N2O). The aim of this 2-years field experiment was to identify the regulating factors of N cycling with emphasis on N2O emissions during the post-harvest period. As well as the N2O emission rates, soil ammonia (NH4+) and nitrate (NO3−) contents, crop residue and seed yield were also measured. Treatments included variation of fertilizer (non-fertilized, 90 and 180 kg N ha−1) and residue management (straw remaining, straw removal). Measured N2O emission data showed large intra- and inter-annual variations ranging from 0.5 (No-fert + str) to 1.0 kg N2O-N ha−1 (Fert-180 + str) in 2013 and from 4.1 (Fert-90 + str) to 7.3 kg N2O-N ha−1 (No-fert + str) in 2014. Cumulative N2O emissions showed that straw incorporation led to no difference or slightly reduced N2O emissions compared with treatments with straw removal, while N fertilization has no effect on post-harvest N2O emissions. A process-based model, CoupModel, was used to explain the large annual variation of N2O after calibration with measured environmental data. Both modeled and measured data suggest that soil water-filled pore space and temperature were the key factors controlling post-harvest N2O emissions, even though the model seemed to show a higher N2O response to the N fertilizer levels than our measured data. We conclude that straw incorporation in oilseed rape cropping is environmentally beneficial for mitigating N2O losses. The revealed importance of climate in regulating the emissions implies the value of multi-year measurements. Future studies should focus on new management practices to mitigate detrimental effects caused by global warming, for example by using cover crops.
Introduction
Europe is the leading production zone of rapeseed, accounting for 25.5 million metric tons in 2018 (FAOSTAT, 2021). The European Renewable Energy Directive (RED, 2009) provides the legal framework in the European Union to increase the share of renewable energy sources, secure the energy supply and reduce greenhouse gas (GHG) emissions. To achieve these goals, oil crops are becoming increasingly important in the shift from fossil fuel-based energy supply to a more sustainable production chain. In general, plant N demand of oilseed rape is reported to be ca. 200 kg N ha−1 (DÜV 2017), but it can exceed 250 kg N ha−1 at sites with high potential productivity (Henke et al., 2009; Sieling and Kage, 2010). High amounts of N application in oilseed rape crops may increase the risk of soil emissions of N2O, a potent GHG (Crutzen et al., 2008; Don et al., 2012).
The average yield of winter oilseed rape in Germany was 3 t ha−1 in 2017 (Statistisches Bundesamt, 2019; Zheng et al., 2020). The N harvest index for oilseed rape, defined as the ratio of total N in the harvested crop component to the total N in the aboveground biomass, ranges between 0.6 and 0.7 (Sieling and Kage, 2010) and is about 15% lower than that of wheat (Schjoerring and Mattsson, 2001). Thus, a higher N return to the soil from plant litterfall can be expected. Studies have reported N litterfall ranging from 45 kg N ha−1 (mainly from leaves) in the maturation period (Malagoli et al., 2005) to 53 kg N ha−1 (Engström and Lindén, 2012) and up to 89 kg N ha−1 (Sieling and Kage, 2006) after harvest. The standard management practice of incorporating oilseed rape straw into soil can therefore significantly contribute to soil organic matter mineralization and to soil mineral N pools (Hadas et al., 2004). Previous studies (Justes et al., 1999; Sieling and Kage, 2006; Engström and Lindén, 2012) have stressed the high soil mineral N concentrations after oilseed rape harvest and discussed the risk of high NO3− leaching.
N2O in soil is produced mainly by nitrification and denitrification processes (Wrage-Mönnig et al., 2018). Nitrification is a microbial process that oxidizes NH4+ via NH2OH to NO3− where the nitrification products act as electron acceptors. Denitrification is also a microbial process involving the stepwise reduction of NO3− in the liquid phase via gaseous compounds to N2 (Madigan et al., 2012). N2O is a very powerful GHG with a global warming potential that is 265 times higher than that of CO2 (IPCC, 2014). N2O emission mitigation strategies for agricultural systems have mostly focused on the growing period of crops, but to evaluate the management options on a full cycle of cropping, the post-harvest period should be assessed as well. In incubation studies conducted under controlled conditions, oilseed rape straw with a C/N ratio of up to 65 showed a positive correlation with N2O emissions; however, this relationship is hardly detectable under field conditions, perhaps because straw particle size and spatial distribution are different (Chen et al., 2013). Therefore, understanding N2O emissions and their interactions with environmental factors require a combined data model approach that can distinguish the gas production processes and describe the multitude of controlling factors and their interactions (Smith, 2010; Gundersen et al., 2012; Butterbach-Bahl et al., 2013).
To identify the driving forces of post-harvest N2O emissions, a field experiment was conducted, followed by process-based modeling. The CoupModel successfully simulated the N cycle in agricultural ecosystems as proposed by Johnsson et al. (1987) and Nylinder et al. (2011). Nylinder et al. (2011) simulated the N2O emissions and N cycle for an organic rotation agricultural ecosystem, and studied the N2O emissions controlling factors by using modeled and measured data; the same approach was adopted by He et al. (2016) in identifying the controlling factors for drained organic soils. The aim of the present study was to contribute to improved understanding of the effects of straw incorporation and fertilization levels as management options, and their contribution to soil N dynamics, crop yield and N2O emissions post-harvest. The hypothesis is that fertilization and straw incorporation might increase the risk of N2O emissions in the post-harvest period.
Materials and Methods
Site Description
The field experiment was set up at Reinshof research farm (51.49°N, 9.93°E, 150 m asl) of the Department of Crop Sciences of the University of Göttingen in Germany. The climate is continental with a long-term (1961–1990) average precipitation of 645 mm and a mean temperature of 8.7°C (Deutscher Wetterdienst, 2019). The soil was classified as a luvisol, according to the soil classification scheme proposed by the IUSS Working Group WRB (IUSS, 2015), with a silty loam texture (12.2% sand, 72.7% silt and 15.1% clay). It represents a typical agricultural soil used for oilseed rape cropping. The soil properties were characterized by a bulk density of 1.29 g cm−3, pH 7.1, C content 1.3%, N content 0.12% and thus a measured C/N ratio of 10.5 in the topsoil (0–10 cm). Soil at Reinshof study site has high nutrient conditions, previous data from the site showed a GLA of c.a. 83, where GLA stands for German Land Appraisal, a soil fertility index varying on a scale from 0, (minimum soil fertility) to 100 (maximum soil fertility) (Ghaouti et al., 2008). The high soil nutrient was also shown by our measured high mineral N content and low soil C/N ratio data.
Field Experimental Set-Up
The field experiment was carried out in a fully randomized block design during the autumn and winter of 2013/2014 and 2014/2015. The plot size was 7.5 m × 6 m and all N fertilizer treatments were done with three replicates. The treatments of this first factor included three levels of calcium ammonium nitrate (CAN) mineral fertilizer (No-fert: 0 kg N ha−1; Fert-90: 90 kg N ha−1; and Fert-180: 180 kg N ha−1). Fertilizer application was done in spring, according to common farming practice, with 67% of the total amount being applied as first dressing on 22 April in 2013 and 19 March in 2014. The remaining 33% of N was applied on 7 May in 2013 and 7 April in 2014 (Fert-90, Fert-180). Plant protection was done in line with local recommendations. Winter oilseed rape (Brassica napus L., cv. Visby) was harvested on August 1, 2013 and July 23, 2014. Following common agricultural practice, the uppermost soil layer (0–10 cm) was rototilled 1 day later.
After harvest, straw was removed whereas stubble and roots remained in the field. All fertilizer plots were subdivided into two subplots. These were treated with straw incorporation (+str) by using the respective residual straw from the 0, 90 or 180 kg N ha−1 fertilizer treatments. The second subplot was kept without straw, i.e. all straw was removed (−str). The measured C/N ratio of incorporated straw with different fertilization treatments ranged from 38 to 71 (Table 1). For all subplots, the amount of straw added was determined according to residue biomass in all treatments of the respective years; on average, residue biomass was 7.17 t fresh matter ha−1. In October, following typical regional crop rotations, winter wheat was sown in both years. N2O and other parameters were sampled from harvest until the first fertilizer application for winter wheat was done in early spring.
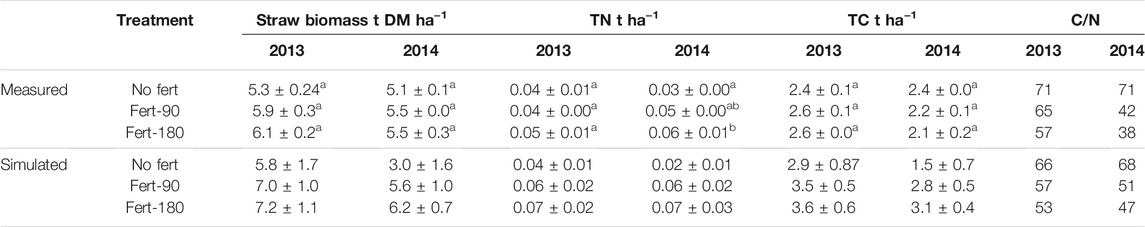
TABLE 1. Amount of incorporated oilseed rape straw biomass, total N and total C in straw as well as straw C/N ratio at the experimental site Reinshof in 2013 and 2014 (n = 3) as influenced by fertilizer treatments. Different lowercase letters indicate significant differences among treatments at p < 0.05.
Apparent N (ARN) recovery of oilseed rape was calculated as
Where Nuptake including N content of the seed and straw.
Soil Mineral N (NMIN) Measurements
Soil mineral N contents (NMIN) were measured in 50 g samples from the top 0–15 cm soil layers. Samples were extracted with 0.0125 M CaCl2 solution (1:5 w/v), then filtered with 615 ¼ filter paper (Macherey – Nagel GmbH & Co. KG, Düren, Germany) and stored frozen at −20°C (VDLUFA 2002). The extracts were subject to colorimetric analysis to determine the concentrations of NO3− and NH4+ using an automated continuous flow N analyzer (San++; Skalar Analytical B.V., Breda, Netherlands).
Measurements of N2O Emissions
N2O gas fluxes were assessed using the manual chamber approach (Hutchinson and Mosier, 1981). In each of the 36 subplots, a round basal collar (PVC, diameter: 0.6 m, height 0.15 m) was driven into the soil to 5 cm depth and kept there permanently. For gas flux measurements these collars were covered by a closed chamber top of 0.3 m height. The outside of both collars and chambers were covered with aluminum foil to reflect solar radiation. The collar and chamber joints were sealed with a butyl rubber band of 10 cm width. Gas samples were taken 0, 20 and 40 min after chamber closure using a 30 ml gastight syringe and filled into pre-evacuated 12 ml vials (Labco, Lampeter, United Kingdom). Gas sampling was conducted during the post-harvest period until the first fertilizer application for winter wheat in early spring. The gas measurements thus covered the periods from August 8, 2013 to February 17, 2014 and from July 29, 2014 to March 3, 2015. Overall, the number of sampling days for 2013 and for 2014 were 28 and 30, respectively.
All analyses of N2O concentrations were done on a Bruker gas chromatograph (456-GC, Bruker, Billerica, United States) equipped with an electron capture detector and controlled by CompassCDS Software. Sample introduction was done with a Gilson GX281 autosampler operated with Trilution Software (Gilson, Inc., Middleton, WI, United States). For calculation of N2O fluxes, linear regression was performed for the three samplings after chamber closure, and linear interpolation between measurement days was done to obtain cumulative gas fluxes.
CoupModel and Modeling Approach
The CoupModel (coupled heat and mass transfer model for soil-plant-atmosphere systems) is an updated version of the earlier SOIL and SOILN models (Jansson and Moon, 2001). The main model structure is a one-dimensional, layered soil depth profile, in which water, heat, and C and N dynamics are simulated based on detailed descriptions of soil physical and biogeochemical processes. C and N dynamics are simulated both in the soil and in the plant, driven by canopy-intercepted radiation, and regulated by multiplicative response functions of air temperature and plant availability of water and N (He et al., 2016a; He et al., 2016b). The model is available at http://www.coupmodel.com/. A detailed description of the model, its model structure, parameterization and setup is given in He et al. (2016a), He et al. (2016b) and Jansson and Karlberg (2011).
The model simulates ecosystem variables at daily intervals and is driven by measured meteorological variables from a nearby weather station, including precipitation, air temperature, wind speed, relative humidity and global radiation. The general model parameterization was based on previous model applications on similar soil types (Johnsson et al., 1987; Nylinder et al., 2011). The soil physical characteristics – i.e., water retention curve and hydraulic properties – were estimated from the measured soil texture by using the model’s pedotransfer functions. When straw was applied, it was assumed to be added to both the soil litter C and N pools and to be uniformly mixed into the soil to a depth of 0.05 m. The application of mineral fertilizer was assumed to directly add NH4 and NO3 to the soil surface N pool. The model was evaluated mainly against the measured N2O flux data from the Reinshof site. Due to the strong coupling of N dynamics with the C cycle and abiotic environmental factors, we further evaluated the model output against observed soil respiration flux, water filled pore space (WFPS) and soil temperature data. Overall, the evaluation was conducted in a stepwise manner, where the model was first evaluated with WFPS and soil temperature data, then with the measured seed yield and residue biomass data and soil respiration data. A few plant and soil parameters were calibrated to fit the simulated plant growth and soil respiration since these two processes regulate the two major N fluxes, i.e., plant N uptake and soil net N mineralization, both being important for N2O production. Finally, the model was evaluated with the measured soil mineral N contents and N2O fluxes. Its need to be noted that we did not calibrate the model for best fit to the measured N2O emission data, but instead to describe a complete carbon and nitrogen budget of the system. The evaluation was conducted using time series and goodness of fit quantified by the linear regression coefficient of determination (R2) and mean error (ME) and root mean square error (RMSE). The harvests in 2013 and 2014 were assumed to remove 100% of the grain and 10% of both leaf and stem. The initial conditions of the oilseed rape crop were defined by measured plant biomass data. Initial plant and soil conditions were set according to the measured data. The model was run for 5 years for initialization with a duplicated climate before the studied period.
Statistics
Soil NO3−, NH4+ and N2O emissions are shown as arithmetic means ± SE. Cumulative N2O emissions were obtained by linear interpolation between sampling dates and integration of area under the interpolated fluxes. The cumulative data of the 7-months period following harvest were tested for homogeneity of variance (Levene’s test) and normal distribution (Shapiro-Wilk test). Then the differences among fertilizer levels were assessed by performing one-way ANOVA with Tukey’s test, and differences among years were assessed by performing a t-test. Statistical significance was considered as p < 0.05. For the correlation of non-parametric N2O fluxes with soil NH4+, NO3−, WFPS and air temperature, Spearman correlations were calculated with * standing for p < 0.05 and ** for p < 0.001.
For statistical analysis of the split-plot design of the field experiment, a mixed model with repeated measurements with heterogeneous autoregressive structure was set up to test for significant differences in fertilizer rate and residue application for each period (2013/2014 and 2014/2015). Significant differences among treatments were based on Tukey’s tests. For computing, the software SAS v. 9.3 (SAS Institute Inc., Cary, North Carolina, United States) was used.
Results
Weather Conditions
The measured annual mean air temperature was 8.9°C in 2013 and 10.6°C in 2014. Annual precipitation in 2013 was 641 mm, which was greater than the total of 609 mm in 2014 (Figure 1). In 2014, the period from June to August had high rainfall of 278 mm, whereas in 2013 these months accounted for only 128 mm. In line with the rainfall data, WFPS values were lower in 2013 (dropping from 42% WFPS at the beginning of August to 26% WFPS in September) than in 2014 (remaining at ca. 50% WFPS throughout the experimental period) (Figure 6).
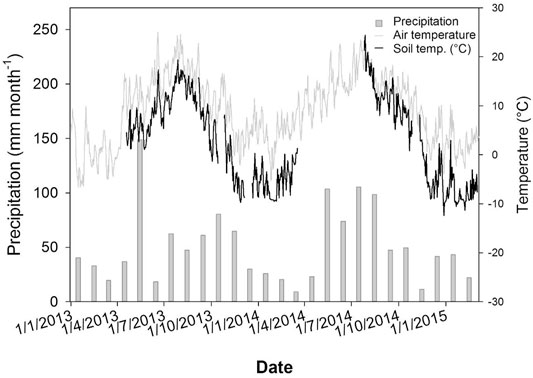
FIGURE 1. Air temperature (°C), mean soil temperature (5 cm) (°C) and precipitation (mm month−1) from January 2013 to March 2015 at the research site Reinshof.
Oilseed Rape Seed and Residue Biomass
The oilseed rape in No-fert control subplots had a seed yield of 3.7 ± 0.2 and 3.6 ± 0.2 tons dry matter per hectare per year (t DM ha−1) in 2013 and 2014, respectively. With N fertilizer input, seed yield showed consistent but insignificant increases in both years (Table 2). The measured straw biomasses in the No-fert control subplots were 5.3 ± 0.2 and 5.1 ± 0.1 t DM ha−1 in 2013 and 2014. The effect of N fertilization on straw biomass was also insignificant, but there was a consistent positive trend, increasing applied N rates led to decreasing measured C/N ratios of straw in both years (Table 1). The amount of N returned to soil with the residue biomass was higher in the fertilized plots than in the unfertilized treatment in 2014, but not in 2013, and there was no effect on the straw biomass production and seed yield when the N- fertilizer rate was further increased from 90 to 180 kg N ha−1.
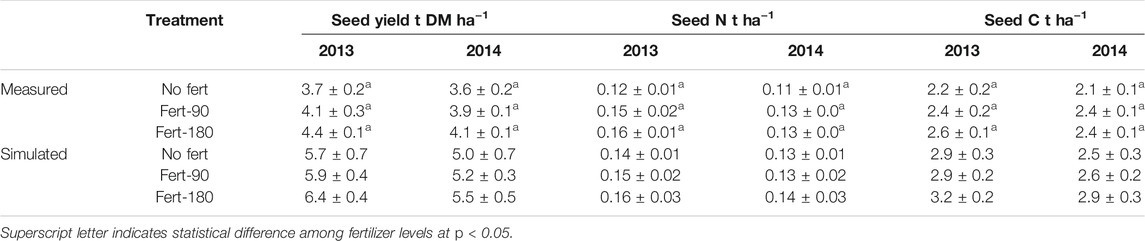
TABLE 2. Oilseed rape seed yield and N and C removed by seeds at the experimental site Reinshof in 2013 and 2014 (n = 3) as influenced by fertilizer treatments.
N2O Emissions
N2O emission rates varied significantly (p < 0.001) between years, and the maximum N2O peaks were significantly higher (ca. tenfold) in 2014 compared with 2013 (Figure 2). In both years, the highest N2O emission peaks were detected shortly after post-harvest tillage. In 2013, the highest measured daily N2O emission rate was 0.04 ± 0.0 kg N2O-N ha−1 d−1 (in the Fert-180 treatment with straw amendment), whereas it was 0.33 ± 0.08 kg N2O-N ha−1 d−1 (in the Fert-180 treatment with straw) in 2014, thus almost ten times higher. Winter N2O emissions were generally low, being consistently below 0.02 kg N2O-N ha−1 d−1 from November to March in all treatments and years. The N doses applied in spring did not affect post-harvest N2O emissions in either year, despite higher residual soil NO3− -N in Fert-180 treatments at oilseed rape harvest time. Similarly, straw amendment did not affect N2O fluxes in 2014, but caused a slight (p < 0.05) decrease in 2013 for the Fert-90 treatment. Overall, cumulative post-harvest N2O emissions were very substantially higher in 2014 than those measured in 2013 (Figure 3).
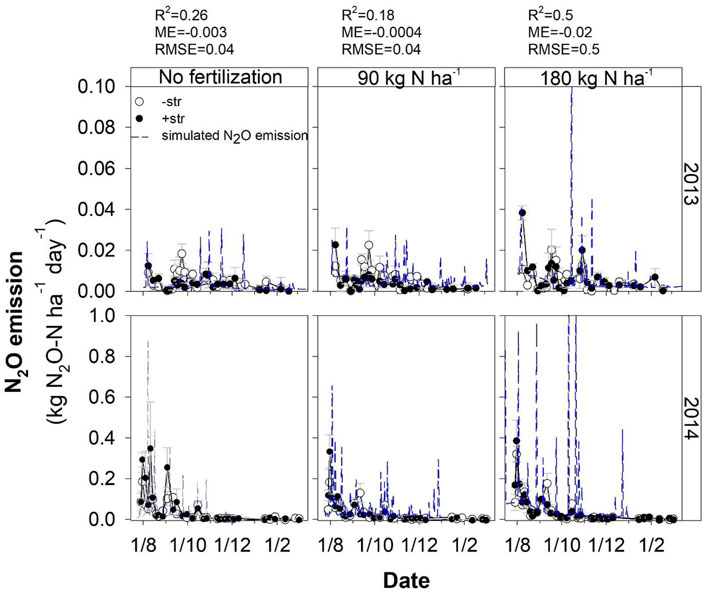
FIGURE 2. Measured and simulated daily N2O emissions from non-fertilized soils (No fert) and soils fertilized with 90 kg N ha−1 (Fert-90) or 180 kg N ha−1 (Fert-180) in spring. In all soils straw was quantified and either removed (-str) or placed back in the respective fertilized soils (+str). Sampling period was from August 2013 to March 2014 and August 2014 to March 2015. Numbers above the panel describe the quality of the COUP model for the respective fertilizer treatment. Error bars show the standard error of mean of each treatment (n = 3).
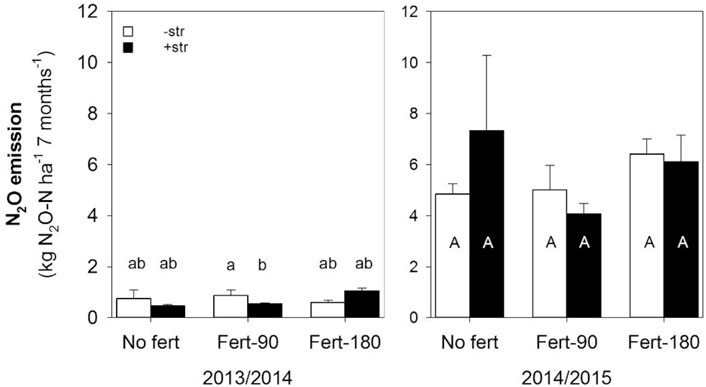
FIGURE 3. Cumulative N2O emissions from non-fertilized soils (No fert) and soils in spring fertilized with 90 kg N ha−1 (Fert-90) or 180 kg N ha−1 (Fert-180) for the post-harvest period from August to March for the years 2013/2014 and 2014/2015, respectively. In all soils straw was quantified and either removed (-str) or quantified and placed back into the respective soils (+str). Error bars show the standard error of mean of each treatment (n = 3). Different letters indicate significant differences (p < 0.05) among treatments. Periods 2013/2014 and 2014/2015 were analyzed separately.
Soil Mineral N
Soil NH4+ concentrations in the uppermost 0.15 m soil layer were below 5 kg N ha−1 in both years and were not significantly affected by any treatments (Figure 4). In contrast, soil NO3− concentrations measured shortly after harvest were 12.3 ± 0.6 and 13.0 ± 2.4 kg N ha−1 in the control treatments in August 2013 and August 2014. Fertilizer application in spring resulted in substantially higher residual NO3− in the uppermost soil layer in August, amounting to 28.2 ± 3.6 and 28.3 ± 1.6 kg N ha−1 in the Fert-180 treatments in 2013 and 2014, respectively. Soil NO3− concentration remained more or less constant throughout the experiment in 2013, whereas in 2014 it decreased gradually over time to almost zero during winter. The data clearly showed that straw amendment decreased soil NO3− content significantly (p < 0.05) in all treatments and years. The decrease in soil NO3− concentration due to straw amendment was more pronounced in 2013.
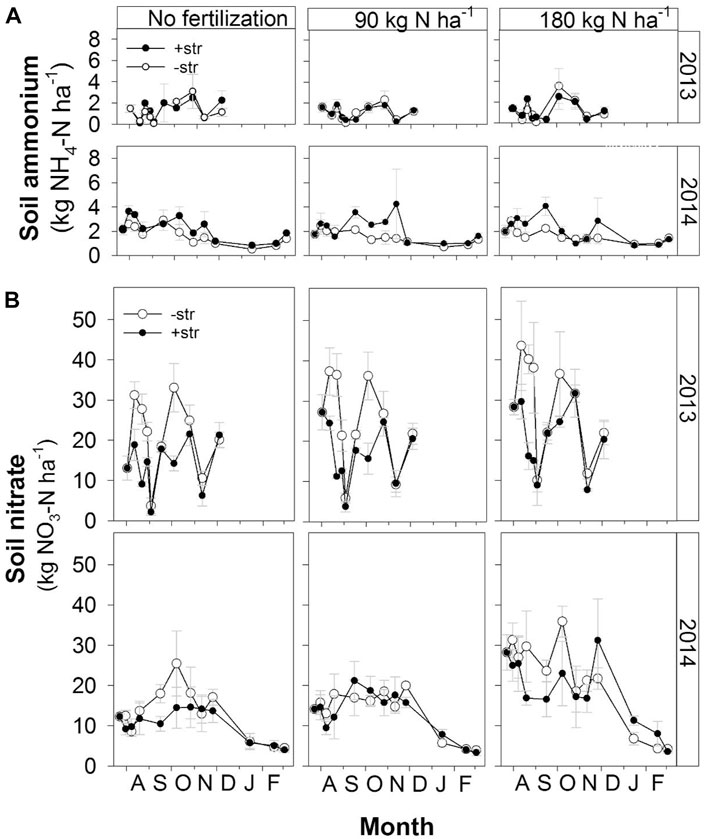
FIGURE 4. (A) NH4+ and (B) NO3− concentration in the uppermost soil layer (0–0.15 m) from soils after oilseed rape harvest without straw incorporation (-str) and incorporation of oilseed rape straw (+str) from the non-fertilized treatment (No fert) and N fertilized treatments (Fert-90: 90 kg N ha−1; Fert-180: 90 kg N ha−1) in spring. Error bars show the standard error of mean of each treatment (n = 3).
Correlation of N2O Fluxes to Environmental Factors
In general, significant correlations were found between N2O fluxes and environmental factors such as soil moisture WFPS and air temperature. Furthermore, soil NH4+ concentrations showed moderate but significant correlation with post-harvest N2O fluxes (Table 3). In treatment Fert-180, air temperature showed the highest correlation with post-harvest N2O emissions (Spearman R = 0.91, p < 0.001). Figure 5 clearly shows an exponential relationship between air temperature and N2O emissions. High emissions occurred when air temperature was above 15°C. It is also interesting to note that N2O emissions show higher correlation with soil NH4+ than with NO3− even though soil NH4+ contents were much lower than NO3− contents.
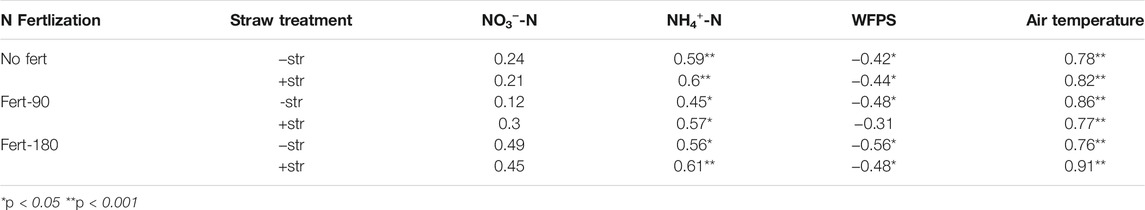
TABLE 3. Spearman correlation R value for N2O fluxes in 2014 differentiated by fertilizer treatment (No fert, Fert-90, Fert-180) and straw addition (−str, +str). Concentrations of NO3−-N, NH4-N and WFPS refer to the uppermost soil layer (0–0.15 m).
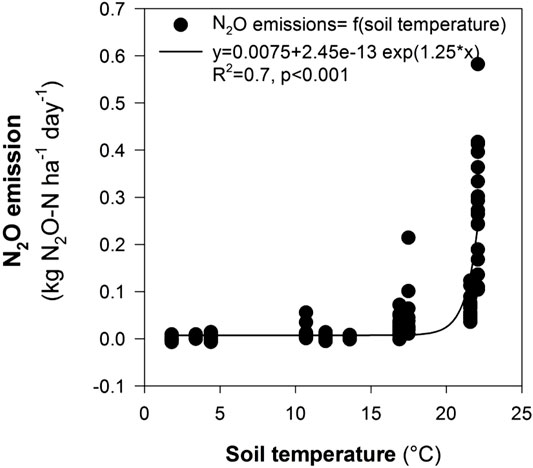
FIGURE 5. Air temperature and N2O emissions from all plots from the uppermost soil layer (0–0.15 m) in the period from harvest 2014 to winter 2014/2015.
Simulation of N2O Fluxes by the CoupModel
The measured soil N and abiotic data were used to test the CoupModel ecosystem model. Overall, the simulation was in good agreement with measured soil temperatures, as indicated by an R2 of 0.93, but it showed less accuracy in simulating the WFPS (Figure 6). The fit of modeled N2O emission rate was best in the Fert-180 treatment (R2 = 0.5, ME = 0.02, RMSE = 0.5). However, the model seemed to overestimate N2O fluxes in the Fert-90 and Fert-180 treatments, as shown in Figure 2. The simulated emission peaks show time shifts with the measured data. The model yielded higher denitrification rate estimates for Fert-180 soils compared with the No-fert treatment.
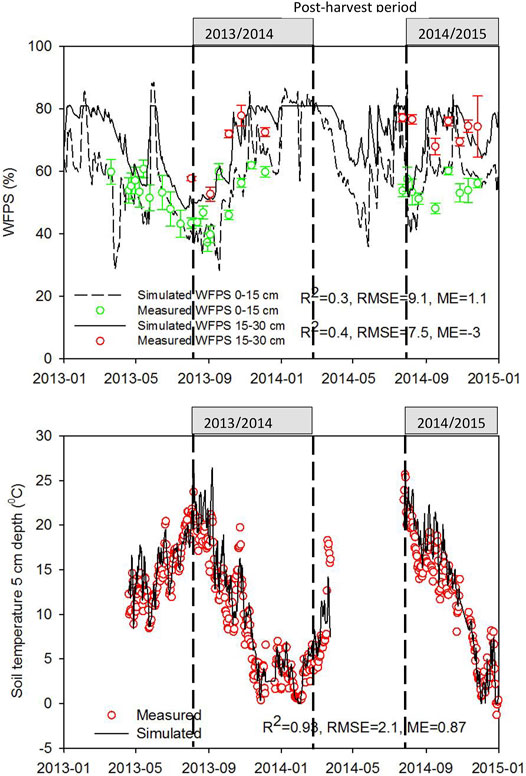
FIGURE 6. Measured and simulated water-filled pore space for the experiment period from spring 2013 to 2015.
Discussion
Effects of Straw and Fertilizer Management on Soil N Cycling
In this study, soil NO3− concentrations at harvest were found to be strongly governed by the N fertilizer level in spring and were higher with higher fertilizer rates (Figure 4). Similarly, in a15N labeling study of oilseed rape, Malagoli et al. (2005) showed that about 45 kg N ha−1 entered the soil before harvest via withered leaves. In the period from harvest to autumn (September–October), the incorporation of oilseed rape straw reduced soil NO3− concentration (no straw (−str) vs. straw amendment (+str) of soil) (Figure 4). This is probably because the high C/N of straw led to a higher incorporation of soil N into soil microbial biomass (Spohn, 2015). Our applied straw C/N ratio, ranging from 38 to 71, was well above the soil C/N ratio of 10.5. Thus, the increased microbial soil respiration likely created a immobilization of mineral N, thus reducing the soil NO3−. A net mobilization of NO3− in bare soil about 6 weeks after harvest was also found in a study conducted by Engström and Lindén (2012). This might also explain the substantial drop in NO3− concentration in all treatments in the first 4 weeks after harvest in 2013. However, a build-up of NO3− could also have resulted from the cessation of plant uptake with ongoing mineralization.
The NO3− concentration dropped substantially in 2013, in the first week following harvest and in particular in the first 30 days. There are several possible explanations for this. On the one hand, Engström and Lindén (2012) observed a similar fluctuation in the soil mineral N pool. They conducted an in-situ incubation study in a field experiment with treatments that included the addition of oilseed rape straw after harvest and measurements of mineralization and immobilization of soil mineral N. The net N immobilization was 11 kg N ha−1 in the 6-week period right after harvest. Our field experiment confirmed a net immobilization of 19 kg N ha−1 in the Fert-180 treatment with straw amendment (+str) from 2 August to September 3, 2013. On the other hand, the decline of soil NO3− could be ascribed to the uptake of N by volunteer oilseed rape, that new oilseed rape emerged by fallen seeds in autumn. Volunteer oilseed rape results from grain loss during harvest and it has been reported to take up upto 28 kg N ha−1 (Justes et al., 1999). Moreover, high NO3− concentrations in the soil N pool after harvest increase rates of loss from nitrate leaching into deeper soil layers (Engström and Lindén 2012).
Effect of Straw and Fertilizer Management on Post-Harvest N2O Emissions
After harvest and incorporation of oilseed rape straw, a short pulse in N2O emission activity was found in both years. However, the magnitude of fluctuation differed considerably for the two post-harvest periods. In the approach towards winter, N2O emissions declined to very low rates. In the two experimental periods of 2013/2014 and 2014/2015, the variations in residue incorporation into the soil and N fertilizer level revealed that both factors had only minor effects. Most studies have documented that N2O emissions were exponentially increased by increasing fertilizer levels (Shcherbak et al., 2014; Song et al., 2018; Yao et al., 2018). However, in our study, 180 kg N ha−1 did not greatly increase N2O emissions in the post-harvest period, and the calculated apparent recovery of nitrogen ARN of Fert-180 was only between 20–30%, which indicates that in the Fert-180 treatment a substantial amount of N was leached out during the growing season or emitted to the atmosphere. It can be expected that these losses were also related to the high soil fertility of the site which was probably derived from repeated long-term return of crop residues, intercrops and occasional application of organic manures in the past decades. Regarding the C/N ratio of straw in 180 kg N ha−1 fertilized fields being much lower than the No-fert C/N ratio, it was suggested that oilseed rape was adapted to assimilate more N in plant tissue in soils with a higher N fertilizer level.
In our study, straw incorporation also has minor effects on N2O emissions, although it has been widely debated whether straw incorporation could increase or reduce N2O emissions (Hu et al., 2019; Xia et al., 2014; Schmatz et al., 2020; Surey et al., 2020; Xu et al., 2019). In a meta-analysis, Hu et al. (2019) demonstrated that residue returned with plough tillage (as in our study) showed lower N2O emissions than reduced tillage/no tillage, and that the C/N ratio of straw residues was negatively correlated with N2O emissions (Chen et al., 2021), while straw incorporation with a C/N ratio between 40 and 80 showed minor changes in soil N2O emissions. However, even with straw-removed treatments, there was still a large amount of C inputs to the soil from leaf litter, stubble and roots. These residues may regulate soil C/N ratios. Our previous study also demonstrated that, although straw incorporation increased CO2 emission, the increase of N2O emission was minor when no additional N was applied in autumn (Köbke et al., 2018). The Köbke et al. study thus indicates that increased soil respiration by straw respiration did not necessarily convene high soil N2O emissions, as confirmed again in our current study.
Effect of Climate Factors on Annual Variability of Post-Harvest N2O Emissions
The comparison of N2O fluxes of the post-harvest periods in both years shows marked differences. Here, rather than the fertilization treatment or the removal of straw, the different climatic variations had a great influence with a tenfold difference for the presented years. Ruser et al. (2001) conducted a field experiment covering several years and crops. In their study, NO3− concentrations had a significant effect and also water-filled pore space showed quite high positive correlations with N2O emissions. These factors accounted for 52% of the variability of N2O emissions. In a study under controlled conditions (Harrison-Kirk et al., 2013), repeated rewetting of the soil showed the highest cumulative N2O emissions compared with either continuously dry or wet soil. In our experiment, there were more rainfall events and higher amounts of precipitation post-harvest in 2014, which led to measured WFPS of nearly 60%, compared with only 50% in 2013. Soil samples were oftren taken a day or two after rainfall events, hence top soil WFPS might have been even higher immediately after rainfall. In addition, soil NO3− contents were more consistent during the 2014 post-harvest period. Thus there was sufficient mineral N, higher water supply and high O2 consumption by respiration which probably triggered N2O emissions from denitrification (Wu et al., 2018). Thus, these factors are seen as explanatory for a great share of the higher N2O emissions in 2014. In addition, the fact that, following our sampling schedule, gas samples were often taken a day or two after rainfall events, may have led to a certain overestimation of N2O emissions in 2014. Another major factor for the substantial difference in N2O emissions between the 2 years was temperature, which is known to be a strong control of soil microbial activity and N mineralization from soil organic matter. Billings and Tiemann (2014) showed in an incubation experiment that warm June soils have a high capability to produce N2O, displayed in the N2O production which was underlined by the high amount of cnorB genes. In those soils, the nosZ genes were lower than cnorB genes, which was in line with high rates of N2O production but low N2 production. We have not been able to measure this in our experimental approach but it nonetheless underlines the potential of soils to produce N2O by incomplete denitrification, and annual mean temperature in 2014 was 1.7°C higher than that in 2013. These results also warn of the risk of high N2O emissions as a consequence of global warming (Dobbie and Smith, 2001; Butterbach-Bahl and Dannenmann, 2011).
Finally, the share of N2O released from the soil mineral N pool (NH4+ and NO3−) seems to follow a pattern. Since soil mineral N concentrations ranged at equal levels in both years, the ratio of released N2O in relation to the soil mineral N concentration on a specific date was less than or equal to 0.12%, even for the dates shortly after harvest in 2013. In contrast, in 2014 the ratio of N2O being released in relation to the soil mineral N pool was well above 1% right after harvest, and it did not drop to the level of 2013 before beginning of October. This indicates that in 2014 there were greater rates of N2O-producing processes rather than greater pool sizes from which N2O was produced. A possible explanation might be that high WFPS, low oxygen partial pressure and the high temperature in 2014 induced anaerobic conditions more rapidly, which then increased the ratio of N2O emissions to the pool size of soil mineral N, which is indicative of the dominance of denitrification. Nevertheless, a large C source presented by root biomass and straw may also lead to production of N2 as a denitrification end product, which could explain the same levels of N2O emissions in different treatments.
Implications of the CoupModel
The CoupModel reproduced the measured high N2O emissions in 2014 and, according to the model, these were primarily produced by denitrification as the year’s temperature and soil moisture were favorable for this process. However, it should be noted that, for 2014, the model overestimated not only soil moisture (WFPS) but also straw biomass and seed yield. Therefore, the modeled high emissions might partly be due to a bias resulting from combined high residual mineral N and anaerobiosis in the model. There is a number of potential reasons for the higher number of peaks simulated by CoupModel, which was not observed in the field. First, the simulated WFPS which is used for denitrification calculation showed more pronounced responses to precipitation in the model than in measured data (Figure 6). Also, the model simulated a slightly higher mineral N availability compared to the measured data. Both have probably contributed to more and higher emission events in the model. Nevertheless, the modeled soil respiration agreed well with the measured data (Supplementary Figure S1), and therefore it is likely that organic matter decomposition and also mineralization were reasonably well described by the model. For the fertilized soil, model results indicate higher denitrification rates.
Conclusion
Straw incorporation as a source of organic matter has been assumed to make a major contribution to N2O emissions from agriculture in the post-harvest period. However, for oilseed rape, the present study, which was conducted on a fertile silty loam soil, showed that leaving straw on the field after harvest seems to be equal to removal or even to bring a slight benefit with respect to reducing N2O emissions. Besides effects of soil moisture and precipitation, this study also demonstrates the high temperature sensitivity of N2O production even under field conditions. With the background of predicted global temperature increases, the scenario of N2O emissions from oilseed rape may be deteriorated in the future. This study underlines the importance of multi-year experiments to assure the capture of climate variability. Also, attempts to identify mitigation options should relate to the predicted changes in summer rainfall and temperature pattern in temperate regions. The detrimental impacts caused by climate change bring new challenges to the management of agricultural systems. Thus new practices like implementation of low nitrate-leaching and climate-smart management of cover crops are urgently needed.
Data Availability Statement
The raw data supporting the conclusion of this article will be made available by the authors, without undue reservation.
Author Contributions
SK, HH, MS and KD contributed to conception and design of the study. SK and MB organized the field experiment. SK and HH performed the statistical analysis. SK wrote the first draft of the manuscript. HH wrote sections of Coupmodel in the manuscript. HW wrote part of the discussion in the manuscript. All authors contributed to manuscript revision, read, and approved the submitted version.
Conflict of Interest
The authors declare that the research was conducted in the absence of any commercial or financial relationships that could be construed as a potential conflict of interest.
Publisher’s Note
All claims expressed in this article are solely those of the authors and do not necessarily represent those of their affiliated organizations, or those of the publisher, the editors, and the reviewers. Any product that may be evaluated in this article, or claim that may be made by its manufacturer, is not guaranteed or endorsed by the publisher.
Acknowledgments
We thank FNR (Fachagentur Nachwachsende Rohstoffe e.V.) and UFOP (Union zur Förderung der Oel-und Proteinpflanzen e.V.) for funding this work. We also acknowledge the dedicated support from the technical staff Susanne Koch, Marlies Niebuhr, Reinhard Hilmer, Jürgen Kobbe and Ulrike Kierbaum of the Division of Plant Nutrition and Crop Physiology at the University of Goettingen with field work and lab analyses.
Supplementary Material
The Supplementary Material for this article can be found online at: https://www.frontiersin.org/articles/10.3389/fenvs.2021.773901/full#supplementary-material
Supplementary Figure S1 | Measured and simulated soil respiration from non-fertilized soils (No fert) and soils fertilized with 90 kg N ha-1 (Fert-90) or 180 kg N ha-1 (Fert-180) in spring. In all soils straw was quantified and placed back in the respective fertilized soils (+str). Sampling period was from August 2013 to March 2014 and August 2014 to March 2015. Numbers above the panel describe the quality of the COUP model for the respective fertilizer treatment. Error bars show the standard error of mean of each treatment (n=3).
References
Billings, S. A., and Tiemann, L. K. (2014). Warming-induced Enhancement of Soil N2O Efflux Linked to Distinct Response Times of Genes Driving N2O Production and Consumption. Biogeochemistry 119, 371–386. doi:10.1007/s10533-014-9973-2
Butterbach-Bahl, K., Baggs, E. M., Dannenmann, M., Kiese, R., and Zechmeister-Boltenstern, S. (2013). Nitrous Oxide Emissions from Soils: How Well Do We Understand the Processes and Their Controls? Philos. Trans. R. Soc. Lond. B Biol. Sci. 368, 20130122. doi:10.1098/rstb.2013.0122
Butterbach-Bahl, K., and Dannenmann, M. (2011). Denitrification and Associated Soil N2O Emissions Due to Agricultural Activities in a Changing Climate. Curr. Opin. Environ. Sustainability 3, 389–395. doi:10.1016/j.cosust.2011.08.004
Chen, H., Li, X., Hu, F., and Shi, W. (2013). Soil Nitrous Oxide Emissions Following Crop Residue Addition: a Meta-Analysis. Glob. Change Biol. 19, 2956–2964. doi:10.1111/gcb.12274
Chen, Z., Tu, X., Meng, H., Chen, C., Chen, Y., Elrys, A. S., et al. (2021). Microbial Process-Oriented Understanding of Stimulation of Soil N2O Emission Following the Input of Organic Materials. Environ. Pollut. 284, 117176. doi:10.1016/j.envpol.2021.117176
Crutzen, P. J., Mosier, A. R., Smith, K. A., and Winiwarter, W. (2008). N2O Release from Agro-Biofuel Production Negates Global Warming Reduction by Replacing Fossil Fuels. Atmos. Chem. Phys. 8, 389–395. doi:10.5194/acp-8-389-2008
Dobbie, K. E., and Smith, K. A. (2001). The Effects of Temperature, Water-Filled Pore Space and Land Use on N2O Emissions from an Imperfectly Drained Gleysol. Soil Sci. 52, 667–673. doi:10.1046/j.1365-2389.2001.00395.x
Don, A., Osborne, B., Hastings, A., Skiba, U., Carter, M. S., Drewer, J., et al. (2012). Land-Use Change to Bioenergy Production in Europe: Implications for the Greenhouse Gas Balance and Soil Carbon. GCB Bioenergy 4, 372–391. doi:10.1111/j.1757-1707.2011.01116.x
DüV (2021). Fertiliser Ordinance of 26 May 2017 (BGBl. I p. 1305) Amended by Article 97. German Federal Law Gazette BGBl I p. 3436
Deutscher Wetterdienst (2019). DWD. Available at; https://opendata.dwd.de/climate_environment/CDC/observations_germany/climate/multi_annual/mean_61-90/.
Engström, L., and Lindén, B. (2012). Temporal Course of Net N Mineralization and Immobilization in Topsoil Following Incorporation of Crop Residues of winter Oilseed Rape, Peas and Oats in a Northern Climate. Soil Use Manage 28, 436–447. doi:10.1111/sum.12004
FAOSTAT (2021). FAOSTAT [WWW Document]. Available at: http://www.fao.org/faostat/en/#data/QC (Accessed November 14, 2021).
Ghaouti, L., Vogt-Kaute, W., and Link, W. (2008). Development of Locally-Adapted Faba Bean Cultivars for Organic Conditions in Germany through a Participatory Breeding Approach. Euphytica 162, 257–268. doi:10.1007/s10681-007-9603-3
Gundersen, P., Christiansen, J. R., Alberti, G., Brüggemann, N., Castaldi, S., Gasche, R., et al. (2012). The Response of Methane and Nitrous Oxide Fluxes to forest Change in Europe. Biogeosciences 9, 3999–4012. doi:10.5194/bg-9-3999-2012
Hadas, A., Kautsky, L., Goek, M., and Erman Kara, E. (2004). Rates of Decomposition of Plant Residues and Available Nitrogen in Soil, Related to Residue Composition through Simulation of Carbon and Nitrogen Turnover. Soil Biol. Biochem. 36, 255–266. doi:10.1016/j.soilbio.2003.09.012
Harrison-Kirk, T., Beare, M. H., Meenken, E. D., and Condron, L. M (2013). Soil Organic Matter and Texture Affect Responses to Dry/wet Cycles: Effects on Carbon Dioxide and Nitrous Oxide Emissions. Soil Biol. Biochem. 57, 43–55. doi:10.1016/j.soilbio.2012.10.008
He, H., Jansson, P.-E., Svensson, M., Björklund, J., Tarvainen, L., Klemedtsson, L., et al. (2016a). Forests on Drained Agricultural Peatland Are Potentially Large Sources of Greenhouse Gases - Insights from a Full Rotation Period Simulation. Biogeosciences 13, 2305–2318. doi:10.5194/bg-13-2305-2016
He, H., Jansson, P.-E., Svensson, M., Meyer, A., Klemedtsson, L., and Kasimir, Å (2016b). Factors Controlling Nitrous Oxide Emission from a spruce forest Ecosystem on Drained Organic Soil, Derived Using the CoupModel. Ecol. Model. 321, 46–63. doi:10.1016/j.ecolmodel.2015.10.030
Henke, J., Sieling, K., Sauermann, W., and Kage, H. (2009). Analysing Soil and Canopy Factors Affecting Optimum Nitrogen Fertilization Rates of Oilseed Rape (Brassica Napus). J. Agric. Sci. 147, 1–8. doi:10.1017/s0021859608008162
Hu, N., Chen, Q., and Zhu, L. (2019). The Responses of Soil N2O Emissions to Residue Returning Systems: A Meta-Analysis. Sustainability 11, 748. doi:10.3390/su11030748
Hutchinson, G. L., and Mosier, A. R. (1981). Improved Soil Cover Method for Field Measurement of Nitrous Oxide Fluxes. Soil Sci. Soc. Am. J. 45, 311–316. doi:10.2136/sssaj1981.03615995004500020017x
IPCC (2014). 2013 Supplement to the 2006 IPCC Guidelines for National Greenhouse Gas Inventories. Switzerland: IPCC.
IUSS (2015). World Reference Base for Soil Resources 2014, update 2015 International Soil Classification System for Naming Soils and Creating Legends for Soil Maps. World Soil Resources Report.
Jansson, P.-E., and Moon, D. S. (2001). A Coupled Model of Water, Heat and Mass Transfer Using Object Orientation to Improve Flexibility and Functionality. Environ. Model. Softw. 16, 37–46. doi:10.1016/s1364-8152(00)00062-1
Johnsson, H., Bergstrom, L., Jansson, P.-E., and Paustian, K. (1987). Simulated Nitrogen Dynamics and Losses in a Layered Agricultural Soil. Agric. Ecosyst. Environ. 18, 333–356. doi:10.1016/0167-8809(87)90099-5
Justes, E., Mary, B., and Nicolardot, B. (1999). Comparing the Effectiveness of Radish Cover Crop, Oilseed Rape Volunteers and Oilseed Rape Residues Incorporation for Reducing Nitrate Leaching. Nutr. Cycl. Agroecosyst 55, 207–220. doi:10.1023/a:1009870401779
K. A. Smith (Editor) (2010). Nitrous Oxide and Climate Change (London, Washington, DC: Earthscan), 232.
Köbke, S., Senbayram, M., Pfeiffer, B., Nacke, H., and Dittert, K. (2018). Post-harvest N2O and CO2 Emissions Related to Plant Residue Incorporation of Oilseed Rape and Barley Straw Depend on Soil NO 3 - Content. Soil Tillage Res. 179, 105–113. doi:10.1016/j.still.2018.01.013
K. Schjoerring, J., and Mattsson, M. (2001). Quantification of Ammonia Exchange between Agricultural Cropland and the Atmosphere: Measurements over Two Complete Growth Cycles of Oilseed Rape, Wheat, Barley and Pea. Plant Soil 228, 105–115. doi:10.1023/a:1004851001342
Madigan, M. T., Martinko, J. M., Stahl, D. A., and Clark, D. P. (2012). Brock Biology of Microorganisms. 13th ed.. NJ, United States: Pearson.
Malagoli, P., Laine, P., Rossato, L., and Ourry, A. (2005). Dynamics of Nitrogen Uptake and Mobilization in Field-Grown winter Oilseed Rape (Brassica Napus) from Stem Extension to Harvest: I. Global N Flows between Vegetative and Reproductive Tissues in Relation to Leaf Fall and Their Residual N. Ann. Bot. 95, 853–861. doi:10.1093/aob/mci091
Nylinder, J., Stenberg, M., Jansson, P.-E., Klemedtsson, Å. K., Weslien, P., and Klemedtsson, L. (2011). Modelling Uncertainty for Nitrate Leaching and Nitrous Oxide Emissions Based on a Swedish Field experiment with Organic Crop Rotation. Agric. Ecosyst. Environ. 141, 167–183. doi:10.1016/j.agee.2011.02.027
P. E. Jansson, and L. Karlberg (Editors) (2011). Coupled Heat and Mass Transfer Model for Soil-Plant-Atmosphere Systems (Stockholm: CoupModel), 498.
RED (2009). Directive 2009/28/EC of the European Parliament and of the council of 23 April 2009 [WWW Document]. Available at: https://eur-lex.europa.eu/legal-content/EN/TXT/HTML/?uri=CELEX:32009L0028&from=EN (Accessed May 17, 2020).
Ruser, R., Flessa, H., Schilling, R., Beese, F., and Munch, J. C. (2001). Effect of Crop-specific Field Management and N Fertilization on N2O Emissions from a fine-loamy Soil. Nutr. Cycl. Agroecosyst 59, 177–191. doi:10.1023/a:1017512205888
Schmatz, R., Recous, S., Adams Weiler, D., Elias Pilecco, G., Luiza Schu, A., Lago Giovelli, R., et al. (2020). How the Mass and Quality of Wheat and Vetch Mulches Affect Drivers of Soil N2O Emissions. Geoderma 372, 114395. doi:10.1016/j.geoderma.2020.114395
Shcherbak, I., Millar, N., and Robertson, G. P. (2014). Global Metaanalysis of the Nonlinear Response of Soil Nitrous Oxide (N2O) Emissions to Fertilizer Nitrogen. Proc. Natl. Acad. Sci. 111, 9199–9204. doi:10.1073/pnas.1322434111
Sieling, K., and Kage, H. (2010). Efficient N Management Using winter Oilseed Rape. A Review. Agron. Sustain. Dev. 30, 271–279. doi:10.1051/agro/2009036
Sieling, K., and Kage, H. (2006). N Balance as an Indicator of N Leaching in an Oilseed Rape - winter Wheat - winter Barley Rotation. Agric. Ecosyst. Environ. 115, 261–269. doi:10.1016/j.agee.2006.01.011
Song, X., Liu, M., Ju, X., Gao, B., Su, F., Chen, X., et al. (2018). Nitrous Oxide Emissions Increase Exponentially when Optimum Nitrogen Fertilizer Rates Are Exceeded in the North China Plain. Environ. Sci. Technol. 52, 12504–12513. doi:10.1021/acs.est.8b03931Statistisches
Spohn, M. (2015). Microbial Respiration Per Unit Microbial Biomass Depends on Litter Layer Carbon-To-Nitrogen Ratio. Biogeosciences 12, 817–823. doi:10.5194/bg-12-817-2015
Surey, R., Schimpf, C. M., Sauheitl, L., Mueller, C. W., Rummel, P. S., Dittert, K., et al. (2020). Potential Denitrification Stimulated by Water-Soluble Organic Carbon from Plant Residues during Initial Decomposition. Soil Biol. Biochem. 147, 107841. doi:10.1016/j.soilbio.2020.107841
VDLUFA (2002). “Verband Deutscher Landwirtschaftlicher Untersuchungs- und Forschungsanstalten,” in Handbuch der Landwirtschaftlichen Versuchs- und Untersuchungsmethodik (VDLUFA-Methodenbuch) (Nmin-Labormethode). Methode A 6.1.4.1, Bestimmung von mineralischem Stickstoff (Nitrat u. Ammonium) in Bodenprofilen(Nmin-Labormethode), Bd. I Die Untersuchung von Böden. 44th ed (Darmstadt: VDLUFA-Verlag).
Wrage-Mönnig, N., Horn, M. A., Well, R., Müller, C., Velthof, G., and Oenema, O. (2018). The Role of Nitrifier Denitrification in the Production of Nitrous Oxide Revisited. Soil Biol. Biochem. 123, A3–A16. doi:10.1016/j.soilbio.2018.03.020
Wu, D., Wei, Z., Well, R., Shan, J., Yan, X., Bol, R., et al. (2018). Straw Amendment with Nitrate-N Decreased N2O/(N2O+N2) Ratio but Increased Soil N2O Emission: A Case Study of Direct Soil-Born N2 Measurements. Soil Biol. Biochem. 127, 301–304. doi:10.1016/j.soilbio.2018.10.002
Xia, L., Wang, S., and Yan, X. (2014). Effects of Long-Term Straw Incorporation on the Net Global Warming Potential and the Net Economic Benefit in a Rice–Wheat Cropping System in China. Agric. Ecosyst. Environ. 197, 118–127. doi:10.1016/j.agee.2014.08.001
Xu, C., Han, X., Ru, S., Cardenas, L., Rees, R. M., Wu, D., et al. (2019). Crop Straw Incorporation Interacts with N Fertilizer on N2O Emissions in an Intensively Cropped Farmland. Geoderma 341, 129–137. doi:10.1016/j.geoderma.2019.01.014
Yao, P., Li, X., Liu, J., Shen, Y., Yue, S., and Li, S. (2018). The Role of maize Plants in Regulating Soil Profile Dynamics and Surface Emissions of Nitrous Oxide in a Semiarid Environment. Biol. Fertil. Soils 54, 119–135. doi:10.1007/s00374-017-1243-8
Keywords: nitrous oxide, oilseed rape, fertilization, straw, coupmodel
Citation: Köbke S, He H, Böldt M, Wang H, Senbayram M and Dittert K (2022) Climate Overrides Effects of Fertilizer and Straw Management as Controls of Nitrous Oxide Emissions After Oilseed Rape Harvest. Front. Environ. Sci. 9:773901. doi: 10.3389/fenvs.2021.773901
Received: 10 September 2021; Accepted: 25 November 2021;
Published: 17 January 2022.
Edited by:
Silvana Munzi, University of Lisbon, PortugalReviewed by:
Yansheng Li, Northeast Institute of Geography and Agroecology (CAS), ChinaDima Chen, China Three Gorges University, China
Sissel Hansen, Norwegian Centre for Organic Agriculture (NORSØK), Norway
Copyright © 2022 Köbke, He, Böldt, Wang, Senbayram and Dittert. This is an open-access article distributed under the terms of the Creative Commons Attribution License (CC BY). The use, distribution or reproduction in other forums is permitted, provided the original author(s) and the copyright owner(s) are credited and that the original publication in this journal is cited, in accordance with accepted academic practice. No use, distribution or reproduction is permitted which does not comply with these terms.
*Correspondence: Hongxing He, aG9uZ3hpbmctaGVAaG90bWFpbC5jb20=; Haitao Wang, SGFpdGFvLndhbmdAYWdyLnVuaS1nb2V0dGluZ2VuLmRl