 Hanxiao Xu
 Bei Ma
- College of Management, Ocean University of China, Qingdao, China
Environmental factors have a profound impact on the evaluation of grain production efficiency. Taking environmental factors into account can more accurately measure grain production efficiency and identify the development stage of grain production. Based on the global super-efficiency SBM model, environmental factors are included in the grain production efficiency measurement system, while the temporal and spatial evolution characteristics of grain production environmental efficiency and the sources of inefficiency are analyzed. In addition, the Spatial Durbin Model is used to investigate the influencing factors and spatial spillover effects of China’s grain production environmental efficiency. The results show that: environmental factors have a significant impact on the efficiency of grain production in China; the environmental efficiency of grain production in China fluctuates with a downward trend; the environmental efficiency of grain production in different provinces show obvious spatial differentiation and geographical agglomeration; the main influencing factors of the environmental efficiency loss of grain production in major grain production areas are carbon emissions, non-point source pollution of grain production and labor input; the level of education, the level of technological development, and labor transfer have a significant positive spillover effect on the environmental efficiency of China’s grain production, yet disaster rate has a significantly negative one. Thus, it is important to pay attention to resource conservation and pollution control, strengthen cooperation and exchanges between provinces, and take the path of coordinated development between the environment and grain production.
1 Introduction
Food security has always been the foundation of national security, social stability and economic development, and a major strategic issue that concerns the overall situation. In recent years, China’s overall grain production capacity has steadily increased, but many problems are worsening, such as waste of resources, water and soil pollution, and ecological damage in the process of grain production. The study pointed out that from 2010 to 2050, due to expected changes in population and income levels, without technological changes and special mitigation measures, the environmental impact of the grain system may increase by 50–90% (Springmann et al., 2018). In the face of challenges, in 2015, the Ministry of Agriculture of China launched a zero-growth campaign to contain the use of chemical fertilizers and pesticides, vigorously promoting the reduction of chemical fertilizers and efficiency, and the reduction of pesticides to control the harm. The No. One Central Document of 2021 further proposes to “continue to promote the reduction of fertilizers and pesticides and increase efficiency, and to promote green products and technologies for the prevention and control of crop diseases and insect pests.” In general, the scope of environmental governance has been expanded and the governance has been continuously strengthened (Liao et al., 2018; Shi et al., 2020). Correspondingly, the grain production environment gets improved. However, there is still a gap in the sustainable development capacity of grain production between China and agricultural developed countries. In order to better carry out the construction of ecological civilization in the new era and implement the development concept of harmonious coexistence between man and nature, China’s grain production in the future needs to consider the rigid constraints of resources and the environment and take the road of coordinated development of environmental protection and grain production in order to achieve the high-quality development goal of China’s grain industry.
Based on the above-mentioned practical problems, in order to fill the gap of existing research, this paper incorporates environmental indicators such as grain carbon sinks, grain production carbon emissions, and non-point source pollution into the grain production efficiency evaluation system. The global super-efficiency SBM model is adopted to analyze the spatial and temporal evolution of the environmental efficiency of grain production and the source of inefficiency in the main grain production area from 2004 to 2019. The Moran’s I index is also used to investigate the spatial agglomeration and diffusion effects of the environmental efficiency of grain production in the main grain production area. On this basis, a spatial Durbin model is constructed to explore the spatial spillover effects of China’s grain production environmental efficiency. It aims to provide some reference for the ecological transformation of China’s grain production and promote the high-quality development of grain production. In comparison with the existing studies, the possible marginal contributions of this paper are as follows:
1) It has incorporated environmental factors (especially grain carbon sinks) into the grain production efficiency analysis framework and conducted effective calculations, which has a certain corrective effect on grain production efficiency and helps to understand the true performance of grain production efficiency in various provinces.
2) It has constructed the global super-efficiency SBM model that takes undesired output into consideration. Super-efficiency SBM model is superior to other models as it can ① effectively solve the radial and perspective problems; ② fully consider the problem of undesired output; and ③ solve the ranking problem when the efficiency value of the decision unit is 1. Additionally, given that the factor endowments of the main grain production areas are basically stable, and the input-output factors and development objectives are similar between periods, it is possible to compare the efficiency of the same sample across periods. Therefore, the study has constructed the global super-efficiency SBM model based on the Global Malmquist-Luenberger proposed by Pastor and Lovell (2005). The SBM model uses the input and output data of all decision units in the whole sample period to construct the best production Frontier as a unified benchmark, and each decision unit is compared with the best production Frontier to obtain efficiency values, thus solving the problem of inter-period comparability of DEA models and the problem of linearity without feasible solutions due to too many input and output variables.
3) It has examined and identified the source of inefficiency in the environmental efficiency of grain production. At the national and inter provincial levels, it finds a realistic basis for improving the potential sources, enriches the relevant research on China’s grain production efficiency, and provides a decision-making reference for deeply implementing the concept of green development and promoting the high-quality development of grain production.
4) It has analyzed the spillover effects of external environmental influences such as the level of education, the level of technological development, the labor transfer and the disaster rate on the environmental efficiency of grain production in China to further explore the improvement path of grain production environmental efficiency in China.
2 Literature Review
At present, scholars have conducted abundant studies on grain production efficiency, the perspectives of which mainly focused on the measurement of grain production efficiency, influencing factors and spatial effect studies.
2.1 Calculation of Grain Production Efficiency
The measurement of grain production efficiency mainly includes two aspects: first, the research on the measurement method of grain production efficiency; and second, the selection of indicators for grain production efficiency evaluation. In terms of measurement methods, there are mainly ratio method, life cycle method, ecological footprint method, energy analysis method, stochastic Frontier method and data envelopment analysis method (Wilson et al., 1998; Sachdeva et al., 2011). Among them, the parametric method represented by the stochastic Frontier method and the non-parametric method represented by the data envelopment analysis method are most widely used. Compared with SFA, the DEA method ignores the influence of random errors, leaving out the need to set the functional form of the production boundary in advance (Battese and Coelli, 1995). With the advantages of simultaneous treatment of multiple input-output elements and non-parametric processing of effective boundaries, the DEA has become the most used method for efficiency evaluation and is widely used in energy, transportation, finance and other fields (Xian et al., 2018; Wang et al., 2020; Sun et al., 2021a). Some scholars have also applied the method to the measurement of grain production efficiency, for example, Dolgikh (2019) and Pishgar-Komleh et al. (2020) measured the grain production efficiency in Poland and Ukraine respectively by using the DEA method. In the selection of evaluation indicators, some early scholars took traditional production factors such as land, intermediate factors and labor as input factors (Lin, 1992; Wen, 1993), and most scholars took production factors such as land, water resources, labor, pesticides and chemical fertilizers as input factors (Benedetti et al., 2019; Zhang et al., 2021). In the selection of output factor indicators, scholars generally choose the total grain output as the output index (Yao and Xuan, 2019), while some use the total agricultural output value per unit of cultivated land (Armagan et al., 2010; Kumbhakar et al., 2014) or agricultural added value (Gebregziabher et al., 2012).
2.2 Influencing Factors of Grain Production Efficiency
As a key guarantee of national food security and socio-economic sustainability, food grain production efficiency is influenced by many factors (Maxime et al., 2006). Existing studies tend to incorporate external environmental factors that can impact grain production efficiency into the research framework and explore effective ways to improve grain production efficiency based on varying research scales, research perspectives and focuses (Picazo-Tadeo et al., 2011). Among these external factors, the urbanization level, the level of openness to the outside world, the rate of disasters, and the non-rural employment opportunities all have a significant bearing on grain production (Liu et al., 2020; Zou et al., 2020).
2.3 Space Effects of Grain Production Efficiency
Early literature mainly described or compared the results of grain production efficiency in different regions (Vlontzos et al., 2014). With the deepening of the research, various spatial analysis methods such as Gini coefficient and Theil index were widely used to investigate the temporal and spatial pattern, regional gap, distribution dynamic evolution trend of efficiency (Pang et al., 2016). In recent years, with the development of spatial econometrics and geosciences, more and more scholars begin to use spatial econometric methods to analyze production efficiency by combining data points with their corresponding spatial locations (Wang et al., 2019; Sun et al., 2021b). This method has extended the traditional regression model from the spatial dimension and compensates for the limitations of instability and spatial correlation of traditional spatial data. For example, Cao et al. (2019) used Exploratory Spatial Data Analysis (ESDA) to analyze the evolutionary characteristics of land use efficiency in China. Yuan et al. (2019) adopted ESDA to analyze the spatial correlation of green total factor productivity in the urban cluster on the Shandong Peninsula.
Through the review of the previous literature, it can be found that the existing literature has conducted detailed research on grain production efficiency, but there is still room for further improvement.
1) Previous research has important theoretical value for guiding the development of China’s grain production, but most scholars have not considered the impact of environmental factors on the efficiency of grain production. In recent years, although a few scholars have taken environmental factors into consideration when studying the efficiency of grain production, they only considered undesired output (such as chemical oxygen demand, total nitrogen and total phosphorus) without attaching importance to carbon sink output resulted from the positive externalities of grain production (Bai et al., 2019). However, ignoring the environmental factors of grain production (especially grain carbon sinks) will be detrimental to the accuracy of grain production efficiency assessment.
2) Most of the existing literature adopts the traditional DEA methods to measure the environmental efficiency of grain production, which cannot take account of the effects of “slack variables” on the efficiency value, nor does it consider the change in technical efficiency when the desired output increases and the undesired output decreases, and thus could lead to biased efficiency value. In recent years, although a few scholars have considered using the SBM model to measure grain production efficiency, most of them have not solved the ranking problem when the efficiency value of the decision unit is one in the SBM model. In addition, the DEA method measures relative efficiency, which usually treats the frontiers constructed in each period as independent of each other. As a result, the efficiency values obtained in different periods are not comparable because the frontiers are not at the same level. Beyond that, the construction of frontiers with current decision-making units (DMUs) is likely to violate the rule of thumb due to the large number of input-output variables, resulting in overestimation of efficiency.
3) Most scholars have not included the breaking down of inefficient sources of grain production efficiency and the direction of improvement into the research content, ignored the inbuilt driving factors of grain production efficiency improvement, which is not conducive to the research on the potential of China’s grain production efficiency improvement.
4) Although existing studies have provided an important reference value for the spatial perspective of grain production efficiency, most of them have only focused on the analysis of the spatial and temporal divergence of grain production efficiency and the verification of the existence of spatial spillover effects. There are fewer analyses of the spatial spillover effects of various influencing factors on grain production efficiency.
3 Model Construction and Data Description
3.1 Research Model and Estimation Method
3.1.1 The Global Super-Efficiency SBM Model
Considering the current situation of the grain production process, this paper constructs a global super-efficiency SBM model that takes the undesired output into account. The grain eco-economic system has DMUs (this paper takes the provinces of the main grain production areas as decision-making units), of which there are m kinds of inputs, s1 kinds of expected outputs, and s2 kinds of undesired outputs. For the kth DMUk, its input, expected output, and undesired output vectors are denoted as
where
In order to incorporate slack variables into Eq. 2,
where
Further, the efficiency calculation formula of each input-output element can be decomposed. Based on (Cooper et al., 2007) the inefficiency decomposition idea, the inefficiency of each input and output element is completely decomposed. The efficiency decomposition formula and inefficiency decomposition formula of each input-output element are expressed by Eqs 4, 5 respectively.
The three equations from left to right in Eqs 4, 5 represent the efficiency decomposition formula and the inefficiency decomposition formula of input elements, expected output elements, and undesired output elements. The efficiency decomposition formula obtains the efficiency level of each element, and the inefficiency decomposition formula obtains the decomposition of the total inefficiency, reflecting the potential of each element to improve the efficiency of grain production.
3.1.2 Spatial Durbin Model
Space panel model can be divided into space lag model (SAR), space error model (SEM) and spatial durbin model (SDM). Among them, the spatial Dubin model is a general form of spatial lag model and spatial error model, thus it possesses both advantages of spatial autocorrelation and spatial interaction effects. This article examines the effect of each explanatory variable on the environmental efficiency of grain production and the spatial spillover. The basic model is as follows:
where Yit denotes the environmental efficiency of grain production in region i in year t; W is a spatial weight matrix of order N × N; WijYjt denotes the interaction effect of Yjt on Yit in regions adjacent to i; Xit denotes each explanatory variable, i.e. factors affecting the environmental efficiency of grain production, in region i in year t; WijXjt denotes the interaction effect of Xjt on Xit in regions adjacent to i; β is the explanatory elasticity coefficient of the variable; θ is the elasticity coefficient of the spatially lagged term of the explanatory variable; μi denotes individual fixed effects; ϕt denotes time fixed effects; and ɛit is a random error term. To ensure the robustness of the research conclusions, this paper also includes the spacial contiguity weights matrix (Wl), distance-based spatial weight matrix (Wg) and economic distance spatial weights matrix (We) in the research framework.
3.2 Index Selection
3.2.1 Definition of Input Variables
In this paper, land, irrigation, fertiliser, pesticide, agricultural film and agricultural machinery inputs are selected as input variables for grain production. Among them, the land input is expressed by the area planted with grain1; the irrigation input is expressed by the effective irrigated area of each province; the labor input is expressed by the number of grain laborers in each province; the fertilizer input is expressed by the annual amount of chemical fertilizer used by each province (including nitrogen, phosphate, potash, and compound fertilizers); pesticide input is expressed by the annual total pesticide input of each province; agricultural film input is expressed by the total agricultural film input of each province which is obtained by adding plastic film and film; and the input of agricultural machinery is expressed by the total power of agricultural machinery in each province.
3.2.2 Definition of Output Variables
1) The desirable output of grain production mainly includes grain production output and grain ecological output, with the grain production output being expressed by the total grain output of each province and the grain ecological output being expressed by the grain carbon sinks in each province, that is, the amount of grain carbon absorbed by photosynthesis of grain crops2. Its calculation formula can be expressed as:
where C is the carbon sum of grain crops; Ci is the carbon sink of a certain grain crop; K is the number of grain crops; ci is the amount of carbon that can be absorbed by photosynthesis; Yi is the yield; r is the water content, and HIi is the economic coefficient of grain crops.
2) Undesired output of grain production includes carbon emissions and non-point source pollution.
① Carbon emissions from grain production. According to the actual production of grain crops, this paper mainly calculates the carbon emissions from grain production in term of both agricultural materials and soil: the former is the carbon emissions from agricultural materials input. The carbon emissions of agricultural materials are mainly from directly or indirectly the input of agricultural materials such as fertilizers, pesticides, and agricultural films, and the electricity consumption of irrigation activities. The latter is N2O emissions from the soil. In the process of planting grain crops, the damage of N2O to the soil surface can easily lead to the emission of large amounts of greenhouse gases. It should be noted that, in order to facilitate analysis, when carbon emissions are being calculated, the standard carbon equivalent is replaced uniformly3. The formula for calculating the total carbon emissions from grain production is as follows:
where E is the total carbon emission from grain production; Ei is the carbon emission of various carbon sources; Ti is the amount of each carbon emission source; and δi is the carbon emission coefficient of each carbon emission source.
② Grain non-point source pollution. Grain non-point source pollution is represented by a comprehensive index of the loss of fertilizer nitrogen, the loss of fertilizer phosphorus, the amount of ineffective use of pesticides, and the residual amount of agricultural film. Among them, chemical fertilizer nitrogen loss is estimated by multiplying nitrogen loss coefficient by the sum of compound fertilizer nitrogen content and nitrogen fertilizer usage; chemical fertilizer phosphorus loss is estimated by multiplying the sum of compound fertilizer phosphorus content and phosphate fertilizer usage by phosphorus loss coefficient; the amount of ineffective use of pesticides is reversely estimated by subtracting the amount of effective use of pesticides; the residual amount of agricultural film is estimated by multiplying the amount of agricultural film used by the residue coefficient.
In addition, in order to further explore the spatial spillover effect of the environmental efficiency of grain production, this paper selects the environmental efficiency of grain production as the core explanatory variable, and the level of education, the level of financial support for agriculture, the loss of agricultural labor, the governance of the ecological environment, the level of urbanization, and the rate of disaster as the explanatory variables. Among them, the level of education (EDU) is expressed by the average years of education received by rural residents; the level of financial support for agriculture (FS) is expressed by the proportion of local financial expenditure on agriculture, forestry and water affairs in the overall budget of local finance; the loss of agricultural labor force (ALT) is expressed by the proportion of the labor force engaged in the primary sector in the total labor force engaged in the three major industries; the ecological environment control (EPC) is expressed by the proportion of environmental pollution control investment in GDP; the urbanization level (UR) is expressed by the ratio of the urban population to the permanent population; the disaster rate (DR) is expressed by the proportion of the area affected by the crops in the total sown area of crops. The descriptive statistics of each variable are shown in Table 1.
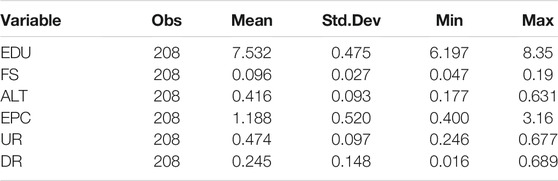
TABLE 1. Descriptive analysis results.
3.3 Data Sources
The input-output indicator data of this study is mainly derived from the “China Statistical Yearbook”, “China Grain Yearbook”, “China Rural Statistical Yearbook”, and have been compiled to compose panel data of 13 provinces in the major grain production areas from 2004 to 2019. Considering the limitations of the statistical data in the statistical yearbooks, this study constructs a weight coefficient to separate the agricultural input elements to obtain more accurate input data for grain production (Coelli et al., 2003). In addition, to control the quantity of input-output indicators, this study uses the entropy method to integrate the four types of indicators of grain non-point source pollution accounting into one pollution index.
4 Empirical Results and Analysis
4.1 Measures of Environmental Efficiency in Grain Production and Sources of Inefficiency
4.1.1 Comparative Analysis of Efficiency of Grain Production With Different Treatment Methods
To reveal the influence of environmental factors on the efficiency of grain production, and comprehensively reflect the actual performance of the grain production environment efficiency in the major grain production areas, three different treatments was adopted to measure the efficiency value.
1) The first treatment method is the grain production efficiency taking no account of environmental factors;
2) The second is the grain production efficiency taking account of the only pollution factors of grain production environment;
3) The third is to simultaneously consider take account of both the grain production efficiency of grain ecological output and environmental pollution factors of grain production (hereinafter the environmental efficiency of grain production).
The three treatment methods are mainly used for the comparative analysis of the environmental efficiency of grain production. This study analyzes the environmental production efficiency of grain production in major grain production areas while considering the pollution factors of grain production environment and the ecological output of grain production. The MAXDEA5.0 software was used to measure the grain production efficiency of major grain production areas from 2004 to 2019 adopting the three treatment methods respectively, and to draw its annual trend chart (Figure 1).
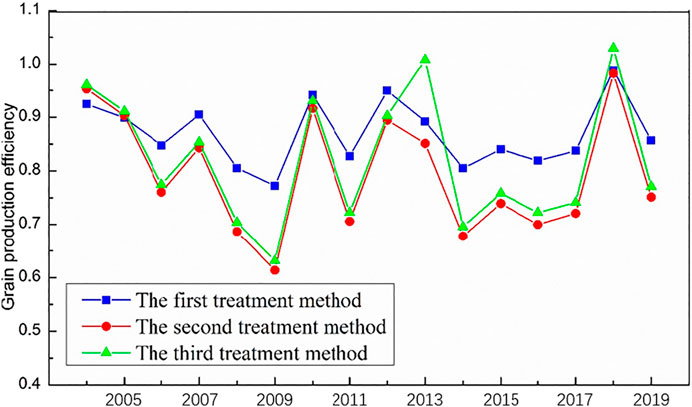
FIGURE 1. Comparative analysis and trend of grain production efficiency in major grain production areas from 2004 to 2019.
As shown in Figure 1, the trends of the development stages are similar while adopting three different treatments. Except for 2004 and 2013, the grain production efficiency values taking no account of environmental factors were significantly higher than that in the other two treatments. The result indicated that the environmental factors impact the efficiency of grain production. This difference reflects both the degree of environmental pollution caused by the current mode of grain production, and to some extent reflects the magnitude of the environmental reaction to grain production and the cost of environmental governance. The greater the difference between them, the weaker the sustainability of grain production. Therefore, it is easy to misjudge the actual development capacity of grain production by measuring the efficiency of grain production without considering environmental pollution factors. This is likely to lead to misjudgment by policy makers. Grain production efficiency taking account of only environmental pollution factors is slightly lower than that of grain production environment. This may be due to the fact that the environmental efficiency of grain production considering ecological output is more approximate to the realistic situation of grain production. However, the positive externality of grain production is neglected when only considering environmental pollution is being considered. This will underestimate China’s grain production efficiency. Therefore, the introduction of grain ecological output factors has a certain corrective effect on grain production efficiency, which helps us to understand the actual performance of grain production efficiency in each province.
4.1.2 Analysis of Time Series Evolution Characteristics
From 2004 to 2019, the average environmental efficiency of grain production was 0.820 (Figure 1). This result indicates that if the current input and output levels are maintained while eliminating efficiency losses, the efficiency value can be increased by 18%. It also shows that resource consumption and environmental pollution have caused greater efficiency losses in China’s grain production process. China’s grain production, which has not achieved coordinated development with the resources and the environment. At the same time, it shows that there is still much room for improvement in terms of China’s grain production methods. To achieve sustainable development of the grain industry, more efforts are needed.
Based on the trend of the mean change in the efficiency of grain production environment, the overall environmental efficiency of China’s grain production fluctuated with a downward trend, from 0.961 in 2004 to 0.771 in 2019, and experienced three stages. Efficiency value witnessed a volatile period of decline from 2004 to 2009, with the environmental efficiency of grain production decreasing from 0.961 to 0.631 and hitting the bottom in 2009. Meanwhile, environmental efficiency increased in 2007, which might be due to the positive impact of the grain production subsidy policy and the agricultural tax pilot reform that was launched at that time in China. This policy has greatly stimulated the enthusiasm of farmers for production. However, there was a downward trend, indicating that the improvement of grain production efficiency in 2007 was only temporary, and the agricultural tax pilot reform had only temporarily promoted the improvement of production efficiency. There was a M-shaped turn, during which time, the efficiency value increased from 0.631 to 0.695 yet the average efficiency hitting a bottom in 2011 and 2014 due to a lack of production factors. The environmental efficiency in grain production peaked in 2010 and 2013, with efficiency values reaching 0.931 and 1.008, respectively. This was due to the promulgation of the agricultural tax exemption policy, which had increased the enthusiasm of farmers for growing grain. Therefore, the environmental efficiency value has been greatly improved in 2010 and natural disasters may be the main cause of the decline in environmental efficiency. In 2014, with the improvement of the technology and the expansion of the planting scale, the environmental efficiency value increased and reached a peak. From 2015 to 2019, another period of fluctuation, it increased from 0.758 to 0.771, and peaked in 2015. However, as shown in Figure 1, the efficiency value dropped sharply in 2019. The possible reason is that the floods and locust outbreaks in 2019 caused drop in grain production. At the same time, the structural reform of the agricultural supply side has changed the model of grain production from being previously “production-oriented” to “quality and benefit-oriented.” This might have resulted in a reduction in the area of grain in the year and a significant decline in grain production in 2019 compared to 2018.
4.1.3 Spatial Distribution Characteristics
According to the results of the environmental efficiency of grain production in China’s major grain production areas from 2004 to 2019, the natural breaks were used to divide the average efficiency into four grades (Figure 2). For the spatial distribution characteristics of the environmental efficiency, the deeper the color, the higher the environmental efficiency.
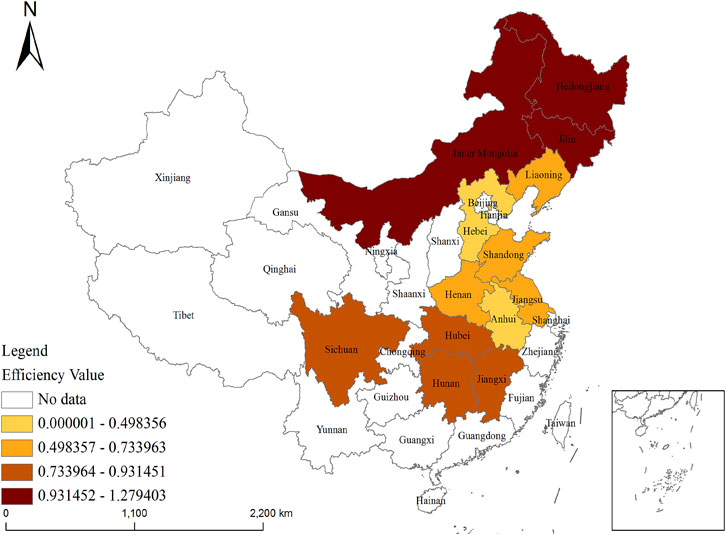
FIGURE 2. Environmental efficiency of grain production in 13 provinces in China’s major grain production areas.
As shown in Figure 2, the environmental efficiency of grain production in provinces of Jilin, Inner Mongolia, and Heilongjiang is highest. The abundant land resources and large-scale operation are important reasons for the high efficiency of the grain production environment in this region. The environmental efficiency values of provinces of Sichuan, Jiangxi, Hubei, Hunan are merely above the average. These provinces have good ecological resources and grain production activities there are supported by more reliable resource elements. However, carbon emissions in the grain production process are high, and reducing carbon emissions is the focus of these provinces to improve the efficiency of the grain production environment. The environmental efficiency levels in provinces of Liaoning, Shandong, Jiangsu, Henan, Hebei, and Anhui are relatively low. Among them, Hebei and Anhui have the lowest environmental efficiency. Most of these provinces are areas where agricultural machinery and fertilizers, pesticides, and agricultural film inputs are high. These regions have achieved higher grain output depending thanks to the high input of production factors, but they cannot achieve the highest levels of environmental efficiency given the environmental pollution, which makes it difficult for grain production to develop sustainably.
4.1.4 Breakdown of Sources of Inefficiency and Directions for Improvement
Table 2 and Table 3 report the decomposition and improvement directions of inefficient sources of grain production environment in each province of the main grain production areas. It shows that the environmental efficiency values of the three provinces of Inner Mongolia, Jilin and Heilongjiang are greater than 1, and the DEA is effective without efficiency improvement.

TABLE 2. Input redundancy rates for environmental efficiency in grain production.
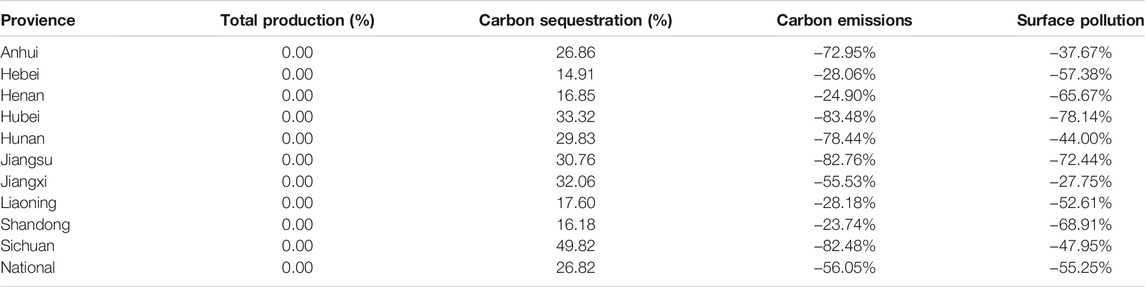
TABLE 3. Output redundancy rates for environmental efficiency in grain production.
From the perspective of the production process, the total grain output of each province, has zero redundancy, yet the input factors and other output variables have certain redundancy. This indicates that China’s environmental efficiency loss is not resulted from insufficient grain production, but mainly the following two aspects: production factor input and undesired output. Excessive consumption of input elements and excessive emission of environmental pollutants are the main reasons for the low environmental efficiency of China’s grain production at this stage.
From a national perspective, the main influential factors of the environmental efficiency loss of grain production in major grain production areas are carbon emissions, non-point source pollution of grain production, and labor input in order. Among them, carbon emissions account for the highest proportion of the environmental efficiency loss of China’s grain production. This shows the excessive carbon emissions in China’s grain production process are excessive. This may be due to the input of large amount of high-carbon production materials such as pesticides, fertilizers, and agricultural machinery in China’s grain production process currently. It leads to a continuous increase in carbon emissions from grain production and energy. Thus, China’s grain production is facing tremendous pressure to reduce carbon emissions. Non-point source pollution in the process of grain production is the second most influential factor in the loss of environmental efficiency of grain production. This shows that China’s grain production has serious non-point source pollution. The consumption of pesticides throughout the country is increasing at a rate of 10% each year. Problems such as excessive pesticide residues and water and soil pollution are very prominent. As China has a large amount of surplus labor in rural areas, labor input is the third most influential factor in the loss of environmental efficiency of grain production. However, it is worth noting that although China’s main grain production areas have a relatively high redundancy rate of labor for growing grain, the human capital stock is low, and the aging problem is prominent. The aging rate has been higher than the national average in the past 11 years, and the gap is widening.
From an inter-provincial perspective, the reasons for the loss of environmental efficiency of grain production vary from province to province. The main influential factor of the environmental efficiency loss of grain production in Anhui, Sichuan, Hubei, Hunan, Jiangsu, Jiangxi and other provinces is carbon emission, which shows that these provinces have not effectively controlled carbon emissions and there is huge room for improvement. The main influential factor of the environmental efficiency loss of grain production in provinces of Liaoning and Shandong is the input of agricultural film, which shows that there is still a large redundancy in the use of agricultural film in the two provinces. The input of machinery in Hebei has a greater impact on the environmental efficiency loss of grain production in the region. This may be due to the implementation of agricultural machinery subsidy policies such as agricultural machinery purchase subsidies. The province’s machinery ownership has increased year by year, resulting in machinery redundancy and declining efficiency. The main influential factor for the loss of environmental efficiency in Henan province is non-point source pollution, which might be resulted from lack of scientific protective development, and necessary agricultural technology expertise among farmers, and could lead to improper fertilization and drug use, and even serious non-point source pollution.
4.2 Analysis of Spatial Spillovers and Impact Factors for Environmental Efficiency of Grain Production
4.2.1 Spatial Correlation Analysis
(1) Global Spatial Autocorrelation Analysis
Using Geoda software based on Queen’s first-order spatial weight matrix, Monte Carlo simulation 999 tests were used to calculate the global Moran’s I, Z-statistic test value, and significance level of grain production environmental efficiency in China’s major grain production areas. The test results are reported in Table 4.
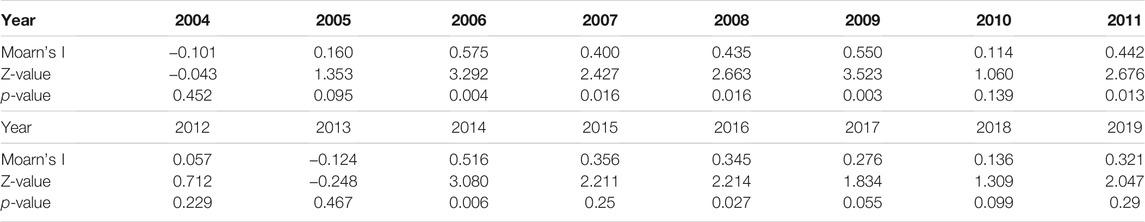
TABLE 4. The Moran’s I of China’s grain production environmental efficiency between 2004 and 2019.
From Table 4, we can observe that the environmental efficiency of grain production in China’s major grain production areas in 2004 and 2013 was negative and did not pass the significance test. This indicates that the correlation between environmental efficiency level and adjacent areas is low. It also presents a random distribution state. Moran’s I for 2005, 2010, 2012, and 2018 were positive and of small magnitude, and none of them passed the significance test, indicating that environmental efficiency was spatially randomized over the 4 years. Moran’s I was positive in 2006–2009, 2014–2017, 2011 and 2019, and showed significant positive spatial correlation according to the 5% significance test, meaning that there was spatial dependence. This demonstrates that the spatial distribution of grain production environmental efficiency levels shows obvious cluster characteristics.
(2) Local Spatial Autocorrelation Analysis
Local spatial autocorrelation analysis can make up for the shortcomings of global spatial autocorrelation that cannot clearly give spatially clustered locations with similar attribute regions. Moran’s I scatter plot and a LISA spatial agglomeration map can be used to evaluate the heterogeneity of environmental efficiency in different regions in the spatial range. To reflect the spatial differentiation characteristics of 13 provinces in China’s major grain production areas, Moran’s I scatter plots for 2004, 2009, 2014 and 2019 were drawn using GeoDa software, based on the environmental efficiency values obtained above. Moran’s I scatter plot distributes the environmental efficiency values of the aforementioned provinces in four quadrants, reflecting the spatial correlation between provinces and their neighboring provinces. The first quadrant is high-high value cluster (H-H), the second low-high value cluster (L-H), the third low-low value cluster (L-L), and the fourth high-low value cluster (H-L). Figure 3 shows Moran’s I scatter plots for grain production environmental efficiency in 2004, 2009, 2014, and 2019. The number of provinces in H-H clusters and L-L clusters were 5, 13, 12, and eight in 2004, 2009, 2014, and 2019, respectively. Numbers increased rapidly and then gradually decreased, indicating that the environmental production efficiency of grain production H-H clusters and L-L clusters increased first and then went down. The concentration of L-H clusters fluctuated, and H-L clusters fell first and then gradually increased. By comparison, we found:
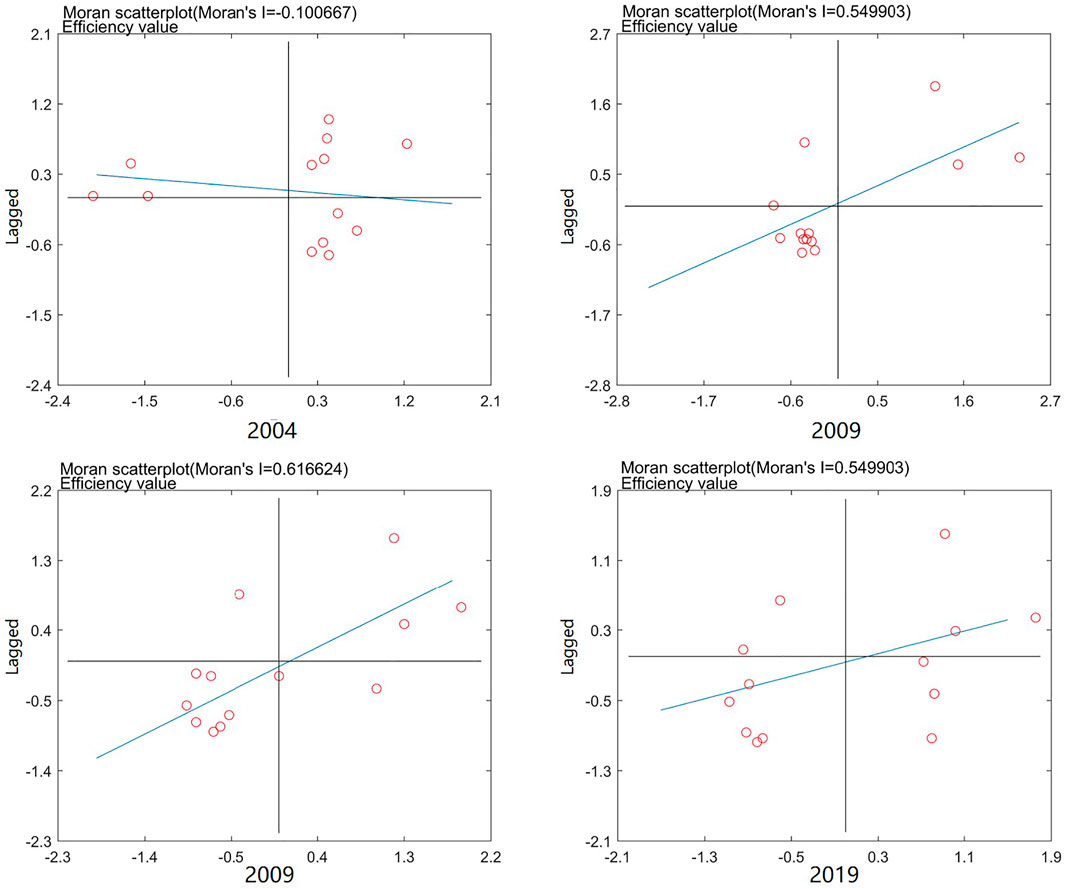
FIGURE 3. Moran’s I scatter plot of environmental efficiency of grain production in 2004, 2009, 2014 and 2019.
① H-H clusters were identified in Heilongjiang, Jilin, and Inner Mongolia. The reason is that all three provinces are in the northeast of China. These provinces have good resource endowment, few natural disasters such as floods and pests, and are sparsely populated, which is conducive to the large-scale mechanization of grain production. Therefore, the environmental efficiency of these areas is relatively high, which has a diffusion effect on the surrounding areas.
② L-H clusters were identified in Anhui, Liaoning, Hebei, Hubei, and other areas adjacent to the H-H clusters. The possible reason is that Liaoning Province is adjacent to Inner Mongolia and Jilin, which has a positive impact on production technology, environmental protection investment, and environmental protection policies. Anhui and Hebei are in L-L clusters and L-H clusters, respectively. Their efficiency value fluctuate significantly, which may be resulted from the fact that the selection of grain production modes in the two areas is influenced by their neighboring provinces.
③ L-L clusters account for a high proportion in the major grain production areas, and Anhui, Shandong, Henan, and Jiangsu are in this cluster area in 2009, 2014, and 2019. The provinces of the cluster area have a certain downward trend from 2014 to 2019, which may be due to the positive radiation effects of the provinces, especially from those with high efficiency in grain production.
④ The distribution of H-L clusters is relatively scattered, covering seven regions in the initial stage of research to four regions at the end of the study. Among them, Hunan, Jiangxi, and Sichuan changed from L-L clusters in 2009 and 2014 to H-L clusters in 2019. This may be because the three provinces increased their investment in grain production technology and environmental management throughout the study period, reducing carbon emissions and non-point source pollution in grain production, thereby improving the environmental efficiency of grain production. However, the surrounding environment with relatively low environmental efficiency has a good geographical advantage. In the future, due to the spillover of policies, technologies, and factors in high-efficiency areas, the efficiency of the grain environment will be greatly improved.
The Moran’s I scatter plot reflects the spatial dependence and heterogeneity of the provinces in the major grain production areas. However, the salient status of each province is not given. Therefore, this study draws a LISA spatial cluster map (Figure 4)to reflect the degree of correlation between the provinces and the environmental efficiency of their neighboring provinces.
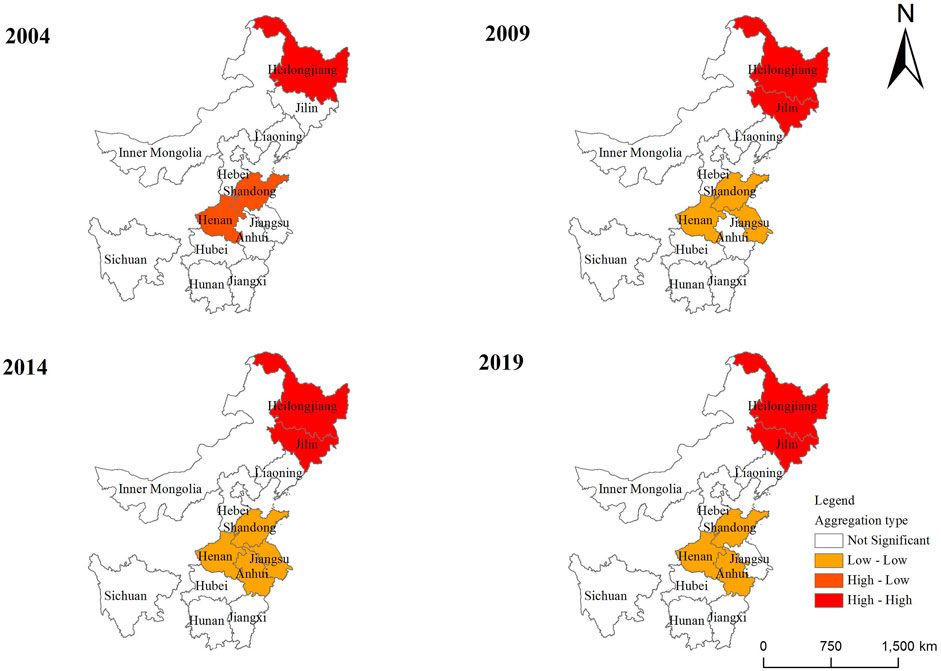
FIGURE 4. LISA clusters map of China’s grain production environmental efficiency in 2004, 2009, 2014 and 2019.
According to the analysis results of the LISA aggregation map, 13 provinces in the major grain-production areas did not pass the significance test in 4 years. However, the spatial agglomeration of grain production environmental efficiency in various provinces in the region is becoming increasingly obvious, and more provinces are showing significant relationships. The transformation of spatial cluster type in some provinces may be directly related to the environmental efficiency of grain production in each province in the same year. In this study, Heilongjiang Province was always in the H-H clusters, while Jilin Province, which was not insignificant in 2004, was in the H-H clusters in other years. It indicates that the two provinces have good resource endowment, advanced technology, proper environmental protection measures, high environmental efficiency and environmental efficiency in surrounding provinces, and high concentration of resources and technology. Moreover, it has played a leading role in the surrounding areas and has a strong positive radiation effect. Shandong and Henan provinces were in H-L clusters in 2004, but converted to L-L clusters in 2009, 2014, and 2019. This indicates that the two provinces had higher levels of efficiency during the initial study period, but were later assimilated by the lower environmental efficiency levels of neighboring provinces and were in L-L clusters. Jiangsu and Anhui provinces have been in L-L clusters during the study period. This indicates that the environmental efficiency of the two provinces and the environmental efficiency of the surrounding areas were very low, and there was no timely response to the ecological development of China’s grain production.
4.2.2 Regression Analysis of Spatial Durbin Model
Through spatial autocorrelation analysis, it is found that there is a certain spatial correlation among China’s grain production environment in terms of the efficiency. In order to further explore the spatial effect and influential factors for that case, the study uses MATLAB R2015b to estimate the spatial econometric model from the perspective of robustness. The study has also used three different spatial weight matrices to estimate the model. The regression results are shown in Table 5. After the comparison of the estimation results under the application of three spatial weight matrices, it is found that the signs and significance test results of each variable are consistent, indicating that the regression results are robust enough. The R2 of the model under spatial weight matrices are 0.782, 0.714, and 0.770, respectively, indicating that the model has a convincing explanatory. In the specific coefficient analysis below, this article will analyze the regression results of spatial contiguity weights matrix case that has the highest degree of fit.
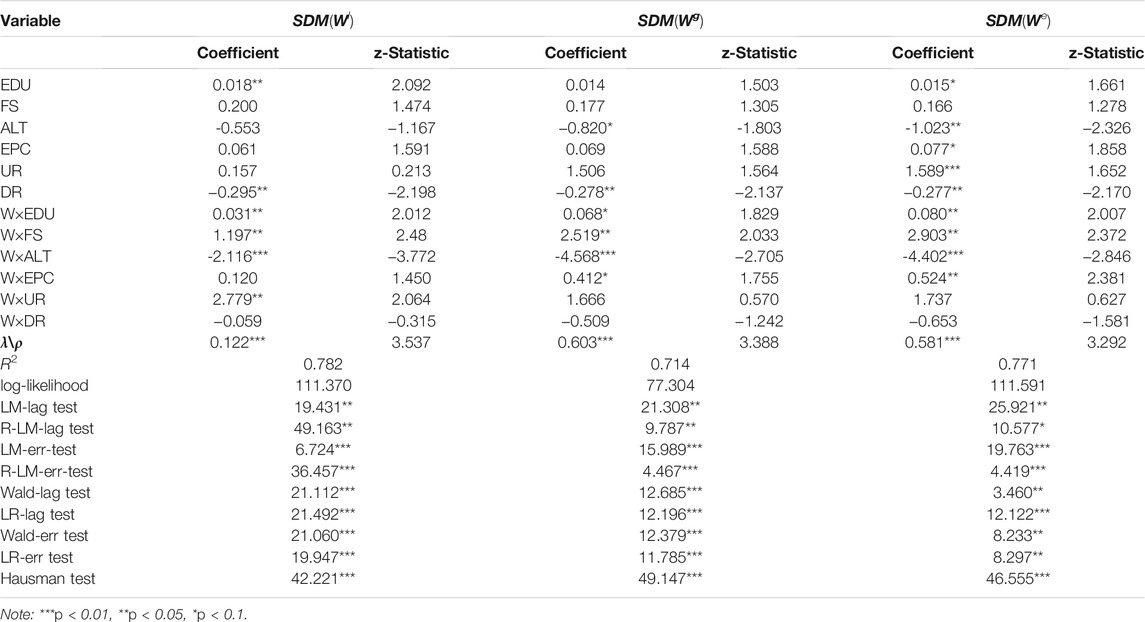
TABLE 5. Estimation results of SDM.
Before estimating the space spillover effect (robust) LM test should be used to select the models between space lag or space error. The results are shown in Table 5. The test value of LM-err is 6.724, which is significant at the 1% level; the R-LM-err value is 36.457, which is significant at the 1% level; the LM-lag value is 19.431, which indicates that the 5% significance test is passed; the value of R-LM-lag is 49.163, which also satisfies the 5% significance level test. Therefore, it can be concluded that the spatial error model is more applicable than the spatial lag model. The Hausman test results show that the statistic passes the chi-square test at a 1% significance level, so a fixed-effect model is more reasonable to apply. The statistics of Wald test and LR test are both significant at the level of 1%, indicating that the spatial Durbin model cannot be simplified to the SAR model or the SEM model. The ρ value is 0.122, and it is significant at the level of 1%, which once again proves that there is a significant spatial correlation of the environmental efficiency of grain production. This correlation effect is more obvious under the geographical weight, which means that the geographical distribution of environmental efficiency of grain production exerts an aggregation effect.
This paper breaks down the effects of various influential factors on the environmental efficiency of grain production to calculate the direct and indirect effects. The results are shown in Table 6. Among them, the direct effect, indirect effect and total effect of education level all show significant positive effects. It indicates that the improvement of farmers’ education level can not only improve the environmental efficiency of grain production in the region, but also increase the environmental efficiency of grain production in other regions through spatial spillover effects. This may be because the improvement of education level means the improvement of the quality of farmers. In the process of grain production, they tend to choose more ecologically and environmentally friendly production methods, reduce grain production pollution, and improve grain production environmental efficiency. The direct effect, indirect effect and total effect of the level of fiscal support to agriculture all show significant positive effects. This shows that financial support for agriculture can not only improve the environmental efficiency of grain production in the region, but also effectively promote the environmental efficiency of grain production in the neighboring areas. The direct effect of labor transfer is significantly negative, but the indirect effect presents a more significant positive effect. It indicates that the transfer of rural labor is not conducive to the improvement of the environmental efficiency of grain production in the region, but it is conducive to improving the environmental efficiency of grain production in the neighboring areas. The indirect spillover effect is greater than the direct spillover effect in the region.
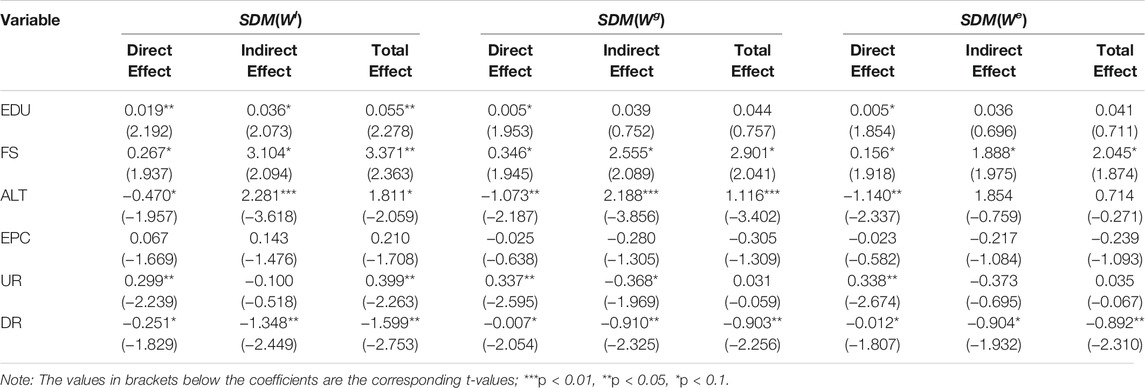
TABLE 6. Spatial spillover effect of environmental efficiency of Grain Production.
The direct effect, indirect effect and total effect of ecological environment governance are negative but not significant, indicating that the current ecological environment governance has an insignificant effect on improving the environmental efficiency of grain production. This may be because the current investment in environmental governance is mainly concentrated in industry, while the investment in agricultural production environmental governance is relatively low. Therefore, the effect of improving the environmental efficiency of grain production is not obvious. The direct and total effects of the urbanization level are both significantly positive, and the indirect effects are negative but not significant. This shows that the increase in the urbanization rate has effectively promoted the growth of the local grain production environment efficiency, but the spillover effect on the surrounding areas is not obvious. This may be because the development of urbanization has created many favorable conditions for improving the environmental efficiency of grain production by promoting the advancement of agricultural science and technology, accelerating the development of modern agriculture, and attracting and promoting capital investment in agriculture. The direct effect, indirect effect and total effect of the disaster rate all show significant negative effects. It means that an increase in the disaster rate will reduce grain production, which is not conducive to the improvement of the environmental efficiency of grain production. At the same time, the farmland of neighboring provinces is often connected. When the grain production in one region suffers from natural disasters, grain production in neighboring regions will be affected to a certain extent.
5 Conclusion
This paper incorporates the environmental factors in the grain production process into the grain production efficiency evaluation system and employs the undesired global super-efficiency SBM model to calculate and analyze the temporal and spatial characteristics of grain production environmental efficiency, sources of inefficiency, and spatial spillover in major grain production areas from 2004 to 2019. The main conclusions are as follows:
1) Except for 2004 and 2013, the grain production efficiency values that take no account of environmental factors (environmental pollution and grain carbon sinks) were significantly higher than those that take environmental factors into consideration. There was a certain corrective effect on the efficiency of grain production in China.
2) From 2004 to 2019, the average environmental efficiency of grain production in China’s main grain production areas was 0.820, showing generally fluctuations with a downward trend, and the level of development was generally low. The main influential factors of the environmental efficiency loss of grain production in major grain production areas were carbon emissions, non-point source pollution of grain production, and labor input. In provinces with inefficient grain production environments, there were widespread problems of redundant element inputs and serious environmental pollution in grain production.
3) The environmental efficiency of grain production in various provinces shows more and more obvious spatial differentiation characteristics in spatial distribution. Liaoning, Shandong, Jiangsu, Henan, Hebei, Anhui and other provinces have low levels of grain environmental efficiency and suffer serious environmental efficiency losses. In addition, the environmental efficiency level of grain production shows obvious cluster characteristics. Among them, the Northeast region and the Huang-Huai-Hai region shows high-high aggregation and low-low aggregation respectively.
4) The environmental efficiency of grain production has a significant positive spillover effect. In terms of direct effects, the level of education, the level of financial support for agriculture, and the rate of urbanization all have positive effects on the environmental efficiency of grain production in the region. On the contrary, the transfer of labor and the rate of disasters have a significant negative impact. From the perspective of spillover effects, the level of education, the level of financial support for agriculture, and the transfer of labor are all conducive to the improvement of the environmental efficiency of grain production in the neighboring areas, while the disaster rate has a negative impact on the environmental efficiency of grain production in the neighboring areas.
Based on the above conclusions, the following suggestions for improving the environmental efficiency of grain production are proposed:
1) In view of the overall low environmental efficiency of grain production in China, there is still large room for improvement in the prevention and control of pollution and the discovery of ecological value in the process of grain production. In order to maintain the sustainable development of grain production, it is necessary to actively promote the reduction of chemical fertilizers and pesticides, control the carbon emissions of grain planting, highlight the ecological function of grain planting, and take the path of coordinated development of resources, environment and grain production while ensuring grain production.
2) In the process of grain production, the natural and resource endowment of the local area must be fully considered. The emphasis should be laid on supporting provinces where the environmental efficiency of grain production is lower than that of the surrounding areas. The decline in the sustainability of grain production caused by low efficiency and serious ecological damage should be addressed.
3) The scope and intensity of the positive spillover including education level, financial support for agriculture, labor transfer should be expanded and deepened, while the negative spillover effects of grain disasters deserve equal attention. The relevant policies, measures and technologies of green grain production in neighboring areas should also be highlighted. A multilateral or bilateral regular exchange mechanism can be established to strengthen the exchange of technology and policy experience among the provinces of the main grain production areas and guide the proper flow, transfer and communication of policy experience, technology, talent and other elements.
Data Availability Statement
The original contributions presented in the study are included in the article/Supplementary Material, further inquiries can be directed to the corresponding author.
Author Contributions
All authors contributed to the study conception and design. Material preparation, data collection and analysis were performed by HX, BM, and QG. The first draft of the manuscript was written by HX and all authors commented on previous versions of the manuscript. All authors read and approved the final manuscript.
Funding
This study was supported in part by grants from the Ministry of education of Humanities and Social Science project (Grant No. 21YJC790149), Qingdao social science planning and research project in 2021 (QDSKL2101031), Social Science Planning Research Project of Shandong “Research on the Stagnation and Breakthrough Path of Relative Poverty Management in Shandong Province after 2020” (Grant No. 20CDCJ21), “The key project of plan in research and development of Shandong “Research on the protection and utilization of marine fishery germplasm resources in Shandong Province” (Grant No. 2020RZE29007), The Natural Science Foundation of Shandong “Research on the Long-term Path of Poverty Alleviation in Agricultural Industry from the Perspective of High-Quality De velopment” (Grant No. ZR2020QG045), The Fundamental Research Funds for the Central Universities (Grant No.202013011), The China Postdoctoral Science Foundation (Grant No. 2019M652486).
Conflict of Interest
The authors declare that the research was conducted in the absence of any commercial or financial relationships that could be construed as a potential conflict of interest.
Publisher’s Note
All claims expressed in this article are solely those of the authors and do not necessarily represent those of their affiliated organizations, or those of the publisher, the editors, and the reviewers. Any product that may be evaluated in this article, or claim that may be made by its manufacturer, is not guaranteed or endorsed by the publisher.
Footnotes
1Due to data availability limitations in the food carbon sequestration rate measurement section, the food sown area in this paper is mainly obtained by summing the area of four crops: rice, wheat, maize, beans and potatoes.
2Due to the availability of data, the calculation of grain carbon sinks in the current study only considers the carbon uptake during the entire life cycle of major grain crops.
3According to the IPCC Fourth Assessment Report (2007), 1 ton of CO2 contains 0.272 tons of C; the greenhouse effect caused by 1 ton of CH4 is equivalent to the greenhouse effect of 25 tons of CO2 (about 6.818 tons C); The greenhouse effect caused by tons of N2O is equivalent to the greenhouse effect of 298 tons of CO2 (about 81.272 tons of C).
References
Armagan, G., Ozden, A., and Bekcioglu, S. (2010). Efficiency and Total Factor Productivity of Crop Production at Nuts1 Level in turkey: Malmquist index Approach. Qual. Quant 44, 573–581. doi:10.1007/s11135-008-9216-5
Bai, X., Salim, R., and Bloch, H. (2019). Environmental Efficiency of Apple Production in china: A Translog Stochastic Frontier Analysis. Agric. Resour. Econom. Rev. 48, 199–220. doi:10.1017/age.2018.25
Battese, G. E., and Coelli, T. J. (1995). A Model for Technical Inefficiency Effects in a Stochastic Frontier Production Function for Panel Data. Empirical Econ. 20, 325–332. doi:10.1007/bf01205442
Benedetti, I., Branca, G., and Zucaro, R. (2019). Evaluating Input Use Efficiency in Agriculture through a Stochastic Frontier Production: An Application on a Case Study in Apulia (italy). J. Clean. Prod. 236, 117609. doi:10.1016/j.jclepro.2019.117609
Cao, X., Liu, Y., Li, T., and Liao, W. (2019). Analysis of Spatial Pattern Evolution and Influencing Factors of Regional Land Use Efficiency in china Based on Esda-Gwr. Scientific Rep. 9, 1–11. doi:10.1038/s41598-018-36368-2
Coelli, T., Rahman, S., and Thirtle, C. (2003). A Stochastic Frontier Approach to Total Factor Productivity Measurement in Bangladesh Crop Agriculture, 1961-92. J. Int. Dev. 15, 321–333. doi:10.1002/jid.975
Cooper, W. W., Seiford, L. M., and Tone, K. (2007). A Comprehensive Text with Models, Applications, References and Dea Solver Software. Data Envelopment Anal.
Dolgikh, Y. (2019). Evaluation and Analysis of Dynamics of Change of Efficiency of Grain Production in ukraine by Dea Method. Agric. Res. Econ. 5 (3), 47–62.
Gebregziabher, G., Namara, R. E., and Holden, S. (2012). Technical Efficiency of Irrigated and Rain-Fed Smallholder Agriculture in Tigray, ethiopia: A Comparative Stochastic Frontier Production Function Analysis. Q. J. Int. Agric. 51, 203–226.
Kumbhakar, S. C., Lien, G., and Hardaker, J. B. (2014). Technical Efficiency in Competing Panel Data Models: a Study of Norwegian Grain Farming. J. Prod. Anal. 41, 321–337. doi:10.1007/s11123-012-0303-1
Liao, X., and Shi, X. (2018). Public Appeal, Environmental Regulation and green Investment: Evidence from china. Energy Policy 119, 554–562. doi:10.1016/j.enpol.2018.05.020
Liu, Y., Zou, L., and Wang, Y. (2020). Spatial-temporal Characteristics and Influencing Factors of Agricultural Eco-Efficiency in china in Recent 40 Years. Land Use Policy 97, 104794. doi:10.1016/j.landusepol.2020.104794
Maxime, D., Marcotte, M., and Arcand, Y. (2006). Development of Eco-Efficiency Indicators for the canadian Food and Beverage Industry. J. Clean. Prod. 14, 636–648. doi:10.1016/j.jclepro.2005.07.015
Pang, J., Chen, X., Zhang, Z., and Li, H. (2016). Measuring Eco-Efficiency of Agriculture in china. Sustainability 8, 398. doi:10.3390/su8040398
Pastor, J. T., and Lovell, C. A. K. (2005). A Global Malmquist Productivity index. Econ. Lett. 88, 266–271. doi:10.1016/j.econlet.2005.02.013
Picazo-Tadeo, A. J., Gómez-Limón, J. A., and Reig-Martínez, E. (2011). Assessing Farming Eco-Efficiency: a Data Envelopment Analysis Approach. J. Environ. Manag. 92, 1154–1164. doi:10.1016/j.jenvman.2010.11.025
Pishgar-Komleh, S. H., Zylowski, T., Rozakis, S., and Kozyra, J. (2020). Efficiency under Different Methods for Incorporating Undesirable Outputs in an LCA+DEA Framework: A Case Study of winter Wheat Production in Poland. J. Environ. Manag. 260, 110138. doi:10.1016/j.jenvman.2020.110138
Sachdeva, J., Sharma, J., and Chahal, S. (2011). Technical Efficiency in Crop Production and Dairy Farming in punjab: A Zone-wise Analysis1. Productivity 52, 177. doi:10.3109/10428194.2011.574756
Shi, X., Yu, J., and Cheong, T. S. (2020). Convergence and Distribution Dynamics of Energy Consumption Among China's Households. Energy Policy 142, 111496. doi:10.1016/j.enpol.2020.111496
Springmann, M., Clark, M., Mason-D’Croz, D., Wiebe, K., Bodirsky, B. L., Lassaletta, L., et al. (2018). Options for Keeping the Food System within Environmental Limits. Nature 562, 519–525. doi:10.1038/s41586-018-0594-0
Sun, H., Edziah, B. K., Kporsu, A. K., Sarkodie, S. A., and Taghizadeh-Hesary, F. (2021a). Energy Efficiency: The Role of Technological Innovation and Knowledge Spillover. Technol. Forecast. Soc. Change 167, 120659. doi:10.1016/j.techfore.2021.120659
Sun, H., Edziah, B. K., Sun, C., and Kporsu, A. K. (2021b). Institutional Quality and its Spatial Spillover Effects on Energy Efficiency. Socio-Economic Plann. Sci., 101023. doi:10.1016/j.seps.2021.101023
Vlontzos, G., Niavis, S., and Manos, B. (2014). A Dea Approach for Estimating the Agricultural Energy and Environmental Efficiency of Eu Countries. Renew. Sustain. Energ. Rev. 40, 91–96. doi:10.1016/j.rser.2014.07.153
Wang, J., Wang, K., Shi, X., and Wei, Y.-M. (2019). Spatial Heterogeneity and Driving Forces of Environmental Productivity Growth in china: Would it Help to Switch Pollutant Discharge Fees to Environmental Taxes. J. Clean. Prod. 223, 36–44. doi:10.1016/j.jclepro.2019.03.045
Wang, K., Xian, Y., Yang, K., Shi, X., Wei, Y.-M., and Huang, Z. (2020). The Marginal Abatement Cost Curve and Optimized Abatement Trajectory of Co 2 Emissions from china’s Petroleum Industry. Reg. Environ. Change 20, 1–13. doi:10.1007/s10113-020-01709-3
Wen, G. J. (1993). Total Factor Productivity Change in China's Farming Sector: 1952-1989. Econ. Dev. Cult. Change 42, 1–41. doi:10.1086/452063
Wilson, P., Hadley, D., Ramsden, S., and Kaltsas, I. (1998). Measuring and Explaining Technical Efficiency in uk Potato Production. J. Agric. Econ. 49, 294–305. doi:10.1111/j.1477-9552.1998.tb01273.x
Xian, Y., Wang, K., Shi, X., Zhang, C., Wei, Y.-M., and Huang, Z. (2018). Carbon Emissions Intensity Reduction Target for China's Power Industry: An Efficiency and Productivity Perspective. J. Clean. Prod. 197, 1022–1034. doi:10.1016/j.jclepro.2018.06.272
Yao, Z., and Xuan, P. (2019). “The Influence Degree of Minimum purchase price Policy on Grain Production Efficiency,” in IOP Conference Series: Earth and Environmental Science (Xian: IOP Publishing), 032106. doi:10.1088/1755-1315/252/3/032106IOP Conf. Ser. Earth Environ. Sci.252.
Yuan, W., Li, J., Meng, L., Qin, X., and Qi, X. (2019). Measuring the Area green Efficiency and the Influencing Factors in Urban Agglomeration. J. Clean. Prod. 241, 118092. doi:10.1016/j.jclepro.2019.118092
Zhang, Q., Zhang, F., Wu, G., and Mai, Q. (2021). Spatial Spillover Effects of Grain Production Efficiency in china: Measurement and Scope. J. Clean. Prod. 278, 121062. doi:10.1016/j.jclepro.2020.121062
Keywords: environmental factors, carbon sinks, grain production, spatial spillover effect, the global super-efficiency SBM model
Citation: Xu H, Ma B and Gao Q (2021) Assessing the Environmental Efficiency of Grain Production and Their Spatial Effects: Case Study of Major Grain Production Areas in China. Front. Environ. Sci. 9:774343. doi: 10.3389/fenvs.2021.774343
Received: 11 September 2021; Accepted: 25 October 2021;
Published: 23 November 2021.
Edited by:
Xunpeng Shi, University of Technology Sydney, AustraliaCopyright © 2021 Xu, Ma and Gao. This is an open-access article distributed under the terms of the Creative Commons Attribution License (CC BY). The use, distribution or reproduction in other forums is permitted, provided the original author(s) and the copyright owner(s) are credited and that the original publication in this journal is cited, in accordance with accepted academic practice. No use, distribution or reproduction is permitted which does not comply with these terms.
*Correspondence: Qiang Gao, Z2FvMTIyMTFAMTI2LmNvbQ==