 Xiaoli Wang
 Xiyong Hou
 Yingchao Piao
 Aiqing Feng
 Yinpeng Li
- 1Yantai Institute of Coastal Zone Research, Chinese Academy of Sciences, Yantai, China
- 2Key Laboratory of Coastal Environmental Processes and Ecological Remediation, Yantai Institute of Coastal Zone Research, Chinese Academy of Sciences, Yantai, China
- 3Center for Ocean Mega-Science, Chinese Academy of Sciences, Qingdao, China
- 4Computer Network Information Center, Chinese Academy of Sciences, Beijing, China
- 5National Climate Center, China Meteorological Administration, Beijing, China
- 6Laboratory for Climate Studies, National Climate Center, China Meteorological Administration, Beijing, China
- 7International Global Change Institute, Hamilton, New Zealand
Facing the western Pacific Ocean and backed by the Eurasian continent, the coastal area of China (hereafter as CAC) is sensitive and vulnerable to climate change due to the compound effects of land-ocean-atmosphere, and thus is prone to suffer huge climate-related disaster losses because of its large population density and fast developed economy in the context of global warming. Here in this study the near- (2040), mid- (2070), and long-future (2100) mean, minimum, and maximum temperature (Tmean, Tmin, and Tmax) projections based on the statistic downscaling climate prediction model (SimCLIM) integrated with 44 General Circulation Models (GCMs) of CMIP5 under three representative concentration pathway (RCP4.5, RCP6.0, and RCP8.5) scenarios are evaluated over CAC and its sub-regions. Multi-model ensemble of the selected GCMs demonstrated that there was a dominating and consistent warming trend of Tmean, Tmin, and Tmax in the Chinese coastal area in the future. Under RCP4.5, RCP6.0, and RCP8.5 scenarios, the annual temperature increase was respectively projected to be in the range of 0.8–1.2°C for 2040, 1.5–2.7°C for 2070, and 1.6–4.4°C for 2100 over the entire CAC. Moreover, a spatial differentiation of temperature changes both on the sub-regional and meteorological station scales was also revealed, generally showing an increment with “high south and low north” for annual average Tmean but “high north and low south” for Tmin and Tmax. An obvious lower increase of Tmean in the hotter months like July and August in the south and a significant sharper increment of Tmin and Tmax in the colder months such as January, February, and December in the north were expected in the future. Results derived from this study are anticipated to provide insights into future temperature changes and also assist in the development of target climate change mitigation and adaptation measures in the coastal area of China.
1 Introduction
The earth has experienced significant temperature rises both regionally and globally since 1850 (Li et al., 2015; Ozturk et al., 2018). Greenhouse gas emission, mainly induced by human activities such as burning of fossil fuels, deforestation, and agriculture, is likely to be largely responsible for the increase in the surface temperature of the earth and global warming (IPCC, 2013), which has a profound impact on ecological environment (Isobe, 2013; Gomiero et al., 2018), social economy (Mishra et al., 2010; Lu et al., 2019), and human health (Baccini et al., 2013; Jiang et al., 2015; Luo et al., 2019). What’s notable is that although the nationally determined contributions pledged in the Paris Agreement are completely achieved, the global mean surface temperature is projected to rise by 2.6°C–4.8°C under the high emissions scenarios in 2100 (Onozuka et al., 2019; Feng and Chao, 2020), which is expected to pose a much more serious threat to the natural environment and human society. Therefore, it is of extreme urgency and great importance to investigate the future projection of temperature for preventing global warming impacts and also is highly beneficial to climate mitigation and adaptation.
As forced by Representative Concentration Pathways (RCPs) greenhouse gas (GHG) emission scenarios, General Circulation Models (GCMs) participated in the Coupled Model Intercomparison Project Phase 5 (CMIP5) in the IPCC Fifth Assessment Report (AR5) have provided great opportunities to evaluate the projections of spatiotemporal performances of climatic change in the 21st century (Zhang et al., 2017; Li et al., 2019), and they have been widely applied to detect the variation and attribution of climate change as well as to formulate response measures against global warming (Azmat et al., 2018; Guo et al., 2020). GCMs, however, exhibiting a coarse resolution, generally have large uncertainties in reliable projections of climatic change owing to the shortage of reflecting particular characteristics of underlying surface (Zhou et al., 2017; Azmat et al., 2020), such as topography, geomorphology, hydrology, soil, vegetation, etc. Therefore, it is a common perception that one single GCM is insufficient in simulating all the atmospheric system processes and detecting every climate condition variability at finer scale with a higher reliability (Ali et al., 2019; Li et al., 2019). Accordingly, for the purpose of reducing the uncertainty and improving estimation accuracy, multi-model ensembles of GCMs are commonly recommended for climate change simulation and projection (Xu and Xu, 2012; Chhin and Yoden, 2018).
To date, plenty of studies have engaged in future temperature assessments based on the multi-model ensembles both at global and regional scales, and a consensus is generally reached that the temperature will rise in the future but the magnitude of the increase varies by region (Wang et al., 2017b; Pattnayak et al., 2017; Salman et al., 2018; Ali et al., 2019; Khan et al., 2020; Ullah et al., 2020; Zhang et al., 2020). The differences in temperature rise among previous studies could be attributed to several factors, including the diversity of climate, geography, and social environment (King et al., 2018; Almazroui et al., 2020), and importantly this includes the uncertainty of the employed GCMs with limited number and imperfect performance (Lewis et al., 2019). Therefore, more studies, especially on the regional scale, are particularly needed to evaluate the regional applicability of GCMs in temperature prediction, which is helpful for providing abundant and specific supplements for the response of regional temperature variation to climate change.
As a transitional zone between the continent and ocean, the coastal area of China (CAC) is highly sensitive and vulnerable to climate change, and thus is extremely susceptible to frequent climate disasters (Jiao et al., 2015). Due to the complex underlying surface conditions and the influence of East Asia monsoons, climate simulation and prediction have great uncertainty over CAC where there is characterization with large population density and rapid economic development, which poses a huge challenge to climate-related risk management and adaptation under the background of global warming. Therefore, it is important to predict the future trends and characteristics of temperature in the Chinese coastal regions. In the early stage, some meaningful results in temperature projection by GCMs have been recorded in several studies involved with CAC. For example, You et al. (2014) used one GCM named MPI-ESM-LR participated in the CMIP5 to examine the projected characteristics of mean, maximum, and minimum temperature in China during 2006–2100, and found that the temperature in the Chinese coastal regions showed consistent increases with RCP2.6, RCP4.5, and RCP8.5 in the future. Based on 8 CMIP5 global model datasets, Yao et al. (2012) demonstrated that the multi-model ensemble of maximum and minimum temperature would generally increase 3.0°C–4.0°C in eastern coastal China by the middle and late 21st century. Recently, Shi et al. (2018) assessed the changes in temperature and its extremes over China at 1.5°C and 2.0°C global warming levels based on 27 CMIP5 GCMs models with RCP2.6, RCP4.5, and RCP8.5 and indicated that the mean temperature rise in eastern China was about 1.5°C under both global warming targets.
The studies mentioned above have provided useful insights into the variation of future temperature in the region associated with CAC; however, the study available to date that focuses on the temperature projection over CAC as a whole is absent. Furthermore, the GCMs employed in the previous studies are insufficient, and the response characteristics of future temperature are mainly presented by the average value of GCMs, generally being short of considering global model datasets downscaling. Therefore, in this study, an ensemble of 44 GCMs which are integrated by the climate projection application software named SimCLIM is used to project the spatiotemporal changes of mean, minimum, and maximum temperatures (Tmean, Tmin, and Tmax) in the near- (2040), mid- (2070), and long-term (2100) under three representative concentration pathways (RCP4.5, RCP6.0, and RCP8.5) scenarios over CAC. What’s more, the pattern scaling technique that focuses more on “climate change signals” represented by the differences of GCMs between future and base periods is employed to downscale GCMs datasets. Pattern scaling method aims to produce the regional climate change pattern, which is conducive to exhibit high credibility in fine features of regional response in temperature (Santer et al., 1990). It is expected that climate change projections of temperature in this study can be used to identify and quantify changes in temperature over the coming period in the Chinese coastal regions, which is essential and provides great scientific references to climate change risk management as well as climate mitigation and adaptation in the coastal area of China.
The outline of this article is as follows. Section 2 describes the study area, dataset, model, and employed methods for temperature projection. Then in Section 3 the model evaluation and the spatiotemporal characteristics of future temperature are analyzed. Finally, discussion and conclusion are given in Section 4 and Section 5, respectively.
2 Data Sources and Methods
2.1 Study Area
The provinces, autonomous district and municipalities located on the eastern coast of China are designated as the study area (Beijing is included to ensure the spatial integrity of the study area, while Taiwan and the South China Sea islands are excluded due to data absence), as shown in Figure 1. For highlighting the regional differences in temperature response to global warming, the coastal area of China is divided into six sub-regions according to the China Meteorological and Geographical Regionalization, and the sub-regions are respectively renamed as coastal area of Dongbei (Region I), Huabei (Region II), Huanghuai (Region III), Jianghuai (Region IV), Jiangnan (Region V), and Huanan (Region VI) from north to south (Wang et al., 2017a).
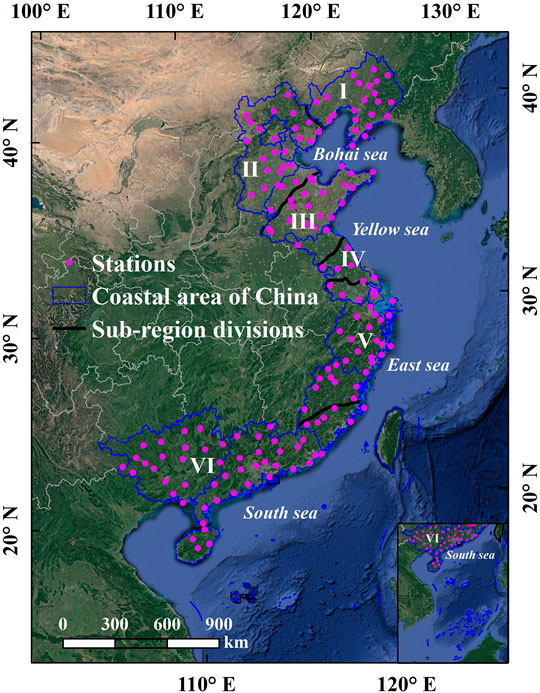
FIGURE 1. Location map of the coastal area of China and the meteorological stations.
The coastal area is an important economic-industrial belt in China, with the land area, population, and GDP generally accounting for 14, 46, and 56% of the country’s total, respectively. The most famous economic circles such as Jing-Jin-Ji, Yangtze River Delta, and Pearl River Delta which possess larger population density, better developed economy, as well as denser concentrated wealth are all placed in the coastal region. Meanwhile, extreme weather and climate events such as heat waves, heavy precipitation, and typhoon, as well as slow-onset disaster like sea level rise, coastal erosion, and wetland degradation are witnessed more and more over CAC recently, making the coastal region a more sensitive and vulnerable zone of climate change.
2.2 Historical Meteorological Data
The observed daily Tmean, Tmin, and Tmax data during 1996–2018 (base period) of 162 meteorological stations located in the coastal area of China are used to validate the performance of climate projection application software SimCLIM. The observation-based temperature records are provided by the National Meteorological Information Center, China Meteorological Administration (http://data.cma.cn/). The quality control of meteorological data is carried out through the steps of missing data processing and abnormal data screening by RClimDex software.
2.3 Model Description
SimCLIM is an integrated software modelling system that users can flexibly customize for their own purposes to carry out assessments of climate change and its impacts and adaptation at local to global scales (Warrick et al., 2005; Mcleod et al., 2010). There is a wide range of applications by SimCLIM in studying the impacts of present climate variability and future change on various fields, for example, water resources management (Warrick, 2009), agriculture systems (Harrison et al., 2016), crop yield (Bao et al., 2015; Amin et al., 2018a; Trisurat et al., 2018), sea level rise (Wang et al., 2016; Ramachandran et al., 2017), ecosystem (Meyer et al., 2018), and so on. For climate change projections, outputs from a large range of complex General Circulation Models (GCMs) and the IPCC AR5 GHG emissions scenarios Representative Concentration Pathways (RCPs) are incorporated in SimCLIM. What’s more, SimCLIM employs the commonly used statistic method “pattern scaling” for generating scenarios of future climates to fulfill climate projection on regional and local levels (Wang et al., 2016; Amin et al., 2018b). SimCLIM version 4.0 is employed in this study and more detailed information about SimCLIM is provided (http://www.climsystems.com/resources/publications/).
Since that application of single GCM will limit the scope of climate projections, accordingly, more GCMs (ensemble) are recommended to be applied in erecting the future climate change scenarios. In this study, 44 GCMs available in SimCLIM combined by pattern scaling method are employed to build a multi-model ensemble for the purpose of baseline comparison and future temperature projection with GHG representative concentration pathways scenarios in the coastal area of China. Specifically, three most commonly used emissions scenarios including two stabilization scenarios (RCP4.5 and RCP6.0) and one extreme emission scenario (RCP8.5) (Vuuren et al., 2011) are considered in this study. The two intermediate scenarios RCP4.5 and RCP6.0 respectively represent the low- and mid-climate projection sensitivity with a middle range future global change scenario, which separately refer to the emissions peak around 2040 and 2080 and then decline. And the last scenario RCP8.5 with high-climate sensitivity, commonly being considered as an emissions scenario of high population and high energy demand in absence of climate change mitigation policies over this century, relates to the emissions which continue to rise throughout the 21st century (Riahi et al., 2011; Abaurrea et al., 2018; Nasim et al., 2018).
2.4 Performance Evaluation
Considering the feedback mechanisms of GCMs to the complex climate system are still not clear enough, some limitations and errors in the climate simulation by GCMs could exist (Masson and Knutti, 2011). Therefore, it is absolutely essential to evaluate the simulation and projection ability of GCMs. Regarding the performance of the global climate model, a widespread cognition is that the higher the ability of a model to predict the present-day climate with observations accurately, the higher will be the credibility of the future climate projections (Guo et al., 2020). Generally, when evaluating the performance of GCMs, it is necessary to assess the ability to predict the spatial-temporal characteristics of climate change (Khan et al., 2020). And plenty of performance metrics such as statistical indices like Bias, Root Mean Square Error (RMSE), and Correlation Coefficient, as well as other performance indices, for example, Taylor skill score, hierarchical and clustering approach, and so on, have been employed for GCMs selection (Guo et al., 2018; Ozturk et al., 2018). In this study, both the temporal and spatial variabilities are considered to evaluate the performance of SimCLIM. In specific, the metrics such as Bias and RMSE are used to assess the ability to predict the temporal variability of temperature by SimCLIM over CAC. And the spatial Correlation Coefficient between the observations and the projections of temperature during the baseline period is employed to evaluate the similarity of spatial distribution features.
3 Results
3.1 Model Evaluation
3.1.1 Temporal Variability in Temperature
The Bias and RMSE between the SimCLIM projected and historical observed multi-year average temperature in the coastal area of China from 1996 to 2018 are presented in Table 1. Except that the projected Tmean is 0.3°C higher than the observed value in Region VI, all of the deviations between the projected and observed Tmean, Tmin, and Tmax are between −0.1°C to −1.1°C both at sub- and full-region scales, indicating a slightly lower value of projection temperature when compared to the observations. Additionally, the RMSE between the estimated and observed Tmean, Tmin, and Tmax ranges from 0.4°C to 1.1°C, revealing that the dispersion degree is generally low between the projected and observed temperature over CAC.
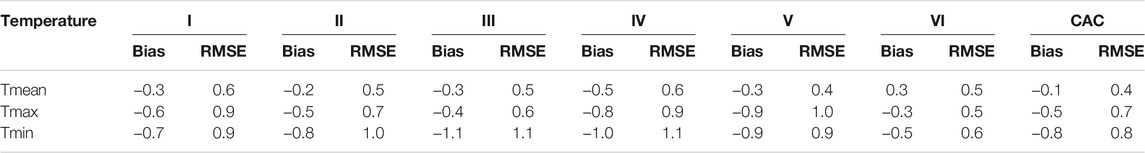
TABLE 1. The Bias and RMSE between the projected and observed multi-year average Tmean, Tmin, and Tmax over CAC during 1996–2018 (Unit: °C).
Comparisons for the monthly average Tmean, Tmin, and Tmax of observed versus projected over CAC during 1996–2018 are shown in Figure 2. The result implies that the monthly projections and observations in temperature are generally consistent over CAC and its sub-regions, demonstrating a reliable performance of SimCLIM for the annual cycle of monthly temperature in the Chinese coast regions.
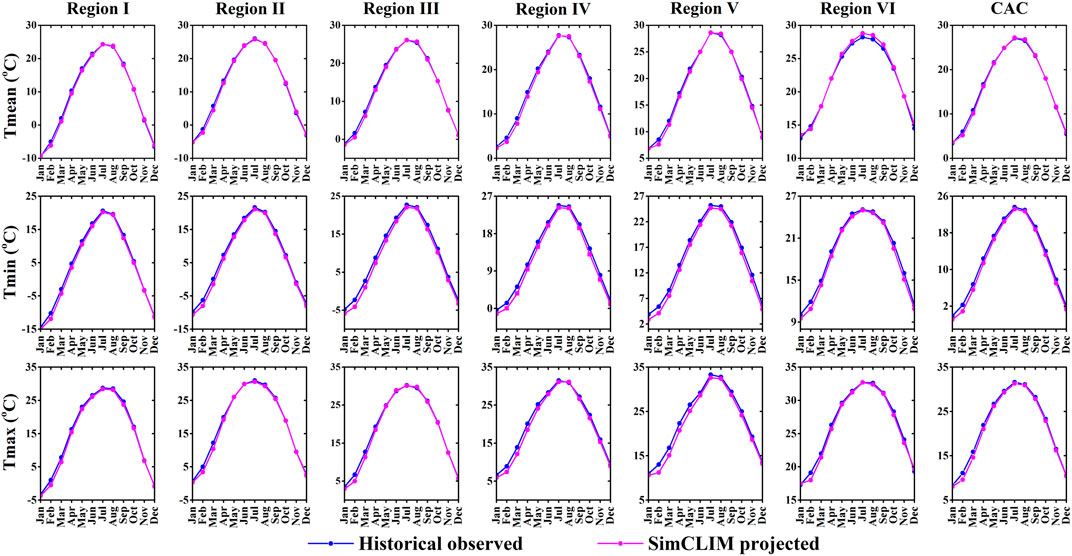
FIGURE 2. Annual cycle of monthly average Tmean, Tmin, and Tmax evaluation between the observations and projections over CAC during 1996–2018.
3.1.2 Spatial Distribution in Temperature
Figure 3 depicts the spatial distribution of multi-year average Tmean, Tmin, and Tmax of observed (Figures 3A–C) versus projected (Figures 3D–F) over CAC during 1996–2018. A high similar spatial feature that the multi-year average Tmean, Tmin, and Tmax increase from north to south in the Chinese coastal area for both observed data and projected results is identified, with the strong spatial correlation coefficients of 0.997, 0.997, and 0.995 for Tmean, Tmin, and Tmax between the observations and projections, respectively, revealing that the multi-model outputs by SimCLIM have good agreement with temperature observations in spatial distribution feature over CAC.
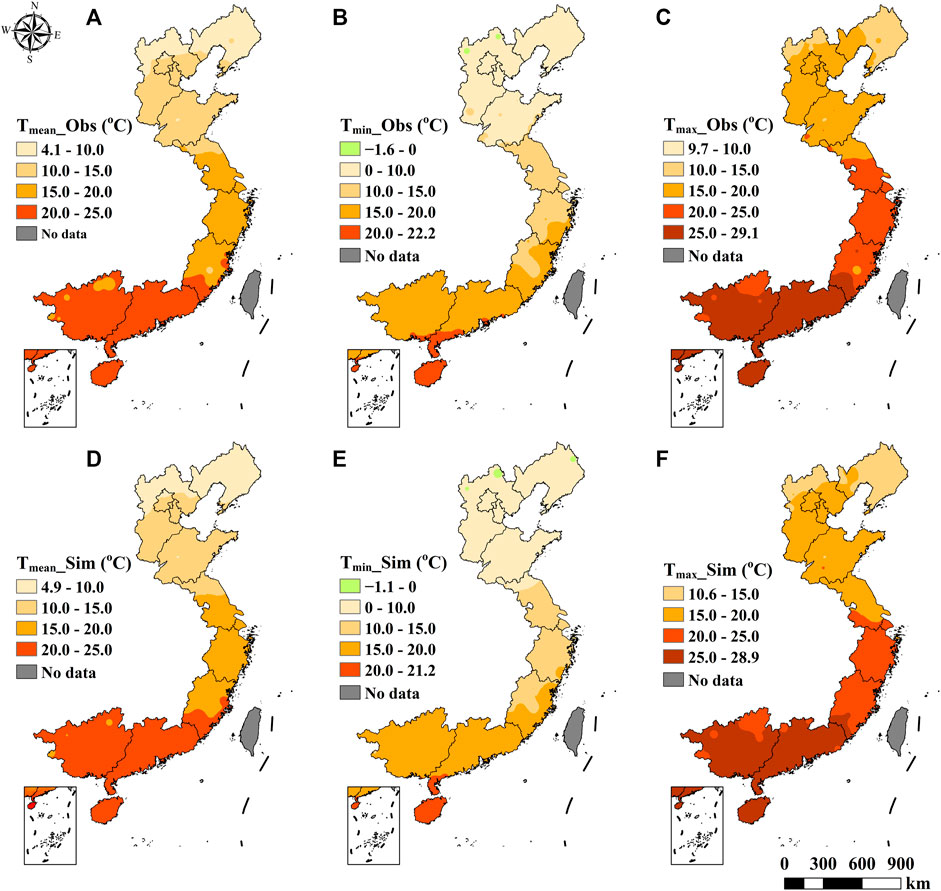
FIGURE 3. Spatial distribution of multi-year average for observed Tmean (A), Tmin (B), Tmax (C) and projected Tmean (D), Tmin (E), Tmax (F) by SimCLIM over CAC during 1996-2018.
3.2 Future Projections in Temperature
3.2.1 Mean Temperature
The changes of projected annual average Tmean relative to the base period and the annual average Tmean projections for 2040, 2070, and 2100 under RCP4.5, RCP6.0, and RCP8.5 scenarios over CAC are shown in Table 2. The results clarified that there was a complete increase of annual average Tmean over CAC in the future. In Regions I–VI, the increments of annual average Tmean with RCP4.5, RCP6.0, and RCP8.5 relative to 1996–2018 were between 0.8 and 1.8°C, 0.7–1.7°C, and 1.1–2.1°C for 2040, 1.4–2.3°C, 1.4–2.3°C, and 2.7–3.4°C for 2070, and 1.5–2.4°C, 2.3–3.1°C, and 4.4–5.3°C for 2100, respectively. For the whole of CAC, the annual average Tmean with three RCPs was projected to increase by 0.9°C, 0.8°C, and 1.2°C for 2040, 1.5°C, 1.5°C, and 2.6°C for 2070, and 1.6°C, 2.3°C, and 4.4°C for 2100, respectively. In 2040, the increment of annual average Tmean with RCP6.0 was lower than that with RCP4.5, while the increase of annual average Tmean with the two RCPs was almost the same in 2070. Note that the increase of annual average Tmean with RCP8.5 was forecasted to be the highest for all the three target years in the Chinese coastal regions.
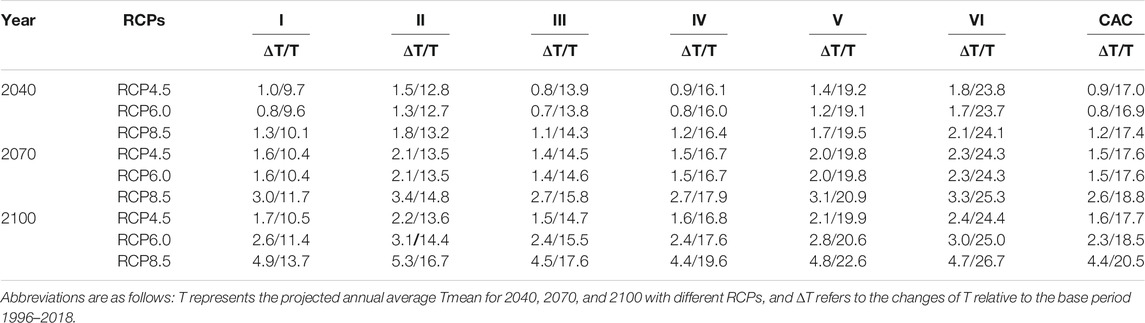
TABLE 2. The changes of annual average Tmean relative to the base period 1996–2018 and the projected annual average Tmean for 2040, 2070, and 2100 with different RCPs over CAC (Unit: °C).
The annual average Tmean in the six sub-regions was projected to be in the range of 9.7–23.8°C, 9.6–23.7°C, and 10.1–24.1°C for 2040, 10.4–24.3°C, 10.4–24.4°C, and 11.7–25.3°C for 2070, and 10.5–24.4°C, 11.4–25.0°C, and 13.7–26.7°C for 2100 under RCP4.5, RCP6.0, and RCP8.5 scenarios, respectively. And with respect to the entire CAC, the annual average Tmean was forecast to rise to 17.0°C, 16.9°C, and 17.4°C for 2040, 17.6°C, 17.6°C, and 18.8°C for 2070, and 17.7°C, 18.5°C, and 20.5°C for 2100 with three RCPs, respectively (Table 2).
Figure 4 illustrates the changes in monthly average Tmean separately for 2040, 2070, and 2100 with three RCPs relative to the base period over CAC. It implied that the increases of monthly average Tmean from March to November for 2040, 2070, and 2100 were generally lower than those in January, February, and December over CAC, which was much more obviously in the southern sub-regions, especially in Regions V and VI, where the increases of monthly average Tmean in July and August were lower than those in other months at about 2.0°C. What’s more, the changes of monthly average Tmean further disclosed the annual average Tmean increase characteristics for 2040 and 2070 under RCP4.5 and RCP6.0 scenarios, and it also revealed that the increment monthly Tmean with RCP8.5 was the highest over CAC.
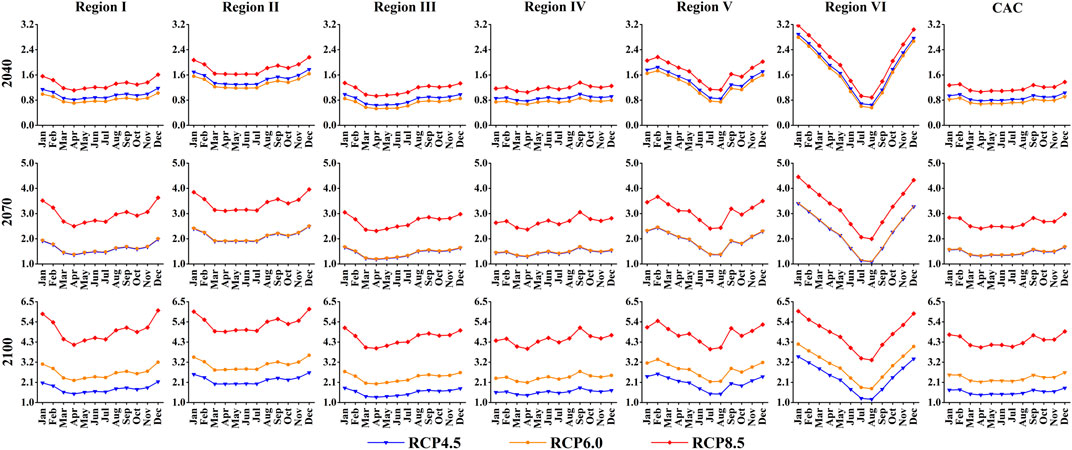
FIGURE 4. Changes in monthly average Tmean for 2040, 2070, and 2100 with different RCPs relative to the base period 1996–2018 over CAC.
The projected monthly average Tmean for 2040, 2070, and 2100 with three RCPs over CAC and its sub-regions are shown in Figure 5. The monthly average Tmean in January, February, and December of 2070 and 2100 in Region III exceeded 0°C with different RCPs, which was obviously higher than the minus Tmean of the same months during the base period 1996–2018. What’s more, in the southern three sub-regions, namely, Regions IV, V, and VI, the monthly average Tmean in July and August for 2070 and 2100 was projected to be significantly more than 30°C with RCP8.5, generally indicating a high temperature in summer at the southern coastal regions of China in the late 21st century under the high GHG emissions scenario.
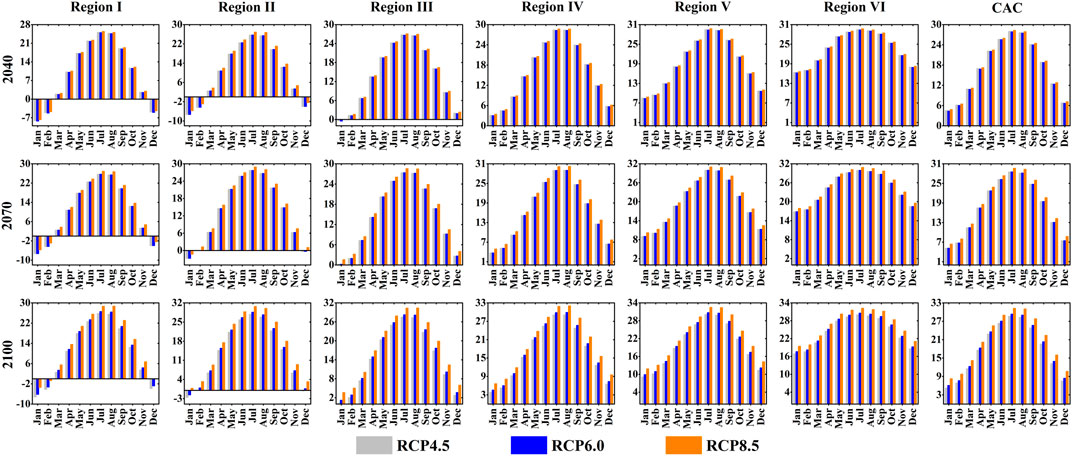
FIGURE 5. Projected monthly average Tmean for 2040, 2070, and 2100 with different RCPs over CAC.
The spatial distribution of changes in annual average Tmean for 2040, 2070, and 2100 with RCP4.5, RCP6.0, and RCP8.5 relative to the base period at 162 meteorological stations over CAC is presented in Figure 6.
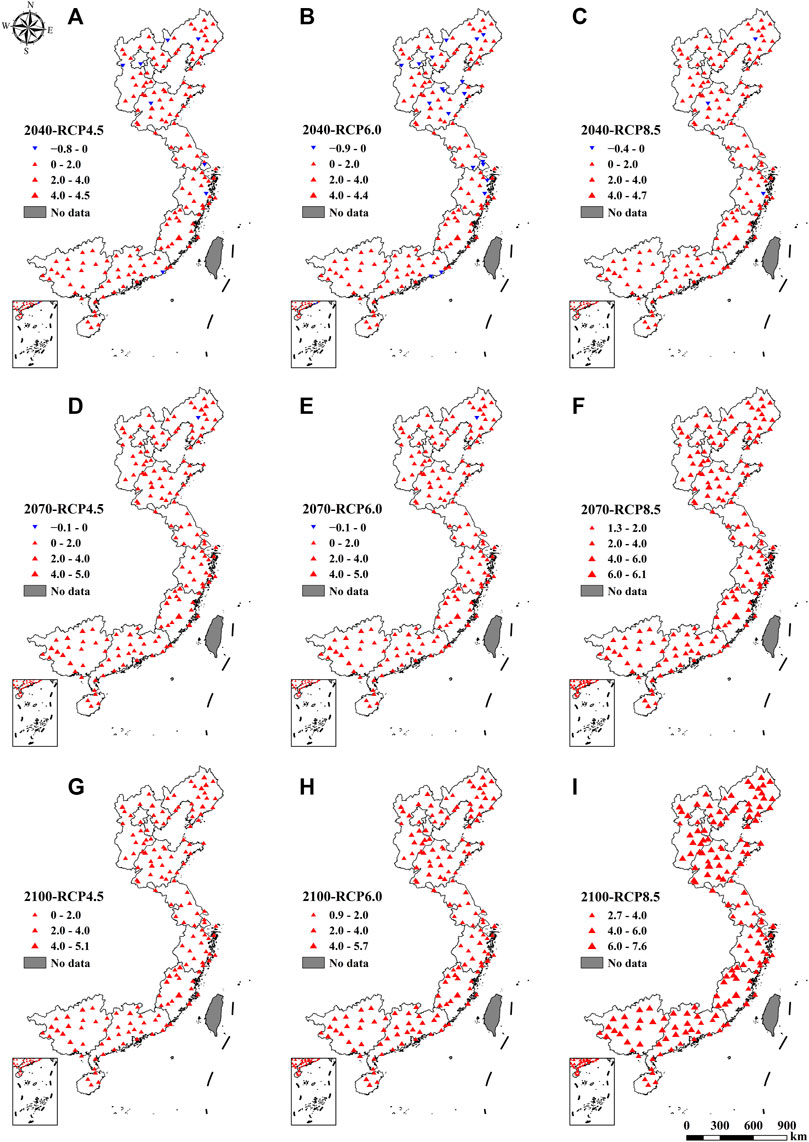
FIGURE 6. Spatial distribution of changes in annual average Tmean for 2040 with RCP4.5 (A), RCP6.0 (B), RCP8.5 (C), 2070 with RCP4.5 (D), RCP6.0 (E), RCP8.5 (F) and 2100 with RCP4.5 (G), RCP6.0 (H), RCP8.5 (I) relative to the base period 1996 -2018 at 162 meteorological stations over CAC.
For 2040 (Figures 6A–C), the changes in annual average Tmean with RCP4.5, RCP6.0, and RCP8.5 relative to 1996–2018 were respectively between −0.8–4.5°C, −0.9–4.4°C, and −0.4–4.7°C on station scale. There were approximately 4.9, 11.7, and 1.9% of the meteorological stations mainly distributed in the northern coastal regions presenting a downward trend in annual average Tmean with three RCPs, respectively. And most of the other stations almost throughout CAC were expected to experience an upward trend of Tmean, with an increment between 0 and 2.0°C in general. For 2070 (Figures 6D–F), the station-scale changes in annual average Tmean with three RCPs relative to 1996–2018 were between the range of −0.1–5.0°C, −0.1–5.0°C, and 1.3–6.1°C, respectively. Only one station situated in Region I exhibited a decrease in Tmean with both RCP4.5 and RCP6.0, and most of the other stations demonstrated an increase with three RCPs, commonly showing a range of 0–2.0°C under RCP4.5 and RCP6.0 and 2.0–4.0°C under RCP8.5. For 2100, the changes in Tmean on the scale of meteorological station ranged from 0 to 5.1°C, 0.9–5.7°C, and 2.7–7.6°C under the scenarios of RCP4.5, RCP6.0, and RCP8.5, with most of the stations presenting an increment between 0 and 2.0°C, 2.0–4.0°C, and 4.0–6.0°C, respectively (Figures 6G–I).
3.2.2 Minimum Temperature
Table 3 displays the changes of projected annual average Tmin relative to the base period and the annual average Tmin for 2040, 2070, and 2100 with RCP4.5, RCP6.0, and RCP8.5 over CAC. A general increase of annual average Tmin was projected for the target 3 years. Relative to 1996–2018, the increases of annual average Tmin with three RCPs in the sub-regions were between 0.8 and 1.0°C, 0.7–0.9°C, and 1.0–1.3°C for 2040, 1.3–1.7°C, 1.3–1.7°C, and 2.3–3.0°C for 2070, and 1.4–1.8°C, 2.0–2.7°C, and 3.8–5.0°C for 2100, respectively. For entire CAC, the annual average Tmin was forecasted to have the exactly same increase as the annual average Tmean in the future. Moreover, it also detected that the increment of annual average Tmin with RCP4.5 and RCP6.0 for 2040 and 2070 presented a feature just like that of Tmean, and the increase of Tmin with RCP8.5 was also expected to be the highest in future over CAC.
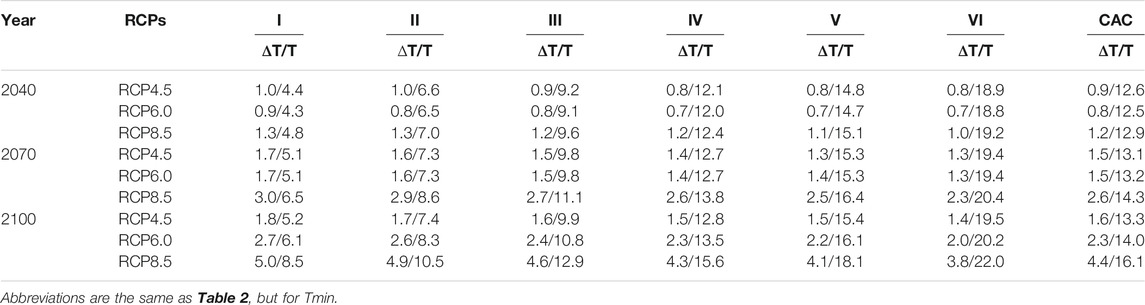
TABLE 3. The changes of annual average Tmin relative to the base period 1996–2018 and the projected annual average Tmin for 2040, 2070, and 2100 with different RCPs over CAC (Unit: °C).
In the sub-regions, the projected annual average Tmin was between 4.4 and 18.9°C, 4.3–18.8°C, and 4.8–19.2°C for 2040, 5.1–19.4°C, 5.1–19.4°C, and 6.5–20.4°C for 2070, and 5.2–19.5°C, 6.1–20.2°C, and 8.5–22.0°C for 2100 under RCP4.5, RCP6.0, and RCP8.5, respectively. Considering the whole of CAC, the annual average Tmin was projected to be 12.6°C, 12.5°C, and 12.9°C for 2040, 13.1°C, 13.2°C, and 14.3°C for 2070, and 13.3°C, 14.0°C, and 16.1°C for 2100 with three RCPs, respectively.
The changes in monthly average Tmin for 2040, 2070, and 2100 with three RCPs relative to 1996–2018 over CAC are presented in Figure 7. In the northern coastal sub-regions, especially in Region I and II, the increments of Tmin in January, February, and December were generally higher than those in other months. But in the southern sub-regions and the entire CAC, there was little difference in the changes of Tmin from month to month. In addition, the increase of monthly average Tmin with RCP4.5 was higher than (nearly the same as) that with RCP6.0 for 2040 (2070), and the increase amplitude of monthly average Tmin with RCP8.5 was apparently the highest.
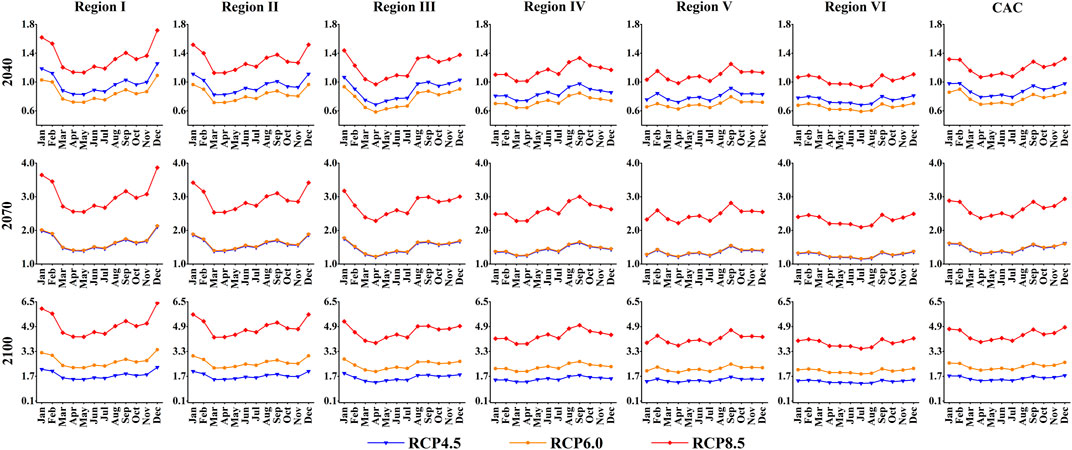
FIGURE 7. Changes in monthly average Tmin for 2040, 2070, and 2100 with different RCPs relative to the base period 1996–2018 over CAC.
Figure 8 shows the projected monthly average Tmin for 2040, 2070, and 2100 with three RCPs over CAC. The monthly average Tmin in November in Region II and in January in Region IV for 2070 and 2100 were both predicted to be greater than 0°C, which generally revealed a warmer winter from 2070. The Tmin in July and August over the southern sub-regions was projected to exceed 28°C for 2100 under RCP8.5, further suggesting a high temperature challenge facing the south coastal regions of China in the summer night with the highest radiative forcing at the end of the century.
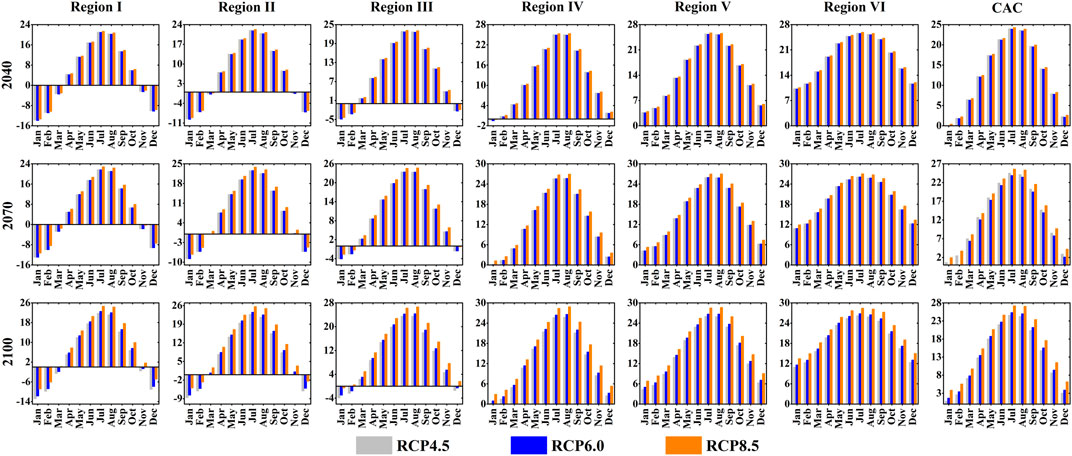
FIGURE 8. Projected monthly average Tmin for 2040, 2070, and 2100 with different RCPs over CAC.
The spatial distribution of changes in annual average Tmin for 2040, 2070, and 2100 with RCP4.5, RCP6.0, and RCP8.5 relative to 1996–2018 at meteorological stations over CAC is shown in Figure 9.
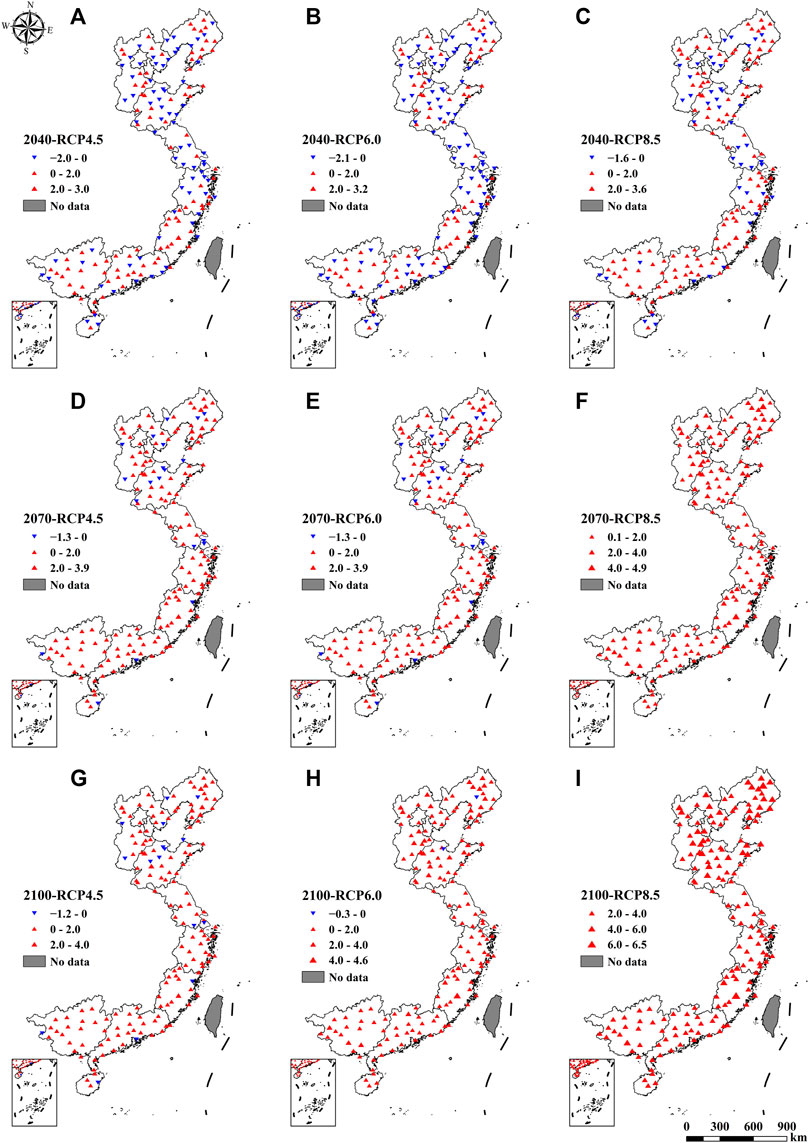
FIGURE 9. Spatial distribution of changes in annual average Tmin for 2040 with RCP4.5 (A), RCP6.0 (B), RCP8.5 (C), 2070 with RCP4.5 (D), RCP6.0 (E), RCP8.5 (F) and 2100 with RCP4.5 (G), RCP6.0 (H), RCP8.5 (I) relative to the base period 1996 -2018 at 162 meteorological stations over CAC.
For 2040 (Figures 9A–C), the future annual average Tmin changes with RCP4.5, RCP6.0, and RCP8.5 were respectively in the range of −2.0–3.0°C, −2.1–3.2°C, and −1.6–3.6°C on the scale of station. Nearly 55.5, 49.3, and 72.2% meteorological stations mainly situated in Regions V and VI were projected to exhibit an upward tendency of annual average Tmin with RCP4.5, RCP6.0, and RCP8.5, respectively, and the other stations mostly located in Regions I to IV presented a downward trend in 2040 with three RCPs. For 2070 (Figures 9D–F), the projected magnitude of annual average Tmin changes at station scale were between the range of −1.3–3.9°C under the scenarios of RCP 4.5 and RCP6.0 as well as 0.1–4.9°C under RCP8.5 scenario. There were about 87.7% stations which were projected to experience an increase of annual average Tmin with RCP4.5 and RCP6.0, and all of the 162 stations over CAC were expected to have an increase in annual average Tmin with RCP8.5, generally posing an increment range between 0 and 2.0°C. For 2100 (Figures 9G–I), the station-scale changes in annual average Tmin with RCP4.5, RCP6.0, and RCP8.5 were respectively between −1.2–4.0°C, −0.3–4.6°C, and 2.0–6.5°C. The annual average Tmin at almost 90.1 and 98.8% of meteorological stations was predicted to increase under the scenarios of RCP4.5 and RCP6.0, with a prevalent increment magnitude in the range of 0–2.0°C. With RCP8.5, all stations in the Chinese coast region were forecasted to present an upward tendency in annual average Tmin, and the magnitude of increase was commonly in the range of 2.0–4.0°C.
3.2.3 Maximum Temperature
The future changes of annual average Tmax relative to 1996–2018 and the projected annual average Tmax for 2040, 2070, and 2100 with RCP4.5, RCP6.0, and RCP8.5 over CAC are presented in Table 4. An overall increase of annual average Tmax in the future over CAC was projected by SimCLIM. With respect to the sub-regions, the changes in annual average Tmax with RCP4.5, RCP6.0, and RCP8.5 relative to the baseline period were in the range of 0.7–0.9°C, 0.6–0.8°C, and 1.0–1.3°C for 2040, 1.3–1.6°C, 1.3–1.6°C, and 2.4–2.9°C for 2070, and 1.4–1.7°C, 2.1–2.6°C, and 3.9–4.8°C for 2100, respectively. For the total CAC, the increase magnitude of annual average Tmax with different RCPs was predicted to be almost the same as that of annual average Tmean and Tmin for the years of concern in this study. It is noted that the annual average Tmax changes with RCP6.0 were also projected to be lower than that with RCP4.5 in 2040, and to be the same as that in 2070. Additionally, the projected increment of annual average Tmax with RCP8.5 was obviously the highest for 2040, 2070, and 2100 over CAC.
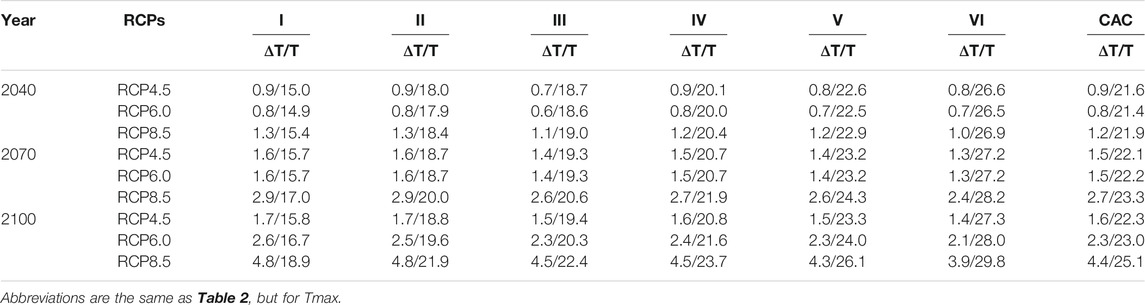
TABLE 4. The changes of annual average Tmax relative to the base period 1996–2018 and the projected annual average Tmax for 2040, 2070, and 2100 with different RCPs over CAC (Unit: °C).
At sub-region scale, the annual average Tmax was projected to be in the range of 15.0–26.6°C, 14.9–26.5°C, and 15.4–26.9°C for 2040, 15.7–27.2°C, 15.7–27.2°C, and 17.0–28.2°C for 2070, and 15.8–27.3°C, 16.7–28.0°C, and 18.9–29.8°C for 2100 with RCP4.5, RCP6.0, and RCP8.5, respectively. For the whole of CAC, the annual average Tmax was expected to increase to 21.6°C, 21.4°C, and 21.9°C for 2040, 22.1°C, 22.2°C, and 23.3°C for 2070, and 22.3°C, 23.0°C, and 25.1°C for 2100 with three RCPs, respectively.
Figure 10 depicts the changes in monthly average Tmax for the years of 2040, 2070, and 2100 with RCP4.5, RCP6.0, and RCP8.5 relative to 1996–2018 over CAC. It revealed that the increases of monthly average Tmax in December, January, and February were projected to be higher than those in other months for 2040, 2070, and 2100 in the northern coastal area, and the increments of monthly average Tmax were predicted to vary slightly from month to month with each RCP in the southern coastal area and the whole of CAC. The variation of changes in monthly average Tmax with RCP4.5 and RCP6.0 for 2040 and 2070 was consistent with that of annual average Tmax, and the highest increase of monthly average Tmax was also forecasted by SimCLIM under the scenario of RCP8.5 in future over CAC.
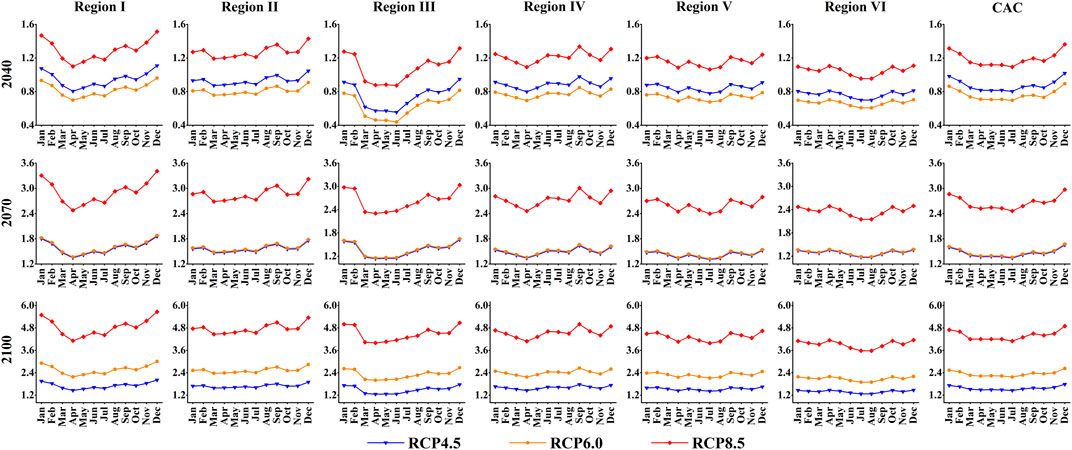
FIGURE 10. Changes in monthly average Tmax for 2040, 2070, and 2100 with different RCPs relative to the base period 1996–2018 over CAC.
The future projected monthly average Tmax with three RCPs over CAC are presented in Figure 11. The projected results showed that the monthly average Tmax was expected to be higher than 0°C in December in Region I with three RCPs in future. And for the year of 2100, the monthly average Tmax from June to September was predicted to exceed 30°C in the Chinese coastal regions. Moreover, the monthly average Tmax in July and August in the southern coastal sub-regions was projected to be more than 35°C with the RCP8.5 scenario, which generally signified a prevalent high temperature heat wave weather in summer daytime at the end of the century in the south of Chinese coast.
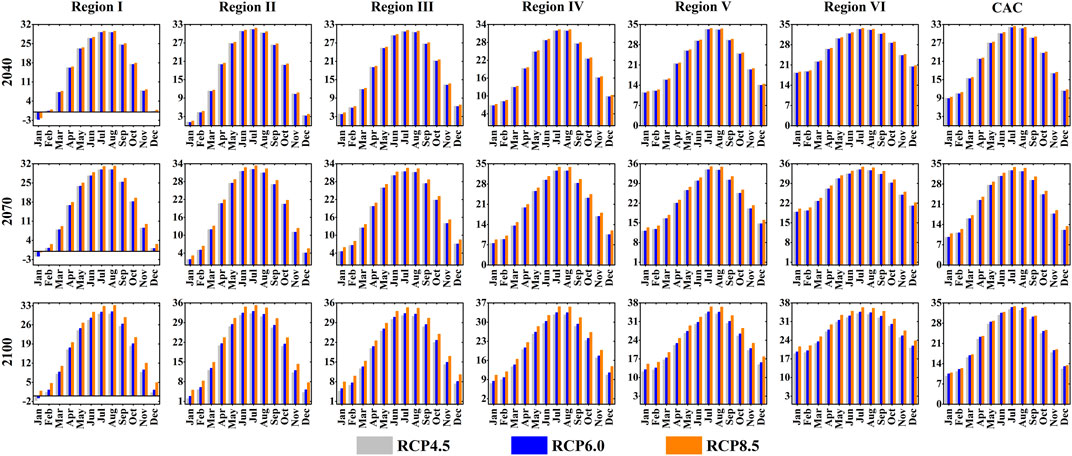
FIGURE 11. Projected monthly average Tmax for 2040, 2070, and 2100 with different RCPs over CAC.
Figure 12 displays the spatial distribution of changes in annual average Tmax for 2040, 2070, and 2100 with different RCPs relative to the base period at 162 meteorological stations over CAC. For 2040 (Figures 12A–C), the changes of annual average Tmax with RCP4.5, RCP6.0, and RCP8.5 on the station scale were between the range of −2.0–4.6°C, −2.0–4.5°C, and −1.6–4.8°C, respectively. Almost 73.4, 69.1, and 86.4% of meteorological stations were expected to meet with an upward tendency of annual average Tmax under the scenarios of RCP4.5, RCP6.0, and RCP8.5, respectively, with a uniform increment between 0 and 2.0°C in general. And those other stations with downward trend of annual average Tmax in 2040 were mainly located in Regions I, II, and V, commonly presenting a decrease magnitude of −2.0–0°C. For 2070 (Figures 12D–F), the predicted changes of annual average Tmax at meteorological station scale were between −1.4–5.1°C, −1.3–5.1°C, and −0.2–6.2°C with RCP4.5, RCP6.0, and RCP8.5, respectively. And the annual average Tmax was projected to rise at more than 95% stations over CAC, exhibiting a major increment in the range of 0–2.0°C with RCP4.5 and RCP6.0 as well as 0–4.0°C with RCP8.5. For 2100 (Figures 12G–I), the station-scale changes of annual average Tmax were respectively in the range of −1.2–5.2°C, −0.5–5.9°C, and 1.5–7.8°C with RCP4.5, RCP6.0, and RCP8.5. More than 96% of stations were found to present rising tendency of annual average Tmax with RCP4.5 and RCP6.0, with a dominating increase magnitude of 0–2.0°C, and all 162 meteorological stations were projected to have an increase of annual average Tmax with RCP8.5, showing a main increment between 2.0 and 6.0°C in general.
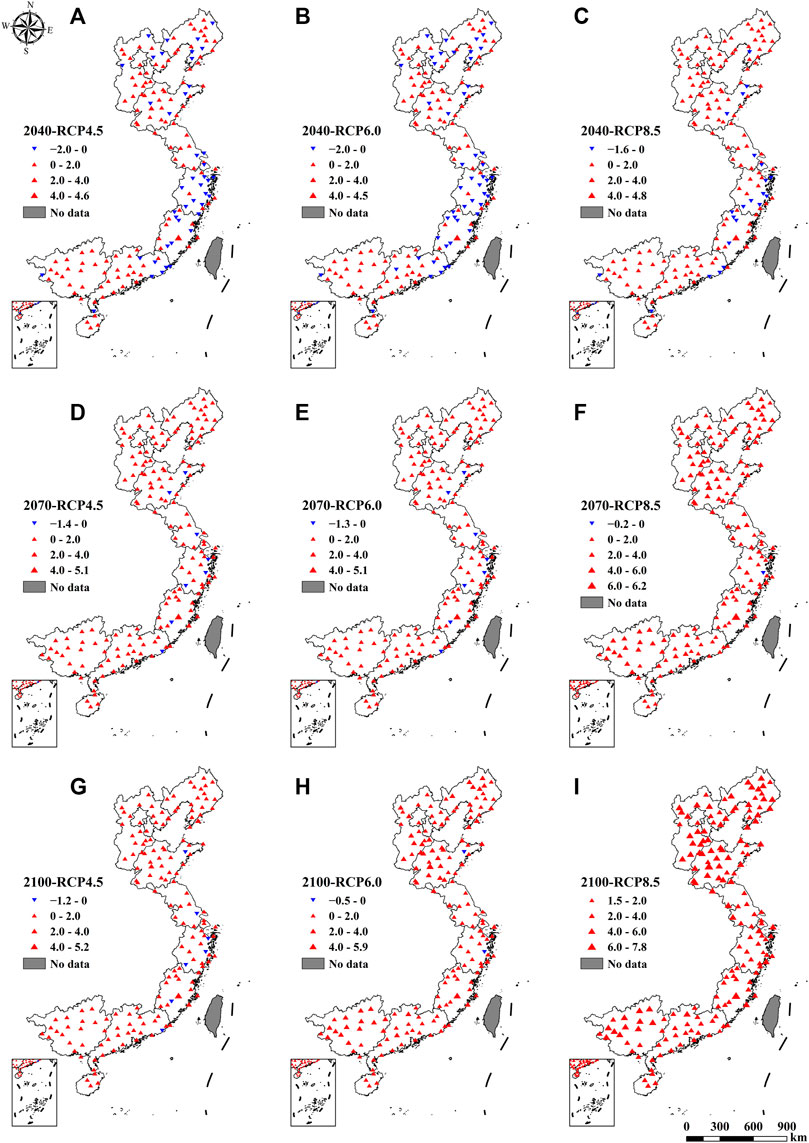
FIGURE 12. Spatial distribution of changes in annual average Tmax for 2040 with RCP4.5 (A), RCP6.0 (B), RCP8.5 (C), 2070 with RCP4.5 (D), RCP6.0 (E), RCP8.5 (F) and 2100 with RCP4.5 (G), RCP6.0 (H), RCP8.5 (I) relative to the base period 1996 -2018 at 162 meteorological stations over CAC.
4 Discussion
For the years of 2040, 2070, and 2100, a prevalent increase in Tmean, Tmin, and Tmax in the coastal area of China is projected by SimCLIM software integrated with 44 GCMs and IPCC AR5 GHG emissions scenarios, which is highly consistent with the previous studies focused on temperature prediction either at global scale (Wang et al., 2017b) or at regional scale such as research areas in North American (Zhang et al., 2020), European (D’Oria et al., 2017; Coppola et al., 2021), African (Ozturk et al., 2018), Asian (Salman et al., 2018; Almazroui et al., 2020; Ullah et al., 2020), and so on, where all will find an ascending trend in temperature in the future. Moreover, the positive trend in temperature forecasted in this study also furtherly confirms the temperature projection results in the region related to Chinese coast by early studies (Yao et al., 2012; You et al., 2014; Guo et al., 2018; Shi et al., 2018; Li et al., 2019). And the magnitude of change in Tmean discovered in this study is similar to Guo et al. (2018), who finds that the mean temperature is projected to increase by 0.76°C, 1.84°C, and 2.10°C with RCP4.5 during 2017–2036, 2046–2065, and 2080–2099, respectively. However, Yao et al. (2012) documents that the multi-model ensemble of maximum and minimum temperature would generally increase 3.0°C–4.0°C under the scenario of RCP4.5 by the end of the century in the eastern coastal China, showing a larger range of changes in Tmin and Tmax than those in this current study.
Of particular note is that not only a consistent warming trend over CAC has been projected by SimCLIM but also a spatial differentiation of temperature changes both on the scales of sub-regional and meteorological station have been revealed. To be specific, it is found that the future increment of Tmean in the northern coastal region is projected to be a little lower than that in the southern coastal region; on the contrary, the magnitudes of Tmin and Tmax are forecasted higher in the north than those in the south over CAC, especially under the scenario of RCP8.5 in 2100. The spatial difference of future temperature changes in the Chinese coastal area mentioned above is in line with the results of Zhang et al. (2020) who demonstrated that the increase of future mean temperature in summer in the south of North America is projected to be greater than that in the northern portion, and also further confirms the findings of numerous existing works, which reveal a sharper increment of temperature in high latitudes of the northern hemisphere (IPCC, 2014).
What’s more, the difference in future temperature change from month to month has also been discovered over CAC. For example, the projection results denote a significantly lower increase of Tmean in the hotter months like July and August in the southern sub-regions, particularly in Regions V and VI, and an obvious greater increment of Tmin and Tmax in the colder months such as January, February, and December is expected, especially in the northern coastal area. The monthly difference in future temperature change projected by SimCLIM over CAC is in accordance with those of published papers. For example, You et al. (2014) has found a pronounced warming trend for Tmean, Tmax, and Tmin in winter months with RCP8.5 in China during 2061–2090. Salman et al. (2018) and Almazroui et al. (2020) also both reveal larger temperature increases during winter months while smaller in summer months under future emission scenarios over the Arabian Peninsula.
In addition, this study clarifies that the Tmean, Tmin, and Tmax changes with RCP4.5 are respectively expected to be higher than and similar to those with RCP6.0 in 2040 and in 2070 over CAC, which has already evinced by previous studies in other regions. For instance, Abaurrea et al. (2018) demonstrates that the temperature projections over Spain under RCP6.0 are smaller than those under RCP4.5 during 2031–2050 but a similar growth during 2051–2060. And in Iraq, during the near-term (2010–2039) and mid-term (2040–2069) of the century, both the highest and the lowest increase in maximum and minimum temperature are presented a feature that the increment of temperature with RCP4.5 is lower than that with RCP6.0 (Salman et al., 2018). Actually, the two intermediate scenarios RCP4.5 and RCP6.0 are fairly similar, just with differences in timing of the usage of various energy-sources and implementation of climate change mitigation polices (Vuuren et al., 2011; Abaurrea et al., 2018). In short periods, the RCP4.5 GHG emissions and concentrations are slightly higher than the RCP6.0 values, which will thus lead to a little higher temperature in the near-term of the century. After then, the values of RCP6.0 rise faster than those of RCP4.5 over time, which will lead to the future increase of temperature with RCP6.0 being equal to or even higher than that with RCP4.5 from the mid-term of the century.
Although both the multi-model ensemble and downscaling are considered in this study, there is an acknowledgment of the inevitable uncertainty. The sources of uncertainty in temperature projection over CAC are including the unpredictability associated with addressing inter-annual and synoptic space-scales and modelling processes by GCMs (Harrison et al., 2016), initial and boundary conditions referring to the radiative forcing scenarios, observational data quality, as well as downscaling method (Mitchell and Hulmue, 1999). The mentioned above cascade of uncertainty is a huge challenge to be taken seriously facing climate change simulation and prediction, and at the same time, is also the direction of the follow-up research work in the future.
Temperature is a critical parameter for assessing the impacts of climate change over the whole world and any specifically regional areas (Almazroui et al., 2020). Studies have shown that even if the concentrations of GHG emissions could be stabilized at some level, the thermal inertia of the climate system would still result in further increases in temperature (Meehl et al., 2005). The temperature projection results in this study indicate that the sub-zero temperature would generally become rare in some northern sub-regions during winter months under the scenario of GHG emissions, and the average maximum temperature would be commonly more than 35°C during summer months under the non-climate policy scenario RCP8.5 in the southern coastal area of China in 2100. This will undoubtedly have a huge impact on the ecological environment and economic development of coastal regions in China. Therefore, both effective measures and concrete actions to climate mitigation and adaptation are urgently needed over CAC in the future. For example, efforts must be continued to reduce energy consumption and increase the share of renewable energy, to still control the growth rate of GHG emissions and increase the forest coverage and the carbon sink (Ng and Ren, 2018), as well as to replace the energy-intensive industry with the service industry (Yang et al., 2020), etc., and it is expected that these implements will help improve the adverse effects of climate warming in the coastal areas of China.
5 Conclusion
Based on historical daily temperature records during 1996–2018, the ability to predicate the temporal and spatial variabilities of temperature by the climate projection application software SimCLIM was evaluated firstly, and then an ensemble of 44 CMIP5 GCMs integrated in SimCLIM was used to project the mean, minimum, and maximum temperatures for the years 2040, 2070, and 2100 under RCP4.5, RCP6.0, and RCP8.5 scenarios in the coastal areas of China. We find that the outputs of multi-model ensembles by SimCLIM have good agreement with observations of temperature both in temporal variability and spatial distribution characteristic in the Chinese coastal region. Tmean, Tmin, and Tmax projection results show a dominating and consistent warming pattern over CAC in the future. Specifically, the annual average Tmean, Tmin, and Tmax would be increased by 0.8–1.2°C for 2040, 1.5–2.7°C for 2070, and 1.6–4.4°C for 2100 with three RCPs scenarios for the whole of CAC. And the future temperature increment may generally present a spatial pattern like “high south and low north” for Tmean but “high north and low south” for Tmin and Tmax. There would be an obvious lower increase of Tmean in the hotter months like July and August in the southern sub-regions, and an evident greater increment of Tmin and Tmax in the colder months such as January, February, and December in the north over CAC. In the future, climate extremes projection using CMIP6 GCMs will be conducted for climate risk management in the Chinese coastal area.
Data Availability Statement
The raw data supporting the conclusion of this article will be made available by the authors, without undue reservation.
Author Contributions
The general idea of this manuscript is proposed by the corresponding author XH. The first author XW is responsible for the propose of technical framework, data processing, analysis and interpretation, as well as writing the manuscript. YP is in charge of writing data processing program. AF deals with data collection and preprocessing. YL gives instructions on research methods and software applications.
Funding
The authors acknowledge the financial support from the Strategic Priority Research Program of the Chinese Academy of Sciences (No. XDA19060205), National Natural Science Foundation of China (No. 41901133, 41901016), and Key Deployment Project of Centre for Ocean Mega-Research of Science, CAS (No. COMS2020Q07).
Conflict of Interest
The authors declare that the research was conducted in the absence of any commercial or financial relationships that could be construed as a potential conflict of interest.
Publisher’s Note
All claims expressed in this article are solely those of the authors and do not necessarily represent those of their affiliated organizations, or those of the publisher, the editors, and the reviewers. Any product that may be evaluated in this article, or claim that may be made by its manufacturer, is not guaranteed or endorsed by the publisher.
Acknowledgments
They kindly thank the National Climate Centre (NCC) of China Meteorological Administration (CMA) for providing the climate data.
References
Abaurrea, J., Asín, J., and Cebrián, A. C. (2018). Modelling the Occurrence of Heat Waves in Maximum and Minimum Temperatures over Spain and Projections for the Period 2031-60. Glob. Planet. Change 161, 244–260. doi:10.1016/j.gloplacha.2017.11.015
Ali, S., Eum, H.-I., Cho, J., Dan, L., Khan, F., Dairaku, K., et al. (2019). Assessment of Climate Extremes in Future Projections Downscaled by Multiple Statistical Downscaling Methods over Pakistan. Atmos. Res. 222, 114–133. doi:10.1016/j.atmosres.2019.02.009
Almazroui, M., Khalid, M. S., Islam, M. N., and Saeed, S. (2020). Seasonal and Regional Changes in Temperature Projections over the Arabian Peninsula Based on the CMIP5 Multi-Model Ensemble Dataset. Atmos. Res. 239, 104913. doi:10.1016/j.atmosres.2020.104913
Amin, A., Nasim, W., Fahad, S., Ali, S., Ahmad, S., Rasool, A., et al. (2018a). Evaluation and Analysis of Temperature for Historical (1996-2015) and Projected (2030-2060) Climates in Pakistan Using SimCLIM Climate Model: Ensemble Application. Atmos. Res. 213, 422–436. doi:10.1016/j.atmosres.2018.06.021
Amin, A., Nasim, W., Mubeen, M., Ahmad, A., Nadeem, M., Urich, P., et al. (2018b). Simulated CSM-CROPGRO-Cotton Yield under Projected Future Climate by SimCLIM for Southern Punjab, Pakistan. Agric. Syst. 167, 213–222. doi:10.1016/j.agsy.2017.05.010
Azmat, M., Qamar, M. U., Huggel, C., and Hussain, E. (2018). Future Climate and Cryosphere Impacts on the Hydrology of a Scarcely Gauged Catchment on the Jhelum River basin, Northern Pakistan. Sci. Total Environ. 639, 961–976. doi:10.1016/j.scitotenv.2018.05.206
Azmat, M., Wahab, A., Huggel, C., Qamar, M. U., Hussain, E., Ahmad, S., et al. (2020). Climatic and Hydrological Projections to Changing Climate under CORDEX-South Asia Experiments over the Karakoram-Hindukush-Himalayan Water Towers. Sci. Total Environ. 703, 135010. doi:10.1016/j.scitotenv.2019.135010
Baccini, M., Kosatsky, T., and Biggeri, A. (2013). Impact of Summer Heat on Urban Population Mortality in Europe during the 1990s: an Evaluation of Years of Life Lost Adjusted for Harvesting. PLoS ONE 8, e69638. doi:10.1371/journal.pone.0069638
Bao, Y., Hoogenboom, G., McClendon, R., and Urich, P. (2015). Soybean Production in 2025 and 2050 in the southeastern USA Based on the SimCLIM and the CSM-CROPGRO-Soybean Models. Clim. Res. 63, 73–89. doi:10.3354/cr01281
Chhin, R., and Yoden, S. (2018). Ranking CMIP5 GCMs for Model Ensemble Selection on Regional Scale: Case Study of the Indochina Region. J. Geophys. Res. Atmos. 123, 8949–8974. doi:10.1029/2017jd028026
Coppola, E., Nogherotto, R., Ciarlo', J. M., Giorgi, F., van Meijgaard, E., Kadygrov, N., et al. (2021). Assessment of the European Climate Projections as Simulated by the Large EURO‐CORDEX Regional and Global Climate Model Ensemble. J. Geophys. Res.-Atmos. 126, e2019JD032356. doi:10.1029/2019jd032356
D’Oria, M., Ferraresi, M., and Tanda, M. G. (2017). Historical Trends and High-Resolution Future Climate Projections in Northern Tuscany (Italy). J. Hydrol. 555, 708–723.
Feng, A., and Chao, Q. (2020). An Overview of Assessment Methods and Analysis for Climate Change Risk in China. Phys. Chem. Earth, Parts A/B/C 117, 102861. doi:10.1016/j.pce.2020.102861
Gomiero, A., Bellerby, R. G. J., Manca Zeichen, M., Babbini, L., and Viarengo, A. (2018). Biological Responses of Two marine Organisms of Ecological Relevance to On-Going Ocean Acidification and Global Warming. Environ. Pollut. 236, 60–70. doi:10.1016/j.envpol.2018.01.063
Guo, J., Huang, G., Wang, X., Wu, Y., Li, Y., Zheng, R., et al. (2020). Evaluating the Added Values of Regional Climate Modeling over China at Different Resolutions. Sci. Total Environ. 718, 137350. doi:10.1016/j.scitotenv.2020.137350
Guo, L.-Y., Gao, Q., Jiang, Z.-H., and Li, L. (2018). Bias Correction and Projection of Surface Air Temperature in LMDZ Multiple Simulation over central and Eastern China. Adv. Clim. Change Res. 9, 81–92. doi:10.1016/j.accre.2018.02.003
Harrison, M. T., Cullen, B. R., and Rawnsley, R. P. (2016). Modelling the Sensitivity of Agricultural Systems to Climate Change and Extreme Climatic Events. Agric. Syst. 148, 135–148. doi:10.1016/j.agsy.2016.07.006
Isobe, M. (2013). Impact of Global Warming on Coastal Structures in Shallow Water. Ocean Eng. 71, 51–57. doi:10.1016/j.oceaneng.2012.12.032
Jiang, C., Shaw, K. S., Upperman, C. R., Blythe, D., Mitchell, C., Murtugudde, R., et al. (2015). Climate Change, Extreme Events and Increased Risk of Salmonellosis in Maryland, USA: Evidence for Coastal Vulnerability. Environ. Int. 83, 58–62. doi:10.1016/j.envint.2015.06.006
Jiao, N.-Z., Chen, D.-K., Luo, Y.-M., Huang, X.-P., Zhang, R., Zhang, H.-B., et al. (2015). Climate Change and Anthropogenic Impacts on marine Ecosystems and Countermeasures in China. Adv. Clim. Change Res. 6, 118–125. doi:10.1016/j.accre.2015.09.010
Khan, N., Shahid, S., Ahmed, K., Wang, X., Ali, R., Ismail, T., et al. (2020). Selection of GCMs for the Projection of Spatial Distribution of Heat Waves in Pakistan. Atmos. Res. 233, 104688. doi:10.1016/j.atmosres.2019.104688
King, A. D., Knutti, R., Uhe, P., Mitchell, D. M., Lewis, S. C., Arblaster, J. M., et al. (2018). On the Linearity of Local and Regional Temperature Changes from 1.5°C to 2°C of Global Warming. J. Clim. Jcli-d- 31–7495.
Lewis, S. C., King, A. D., Perkins-Kirkpatrick, S. E., and Mitchell, D. M. (2019). Regional Hotspots of Temperature Extremes under 1.5 °C and 2 °C of Global Mean Warming. Weather Clim. Extremes 26, 100233. doi:10.1016/j.wace.2019.100233
Li, L., Yao, N., Li, Y., Liu, D. L., Wang, B., and Ayantobo, O. O. (20192019). Future Projections of Extreme Temperature Events in Different Sub-regions of China. Atmos. Res. 217, 150–164. doi:10.1016/j.atmosres.2018.10.019
Li, X., Clinton, N., Si, Y., Liao, J., Liang, L., and Gong, P. (2015). Projected Impacts of Climate Change on Protected Birds and Nature Reserves in China. Sci. Bull. 60, 1644–1653. doi:10.1007/s11434-015-0892-y
Lu, S., Bai, X., Zhang, X., Li, W., and Tang, Y. (2019). The Impact of Climate Change on the Sustainable Development of Regional Economy. J. Clean. Prod. 233, 1387–1395. doi:10.1016/j.jclepro.2019.06.074
Luo, Q., Li, S., Guo, Y., Han, X., and Jaakkola, J. J. K. (2019). A Systematic Review and Meta-Analysis of the Association between Daily Mean Temperature and Mortality in China. Environ. Res. 173, 281–299. doi:10.1016/j.envres.2019.03.044
Masson, D., and Knutti, R. (2011). Spatial-scale Dependence of Climate Model Performance in the CMIP3 Ensemble. J. Clim. 24 (11), 2680–2692. doi:10.1175/2011jcli3513.1
Mcleod, E., Poulter, B., Hinkel, J., Reyes, E., and Salm, R. (2010). Sea-level Rise Impact Models and Environmental Conservation: A Review of Models and Their Applications. Ocean Coastal Manag. 53, 507–517. doi:10.1016/j.ocecoaman.2010.06.009
Meehl, G. A., Washington, W. M., Collins, W. D., Arblaster, J. M., Hu, A., Buja, L. E., et al. (2005). How Much More Global Warming and Sea Level Rise. Science 307, 1769–1772. doi:10.1126/science.1106663
Meyer, R. S., Cullen, B. R., Whetton, P. H., Robertson, F. A., and Eckard, R. J. (2018). Potential Impacts of Climate Change on Soil Organic Carbon and Productivity in Pastures of South Eastern Australia. Agric. Syst. 167, 34–46. doi:10.1016/j.agsy.2018.08.010
Mishra, A. K., Singh, V. P., and Jain, S. K. (2010). Impact of Global Warming and Climate Change on Social Development. J. Comp. Soc. Welfare 26, 239–260. doi:10.1080/17486831003687626
Mitchell, T. D., and Hulme, M. (1999). Predicting Regional Climate Change: Living with Uncertainty. Prog. Phys. Geogr. Earth Environ. 23, 57–78. doi:10.1177/030913339902300103
Nasim, W., Amin, A., Fahad, S., Awais, M., Khan, N., Mubeen, M., et al. (2018). Future Risk Assessment by Estimating Historical Heat Wave Trends with Projected Heat Accumulation Using SimCLIM Climate Model in Pakistan. Atmos. Res. 205, 118–133. doi:10.1016/j.atmosres.2018.01.009
Ng, E., and Ren, C. (2018). China's Adaptation to Climate & Urban Climatic Changes: A Critical Review. Urban Clim. 23, 352–372. doi:10.1016/j.uclim.2017.07.006
Onozuka, D., Gasparrini, A., Sera, F., Hashizume, M., and Honda, Y. (2019). Future Projections of Temperature-Related Excess Out-Of-Hospital Cardiac Arrest under Climate Change Scenarios in Japan. Sci. Total Environ. 682, 333–339. doi:10.1016/j.scitotenv.2019.05.196
Ozturk, T., Turp, M. T., Türkeş, M., and Kurnaz, M. L. (2018). Future Projections of Temperature and Precipitation Climatology for CORDEX-MENA Domain Using RegCM4.4. Atmos. Res. 206, 87–107. doi:10.1016/j.atmosres.2018.02.009
Pattnayak, K. C., Kar, S. C., Dalal, M., and Pattnayak, R. K. (2017). Projections of Annual Rainfall and Surface Temperature from CMIP5 Models over the BIMSTEC Countries. Glob. Planet. Change 152, 152–166. doi:10.1016/j.gloplacha.2017.03.005
Ramachandran, A., Saleem Khan, A., Palanivelu, K., Prasannavenkatesh, R., and Jayanthi, N. (2017). Projection of Climate Change-Induced Sea-Level Rise for the Coasts of Tamil Nadu and Puducherry, India Using SimCLIM: a First Step towards Planning Adaptation Policies. J. Coast. Conserv. 21, 731–742. doi:10.1007/s11852-017-0532-6
Riahi, K., Rao, S., Krey, V., Cho, C., Chirkov, V., Fischer, G., et al. (2011). RCP 8.5 – A Scenario of Comparatively High Greenhouse Gas Emissions. Clim. Change 109 (1-2), 33. doi:10.1007/s10584-011-0149-y
IPCC (2014). “Core Writing Team,” in Climate Change 2014: Synthesis Report Contribution of Working Groups I, II and III to the Fifth Assessment Report of the Intergovernmental Panel on Climate Change. Editors R.K. Pachauri, and L.A. Meyer (Geneva, Switzerland: IPCC).
Salman, S. A., Shahid, S., Ismail, T., Ahmed, K., and Wang, X.-J. (2018). Selection of Climate Models for Projection of Spatiotemporal Changes in Temperature of Iraq with Uncertainties. Atmos. Res. 213, 509–522. doi:10.1016/j.atmosres.2018.07.008
Santer, B. D., Wigley, T. M. L., Schlesinger, M. E., and Mitchell, J. F. B. (1990). Developing Climate Scenarios from Equilibrium GCM Results. Report No. 47 (Hamburg, Germany: Max Planck Institute für Meteorologie).
Shi, C., Jiang, Z.-H., Chen, W.-L., and Li, L. (2018). Changes in Temperature Extremes over China under 1.5 °C and 2 °C Global Warming Targets. Adv. Clim. Change Res. 9, 120–129. doi:10.1016/j.accre.2017.11.003
IPCC (2013). in Climate Change 2013: The Physical Science Basis. Contribution of Working Group I to the Fifth Assessment Report of the Intergovernmental Panel on Climate Change. Editors T.F. Stocker, D. Qin, G.K. Plattner, M. Tignor, S.K. Allen, J. Boschunget al. (Cambridge and New York: Cambridge University Press).
Trisurat, Y., Aekakkararungroj, A., Ma, H.-o., and Johnston, J. M. (2018). Basin-wide Impacts of Climate Change on Ecosystem Services in the Lower Mekong Basin. Ecol. Res. 33, 73–86. doi:10.1007/s11284-017-1510-z
Ullah, S., You, Q., Zhang, Y., Bhatti, A. S., Ullah, W., Hagan, D. F. T., et al. (2020). Evaluation of CMIP5 Models and Projected Changes in Temperatures over South Asia under Global Warming of 1.5 oC, 2 oC, and 3 oC. Atmos. Res. 246, 105122. doi:10.1016/j.atmosres.2020.105122
van Vuuren, D. P., Edmonds, J., Kainuma, M., Riahi, K., Thomson, A., Hibbard, K., et al. (2011). The Representative Concentration Pathways: an Overview. Climatic Change 109, 5–31. doi:10.1007/s10584-011-0148-z
Wang, L., Huang, G., Zhou, W., and Chen, W. (2016). Historical Change and Future Scenarios of Sea Level Rise in Macau and Adjacent Waters. Adv. Atmos. Sci. 33, 462–475. doi:10.1007/s00376-015-5047-1
Wang, X., Hou, X., and Wang, Y. (2017a). Spatiotemporal Variations and Regional Differences of Extreme Precipitation Events in the Coastal Area of China from 1961 to 2014. Atmos. Res. 197, 94–104. doi:10.1016/j.atmosres.2017.06.022
Wang, X., Jiang, D., and Lang, X. (2017b). Future Extreme Climate Changes Linked to Global Warming Intensity. Sci. Bull. 62, 1673–1680. doi:10.1016/j.scib.2017.11.004
Warrick, R. A. (2009). Using SimCLIM for Modelling the Impacts of Climate Extremes in a Changing Climate: A Preliminary Case Study of Household Water Harvesting in Southeast Queensland. Cairns, Australia: 18th World IMACS/MODSIM Congress, 2583–2589.
Warrick, R., Ye, W., Kouwenhoven, P., Hay, J. E., and Cheatham, C. (2005). “New Developments of the SimCLIM Model for Simulating Adaptation to Risks Arising from Climate Variability and Change,” in International Congress on Modelling and Simulation (MODSIM05), Melbourne, Australia, 551–558.
Xu, C., and Xu, Y. (2012). The Projection of Temperature and Precipitation over China under RCP Scenarios Using a CMIP5 Multi-Model Ensemble. Atmos. Oceanic Sci. Lett. 5 (6), 527–533.
Yang, F., Chou, J., Dong, W., Sun, M., and Zhao, W. (2020). Adaption to Climate Change Risk in Eastern China: Carbon Emission Characteristics and Analysis of Reduction Path. Phys. Chem. Earth, Parts A/B/C 115, 102829. doi:10.1016/j.pce.2019.102829
Yao, Y., Yong, L., and Jian-Bin, H. (2012). Evaluation and Projection of Temperature Extremes over China Based on CMIP5 Model. Adv. Clim. Change Res. 3 (4), 179–185. doi:10.3724/sp.j.1248.2012.00179
You, Q., Min, J., Fraedrich, K., Zhang, W., Kang, S., Zhang, L., et al. (2014). Projected Trends in Mean, Maximum, and Minimum Surface Temperature in China from Simulations. Glob. Planet. Change 112, 53–63. doi:10.1016/j.gloplacha.2013.11.006
Zhang, D.-F., Han, Z.-Y., and Shi, Y. (2017). Comparison of Climate Projections between Driving CSIRO-Mk3.6.0 and Downscaling Simulation of RegCM4.4 over China. Adv. Clim. Change Res. 8, 245–255. doi:10.1016/j.accre.2017.10.001
Zhang, L., Zhao, Y., Hein-Griggs, D., Janes, T., Tucker, S., and Ciborowski, J. J. H. (2020). Climate Change Projections of Temperature and Precipitation for the great lakes basin Using the PRECIS Regional Climate Model. J. Great Lakes Res. 46, 255–266. doi:10.1016/j.jglr.2020.01.013
Keywords: temperature projection, CMIP5 GCMs, RCPs, coastal area of China, SimCLIM
Citation: Wang X, Hou X, Piao Y, Feng A and Li Y (2021) Climate Change Projections of Temperature Over the Coastal Area of China Using SimCLIM. Front. Environ. Sci. 9:782259. doi: 10.3389/fenvs.2021.782259
Received: 24 September 2021; Accepted: 29 October 2021;
Published: 06 December 2021.
Edited by:
Patrick Laux, Karlsruhe Institute of Technology (KIT), GermanyReviewed by:
Muhammad Mubeen, COMSATS University Islamabad, Vehari Campus, PakistanDildar Hussain Kazmi, Pakistan Meteorological Department, Pakistan
Copyright © 2021 Wang, Hou, Piao, Feng and Li. This is an open-access article distributed under the terms of the Creative Commons Attribution License (CC BY). The use, distribution or reproduction in other forums is permitted, provided the original author(s) and the copyright owner(s) are credited and that the original publication in this journal is cited, in accordance with accepted academic practice. No use, distribution or reproduction is permitted which does not comply with these terms.
*Correspondence: Xiyong Hou, eHlob3VAeWljLmFjLmNu