 Michele Melchiorri
- European Commission, Joint Research Centre (JRC), Ispra, VA, Italy
Monitoring of sustainable development goals (SDGs) requires a wealth of updated, reliable, and comparable data on planet Earth with respect to societal activities and society–environment interactions. Despite the massive big-data archives available today, salient data are missing for key thematic domains and geographical areas. Even for cities, which are the most prominent manifestations of human agglomeration, the data are scarce, sectoral, and scattered. Earth observation may help reconcile the disparities between data-rich and data-poor territories. The Global Human Settlement Layer (GHSL) project of the European Commission has generated an open-source global dataset on cities—the GHSL Urban Centre Database (GHS-UCDB). This database describes more than 10,000 Urban Centres in 2015, with their locations, extent, and sets of geographical, socio-economic, and environmental attributes, as well as multi-temporal data records (covering a time span of up to 40 years) (Figure 6). The database combines information extracted from satellite imagery with physical and socio-economic information from several voluminous and heterogeneous sources provided by researchers and institutions as open geospatial data. The paradigm introduced with the GHS-UCDB relies on massive geospatial data integration and harmonisation conducted in the GIS environment (mainly via spatial joins and zonal statistics). The range and depth of geospatial and statistical variables in this dataset represent a new standard foundation for information on cities—more than doubling the number of cities usually reported by international organisations and offering the capacity to understand dynamics, e.g., on population, greenness, economic productivity, night-time light, and pollutant emissions. Moreover, the database offers the basis to estimate SDG indicators and other essential variables for the Post 2015 Development Agenda.
Introduction
Early in the 21st century, international organisations have recognised that the global population has become predominantly urban and that cities generate most of the global gross domestic product (GDP), accounting for the majority of the global greenhouse gas emissions (Dulal and Akbar, 2013). While cities and urban areas have consolidated as key nodes of the global economy, innovation, demographic changes, and societal development (Lin and Mele, 2013), data on cities are often inadequate to quantify and analyse the dynamics, so a paradigm shift has been advocated for urban science (Acuto et al., 2018; Lobo et al., 2020).
The primary source of global data on cities is the World Urbanization Prospects (WUP) compiled periodically by the United Nations Department of Economic and Social Affairs (UNDESA) based on data collected by the member states. The WUP includes about 1,800 cities—urban agglomerations with a population of at least 300,000 inhabitants—and primarily reports demographic indicators in combination with city name and geographic location (latitude and longitude point location). The WUP is released as a statistical table (in MS Excel format). Other population-derived variables are also reported in the WUP, i.e., number of cities per country, region of the world, and analysis-ready data arrangements (i.e., proportion of national population residing in the agglomeration, number of cities by size and country, and average annual rate of demographic change). Most of the intergovernmental reports on urban areas are based on the WUP and UNDESA data. These bodies of knowledge include the UN-Habitat World Cities Report, State of the World’s Cities (series and regional series), and the most impactful scholarly research on urbanisation (Bettencourt, 2013; Montgomery, 2008; Seto et al., 2012) is also based on the above data. These studies have demonstrated the urban population transitions, provided evidence for the relationships between population and GDP of cities, and shown the potential impacts of urban expansion on biodiversity by 2030. However, the WUP is not comprehensive enough in terms of geographical coverage and thematic information to serve as a source for multi-thematic and multi-dimensional studies as well as transformative development policies. Moreover, it mostly neglects the spatially explicit approach beyond city location (point coordinates, whereas many studies require city extents). Thematic data on cities are often produced or collected ad hoc by researchers, which limits the uptake of such data due to limitations in scale (geographical coverage), time (temporal coverage and update frequency), and methodology (update cost, comparative analysis suitability, accuracy etc.); moreover, when such data are produced, they are frequently scattered across different institutional or academic repositories. All of these factors limit the potential uses of these data.
A significant attempt to provide systematically collected data on cities and their changes over time across spatial and thematic variables was carried out at New York University with the Global Sample of Cities and Atlas of Urban Expansion (Angel et al., 2016). The Global Sample of Cities comprises 200 cities identified from a larger set (Universe of Cities with 4,231 cities, each having 100,000 inhabitants or more) by a sampling methodology based on world regions, population size categories, and number of cities in a country (Figure 1B). For the cities in the sample, the Atlas of Urban Expansion reports demographic and spatial-morphological indicators to characterise urban expansion for the period of 1990–2014. The attributes include population (number of inhabitants), urban extent (surface), built-up area density, composition of added area (built-up area by expansion typology), roads (share of built-up area occupied by roads and boulevards, average street width, density of the road network, and proximity—walking distance), and block metrics (average block sizes, residential land use settlements, and average plot sizes). Despite the Sample of Cities being one of the main attempts to systematise information on cities in a coherent dataset, its production involves expensive data collection, image interpretation, and data digitalisation by experts. Moreover, by limiting the collection indicators to a restricted sample of (representative) cities, one cannot exclude the fact that the selected cities are addressed based on specific interventions to become national champions, thereby biasing representativeness.
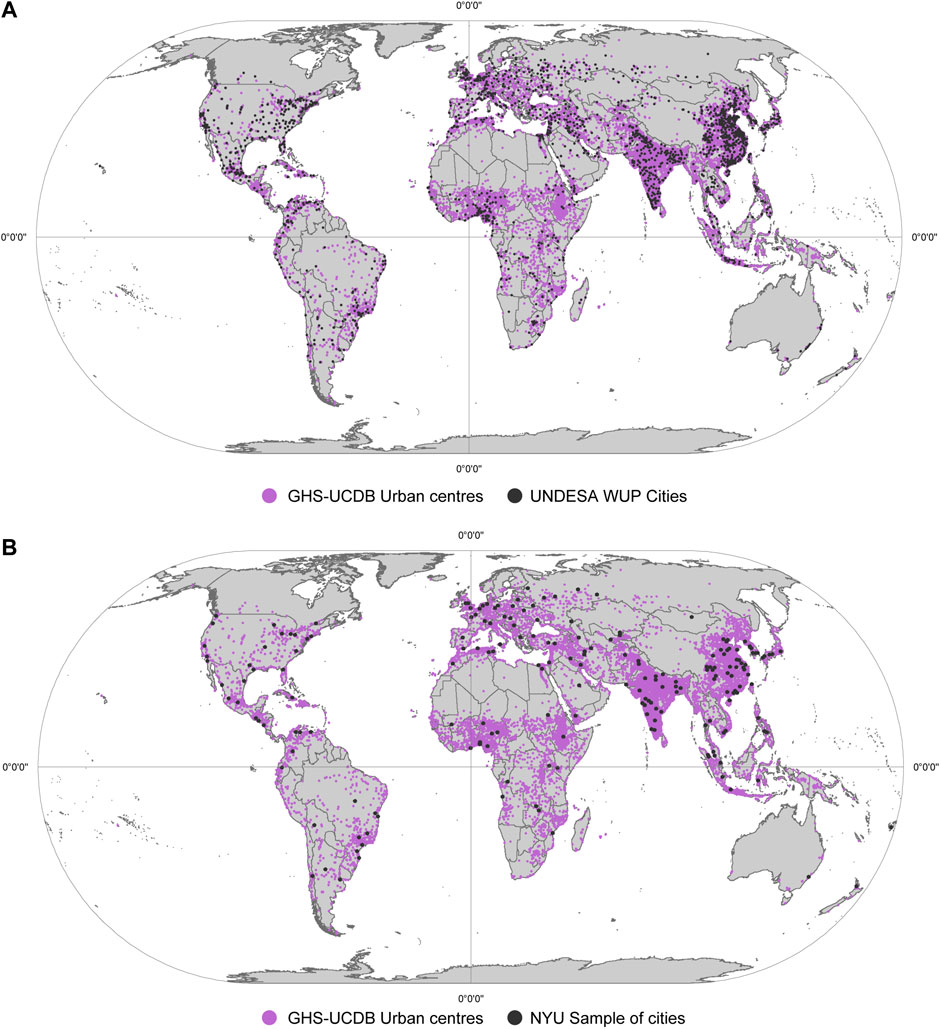
FIGURE 1. Comparison of the geographical distribution of the cities included in the main databases on cities: (A) UNDESA World Urbanization Prospects (2018) and GHS Urban Centre Database (2019); (B) NYU Global Sample of Cities (2016) and GHS Urban Centre Database (2019). Existing datasets on cities vary significantly in terms of geographical coverage (number of records) and thematic richness.
The entanglement between an ambitious monitoring schema in the 2030 Development Agenda and its thematic agreements (Sendai Framework for Disaster Risk Reduction, New Urban Agenda, and Paris Agreement) determines the clear need for data on cities beyond the morphological and demographic indicators. Early in the negotiation process, the United Nations General Assembly was presented with the shortcomings affecting data availability (UNSDSN,2015). In the sustainable development goals (SDGs) year zero (2015), substantial data gaps were noted, where 81 indicators were considered under Tier I,1 57 were under Tier II,2 and 88 were under Tier III.3 Although significant progress has been made since then, in 2019, about half the SDG indicators remained classified under Tier II or Tier III.
The data shortcomings fall into four main categories: those affecting geographical coverage (completeness), those concerning temporal availability (update/obsolescence, and time series), those based on thematic information and semantics, and those involving aggregation/disaggregation of records. The 2030 Development Agenda requires a wealth of data that must be compatible across different regions globally to enable comparison, have global coverage to enable monitoring of all territories, have local details, and be available over an extended period of time. Traditional sources of statistical information were reported to be inadequate (UN Statistical Commission, 2017) across countries with heterogeneous statistical capacities and income/development conditions. The Earth observation (EO) sector and technologies to extract and process data (i.e., information extraction from satellite imagery, geographic information systems) are key resources to collect information over wide geographical areas and repeatedly over time at relatively low marginal costs, and they can contribute substantially to filling the present data gaps or providing effective solutions for SDG monitoring (Andries et al., 2018; Arundel, 2020).
The understanding of the process of urbanisation and capacity to monitor the progress in meeting the SDGs requires large-scale open, reliable, and local but globally comparable data as well as a full-fledged data revolution. New sources of information, like EO, big data, and gridded geospatial data can offer support to transformative policies with new information that are planetary and multi-temporal in coverage, fine scale in detail, as well as open and free for access (Melchiorri et al., 2019a). It is in the above framework and auspices that the European Commission’s Joint Research Centre (JRC) has developed a suite of (open and free) data and tools named the Global Human Settlement Layer (GHSL). The GHSL maps human presence on Earth, sourcing information from 1975 and up to 2030 by delineating built-up areas and population distribution as well as classifying settlement typologies. To improve the science for policy support to the European Commission Directorate Generals and Services (especially DG-REGIO, DG-ECHO, DG-INTPA, and EEAS among the others) and as support to the United Nations system (specifically UN-Habitat, UNDRR, and FAO), the GHSL has developed a new product called the Urban Centre Database (GHS-UCDB).
The GHS-UCDB is a dataset on cities and has global coverage (Figure 1A), has multi-temporal and multi-thematic information, and is designed so as to ensure spatial and temporal harmonisation of information. Cities are delineated in a spatially consistent manner across territories by deploying the Degree of Urbanisation method (Dijkstra et al., 2020) that adopts population density and size in combination with the geospatial concept of grid cell contiguity to define urban centres (Figure 2). The application of the Degree of Urbanisation to the entire globe is based on the GHSL multi-temporal built-up areas (GHS-BUILT), population (GHS-POP), and settlement typology (GHS-SMOD) layers that are available for the period of 1975–2030 with 5-year intervals. The GHSL geospatial data are structured in grid format (raster.tif files) (Florczyk et al., 2019b). The Degree of Urbanisation was endorsed in 2020 by the United Nations Statistical Commission as method to delineate urban and rural areas for international statistical comparisons (UN Statistical Commission, 2020). As a derived product, the GHS-UCDB contains more than 10,000 urban centres (human settlements with a population of at least 50,000 people) for the year 2015; these spatial units (whose surfaces vary from a few to few thousands of square kilometres) are characterised using more than 150 attributes; the data are available in statistical tables and as geospatial layers (to be handled in the Geographic Information System (GIS) software) and are released as open and free data (Florczyk et al., 2019a).
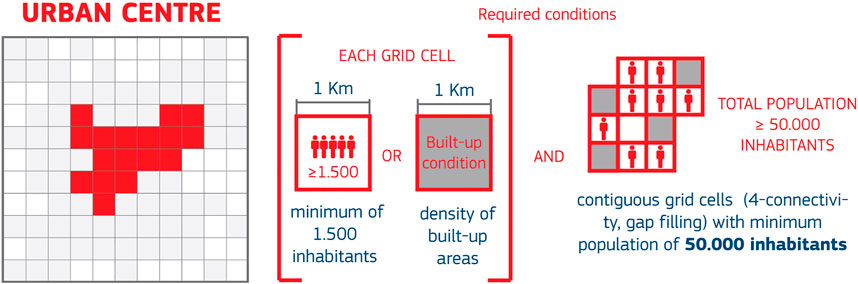
FIGURE 2. Schema representing an abstract urban centre in the grid cell environment to illustrate population size, density, and built-up area density criteria to define urban centres.
In this article, we present the characteristics and salience of the GHS-UCDB as a new and standard source of key information for analysis of cities; we also demonstrate policy areas that are supported by the database. The GHS-UCDB is a considerable advancement in the field for the following reasons:
• It extends the list of records (i.e., number of cities) to more than 10,000 unique human settlements of at least 50,000 inhabitants each;
• It expands the number and thematic domain of attributes for each record (to include environmental, socio-economic, geographic, and natural hazard exposure data, among others);
• It is based on open data, where a large part is obtained from a fusion of (big) Earth data derived by processing remotely sensed information;
• It aligns and harmonises information collection and reporting in homogeneous spatial units to enable comparisons and alignment of reporting between data-rich and data-poor territories.
Materials and methods
The GHS-UCDB includes data on more than 10,000 urban centres in 2015, with their locations, extent, and sets of geographical, socio-economic, and environmental attributes, with some being multi-temporal in nature (up to a time span of 40 years). The database combines information extracted from satellite imagery with physical and socio-economic information from several voluminous and heterogeneous sources. The database constitutes a significant advancement in global urban data reporting. The production of the GHS-UCDB was achieved mainly through a hierarchical composition of the GHSL baseline data and integration of other datasets derived from the EO and statistical archives via geospatial processing (zonal statistics and spatial joins) in the GIS environment.
The production of the GHS-UCDB constitutes the following principles:
• (spatial) Harmonisation of heterogeneous data;
• Integration of data from different sources;
• Management (handling and processing) of complex/unstructured data;
• Quality control.
Big Earth data frameworks and processes have produced increasingly large amounts of information owing to the availability of new sensors, processing techniques, and information technology capacities (Guo, 2017). The significant contribution to the domain of urban data reporting implemented in the GHS-UCDB is a systematic process of spatial integration of the heterogeneous data resulting from delineation of homogeneous spatial units (i.e., urban centres). The urban centres are the highest tier settlement typology identified in the Degree of Urbanisation (Dijkstra et al., 2020) and operationalised with GHSL data (GHS-BUILT and GHS-POP into GHS-SMOD).
The urban centres implemented in the current GHSL settlement model (GHS-SMOD) formulation are defined as ‘spatially generalised high-density clusters of contiguous grid cells of 1 km2 with a density of at least 1,500 inhabitants per km2 of land surface or at least 50% built-up surface share per km2 of land surface, and a minimum population of 50,000’, as shown in Figure 2 and formalised in the expression given below (Schiavina et al., 2022)4.
where Pdens: local population density lower bound ‘>’ (people/km2) = 1,000; Pmin: cluster population lower bound ‘>’ (people) = 50,000; Bdens: local share of built-up area lower bound ‘>’ (km2) = 0.5; Tcon: topological constraints = four-connectivity cluster.
On the basis of the more than 10,000 spatial units identified across the globe with the GHSL in 2015, geospatial data across different thematic areas were compiled and spatially harmonised. This operation is mostly implemented in the GIS environment through spatial joint and zonal statistics commands, which allow assignment of a certain feature to a spatial entity (urban centre) or calculation of a certain attribute within the spatial entity. Therefore, it is possible to handle geospatial data (raster in grid format or vector shapefiles), i.e., sum the grid-based PM2.5 emission layer at the grid level. In addition to the harmonisation of heterogeneous data, the GHS-UCDB was achieved by integrating data from different sources, especially the European Commission Directorate General Joint Research Centre data products, such as the Emission Database for Global Atmospheric Research, World Soil Database, and Global Flood Awareness System, and data from other institutions like the OECD (for the PM2.5 attribute). The thorough process of data integration as well as rigorous metadata collection and documentation are contained in a dedicated JRC Scientific Information System and Database report (Florczyk et al., 2019a), which serves as a reference for any use of the GHS-UCDB, as it comprehensively lists the metric, its source, temporal coverage, and additional notes for each attribute. The construction of the GHS-UCDB was achieved by handling and processing massive data archives (i.e., normalised difference vegetation index (NDVI) as well as average annual precipitation and temperature over 3 decades) with global coverage, many of which differ in terms of cartographic specifications (i.e., scale and generalisation). Lastly, the GHS-UCDB has undergone quality control checks. Visual inspection of the urban centres was performed to discern between valid urban centres (Figure 3) and false positives identified by the Degree of Urbanisation definition applied to the GHSL baseline data. A specific field in the database indicates whether the urban centre is a true positive, uncertain, or false positive entry.
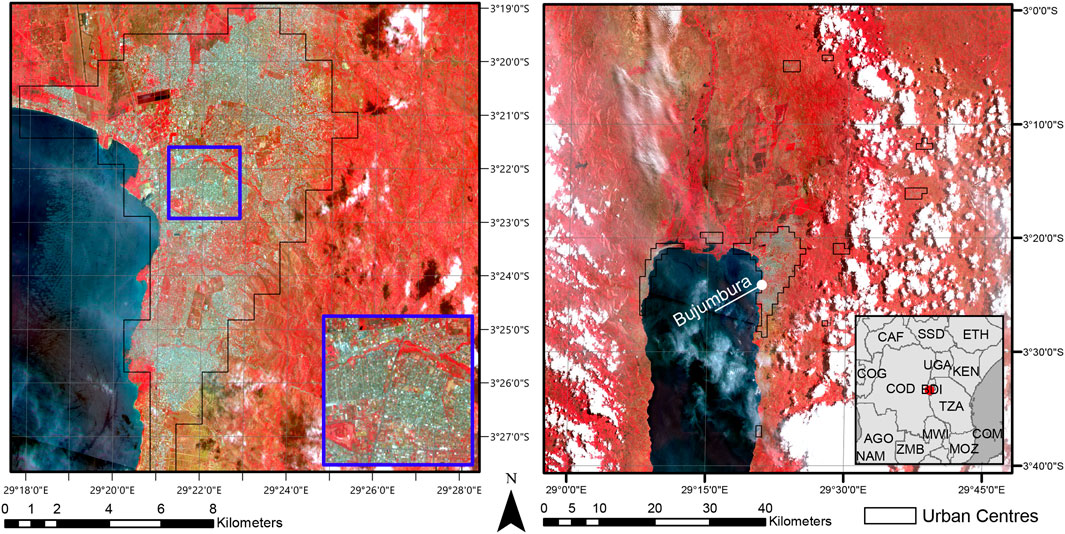
FIGURE 3. Example of urban centre delineation (delineation with the 1 km grid in black) and magnification of the morphological structure (extract in blue, showing an area of 3 × 3 km) derived from Copernicus Sentinel-2 10 m optical satellite imagery in the area of the Bujumbura (Burundi). Copernicus Sentinel data acquired in 2022 and displayed in false color composite using near infrared, red and green bands. Retrieved from SentinelHub in July 2022, processed by ESA.
Results
The results of data processing, integration, and harmonisation are compiled into the GHS-UCDB, which is available as a geospatial layer for GIS (shapefile), as a statistical database (spreadsheet), and in a web platform for visualisation and analytics5.
Database
The database (both shapefile and spreadsheet versions) includes 13,136 urban centres and 159 attributes organised into seven main dimensions (Table 1). The database is accessible on the JRC Open Data Catalogue and is comprehensively documented with technical descriptions.
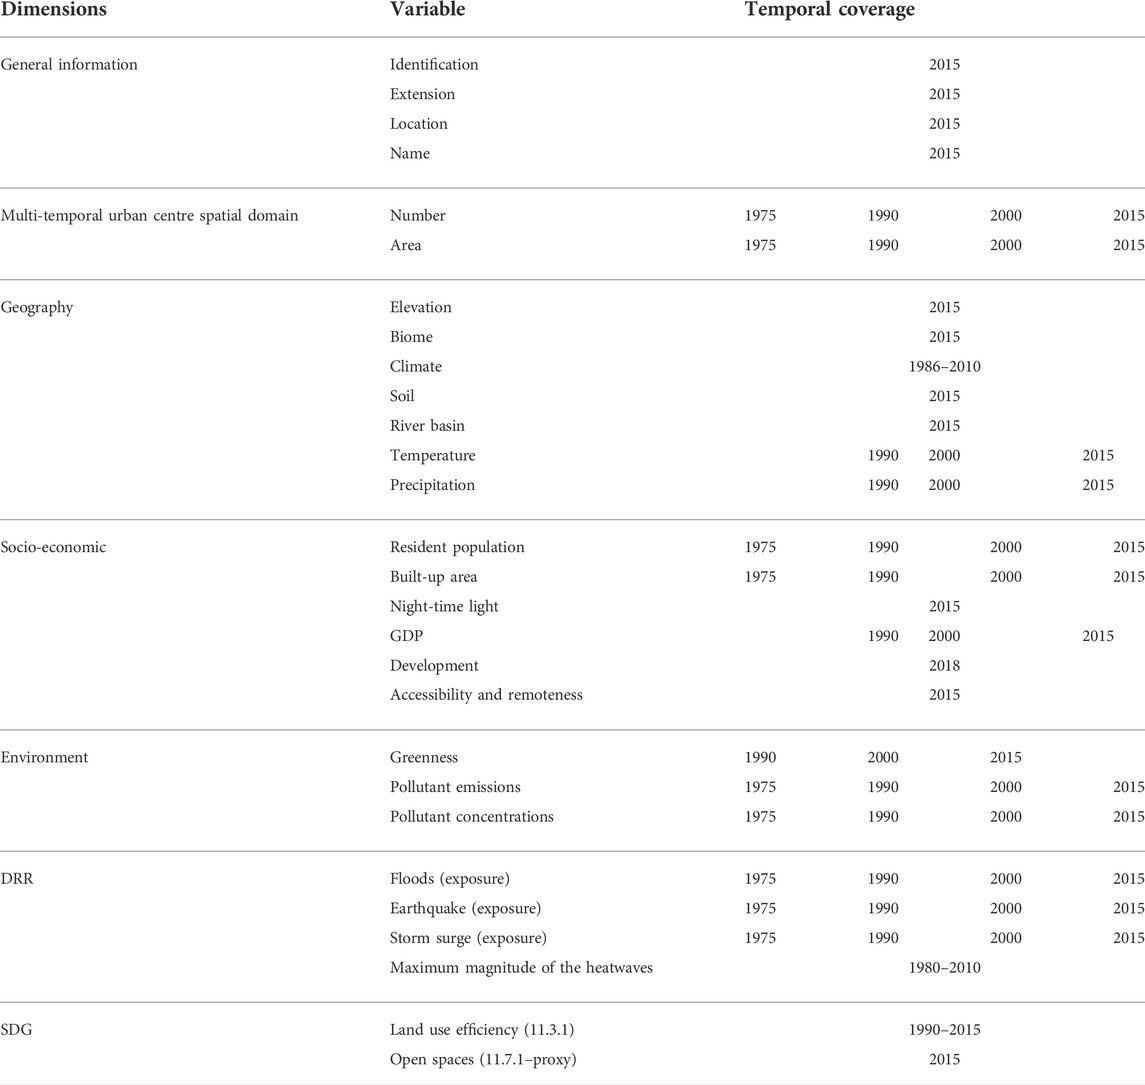
TABLE 1. Overview of the dimensions and variables in the Urban Centre Database 2015 and their temporal extent.
Urban centre profiles
Accompanying the GHS-UCDB, the urban centre profiles hosted in the GHSL website serve as analytical and dissemination tools for the database (Figure 4). The urban centre profiles include a selection of the GHS-UCDB variables grouped into six thematic areas, namely characteristics, geography, socio-economic, environment, exposure and hazard, and SDG, as explored in the Atlas of the Human Planet 2018 ‘a world of cities’ (European Commission Joint Research Centre, 2021) to analyse the diverse development trajectories that characterise urban centres across the globe. While the GHS-UCDB is most useful for comprehensive and aggregate analyses, the urban centre profiles mainly serve as single or case study city analyses that enable comparative studies on several thematic domains (i.e., trends in pollutant emissions, changes in vegetate surfaces, ranks of accessibility, and efficiency in land usage).
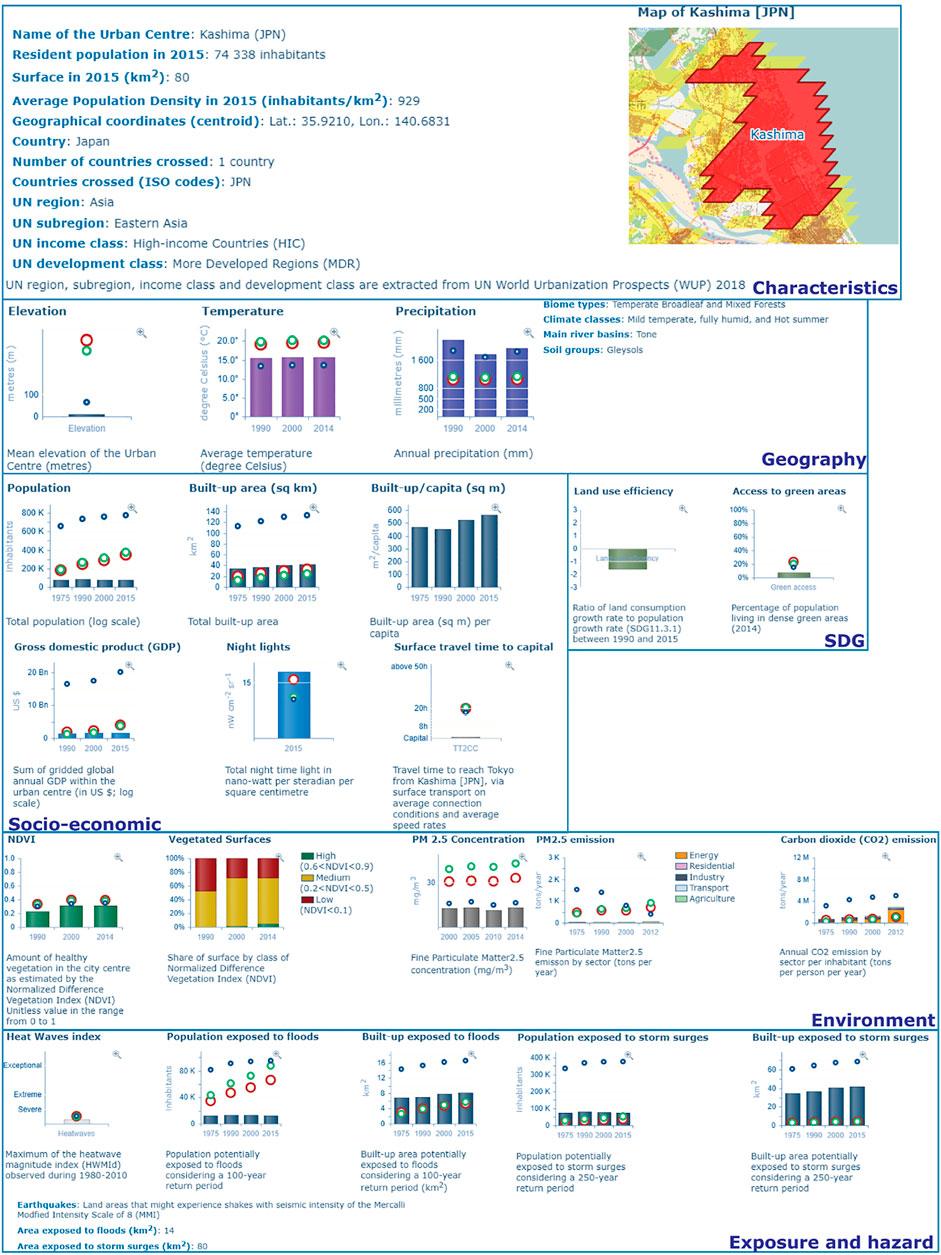
FIGURE 4. Comprehensive overview of the GHS-UCDB list of information provided in the urban centre profile of Kashima (Japan). The profiles available for all 10,000 plus urban centres display a selection of data and analytics.
Discussion
The multi-thematic attributes in the GHS-UCDB and GHSL suite of products and tools ensure scientific support to policy, especially in the framework of the 2030 Development Agenda (Figure 5) (Ehrlich et al., 2021; European Commission Joint Research Centre, 2021). Moreover, the open data and fair data paradigms (findability, accessibility, interoperability, and reusability) allow researchers to interact with the datasets as both users and producers. This section explains the selected applications of the GHS-UCDB to source quantitative data to support international agreements related to the 2030 Development Agenda and discusses the advantages of the open data policy intertwined in the GHS-UCDB.
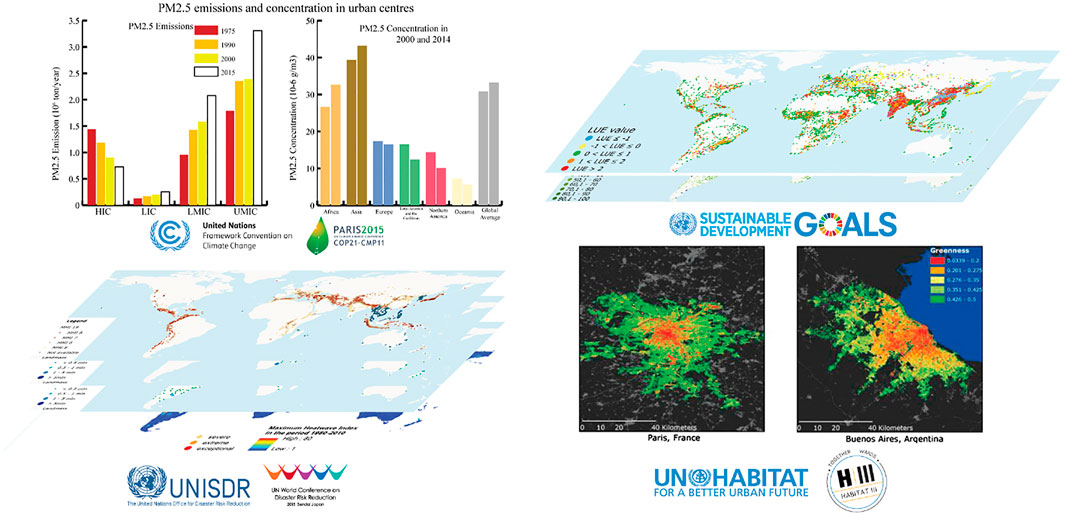
FIGURE 5. Examples of GHS-UCDB applications in service to the 2030 Development Agenda and thematic agreement. From top left, environment variables support the monitoring of pollutant emissions and concentrations in urban centres over time (serving the Paris COP21 agreement: UNFCCC); top right, land consumption to population growth rate (SDG 11.3.1); bottom right, access to green areas (proxy SDG 11.7.1) by the UN General Assembly and UNSDSN; bottom left, built-up areas and population exposure to natural hazards to support disaster risk reduction (Sendai Framework for Disaster Risk Reduction: UNISDR).
The wide thematic domains covered by the GHS-UCDB allow filling of significant gaps in urban data reporting (and harmonisation) on cities. With the GHS-UCDB, it is possible to study several aspects of cities and their trends over time. The GHS-UCDB variables in the environment section (PM2.5 and CO2 emissions, which are also available by sector, and PM2.5 concentration) support the establishment of a knowledge base for the uptake of the United Nations Framework Convention on Climate Change (UNFCCC) agreement at COP21. Half of the PM2.5 emissions in cities in 2015 were attributed to industrial sources, whose emissions exceeded 3 million tonnes/year. Emissions in urban centres from industrial sources increased by 40% between 2000 and 2012. Emissions across income classes are very diverse, so that only the high-income countries have achieved reduced PM2.5 emissions (by about 40%) over the period of 1975–2012. The low-income countries increased total emissions by 50%, led by almost doubling of those from the transport sector, increasing those from the residential sector by ¾, and those from the industrial sources by 1/3 (Crippa et al., 2021).
The GHS-UCDB variables in the disaster risk reduction (DRR) dimension are particularly salient for achieving progress towards the Sendai Framework for DRR priority 1 ‘understanding disaster risk’ with information on the exposure of urban centre residents and assets to natural hazards. For example, the European region accounts for the highest share of population living in cities affected by one or more heatwaves over the last 30 years. Information of this kind is key for the National Health Services, other services, and respondents or decision makers as heatwaves are likely to occur repeatedly over time. The thematic richness of the variables in the DRR domain of the GHS-UCDB, which includes several exposure layers intersected with urban centre outlines as well as population and built-up area data, identify that large cities in the developing world that are exposed to earthquakes are growing faster in terms of population than those in high-income countries, so these cities require particular measures for zoning and building codes to adequately manage risks and vulnerability. The total urban centre population potentially exposed to storm surges in Asia exceeds 250 million, indicating that urbanisation in the coastal areas is posing new threats along with development—this trajectory is of great concern in the Sendai Framework.
The GHSL geospatial information (i.e., built-up area grids or GHS-BUILT) combined with additional variables, i.e., NDVI, is used to quantify and characterise the presence of greenness within urban centres (Corbane et al., 2018). The measure of greenness in cities is a proxy for the SDG 11.7.1 (Tier III indicator). Analytics on access to green spaces indicate that cities in North America have the highest share of population living in high-greenery areas (50.6% of urban population) but have a low share of open spaces (58.8%) compared to cities in other regions of the world. Different factors play a role in the uneven accessibility to open and green spaces: regional climate conditions, topographic factors, and vegetation types among others. Urban planning policies are likely to have significant influences on urban green spaces as well as morphologies of cities, their populations, and their built-up areas. To obtain a better understanding of the regional disparities in access to green and open spaces, not only should the aforementioned factors be analysed but also the quality of green spaces and categories of open spaces must be taken into consideration for more informed decisions and inclusive policies.
The GHS-UCDB constitutes a platform for cooperation, both from and to the crowd. Most variables included in the database are independently produced by researchers and institutions and have been aggregated by the JRC in the urban centre spatial entities. After the release of the dataset, researchers have used the dataset in several studies, including those on sprawl (Gerten et el., 2019), relationship between population and city size (Randolph and Deuskar, 2020), and interplay between urbanisation and human life (Rader et al., 2020; Romanello et al., 2021; Southerland et al., 2022). In parallel, other researchers have independently produced additional variables for the urban centre spatial entities, thus establishing a feedback loop for future updates of the dataset. An example of this kind is the global estimation of the urban population exposure to extreme heat (Tuholske et al., 2021).
With the GHS-UCDB framework, the GHSL has established a robust methodology to produce, aggregate, and distribute data for the most populated places on Earth. The GHS-UCDB enacts several essential principles of geospatial data production, including (spatial) harmonisation of heterogeneous data, integration of data from different sources, management (handling and processing) of complex/unstructured data, and quality control. These latter aspects are essential for the success of the dataset. Each of the urban centres has been visually inspected by experts for assignment of quality control parameters (Dijkstra et al., 2020; Florczyk et al., 2019a). With future updates to the dataset, which will rely on the availability of the built-up surfaces derived from the Sentinel-2 10 m data (Schiavina et al., 2022), the quality and thematic richness of the dataset will increase further. As showcased in the latest GHSL data release, it will be possible to observe the inner structures of settlements and discriminate between residential and non-residential neighbourhoods, among other features (Schiavina et al., 2022).
For the future update of the GHS-UCDB, based on a new set of GHSL baseline datasets produced under the Copernicus programme, the urban centres will have dynamic boundaries over time to suit a larger range of applications (Angel et al., 2021; Melchiorri et al., 2019b). The evolution of the urban centre database towards a dynamic boundary approach (i.e., period boundaries, whereas the urban centre extent is based on the settlement classification grid in each epoch in the GHS-SMOD layer) allows more specific calculations, as piloted in a study in New York (Melchiorri et al., 2019b). This approach has been exploited in policy studies by the OECD/EC and UN-Habitat (OECD and European Commission, 2020; Khor et al., 2022) to track the evolution of individual urban centres over time and identify population changes due to densification or expansion or to track the births and deaths, rural to urban transitions, and vice versa in the urban centres. This promising policy feedback coupled with the new Exposure Mapping Component of Copernicus6 that ensures production of global built-up surface layers with updates every 2 years can lead to recurrent updates of the database. As displayed in Figure 6, the availability of updates to the built-up layer can enable replication of the full production chain. A new release of the GHS-UCDB is expected by 2024.
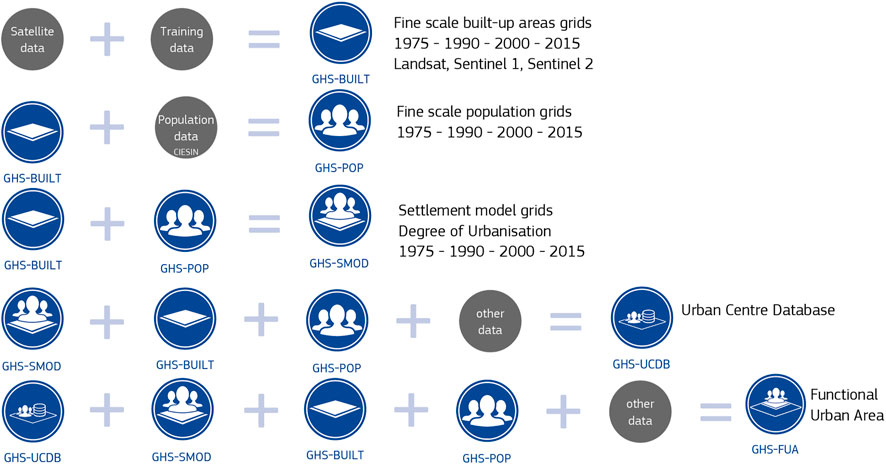
FIGURE 6. Hierarchical anatomy of the key information components and data processing/integration used to create the GHS-UCDB. Starting from satellite imagery and a training set to produce the GHS-BUILT, combination of GHS-BUILT with demographic information to produce GHS-POP, combination of GHS-BUILT and GHS-POP to produce the GHS-SMOD, and combination of the three layers as well as other satellite information and other datasets, the GHS-UCDB has been created and combination of the three layers as well as other satellite information and other datasets, to create the GHS-UCDB.
Conclusion
This article illustrates the need for information on cities that is multi-thematic, global in coverage, detailed in terms of spatial resolution, yet available to all and across territories as well as produced in a consistent manner to enable comparisons across cities. These information specifications are key for monitoring progress with regard to meeting the targets and auspices stressed in the 2030 Development Agenda. Information repositories available to date on cities include only demographic information (in the World Urbanization Prospects) for a significant number of cities (1,800 cities), with thematic information on urban expansion and its characteristics (mostly morphological and spatial ones) for 200 cities (in the Global Sample of Cities). However, the SDGs require information about the environment, living standards, accessibility, and exposure to natural hazards.
Owing to the advances in EO, big data processing, and increasing availability of Big Earth data as well as the consolidation of the Degree of Urbanisation as a viable harmonised definition for urban and rural areas for international statistical comparison as presented to the United Nations Statistical Commission in 2020 by six international institutions (the European Union, OECD, FAO, ILO, World Bank, and UN-Habitat), it has been possible to delineate urban centres (human settlements with a population of at least 50,000 inhabitants) to collect other information already available in the scientific community from these spatial units. Data across multiple thematic dimensions (geographical, socio-economic, and environmental information; hazard maps and others) were integrated in the GHS-UCDB to establish the most comprehensive database on cities available to date.
The aim of the initiative, encompassed in the Group on Earth Observation Human Planet Initiative, is to develop a new generation of measurements and information products that provide new scientific evidence and comprehensive understanding of the human presence on the planet to support global policy processes with agreed, actionable, and goal-driven metrics. Further progress is made possible by the open data policy enacted by the data producers, and future updates to the GHS-UCDB can benefit from the ever-growing amounts of georeferenced data on characterising urban centres.
Data availability statement
Publicly available datasets were analysed in this study. These data can be found here: https://data.jrc.ec.europa.eu/dataset/53473144-b88c-44bc-b4a3-4583ed1f547e.
Author contributions
MM conceptualised and wrote the paper.
Acknowledgments
The author is also grateful to the GHSL team for efforts devoted to the creation of the GHS-UCDB.
Conflict of interest
The author declares that the research was conducted in the absence of any commercial or financial relationships that could be construed as a potential conflict of interest.
Publisher’s note
All claims expressed in this article are solely those of the authors and do not necessarily represent those of their affiliated organizations, or those of the publisher, the editors and the reviewers. Any product that may be evaluated in this article, or claim that may be made by its manufacturer, is not guaranteed or endorsed by the publisher.
Author disclaimer
The designations employed and the presentations of materials and maps do not imply the expression of any opinion whatsoever on the part of the European Union concerning the legal status of any country, territory, or area or of its authorities, or concerning the delimitation of its frontiers or boundaries that if shown on the maps are only indicative. The boundaries and names shown on maps do not imply official endorsement or acceptance by the European Union. The views expressed herein are those of the author and do not necessarily reflect the views of the European Union.
Footnotes
1Tier I: Indicator conceptually clear, established methodology and standards available and data regularly produced by countries.
2Tier II: Indicator is conceptually clear, has an internationally established methodology and standards are available, but data are not regularly produced by countries.
3Tier III: No internationally established methodology or standards are yet available for the indicator, but methodology/standards are being (or will be) developed or tested.
4The seeds for the related spatial entity is obtained before morphological operations.
5https://ghsl.jrc.ec.europa.eu/ucdb2018visual.php
6Copernicus GHSL: https://ghsl.jrc.ec.europa.eu/copernicus.php
References
Acuto, M., Parnell, S., and Karen, C. (2018). Building a global urban science. Nat. Sustain. 1 (1), 2–4. doi:10.1038/s41893-017-0013-9
Andries, A., Morse, S., Murphy, R., Lynch, J., Woolliams, E., and Fonweban, J. (2018). Translation of Earth observation data into sustainable development indicators: An analytical framework. Sustain. Dev. 27, 366–376. doi:10.1002/sd.1908
Angel, S., Blei, A. M., Parent, J., Lamson-Hall, P., Galarza Sanchez, N., Civco, L., et al. (2016). Atlas of urban expansion the 2016 edition. New York, United States: New York University, UN-Habitat, and the Lincoln Institute of Land Policy.
Angel, S., Lamson-Hall, P., Blei, A., Shingade, S., and Kumar, S. (2021). Densify and expand: A global analysis of recent urban growth. Sustainability 13 (7), 3835. doi:10.3390/su13073835
Bettencourt, L. M. A. (2013). The origins of scaling in cities. Science 340 (6139), 1438–1441. doi:10.1126/science.1235823
Corbane, C., Pesaresi, M., Kemper, T., Politis, P., Florczyk, A. J., Syrris, V., et al. (2019). Automated global delineation of human settlements from 40 years of Landsat satellite data archives. Big Earth Data 3 (2), 140–169. doi:10.1073/pnas.2024792118
Crippa, M., Guizzardi, D., Pisoni, E., Solazzo, E., Antoine, G., Muntean, M., et al. (2021). Global anthropogenic emissions in urban areas: Patterns, trends, and challenges. Environ. Res. Lett. 16 (7), 074033. doi:10.1088/1748-9326/ac00e2
Dijkstra, L., Florczyk, A., Freire, S., Kemper, T., Melchiorri, M., Pesaresi, M., et al. (2020). Applying the degree of urbanisation to the globe: A new harmonised definition reveals a different picture of global urbanisation. J. Urban Econ. 125, 103312. doi:10.1016/j.jue.2020.103312
Dulal, H., and Akbar, S. (2013). Greenhouse gas emission reduction options for cities: Finding the ‘coincidence of agendas’ between local priorities and climate change mitigation objectives. Habitat Int. 38, 100–105. doi:10.1016/j.habitatint.2012.05.001
Ehrlich, D., Freire, S., Melchiorri, M., and Kemper, T. (2021). Open and consistent geospatial data on population density, built-up and settlements to analyse human presence, societal impact and sustainability: A review of ghsl applications. Sustainability 13 (14), 7851. doi:10.3390/su13147851
European Commission. Joint Research Centre (2021). Atlas of the human planet 2020: Open geoinformation for research, policy, and action. Luxembourg: Publications Office of the European Union. Available at: https://data.europa.eu/doi/10.2760/16432.
Florczyk, A. J., Corbane, C., Ehrlich, D., Freire, S., Kemper, T., Maffenini, L., et al. (2019a). GHSL data package 2019. JRC117104. Luxembourg: Publications Office of the European Union. doi:10.2760/729240
Florczyk, A., Melchiorri, M., Corbane, C., Schiavina, M., Maffenini, L., Pesaresi, M., et al. (2019b). Description of the GHS urban centre database 2015. JRC114316. Luxembourg: Publications Office of the European Union. doi:10.2760/037310
Gerten, C., Fina, S., and Rusche, K. (2019). The sprawling planet: Simplifying the measurement of global urbanization trends. Front. Environ. Sci. 7, 140. doi:10.3389/fenvs.2019.00140
Giles-Corti, B., Melanie, L., and Arundel, J. (2020). Achieving the SDGs: Evaluating indicators to Be used to benchmark and monitor progress towards creating healthy and sustainable cities. Health Policy 124 (6), 581–590. doi:10.1016/j.healthpol.2019.03.001
Guo, Huadong (2017). Big Earth data: A new frontier in Earth and information sciences. Big Earth Data 1 (1–2), 4–20. doi:10.1080/20964471.2017.1403062
Khor, N., Arimah, B., Otieno, R., van Oostrum, M., Mutinda, M., Oginga Martins, J., et al. (2022). World cities report 2022: Envisaging the future of cities. Nairobi, Kenya: United Nations Human Settlements Programme. Available at: https://unhabitat.org/sites/default/files/2022/06/wcr_2022.pdf.
J. Lin, and C. Mele (Editors) (2013). The urban sociology reader; routledge urban reader series. 2edn (London: Routledge).
Lobo, J., Alberti, M., Allen-Dumas, M., Arcaute, E., Barthelemy, M., Luis, A., et al. (2020). Urban science: Integrated theory from the first cities to sustainable metropolises. SSRN J. doi:10.2139/ssrn.3526940
Melchiorri, M., Pesaresi, M., Florczyk, A. J., Corbane, C., and Kemper, T. (2019b). Principles and applications of the global human settlement layer as baseline for the land use efficiency indicator—Sdg 11.3.1. ISPRS Int. J. Geoinf. 8 (2), 96. doi:10.3390/ijgi8020096
Melchiorri, M., Schiavina, M., Florczyk, A. J., Freire, S., Pesaresi, M., and Kemper, T. (2019a). Multitemporal grid based analysis of the global human settlement layers. Luxembourg: Publications Office of the European Union. JRC111328. doi:10.2760/11882
Montgomery, M. R. (2008). The urban transformation of the developing world. Science 319, 761–764. doi:10.1126/science.1153012
OECDEuropean Commission (2020). Cities in the world. Available at: https://www.oecd-ilibrary.org/content/publication/d0efcbda-en.
Rader, B., Scarpino, S. V., Nande, A., Hill, A. L., Ben, A., Reiner, R. C., et al. (2020). Crowding and the shape of COVID-19 epidemics. Nat. Med. 26 (12), 1829–1834. doi:10.1038/s41591-020-1104-0
Randolph, G. F., and Deuskar., C. (2020). Urbanization beyond the metropolis: Planning for a large number of small places in the global south. J. Plan. Educ. Res., 0739456X20971705. doi:10.1177/0739456X20971705
Romanello, M., McGushin, A., Di Napoli, C., Drummond, P., Hughes, N., Jamart, L., et al. (2021). The 2021 report of the lancet countdown on Health and climate change: Code red for a healthy future. Lancet 398 (10311), 1619–1662. doi:10.1016/S0140-6736(21)01787-6
Schiavina, M., Melchiorri, M., Pesaresi, M., Politis, P., Freire, S., Maffenini, L., et al. (2022). GHSL data package 2022: Public release GHS P2022. Luxembourg: Publications Office of the European Union. Available at: https://data.europa.eu/doi/10.2760/19817.
Seto, K. C., Guneralp, B., and Hutyra, L. R. (2012). Global forecasts of urban expansion to 2030 and direct impacts on biodiversity and carbon pools. Proc. Natl. Acad. Sci. U. S. A. 109 (40), 16083–16088. doi:10.1073/pnas.1211658109
Southerland, V. A., Brauer, M., Mohegh, A., Hammer, M. S., Donkelaar, A., Martin, R. V., et al. (2022). Global urban temporal trends in fine particulate matter (PM2·5) and attributable Health burdens: Estimates from global datasets. Lancet Planet. Health 6, e139–e146. S2542519621003508. doi:10.1016/S2542-5196(21)00350-8
Tuholske, C., Kelly, C., Funk, C., Verdin, A., Sweeney, S., Grace, K., et al. (2021). Global urban population exposure to extreme heat. Proc. Natl. Acad. Sci. U. S. A. 118 (41), e2024792118. doi:10.1073/pnas.2024792118
UN Statistical Commission (2021). Statistical commission report on the fifty-first session. E/2020/24-E/CN.3/2020/37.
UN Statistical Commission (2017). Work of the statistical commission pertaining to the 2030 agenda for sustainable development. Available at: http://ggim.un.org/documents/A_RES_71_313.pdf.
Keywords: Global Human Settlement Layer (GHSL), urbanisation, sustainable development goals (SDG), new urban agenda, urban data
Citation: Melchiorri M (2022) The global human settlement layer sets a new standard for global urban data reporting with the urban centre database. Front. Environ. Sci. 10:1003862. doi: 10.3389/fenvs.2022.1003862
Received: 26 July 2022; Accepted: 15 September 2022;
Published: 13 October 2022.
Edited by:
Barbara Sowińska-Świerkosz, University of Life Sciences of Lublin, PolandReviewed by:
Athos Agapiou, Cyprus University of Technology, CyprusFaisal Mumtaz, Aerospace Information Research Institute (CAS), China
Copyright © 2022 Melchiorri. This is an open-access article distributed under the terms of the Creative Commons Attribution License (CC BY). The use, distribution or reproduction in other forums is permitted, provided the original author(s) and the copyright owner(s) are credited and that the original publication in this journal is cited, in accordance with accepted academic practice. No use, distribution or reproduction is permitted which does not comply with these terms.
*Correspondence: Michele Melchiorri, bWljaGVsZS5tZWxjaGlvcnJpQGVjLmV1cm9wYS5ldQ==
†ORCID: Michele Melchiorri, orcid.org/0000-0002-3009-8868