 Yang Wang1†
 Yin Wang
 Yang Li
 Zhi Li
- 1Xinjiang Key Laboratory of Grassland Resources and Ecology, College of Grassland Science, Xinjiang Agricultural University, Urumqi, China
- 2Nuclear and Radiation Safety Center of the Ministry of Ecological Environment, Nuclear and Radiation Emergency Department, Beijing, China
- 3State Key Laboratory of Desert and Oasis Ecology, Xinjiang Institute of Ecology and Geography, Chinese Academy of Sciences, Urumqi, China
The identification of land type multi-functionality is a basic tool for the organization, coordination, and configuration of basin land, and provides a key criterion for determining the combination of land-use functions and the status quo of the ecological environment in the basin. However, a feasible identification method system for this purpose has not yet been established. Therefore, in this study, we construct a production–living–ecological space (PLES) classification system from the comprehensive perspective of land-use type and ecological environment. Based on remote sensing of PLES and statistical land-use status data for 2000, 2005, 2010, 2015, and 2020, we analyze the evolutionary characteristics of land-use function using the transfer matrix and center of gravity transfer methods. These are combined with the eco-environmental quality index to reveal the driving factors of eco-environmental quality spatial differentiation using the geographic detector model. The results indicate that the overall ecological environment quality index of the Tarim River Basin presents a downward trend, with a spatial differentiation pattern of high in the northwest and low in the southeast. Over the past 20 years, the ecological environment quality index has dropped by 0.852. The structural evolution and regional differentiation of PLES areas are remarkable, all of which expanded over the study period (except for the key ecological land). The center of gravity of production land presented the most obvious migration, with a total migration of 10,601.76 m to the northeast. Eco-environmental effects are found to be mainly driven by socio-economic factors, of which population density growth is the most important. The implementation of some ecological restoration projects has played a role in slowing down the degradation trend of the ecological environment quality in the Tarim River Basin; however, due to population increases and socio-economic development, the ecological environment degradation has overall been exacerbated.
1 Introduction
Rapid socio-economic development and human activities have led to land-use changes globally, which have thus become a popular research topic (Tesfaw et al., 2018; Jia et al., 2022). Soil erosion in China is mainly concentrated in ecologically fragile areas, such as the Tarim River Basin (Wang et al., 2016a; Li et al., 2021), located in the south of Xinjiang. With the intensification of human activities (Song et al., 2018) and the continuous development of the economy, the changes in land-use in the Tarim River Basin have become more and more obvious (Zhao et al., 2013), and important natural resources, such as grassland, forest land, and terrestrial water reserves, have changed accordingly (Deng and Chen, 2017). Due to the continuous degradation of the ecological environment and hydrological environment in the Tarim River Basin, the land desertification in the basin has directly intensified (Feng et al., 2001). Land-use change affects nearly one-third of the global land area (Winkler et al., 2021), and changes in land area will inevitably have different impacts on different ecological and environmental indicators. In particular, land-use change may negatively affect carbon pools (Padbhushan et al., 2022) and soil erosion (Gong et al., 2022), and it can also cooperate with climate change to promote net primary productivity (Xiao et al., 2019). It is worth mentioning that surface runoff (Daneshi et al., 2020), the spatial pattern of water quality (Zhang et al., 2018), and landscape complexity (Galpern and Gavin, 2020) have all been shown to be strongly correlated with land-use change.
Land-use change refers to the evolution process of land-use structure and function, corresponding to social and economic development in both temporal and spatial dimensions. As an important carrier of human survival, land can provide a wide range of products and services, collectively referred to as land-use function, which refers to the attributes and states of different land-use types in directly or indirectly providing various products and services to human beings (Liu, 2018; Zou et al., 2021). Land-use change is an important part and driving factor of global ecological environment change (Eziz et al., 2010), and ecological protection and restoration work needs to be based on quantitative ecological monitoring results, in order to provide targeted and scientific implementation plans. Therefore, ecological monitoring and evaluation have attracted extensive research attention (Zhang and Zhang, 2018). Research on evaluation methods has shown that some scholars evaluate changes in ecosystem quality based on land-use change (Lambin and Meyfroidt, 2011), while a large number of researchers have utilized modeling methods (e.g., sampling) to evaluate ecological simulations. However, these methods require a significant amount of statistical data in the ecological evaluation, are affected by human activities, and it may be difficult to evaluate an area with sufficient accuracy when only considering fuzzy evaluation (Chase and Knight, 2013).
The concept of land-use function originated from agricultural research, mainly referring to agricultural production functions (Andersen et al., 2013) and paying attention to the multi-functional uses of land. According to the Organization for Economic Co-operation and Development (OECD), the Food and Agriculture Organization (FAO), and the Common Agricultural Policy (CAP), agricultural functions can be divided into productive, economic and social, ecological and environmental, and cultural and recreational functions (Andersen et al., 2013). Production–living–ecological space (PLES) is a theory, proposed by the Chinese government in the ecological civilization construction strategy, with the goal of achieving sustainable utilization and focusing on the perspective of multi-functional land use (Fu et al., 2021). According to the functional attributes of land, China’s land is divided into production, living, and ecological space, the consideration of which allows us to more intuitively observe the evolution of land-use. Determining land-use area is a critical step in better identifying the land-use functional structure and dynamic trade-offs (Wiggering et al., 2006). Therefore, quantification of land-use functions is critical to understand the complexity of interactions between multiple different land-use types.
The Tarim River Basin is a fragile ecological environment. In recent years, many scholars have carried out a series of studies on the Tarim River Basin. Although there exist many studies on land-use change in the Tarim River Basin (Wang et al., 2022), research on the ecological environment quality of the Tarim River Basin combined with PLES is scarce. Although the driving factors of the ecological environment have been analyzed, the selected factors are not yet comprehensive enough. Based on the perspective of production–living–ecological space (PLES), we systematically study the evolution of land-use functions and eco-environmental effects in the Tarim River Basin by using the transfer matrix, the center of gravity transfer model, and the eco-environmental quality index in this paper. Combined with the result regarding the decrease in the eco-environmental quality index, the current situation of the eco-environmental decline in the Tarim River Basin is revealed. Through analysis of the driving factors of the eco-environmental effect in the Tarim River Basin using the geographic detector, we find that social and economic factors are the main driving force affecting the eco-environmental effect of the Tarim River Basin. This study details a comprehensive evaluation of the eco-environmental state of the Tarim River Basin, thus providing relevant government agencies with a scientific basis for eco-environmental protection.
2 Data and materials
2.1 Description of the study area
The Tarim River Basin is the largest inland river basin in China. It is located in southern Xinjiang, at the geographical coordinates of 73°10′–94°05′E, 34°55′–43°08′N. The basin includes nine major water systems, covering an area of 103 × 104 km2 and accounting for 61.82% of the total area of Xinjiang. Situated between Tianshan and the Kunlun Mountains, the Tarim River Basin is entirely inland and has a continental arid climate with little monsoon influence. There are 42 counties (cities) and two construction corps in five prefectures in the basin; namely, Bayangol Mongol Autonomous Prefecture, Aksu Administrative Offices, Kashgar Administrative Prefecture, Kizilsu Kirgiz Autonomous Prefecture, and Hotan Administrative Offices. Therefore, in order to better study the Tarim River Basin, we divided the Tarim River Basin according to county-level administrative boundaries. The boundaries and division of the Tarim River Basin are shown in Figure 1.
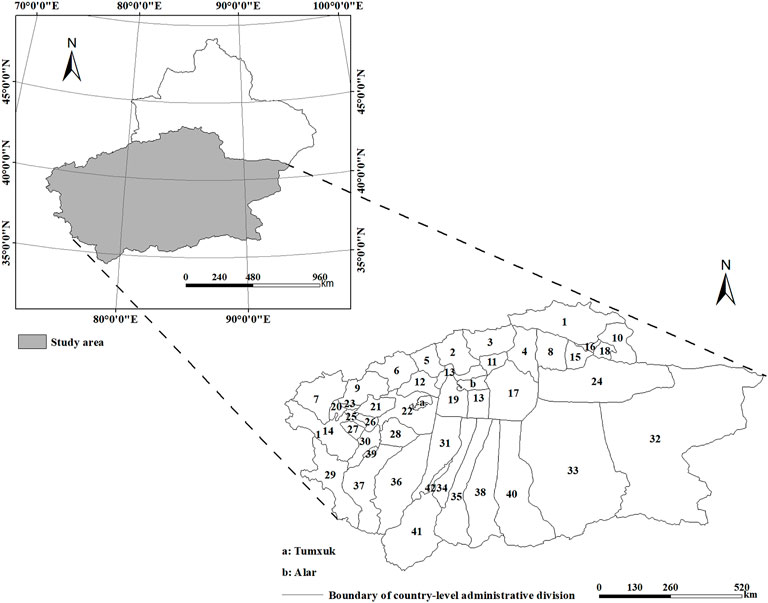
FIGURE 1. Location of study area. Note: 1. Hejing County; 2.Wensu (Onsu) County; 3. Baicheng (Bay) County; 4. Kuqa County; 5.Wushi (Uqturpan) County; 6. Akqi County; 7.Wuqia (Ulugqat) County; 8. Luntai (Bugur) County; 9. Artux City; 10. Hoxud County; 11. Xinhe (Toksu) County; 12. Kalpin County; 13. Aksu City; 14. Akto County; 15. Korla City; 16. Yanji Hui Autonomous County; 17. Xayar County; 18. Bohu (Bagrax) County; 19. Awat County; 20. Shufu County; 21. Jiashi (Payzawat) County; 22. Bachu (Maralbexi) County; 23.Kashi (Kaxgar) City; 24. Yuli (Lopnur) County; 25. Shule County; 26. Yopurga County; 27. Yengisar County; 28. Markit County; 29. Taxkorgan Tajik Autonomous County; 30. Shache (Yarkant) County; 31. Moyu (Karakax) County; 32. Ruoqiang (Qarkilik) County; 33. Qiemo (Qarqan) County; 34. Lop County; 35. Qira County; 36. Pishan (Guma) County; 37. Yecheng (Kagilik) County; 38. Yutian (Keriya) County; 39. Zepu (Poskan) County; 40. Minfeng (Niya) County; 41. Hotan County; and 42. Hotan City. The study area does not include territorial country-level cities (a,b).
As of 2020, the total population of the basin had reached 11.951718 million, accounting for 46.23% of the total population of Xinjiang, with a GDP of 41.2712 million yuan. The total value of the primary industry was 91.131 billion yuan, accounting for 46.00% of the total value of the primary industry in Xinjiang; the value of the secondary industry was 125.941 billion yuan, accounting for 26.54% of the total value of the secondary industry in Xinjiang; and the total value of the tertiary industry was 195.640 billion yuan, accounting for 27.66% of the total value of the tertiary industry in Xinjiang. It can be seen, from these figures, that the primary industries in the Tarim River Basin occupy a relatively large proportion of the total value of the primary industry in Xinjiang, while secondary and tertiary industries are still relatively backward, compared with the areas north of the Tianshan Mountains, mainly due to the relatively large area of the basin. The cost of transportation is higher than that in the north of the Tianshan Mountains and, so, the development of the processing, manufacturing, and service industries in this basin has relatively lagged behind.
2.2 Methods
2.2.1 Data collection and processing
Land-use data for the Tarim River Basin in 2000, 2005, 2010, 2015, and 2020 were obtained from the Resources and Environmental Science and Data Center of the Chinese Academy of Sciences (http://www.resdc.cn/; accessed on 20 March 2022), comprising TM land-use data with 30 m spatial resolution. PLES data included production space, living space, and ecological space. Production space refers to the territorial space that provides services for production and business activities, living space refers to the places that people use in their daily activities, and ecological space refers to the territorial space that has ecological protection, which is of great significance for sustainable development. According to the existing PLES classification basis, and fully considering the characteristics of the unused land in the Tarim River Basin, we classified the unused land as ecological accommodation land separately, and conducted research together with production land, living land, and key ecological land as first-level land types. The socio-economic and demographic data for the study area were obtained from the Xinjiang Statistical Yearbook and Xinjiang Production and Construction Corps Statistical Yearbook. The meteorological data (precipitation and air temperature) were obtained from the China Meteorological Data website (http://cdc.cma.gov.cn). The monthly average values of 16 meteorological stations with complete data were selected, and Inverse Distance Weight spatial interpolation of the meteorological data was carried out, according to the longitude and latitude of each meteorological station.
2.2.2 Classification system of PLES and calculation of eco-environmental quality index
Land is a multi-functional complex, integrating production, living, and ecological functions. However, due to differences in land-use mode and intensity, the leading functions of different land-use types vary greatly. Therefore, scientific identification of regional PLES is an important consideration in this study.
We used the land classification system adopted by the Chinese Academy of Sciences (Liu et al., 2002). By combining the land-use characteristics of the study area, the PLES classification system was constructed based on the principle of combining the dominant and secondary functions of the land. The eco-environmental quality values of different secondary land types were formulated referring to the research results of domestic and foreign experts on the calculation of the values for land-use functional ecosystem services; especially the eco-environmental quality values of land-use types formulated by Zhai et al. (2022). Based on the PLES classification, we used an ecological environment quality index considering 26 different land-use types, and calculated the eco-environmental quality index of production land, key ecological land, living land, and ecological accommodation land using the area weighting method. In order to improve the data accuracy and reduce errors, we calculated the ecological environment quality index in the basin for every year (Table 1).
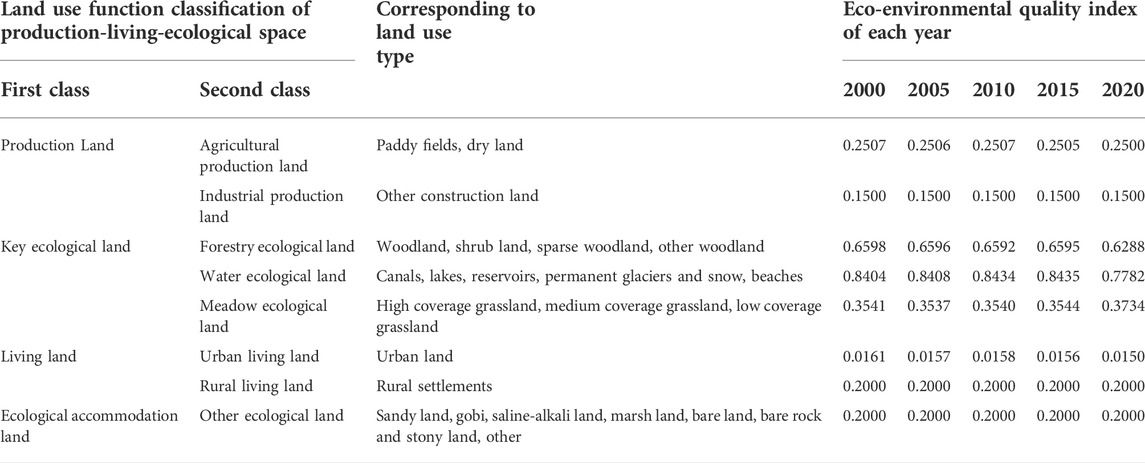
TABLE 1. Land use function classification system and eco-environmental quality index of the Tarim River Basin.
2.2.3 Land-use transfer matrix
Land-use function evolution refers to the mutual conversion and spatial distribution of the three dominant functions of land use: Production, living, and ecology. The evolution of the land-use functional structure can be realized through the land-use type transfer matrix model. The transfer matrix is not an index but, instead, arranges transfer areas of various land-use changes in the form of a matrix. Through this matrix, land-use structural and directional changes can be analyzed, which comprises the basis for analyzing land-use.
By comparing the area of the land-use transfer matrix in 2000, 2005, 2010, 2015, and 2020, we could intuitively determine the structural characteristics and land-use types of land-use change in the Tarim River Basin. For the land-use data in 2000, 2005, 2010, 2015, and 2020, according to the PLES classification standard, the ArcGIS10.2 reclassification function was used to obtain the PLES status distribution map. ArcGIS 10.2 was used to re-classify and process the land-use distribution maps for any two periods, and the PivotTable function of Excel was used to construct the land-use function transfer matrix, expressed as:
where S denotes the area, i and j index the land-use types at the beginning and end of the research period, respectively, and n is the number of land-use types. Based on the cross-analysis of land-use type data for different periods, land-use type transfer matrices for four periods (2000–2005, 2005–2010, 2010–2015, and 2015–2020) were established.
2.2.4 Shift in the land-use function center of gravity transfer model
The land-use function center of gravity transfer model was constructed based on the principle of the population distribution center of gravity in population geography. The basic method is as follows: The research area is first divided into k evaluation units, after which the coordinates of the geometric center of each assessment unit (latitude and longitude) are determined. The center coordinates are then multiplied by the evaluation unit types of land area and divided by the total area of that land-use type in the study area. This gives the barycentric coordinates of a certain function of land in the area (Li and Huang, 2022), expressed as:
where Xt and Yt are the latitude and longitude coordinates of the center of gravity of a certain land resource distribution in year t, respectively; Xk and Yk are the latitude and longitude coordinates of the geometric center of the kth evaluation unit, respectively; Ski is the area of a certain land type in the kth evaluation unit; and n is the number of land resource types based on PLES. The barycenter shift distance refers to the straight-line distance between the barycenter in a certain year and that in subsequent years. If t and (t+1) are associated to Pt (Xt,Yt) and Pt+1 (Xt+1,Yt+1), respectively, then the barycenter shift distance of adjacent years is calculated as:
2.2.5 Eco-environmental effects of land-use function evolution
2.2.5.1 Eco-environmental quality index
The classification of land-use functions can be carried out from an eco-environmental perspective. Different factors, such as human activities, will have an impact on the structure and function of the environment and ecosystems, which we call eco-environmental effects.
The ecological environmental quality index was used to quantitatively represent the overall ecological environmental quality for five different periods in the Tarim River Basin (Pang et al., 2022). The calculation formula is as follows:
where EVk is the ecological environment quality index of evaluation unit k, Ski is the area of functional land type i in the kth evaluation unit, and Sk is the total land area of the kth evaluation unit. Additionally, Vi is the eco-environmental quality index of functional land class i, and n is the number of land resource types, based on PLES.
2.2.5.2Ecological contribution rate
The ecological contribution rate of land-use function evolution refers to the function of land-use conversion in regional ecological environmental quality of change. This index quantifies the various functions of regional land-use conversion and its impact on the ecological environment. Additionally, it separates the dynamics of the main land-use types, in order to explore changes in the regional ecological environment. A positive value means that the transformation improves the regional ecological environment quality, while a negative value indicates that the transformation reduces the quality (Hou et al., 2022; Li and Wu, 2022). It is calculated as follows:
where LEI is the ecological contribution degree of land-use function evolution, LEi and LEj are the eco-environmental quality indices of land-use function change in types reflected in the early and late stages, respectively, ΔSk is the area of changed land-use type, and Sk is the total land area of the kth evaluation unit.
2.2.6 Geographic detector model
The geographical detector model is a statistical method which can be used to detect spatial differentiation and explain its driving forces without imposing too many constraints. This approach overcomes the shortcomings of traditional statistical methods, in terms of dealing with variables (Wang et al., 2016b). Factor detection is carried out to detect the spatial differentiation of an attribute Y and the extent to which a factor X explains the spatial differentiation of Y.
Combined with the characteristics of the study area and the availability of data, the driving factors of eco-environmental effects were selected from the aspects of natural environment and social economy, including the natural environment factors elevation (X1), slope (X2), aspect (X3), air temperature (X4), and precipitation (X5), as well as the socio-economic factors distance to water (X6), distance to roads at the township level and above (X7), primary industry (X8), secondary industry (X9), tertiary industry (X10), and population density (X11). The eco-environmental quality index and the driving factors were spatially matched, and the dependent and independent variables at each discrete point were then extracted. The calculation formula is (Yang et al., 2020; Xiong et al., 2022):
where q denotes the explanatory power of the driving factors, which has values in the range of [0, 1]. If q = 0, the ecological environment quality is randomly distributed. The larger the q value, the stronger the explanatory power of the driving factors. In the equation, Nh and N are the number of sub-level sample units and entire research units, respectively, and
Interaction detection is mainly carried out to determine whether each factor has an impact on the dependent variable independently or post-interaction, and whether the influencing force is weakened or enhanced. The relationships between the two factors can be divided into five categories:
1)
2)
3)
4)
5)
2.3 Research framework
In order to better study the evolution of land-use function and the influencing factors of the ecological environment effect in the Tarim River Basin, we carried out four key steps (Figure 2). First, the land-use data were processed and classified by PLES. Then, combined with the transfer matrix, the center of gravity transfer model was used to analyze the evolution of land-use functions. Third, we used the ecological environment index and ecological contribution rate to study the ecological environment effect in the Tarim River Basin. Finally, we used the five natural environment factors and six socio-economic factors to explore the driving force of the ecological environment effect with the geographic detector model. Through these steps, the land-use function evolution characteristics in the Tarim River Basin and the driving factors for the spatial differentiation of ecological environment effects could be clarified.
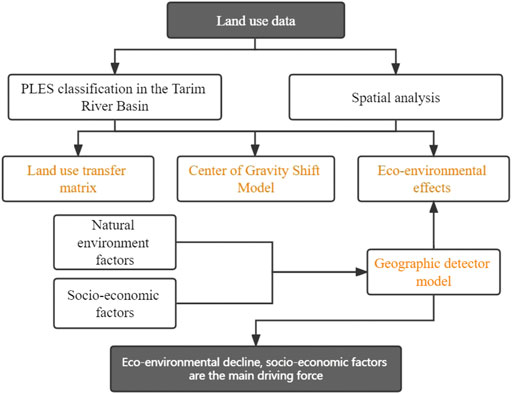
FIGURE 2. Research framework.
3 Results and analysis
3.1 Evolution characteristics of land-use function
We used ArcGIS 10.2 to re-classify the five-phase land-use remote sensing data in 2000, 2005, 2010, 2015, and 2020; the results are shown in Figure 3. As can be seen from the figure, the production land, living land, and ecological accommodation land areas in the Tarim River Basin expanded in the period 2000–2020. In particular, the area of production land grew by 16,650.55 km2, representing a 62.16% increase over the 20-year period. The key ecological land area decreased by 24,716.87 km2 (or 7.3%). Residential land expanded by 718.36 km2, with the largest increase (348.13 km2) occurring in 2015–2020; this expansion accounted for 48.46% of the increase during the study period, while 39.61% occurred between 2010 and 2015. The ecological accommodation area increased by 6839.63 km2 (or 1.02%).
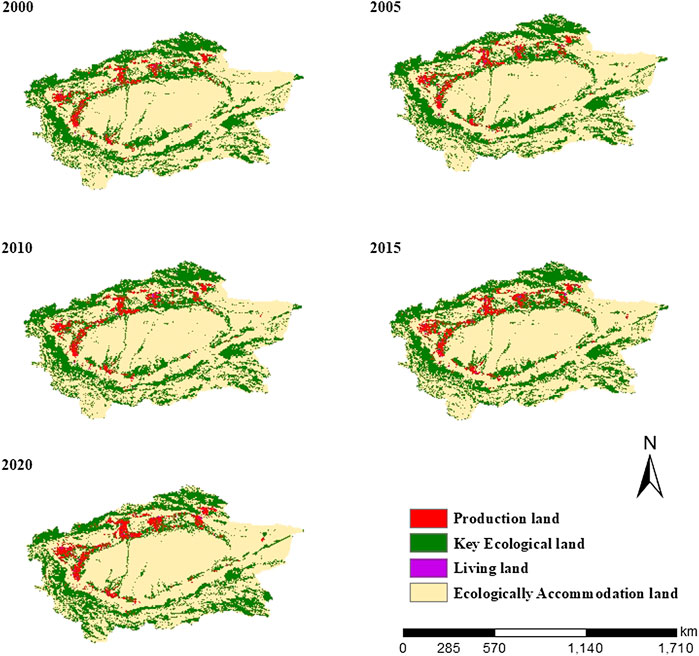
FIGURE 3. Spatial distribution of land use status based on PLES.
The land-use pattern in the Tarim River Basin changed significantly from 2000 to 2020. In order to more intuitively observe the internal conversion of land-use types in the basin, the land-use transfer matrix was adopted to define both the transformation direction and quantity of land function transformation (Table 2). The analysis results indicated that the biggest change occurred in production land, which increased by 16,650.55 km2, accounting for 68.49% of the total area transferred. Of the transferred land, most came from key ecological land (70.52%) and ecological accommodation land (25.58%). A total of 6941.59 km2 was transferred to ecological accommodation land and 718.36 km2 was transferred to living land, accounting for 28.55% and 2.95% of the total transfer area, respectively.
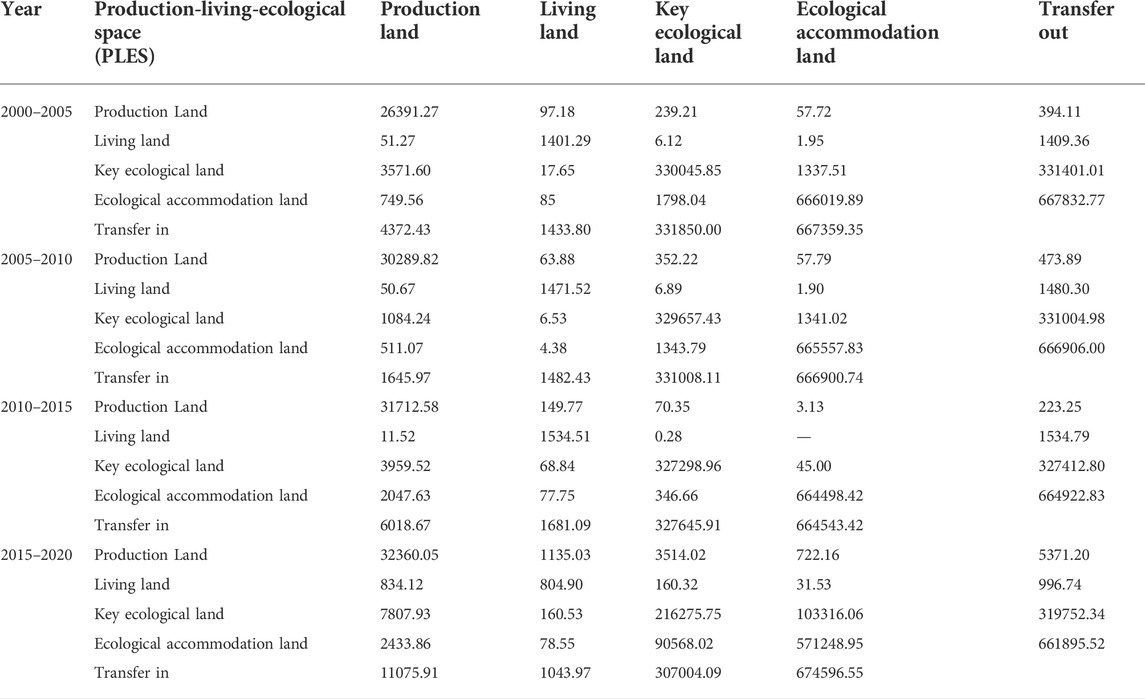
TABLE 2. Transition matrix of production-living-ecological space (PLES) for different periods in the Tarim River Basin during 2000–2020.
In terms of land-use function transfer area, only key ecological land was transferred, totaling 24,310.50 km2. Most of this land was converted to ecological accommodation (96.96%), with the rest being converted to production land and living land. The encroachment of ecological accommodation land on key ecological land reduced its area, thus having a major impact on the quality of the surrounding ecological environment.
3.2 Shift in land-use gravity center
The gravity center formula was used to calculate the gravity center coordinates of PLES in the study area in 2000, 2005, 2010, 2015, and 2020. The formula was also used to determine the position and shifting direction of the center of gravity. Figure 4 shows the shifting distance of the center between each year.
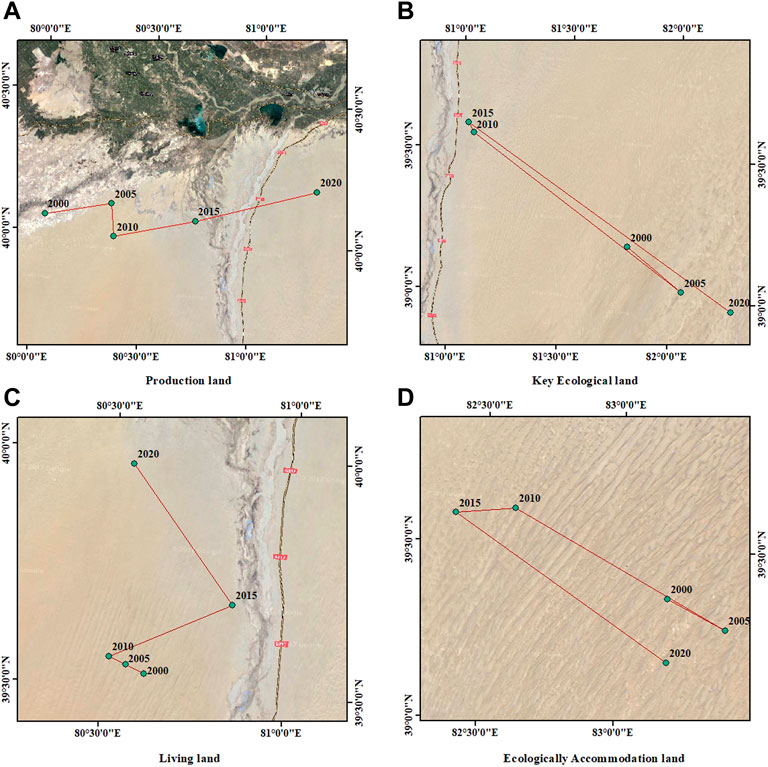
FIGURE 4. Location, shifting direction, and distance of gravity center of PLES during 2000–2020.
The production space center of gravity was located in Aksu Administrative Offices throughout the study period. It can be seen, from Figure 3, that the production land was mainly concentrated in the west and northwest of the Tarim River Basin. Due to its remote geographical location and inconvenience of transportation in the Tarim River Basin, the economy is relatively backward. At present, agriculture is still the mainstay in the basin. Some areas with relatively developed agriculture, such as Korla City, Aksu City, and Shache County, rank higher in the basin, from the perspective of primary industries. Therefore, the center of gravity of production land mainly fell in the Aksu region, located in the northwest direction of the Tarim River Basin. The center of gravity of key ecological land was mainly in the Hotan Administrative Offices, which is relatively rich in hydropower resources. The center of living land was situated in the Aksu Administrative Offices. In 2017, Xinjiang vigorously promoted the construction of new urban areas, providing Aksu Administrative Offices with a facilitative platform for urbanization. During the study period, the center of ecological accommodation was mainly in northern Hotan Administrative Offices, the center of the Tarim River Basin. Although Hotan Administrative Offices possesses some water resource carrying capacity and vegetation coverage, sandy land is the main land type there, and it is one of the driest areas in China. Moreover, the center of the Tarim Basin is a vast desert, such that the center of ecological accommodation is mainly located in this area.
From the perspective of the transfer direction and distance of the center of gravity, migration to the northeast was the main trend regarding the transfer of the center of gravity of production land. The shift in the center of gravity of production land moved 10,601.76 m in a northeastern direction over the past 20 years, from Awat County to Aksu City. Due to the remote geographical location of the Tarim River Basin, transportation is inconvenient and its economy is relatively backward. At present, agriculture remains the backbone in the watershed. It can be seen, from Figure 3, that the production land was mainly concentrated in the west and northwest of the Tarim River Basin, such as Aksu City and Shache County. However, some areas with relatively developed agriculture, such as Korla City located in the northeast of the basin, experienced rapid expansion of production land during the study period. Therefore, the center of gravity of production land in the Tarim River Basin mainly moved to the northeast. During the same period, the center of gravity of key ecological land transferred 48,199.56 m to the southeast. Due to the rapid economic development in the northwest of the basin and the further expansion of production land, key ecological land has been occupied. Coupled with global warming in recent years, the melting of glaciers has led to an increase in vegetation in the southeast of the basin, causing the center of gravity of key ecological land to move to the southeast. The center of gravity of living land moved first 9,211.67 m to the northwest, then 31,658.08 m to the northeast, and finally 40,809.96 m to the northwest. Overall, the center of gravity of living land has moved 49,796.42 m to the northwest. The Tarim River Basin has a wide area and a lot of unused land. The population is mainly distributed in the northwest area of the Tarim River Basin, including Aksu City, Korla City, and other cities. These cities have large populations and a rapid urbanization process, causing the center of gravity of living land to mainly move towards the northwest. The center of gravity migration of ecological accommodation area was the smallest, migrating only 20,242.04 m to the south. With rapid economic development in the northwest region of the study area, problems such as over-exploitation of land have appeared. Therefore, the center of gravity of ecological accommodation moved to the northwest region as a whole from 2000 to 2015. Later, due to global warming and high evapotranspiration, the ecological accommodation land encroached on the waters and grasslands in the southern part of the Tarim River Basin, causing the center of gravity of the ecological accommodation to move to the southeast from 2015 to 2020.
3.3 Eco-environmental effects of land-use function evolution
3.3.1 Evolution of eco-environmental quality
The calculation results for the eco-environmental quality index of the study area indicated that the index dropped from 0.1568 to 0.1480 between 2000 and 2020 (Table 3), indicating an annual decrease in quality. This was mainly due to the intensification of human activities, acceleration of the urbanization process, and the gradual increase in land exploitation. Between 2015 and 2020 in particular, the permanent glacier area was greatly reduced, due to climate warming (Deng et al., 2019). Melting glaciers caused an increase in lakes and canals (Deng et al., 2022), but the environmental quality indices of lakes and canals are lower than that of permanent glaciers and, so, the overall eco-environmental quality of the Tarim River Basin presented a downward trend. The amount of forestland also decreased.
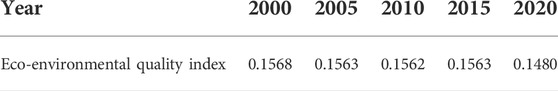
TABLE 3. Eco-environmental quality index for the study period.
Figure 5 shows that the counties in the north and southwest of the Tarim River Basin presented higher ecological environment quality indices. Combined with Figure 3, it can be seen that these counties and cities had more grassland ecological land, forest ecological land, and water area at each evaluation time point; such as Hejing County, Kuqa County, Akto County, and so on.
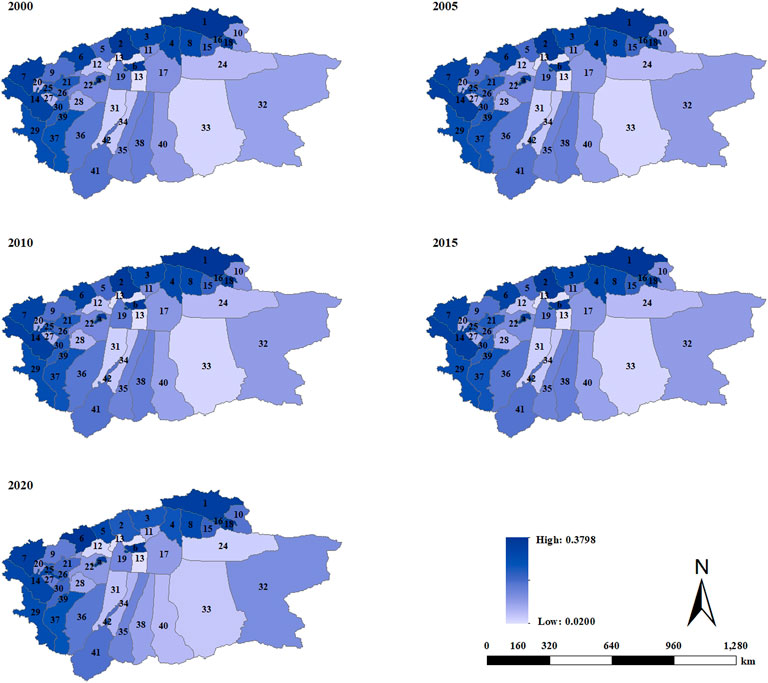
FIGURE 5. Spatial distribution of eco-environmental quality in different years.
3.3.2 Differences in ecological contribution rate
There were two opposing effects (i.e., positive and negative impacts) on eco-environmental quality in the study area. These can mitigate each other, to some extent, thus maintaining the index within a stable range.
According to the analysis in Table 4, the conversion of low ecological quality land (e.g., sandy land) into grassland (ecological land) was the leading factor for the improvement of ecological environment quality, accounting for 75.11% of the positive effects. The conversion of other ecological land types into water ecological land, such as grassland ecological land into water ecological land and forest ecological land, also improved the ecological environment quality of the Tarim River Basin, accounting for nearly one-fifth of the positive contribution rate to the ecological environment. In addition, the conversions of land-use function for ecological environment improvement in the Tarim River Basin were relatively concentrated; for example, ecological land was converted into grassland ecological land and water ecological land, and grassland ecological land was converted into water and forest ecological land. These conversions resulted in a higher ecological environment quality index, accounting for more than 90% of the positive effects on the ecological environment.
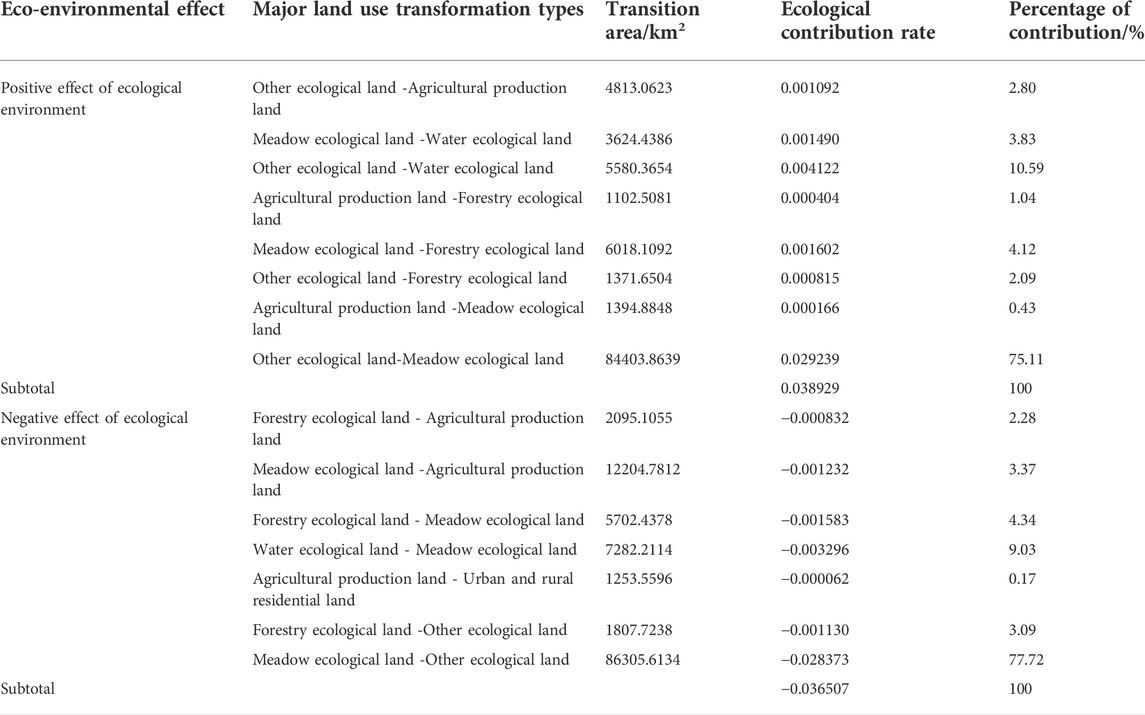
TABLE 4. Land type transformation and contribution rate to PLES in the Tarim River Basin in 2000–2020.
Conversely, the occupation of grassland ecological land and woodland ecological land by agricultural production land and other ecological land, as well as the occupation of water ecological land and woodland ecological land by grassland ecological land, were important factors leading to the deterioration of ecological environment quality in the Tarim River Basin. In particular, the conversion of grassland and forestland into other ecological land accounted for more than 80% of the negative effects on the ecological environment.
3.3.3 Characteristics of climate change
The trend changes for precipitation and average annual temperature in the study area from 2000 to 2020 are illustrated in Figure 6. As can be seen from the figure, the average annual precipitation and temperature both showed gradually increasing trends, which differed slightly. The trend change rates for precipitation and temperature were 1.257 and 0.022, respectively. Although the increase in air temperature was only minor, precipitation showed a more significant increasing trend. Specifically, air temperature showed an obvious decline from 2009 to 2012, followed by an increasing trend from 2012 to 2020, such that the overall change trend is not obvious. On the other hand, precipitation decreased up to 2009, then began to rise. This trend reversal reveals that, under the influence of global warming, the temperature in the Tarim River Basin is on an upward trajectory. The study region is an extremely arid area, thus lacking water, an increase in temperature will accelerate the melting of glaciers and usually result in increases in evaporation from the underlying surface. Therefore, the increase in precipitation in the Tarim River Basin is significant.
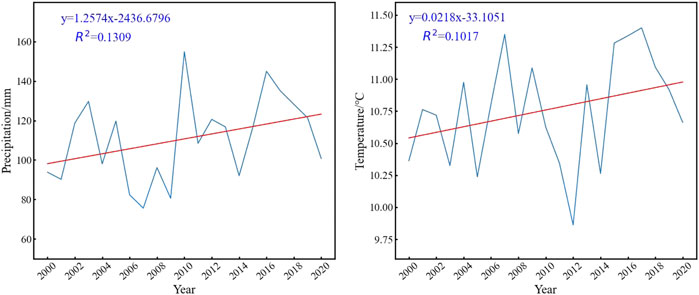
FIGURE 6. Linear trend change.
Our results revealed that the ecological environment quality of the Tarim River Basin has changed. The natural environmental and socio-economic factors appeared to have a substantial impact on the ecological environment quality of the basin. In terms of the natural environment, we further analyzed the impact of climate on eco-environmental quality through spatial correlation analysis; the results are shown in Figures 7A,B. The spatial distribution of eco-environmental quality was positively correlated with precipitation from 2000 to 2020. Figure 5 illustrates that the points of high regional ecological environmental quality were mainly concentrated in the northwest and southwest of the Tarim River Basin; for example, Hejing County, Wuqa County, and Akto County were representative of high-quality local precipitation. Accordingly, due to relatively abundant precipitation, the grassland, forestland, and so on had a positive impact on the ecological environment quality of the land area. The proportion of high-coverage grassland and woodland was also higher there than in other areas. However, there was a negative correlation between ecological environment quality and temperature in the study area, and the increase in evapotranspiration due to higher temperatures was quite prominent, making the water area smaller than that in other areas.
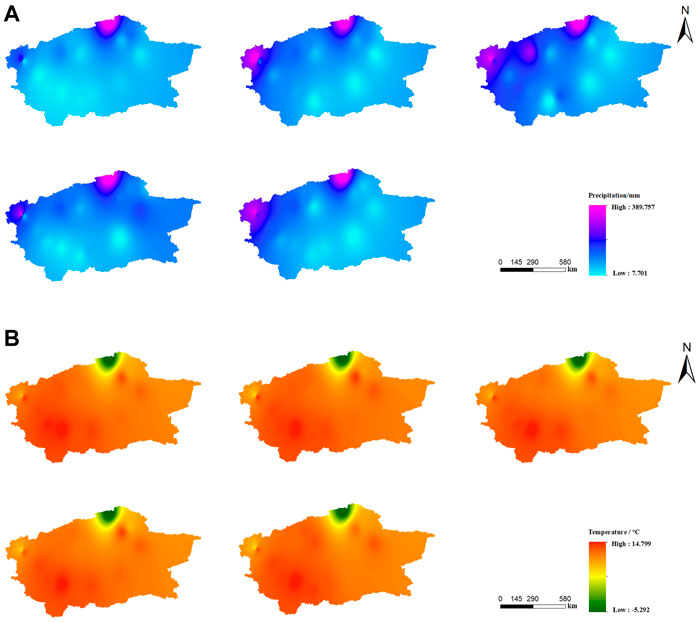
FIGURE 7. (A) Spatial distribution characteristics of precipitation (mm) in the Tarim River Basin from 2000 to 2020. (B) Spatial distribution of air temperature (°C) in the Tarim River Basin from 2000 to 2020.
3.3.4 Analysis of the formation mechanism of ecological environmental quality
As shown in Figure 8, the spatial differentiation of the eco-environmental quality index was the result of multiple factors. We considered five natural environmental factors and six socio-economic factors, with the natural environmental factors including elevation, gradient, slope direction, air temperature, and precipitation, while the socio-economic factors included distance to water, distance to roads at the township level, primary, secondary, and tertiary industries, as well as population density. Detection of the influence of the ecological environment quality index in the Tarim River Basin was carried out by using the geographic detector. The q value in the factor detection result represents the explanatory power of a factor, with respect to spatial differentiation.
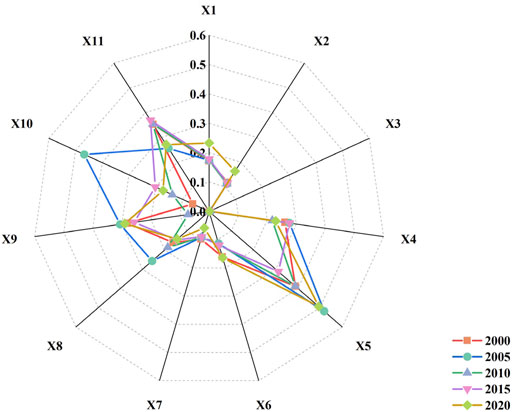
FIGURE 8. Contribution rate of impact factors.
Precipitation was found to play a major role among the natural environmental factors, while population density was highly influential among the socio-economic factors, indicating that the ecological environment quality of the study area was significantly affected by precipitation and population density. From the point of view of the natural environment and socio-economic factors, the overall explanatory power of socio-economic factors was stronger than that of the natural environment factors. Therefore, while natural environmental factors are important, socio-economic factors were the main ones affecting the ecological environmental quality during the study period.
Different factors have different impacts on ecological environmental quality. At the same time, there exist complex interactions between and among factors, which lead to differences in the magnitude, intensity, and direction of the impact factors. Furthermore, interactions between the factors may increase their impact on ecological environmental quality. Considering the eleven different influencing factors listed above, interaction detection analysis was conducted. The results (Figure 9) demonstrated that the interaction modes between any two factors mainly included non-linear enhancement and double factor enhancement, and there were no mutual independent or weakening relationships. The impact strength of interactions on ecological environment quality was significantly higher than that of any single factor; in other words, the spatial evolution of the ecological environmental quality in the Tarim River Basin is primarily the result of the joint action of multiple factors. The higher the interaction q value, the greater the impact of the interaction between the corresponding two factors on the ecological environmental quality.
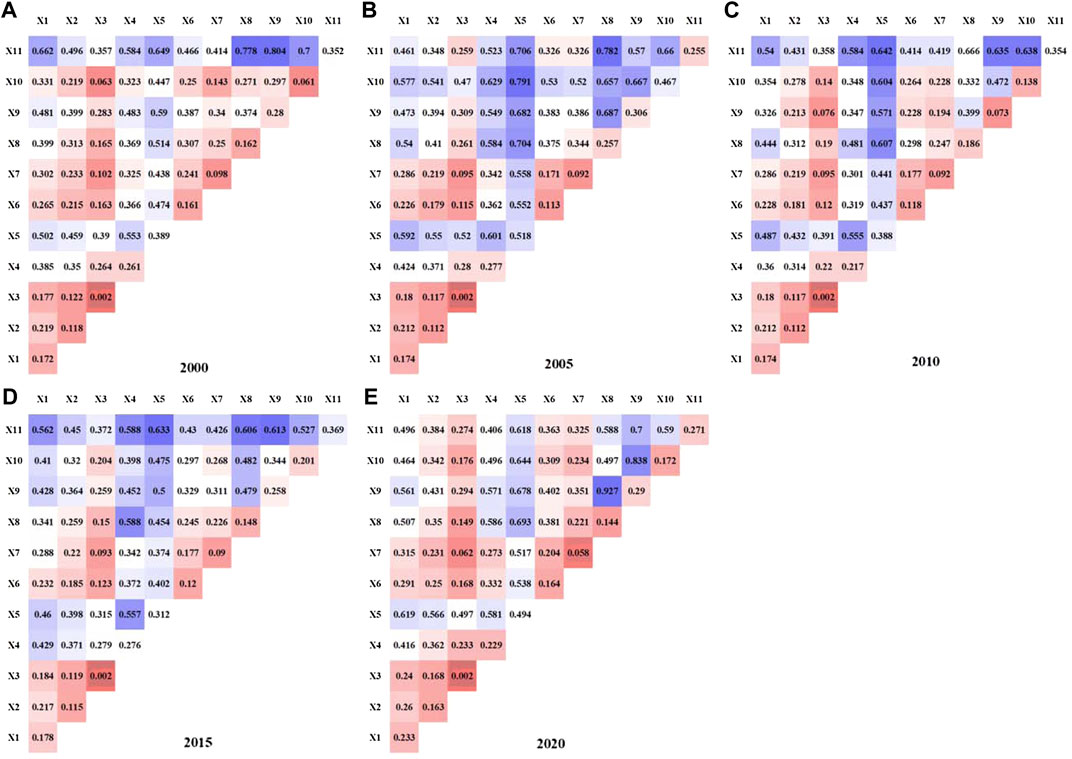
FIGURE 9. Interactive detector results.
From 2000 to 2020, the factors with the strongest interaction impact on eco-environmental quality were population density ∩ secondary industry (0.804), tertiary industry ∩ precipitation (0.791), population density ∩ primary industry (0.666), population density ∩ precipitation (0.633), and secondary industry ∩ primary industry (0.927). The q values of the interactions between population density and precipitation and other factors were high (q > 0.5), related to the high explanatory power of these single factors. Among the natural environmental factors, the interaction between precipitation and temperature was the strongest, followed by precipitation and elevation, which showed significant double-factor enhancement effects. For socio-economic factors, the strongest interactions were population density ∩ secondary industry (0.804), population density ∩ primary industry (0.782), population density ∩ primary industry (0.666), population density ∩ secondary industry (0.613), and secondary industry ∩ primary industry (0.927). The interaction between population density and production value was the strongest, showing a significant non-linear enhancement effect. The strongest interactions between socio-economic and natural environmental factors were population density ∩ elevation (0.662), tertiary industry ∩ precipitation (0.791), population density ∩ precipitation (0.642), population density ∩ precipitation (0.633), and primary industry ∩ precipitation (0.693).
Although the interaction between population density and precipitation was the most prominent, interactions within socio-economic factors were significantly stronger than interactions between natural environmental factors or between natural environmental factors and socio-economic factors. The study area is vast and the climate type is relatively simple, but socio-economic development and human activities are complex. These features exerted a significant impact on living space and production space area, leading to the strong observed interaction between socio-economic factors.
4 Discussion
Based on analysis of the spatial and temporal distribution characteristics of PLES and eco-environmental quality, we determined the driving mechanism of eco-environmental quality in the Tarim River Basin by considering both natural environmental and socio-economic factors. The calculation results of the ecological environment quality index indicated that the ecological environment of the Tarim River Basin has gradually declined (Wang et al., 2020), as the ecological environment index decreased from 0.1568 in 2000 to 0.1480 in 2020. As the future will likely bring increased global climate warming, along with more frequent human activities in the Tarim River Basin region, the basin’s ecological environment quality index is anticipated to continue to decline. This trend reflects the expansion of production, living, and ecological accommodation land along with a decrease in key ecological land; over the study period, the key ecological land decreased by 24,716.8692 km2. Continued and rapid changes in land-use are thought to lead to the severe ecological degradation of natural ecosystems, such as forest ecosystems (Endress and Chinea, 2001) and river ecosystems (Yunus et al., 2003). At the beginning of the 21st century, Xinjiang Uygur Autonomous Region began to vigorously develop its social economy. With the expansion of cultivated land and construction land, the development and utilization of water resources have been strengthened; consequently, the water volume of the main stream of the Tarim River has been greatly reduced. Precipitation has been unable to meet water demand, resulting in a significant reduction in ecological land water areas (Wang et al., 2021), comprising a total reduction of 13,665.5622 km2 during the study period. Moreover, industrialization, agricultural production, and other human activities require extensive water resources, which means that construction land is mostly distributed in areas close to roads and water bodies. Therefore, the more developed the social economy, the more obvious the changes in PLES will be. These changes will, in turn, affect the eco-environmental quality index.
Over the past 20 years, the areas of cultivated land, construction land, and other production land in the Tarim River Basin have continued to increase, while the area of key ecological land (e.g., grassland and forest land) has continued to decline. In order to vigorously develop the economy, the ecological land area has been continuously encroached upon. This phenomenon is widespread in developing countries (Abdullah and Nakagoshi, 2006). During the study period, the population of the Tarim River Basin continued to grow and the population density continued to increase, thus increasing the area of urban and rural land, as well as other living land. In addition, agriculture is the main economic activity in the Tarim River Basin. Since 2000, grain and cotton prices have continued to rise, and a large number of woodlands and grasslands have been reclaimed into cultivated land, resulting in a sharp increase in the area of cultivated land. Population growth leads to an increase in food demand, which indirectly leads to an increase in the area of cultivated land. The area of unused land in the Tarim River Basin presented a trend of first decreasing and then increasing. The decrease in the area of unused land from 2000 to 2015 was due to the start of the comprehensive treatment project in the Tarim River Basin, which reduced the area of unused land, to a certain extent. Then, due to the rapid population growth in the past 5 years, the forest and grassland have been over-cultivated, and the forest and grassland have been degraded into unused land, thus aggravating the degradation of the ecological environment in the Tarim River Basin.
This paper demonstrates that socio-economic factors have a greater impact on the quality of the ecological environment than natural environment factors. The Tarim River Basin is an ecologically fragile zone in the extremely arid region of Northwest China (Zhang et al., 2020) and, so, that natural environment factors (e.g., precipitation) have a significant impact on the cultivated land, grassland, and forest land in the region. However, due to the small changes in elevation, slope, and aspect in a short period of time, the impact on the ecological environment is limited, and did not play an obvious leading role in this study. The Tarim River Basin is an important part of the “One Belt, One Road” initiative, and the regional development of national engineering construction projects accelerated the urbanization process of the Tarim River Basin during the study period. While the government has vigorously promoted the economic development of the region, this also makes the ecological environment quality of the study area vulnerable to the influence of population increase and economic development. Socio-economic factors have gradually been identified as key factors affecting ecological environment changes (Nagendra et al., 2004).
In view of the current situation, regarding the deterioration of the ecological environment in the Tarim River Basin, we believe that relevant government departments should implement a comprehensive planning plan for the Tarim River Basin as soon as possible, based on the “Water Law of the People’s Republic of China” and other relevant laws and regulations, clarifying important ideas for the sustainable development of the ecological environment of the basin. This may involve increasing the amount of water flowing into the Tarim River from various sources through measures such as the management of the main stream, or protection of the unified management and dispatch of water resources in the basin. In addition, in order to reconcile the contradiction between economic development and ecosystem protection, government departments should increase supervision, strictly prohibit the destruction of forests, return farmland to uncultivated land, and speed up ecological construction projects. The previous ecological water transfer project in the Tarim River Basin produced positive ecological, economic, and social benefits (Ye et al., 2009). At the same time, based on the advantages of local resources, characteristic pillar ecological industries should be created, ecological agriculture and key ecological industries should be vigorously enhanced, tourism and cultural industries should be deeply developed, sustainable economic and trade development should be promoted, and unnecessary reclamation of woodland and grassland should be reduced.
There is a lot of unused land in the Tarim River Basin, which we classified as ecological accommodation land separately, and studied it together with production land, living land, and key ecological land as first-level land types. Through research on the evolution of land-use function and the effect on the ecological environment, we further clarified the status quo regarding the overall decline of the ecological environment in the Tarim River Basin. This study provides new ideas and methodological references for the analysis of land-use change in arid and semi-arid regions.
In addition, it is worth noting that we only selected factors affecting ecological environmental quality with respect to the impact of different natural environment and socio-economic factors. There was no further research on the intensity of land-use and human activity, and there remains a lack of research and discussion on the influencing factors at the micro-level, such as soil quality and soil type. In the future, the driving mechanisms of eco-environmental effects should be explored more comprehensively; for example, through combination with spatial analysis methods, such as kernel density estimation, in order to further reveal the spatial pattern of eco-environmental quality.
5 Conclusion
Based on the perspective of PLES, we analyzed the evolution characteristics of land-use functions, ecological environment effects, and driving factors in the Tarim River Basin from 2000 to 2020. Our key conclusions are as follows:
1) The areas of production land, living land, and ecological accommodation land in the study area increased continuously over the study period, increasing by 16,650.55 km2, 718.36 km2, and 6839.63 km2, respectively; notably, they were all expanding outwards. Meanwhile, the area of key ecological land decreased (by 24,716.87 km2). These change trends and spatial distributions were consistent with the ecological environment quality index results.
2) From 2000 to 2020, the ecological environment of the Tarim River Basin was degraded as a whole, and there was obvious spatial heterogeneity. The eco-environmental quality index dropped from 0.1568 in 2000 to 0.1480 in 2020 overall; however, the eco-environmental quality index in the northwest region remained relatively high.
3) There were differences in the factors driving the spatial differentiation of eco-environmental effects in the Tarim River Basin. The evolution of the ecological environment quality in the Tarim River Basin was primarily the result of the combined effects of multiple influencing factors. The explanatory power of socio-economic factors on the ecological environment effect was generally higher than that of other factors (i.e., natural environment factors).
Data availability statement
The datasets presented in this study can be found in online repositories. The names of the repository/repositories and accession number(s) can be found below: http://www.gscloud.cn/search.
Author contributions
YGW and YNW conceived the study design and implemented the field research, YNW and TX. collected and analyzed the field data; YL and ZL applied statistics, mathematics, or other forms of technology to analyze or research data. YNW wrote the paper with the help of YGW. All authors have read and agreed to the published version of the manuscript.
Funding
This research was funded by the Natural Science Foundation of Xinjiang Uygur Autonomous Region (2021D01E02).
Conflict of interest
The authors declare that the research was conducted in the absence of any commercial or financial relationships that could be construed as a potential conflict of interest.
Publisher’s note
All claims expressed in this article are solely those of the authors and do not necessarily represent those of their affiliated organizations, or those of the publisher, the editors and the reviewers. Any product that may be evaluated in this article, or claim that may be made by its manufacturer, is not guaranteed or endorsed by the publisher.
References
Abdullah, S. A., and Nakagoshi, N. (2006). Changes in landscape spatial pattern in the highly developing state of Selangor, peninsular Malaysia. Landsc. Urban Plan. 77 (3), 263–275. doi:10.1016/j.landurbplan.2005.03.003 |
Andersen, P. S., Vejre, H., Dalgaard, T., and Brandt, J. (2013). An indicator-based method for quantifying farm multifunctionality. Ecol. Indic. 25, 166–179. doi:10.1016/j.ecolind.2012.09.025 |
Chase, J. M., and Knight, T. M. (2013). Scale-dependent effect sizes of ecological drivers on biodiversity: Why standardised sampling is not enough. Ecol. Lett. 16 (1), 17–26. doi:10.1111/ele.12112 | |
Daneshi, A., Brouwer, R., Najafinejad, A., Panahi, M., Zarandian, A., and Fadia, M. F. (2020). Modelling the impacts of climate and land use change on water security in a semi-arid forested watershed using InVEST. J. Hydrology 593, 125621. doi:10.1016/j.jhydrol.2020.125621 |
Deng, H. J., Chen, Y. N., and Chen, X. W. (2022). Driving factors and changes in components of terrestrial water storage in the endorheic Tibetan Plateau. J. Hydrology 612, 128225. doi:10.1016/j.jhydrol.2022.128225 |
Deng, H. J., and Chen, Y. N. (2017). Influences of recent climate change and human activities on water storage variations in Central Asia. J. Hydrology 544, 46–57. doi:10.1016/j.jhydrol.2016.11.006 |
Deng, H. J., Chen, Y. N., and Li, Y. (2019). Glacier and snow variations and their impacts on regional water resources in mountains. J. Geogr. Sci. 29 (1), 84–100. doi:10.1007/s11442-019-1585-2 |
Endress, B. A., and Chinea, J. D. (2001). Landscape patterns of tropical forest recovery in the Republic of Palau. Biotropica 33 (4), 555–565. doi:10.1646/0006-3606(2001)033 |
Eziz, M., Yimit, H., Mohammad, A., and Huang, Z. F. (2010). Oasis land-use change and its effects on the oasis eco-environment in Keriya Oasis, China. Int. J. Sustain. Dev. World Ecol. 17 (3), 244–252. doi:10.1080/13504500903211871 |
Feng, Q., Endo, K. N., and Cheng, G. D. (2001). Towards sustainable development of the environmentally degraded arid rivers of China-a case study from Tarim River. Environ. Geol. 41 (1-2), 229–238. doi:10.1007/s002540100387 |
Fu, C., Tu, X. Q., and Huang, A. (2021). Identification and characterization of production–living–ecological space in a central urban area based on POI data: A case study for wuhan, China. Sustainability 13 (14), 7691. doi:10.3390/SU13147691 |
Galpern, P., and Gavin, M. P. (2020). Assessing the potential to increase landscape complexity in Canadian prairie croplands: A multi-scale Analysis of land use pattern. Front. Environ. Sci. 8, 31. doi:10.3389/fenvs.2020.00031 |
Gong, W. F., Liu, T. D., Duan, X. Y., Sun, Y. X., Zhang, Y. Y., Tong, X. Y., et al. (2022). Estimating the soil erosion response to land-use land-cover change using GIS-based rusle and remote sensing: A case study of miyun reservoir, north China. Water 1, 742. doi:10.3390/w14050742 |
Hou, Y. F., Chen, Y. N., Ding, J. L., Li, Z., Li, Y. P., and Sun, F. (2022). Ecological impacts of land use change in the arid Tarim River basin of China. Remote Sens. 14 (8), 1894. doi:10.3390/rs14081894 |
Jia, S. S., Yang, C. Y., Wang, M. X., and Failler, P. (2022). Heterogeneous impact of land-use on climate change: Study from a spatial perspective. Front. Environ. Sci. 10, 840603. doi:10.3389/fenvs.2022.840603 |
Lambin, E. F., and Meyfroidt, P. (2011). Global land use change, economic globalization, and the looming land scarcity. Proc. Natl. Acad. Sci. U. S. A. 108 (9), 3465–3472. doi:10.1073/pnas.1100480108 | |
Li, C. X., and Wu, J. Y. (2022). Land use transformation and eco-environmental effects based on production-living-ecological spatial synergy: Evidence from shaanxi province, China. Environ. Sci. Pollut. Res. 29 (27), 41492–41504. doi:10.1007/s11356-022-18777-z |
Li, H. X., Wan, H. W., Sun, L., Liu, Y. P., Li, L. P., and Wang, Y. C. (2021). Remote sensing assessment and key driving factors of ecosystem health in Xinjiang. Arid. Land Geogr. 44 (02), 460–470. doi:10.12118/j.issn.1000-6060.2021.02.17 |
Li, J. X., and Huang, W. (2022). Research on evolution of population and economy spatial distribution pattern in ecologically fragile areas: A case study of ningxia, China. Front. Environ. Sci. 10, 814569. doi:10.3389/fenvs.2022.814569 |
Liu, J. Y., Liu, M. L., Deng, X. Z., Zhuang, D. F., Zhang, Z. X., and Luo, D. (2002). The land use and land cover change database and its relative studies in China. J. Geogr. Sci. 12 (3), 275–282. doi:10.1007/BF02837545 |
Liu, Y. S. (2018). Introduction to land use and rural sustainability in China. Land Use Policy 74, 1–4. doi:10.1016/j.landusepol.2018.01.032 |
Nagendra, H., Munroe, D. K., and Southworth, J. (2004). From pattern to process: Landscape fragmentation and the analysis of land use/land cover change. Agric. Ecosyst. Environ. 101 (2-3), 111–115. doi:10.1016/j.agee.2003.09.003 |
Padbhushan, R., Kumar, U., Sharma, S., Rana, D. S., Kumar, R., Kohli, A., et al. (2022). Impact of land-use changes on soil properties and carbon pools in India: A meta-analysis. Front. Environ. Sci. 9, 794866. doi:10.3389/fenvs.2021.794866 |
Pang, R. Q., Hu, N., Zhou, J. R., Sun, D. Q., and Ye, H. Y. (2022). Study on eco-environmental effects of land-use transitions and their influencing factors in the central and southern liaoning urban agglomeration: A production-living-ecological perspective. Land 11 (6), 937. doi:10.3390/land11060937 |
Song, X. P., Hansen, M. C., Stehman, S. V., Potapov, P. V., Tyukavina, A., Vermote, E. F., et al. (2018). Global land change from 1982 to 2016. Nature 560, 639–643. doi:10.1038/s41586-018-0411-9 | |
Tesfaw, A. T., Pfaff, A., Golden Kroner, R. E., Qin, S., Medeiros, R., and Mascia, M. B. (2018). Land-use and land-cover change shape the sustainability and impacts of protected areas. Proc. Natl. Acad. Sci. U. S. A. 115, 2084–2089. doi:10.1073/pnas.1716462115 | |
Wang, J. F., Zhang, T. L., and Fu, B. J. (2016). A measure of spatial stratified heterogeneity. Ecol. Indic. 67, 250–256. doi:10.1016/j.ecolind.2016.02.052 |
Wang, L. Y., Zhang, S. Y., Liu, Y. F., and Liu, Y. L. (2022). Interaction between construction land expansion and cropland expansion and its socioeconomic determinants: Evidence from urban agglomeration in the middle reaches of the yangtze river, China. Front. Environ. Sci. 10, 882582. doi:10.3389/fenvs.2022.882582 |
Wang, X., Zhao, X. L., Zhang, Z. X., Yi, L., Zuo, L. J., Wen, Q. K., et al. (2016). Assessment of soil erosion change and its relationships with land use/cover change in China from the end of the 1980s to 2010. Catena 137, 256–268. doi:10.1016/j.catena.2015.10.004 |
Wang, Y., Xia, T. T., Shataer, R., Zhang, S., and Li, Z. (2021). Analysis of characteristics and driving factors of land-use changes in the Tarim River Basin from 1990 to 2018. Sustainability 13, 10263. doi:10.3390/SU131810263 |
Wang, Y., Zhang, S., Zhen, H., Chang, X. E., Shataer, R., and Li, Z. (2020). Spatiotemporal evolution characteristics in ecosystem service values based on land use/cover change in the Tarim River basin, China. Sustainability 12 (18), 7759. doi:10.3390/su12187759 |
Wiggering, H., Dalchow, C., Glemnitz, M., Helming, K., Müller, K., Schultz, A., et al. (2006). Indicators for multifunctional land use-linking socio-economic requirements with landscape potentials. Ecol. Indic. 6 (1), 238–249. doi:10.1016/j.ecolind.2005.08.014 |
Winkler, K., Fuchs, R., Rounsevell, M., and Herold, M. (2021). Global land use changes are four times greater than previously estimated. Nat. Commun. 12 (1), 2501. doi:10.1038/s41467-021-22702-2 | |
Xiao, X. Y., Li, X. B., Jiang, T., Tan, M. H., Hu, M. Y., Liu, Y. Q., et al. (2019). Response of net primary production to land use and climate changes in the middle-reaches of the Heihe River Basin. Ecol. Evol. 9 (8), 4651–4666. doi:10.1002/ece3.5068 | |
Xiong, L. W., Li, S. X., Zou, B., Peng, F., Fang, X., and Xue, Y. (2022). Long time-series urban heat island monitoring and driving factors analysis using remote sensing and geodetector. Front. Environ. Sci. 9, 828230. doi:10.3389/fenvs.2021.828230 |
Yang, L. J., Yang, X. R., Wei, W., and Pan, J. H. (2020). Spatio-temporal evolution and influencing factors of water resource carrying capacity in shiyang river basin: Based on the geographical detector method. Water Supply 20 (4), 1409–1424. doi:10.2166/ws.2020.057 |
Ye, Z. X., Chen, Y. N., Li, W. H., and Yan, Y. (2009). Effect of the ecological water conveyance project on environment in the Lower Tarim River, Xinjiang, China. Environ. Monit. Assess. 149 (1-4), 9–17. doi:10.1007/s10661-008-0178-9 | |
Yunus, A. J. M., Nakagoshi, N., and Lbrahim, A. L. (2003). Application of GIS and remote sensing for measuring and evaluating land-use change and its impact on water quality in the Pinang River watershed. Ecol. Civ. Eng. 6 (1), 97–110. doi:10.3825/ece.6.97 |
Zhai, Y. X., Zhang, F. Y., and Ma, L. N. (2022). Changes of production-living-ecology land transformation and eco-environmental effects in Xinjiang in last 40 years. Chin. J. Soil Sci. 53 (03), 514–523. doi:10.19336/j.cnki.trtb.2021073102 |
Zhang, F., Wang, J., and Wang, X. P. (2018). Recognizing the relationship between spatial patterns in water quality and land-use/cover types: A case study of the jinghe oasis in Xinjiang, China. Water 10, 646. doi:10.3390/w10050646 |
Zhang, H., Xue, L. Q., Wei, G. H., Dong, Z. C., and Meng, X. Y. (2020). Assessing vegetation dynamics and landscape ecological risk on the mainstream of Tarim River, China. Water 12 (8), 2156. doi:10.3390/w12082156 |
Zhang, Q. Q., and Zhang, T. Z. (2018). Land consolidation design based on an evaluation of ecological sensitivity. Sustainability 10 (10), 3736. doi:10.3390/su10103736 |
Zhao, R. F., Chen, Y. N., Shi, P. J., Zhang, L. H., Pan, J. H., and Zhao, H. L. (2013). Land use and land cover change and driving mechanism in the arid inland river basin: A case study of Tarim River, Xinjiang, China. Environ. Earth Sci. 68 (2), 591–604. doi:10.1007/s12665-012-1763-3 |
Keywords: production-living-ecological space (PLES), eco-environmental effect, geographic detector model, driving factors, tarim river basin
Citation: Wang Y, Wang Y, Xia T, Li Y and Li Z (2022) Land-use function evolution and eco-environmental effects in the tarim river basin from the perspective of production–living–ecological space. Front. Environ. Sci. 10:1004274. doi: 10.3389/fenvs.2022.1004274
Received: 27 July 2022; Accepted: 25 August 2022;
Published: 16 September 2022.
Edited by:
Wei Shui, Fuzhou University, ChinaReviewed by:
Dingde Xu, Sichuan Agricultural University, ChinaXinchen Gu, Tianjin University, China
Zhixun Huang, Michigan State University, United States
Qiang Yu, Beijing Forestry University, China
Shanshan Wang, Xinjiang Institute of Ecology and Geography (CAS), China
Copyright © 2022 Wang, Wang, Xia, Li and Li. This is an open-access article distributed under the terms of the Creative Commons Attribution License (CC BY). The use, distribution or reproduction in other forums is permitted, provided the original author(s) and the copyright owner(s) are credited and that the original publication in this journal is cited, in accordance with accepted academic practice. No use, distribution or reproduction is permitted which does not comply with these terms.
*Correspondence: Yang Li, bHlfbWx5QDEyNi5jb20=
†These authors have contributed equally to this work and share first authorship