- 1College of Environmental Sciences and Engineering, Peking University, Beijing, China
- 2Institute for Global Health and Development, Peking University, Beijing, China
- 3The Administrative Center for China’s Agenda 21, Beijing, China
To meet the carbon neutrality target and Beautiful China goal, the co-control strategy of carbon emission and air pollution is crucial. The Beijing-Tianjin-Hebei region is a prominent cooperative development zone, which faces dual challenges of CO2 emission reduction and air pollution control. This study aims to find the co-benefit pathway for achieving both targets in Beijing-Tianjin-Hebei. Based on an innovative and integrated framework by linking the computable general equilibrium model, atmospheric environment analysis model and health impact assessment model, we analyze the mutual co-benefits of carbon reduction and air quality improvement by climate and environmental policies. The results show significant mutual effects of CO2 emission mitigation and air pollution reduction. From the regional view, air pollutants control and CO2 mitigation policies have a relatively higher synergistic emission reduction effect in Beijing and Tianjin than in Hebei. From the sector perspective, the energy supply and transport sectors have much higher co-effects with CO2 reduction, while climate change mitigation policies have the best co-effects with air pollution reduction in the energy supply and residential sectors. Moreover, the health benefits in the air pollution control scenario (6.0 BUSD) are higher than in the decarbonization scenario (5.7 BUSD). In addition, climate mitigation policies could have tremendous synergistic air pollution reductions, even the health benefits (5.7 BUSD) may be insufficient to offset the cost (18.7 BUSD) of climate policy in the current situation. In order to better achieve the dual climate and air quality targets at lower costs, two types of policies should be better coordinated in the decision-making process.
1 Introduction
The Beijing-Tianjin-Hebei (BTH) region, known as the “capital economic circle” in North China, has been the fastest-developing economic zones globally. In addition, BTH also plays an essential role in national political and cultural development. The gross domestic product (GDP) in BTH shared more than 8.5% of the total in China in 2021 (NBSC, 2022). BTH is an urban agglomeration that faces severe carbon and air pollutant emissions, which is also a big issue in China. Carbon dioxide (CO2) emissions in 2019 accounted for 12% of the total in China from China Emission Accounts and Datasets (CEADs) (Guan et al., 2021). Annual average PM2.5 concentrations ranged from 38 to 51 μg m−3 in the BTH and surrounding areas (CNEMC, 2021), higher than the recommended limit of 10 μg m−3 in 2005 air quality guidelines, while the recommended 2021 air quality guidelines of 5 μg m−3, proposed by the World Health Organization (WHO, 2021). In addition, due to historical reasons, government fragmentation caused by administrative and fiscal decentralization hinders regionally coordinated emission reduction (Liu et al., 2016). Therefore, the synergic emission reduction of climate change and environmental pollution and regional cooperation in the BTH region have become an unavoidable problem that needs to be solved urgently.
In order to solve CO2 emissions and air pollution problems, China has launched many policies and actions (Xie et al., 2018). China promised to achieve the carbon neutrality target before 2060. In 2015, the Political Bureau of the Central Committee of the Communist Party of China reviewed and approved the “Outline of Beijing-Tianjin-Hebei Cooperative Development Planning”, in which the coordinated development of BTH became an important strategy. The co-control approach would be vital to achieving energy/carbon intensity targets and controlling air pollution (Mao et al., 2013). Various studies have also explored the issues of attaining low-carbon transition and improving air quality. For example, for the sector research, Qian et al. demonstrated that energy intensity improvement, scale structure adjustment and electrification could achieve air pollution and CO2 emissions mitigation co-benefits in China’s industries (Qian et al., 2021). As China’s most prominent economic zone, the Yangtze River Delta has been researched for the co-benefits of air pollution and climate change mitigation in the industry sector (Zheng et al., 2016). Xian et al. focused on the least marginal abatement cost of CO2 emissions in the iron and steel industry in China (Xian et al., 2022). A case study for the power sector in Brazil showed that carbon emission mitigation constraints might raise particulate matter formation and human toxicity, but introducing available end-of-pipe pollution control technologies can offset these tradeoffs (Portugal-Pereira et al., 2018). In addition, for the transportation sector, Liang et al. found that higher penetration of fleet electrification could achieve greater air quality, climate and health benefits (Liang et al., 2019).
Researchers also found that the residential sector could obtain substantial health and carbon co-benefits by using heat pumps with the power sector decarbonization (Zhou et al., 2022). Some regions like Tibet, with more clean air quality, could achieve the carbon-neutrality target earlier by improving the solar-power output (Chen et al., 2022). From the perspective of air pollution reduction, a previous study explored environmental inequality from inter-provincial trade (Dong et al., 2022), revealing that more than 70% of air pollution was embodied in national exports in less developed regions (Zhang et al., 2018). Tang et al. reported that an early peak in carbon dioxide emissions had potential health benefits in China (Tang et al., 2022). Jiang et al. found that the sulfur tax/nitrogen tax could cover the carbon intensity target using a computable general equilibrium (CGE) model (Jiang et al., 2022). Some researchers also focused on the health benefits of carbon and air pollution control. The stringent coordinated control policies of climate change mitigation and air pollution reduction have the most considerable health benefits (Rafaj et al., 2021). To attain the “Beautiful China” target, a profound reduction in CO2 emissions is necessary, and it should be more strict than its Nationally Determined Contribution (NDC). It also would bring magnificent health benefits because of the air quality improvement (Xing et al., 2020). The aforementioned researches mainly discussed the effects of air pollutant emission reduction and CO2 emission impacts or health effects separately, or in a one-directional way from carbon reduction to air pollution improvement. Few considered the implications of the other way, namely, the co-benefit or tradeoff effects of air pollution control policy on climate change. Moreover, there was already a wealth of research on the impacts of climate change policies on improving air quality, avoiding premature deaths, health benefits, and climate policy costs. However, most existing studies lacked various co-benefits evaluations simultaneously, such as studying the impacts of the air pollution control policy on CO2 emission mitigation, avoiding premature deaths, health benefits and the air pollution control cost.
This study aims to fill the above research gaps, mainly focusing on the carbon neutrality target and air pollution control policy to find the co-benefit pathway for both targets in BTH. For this purpose, we adopt an innovative and integrated analytical framework to analyze the mutual co-benefits of the carbon neutrality target and air quality improvement policy. Common modeling tools can be broadly divided into two types: top-down models (TD models) and bottom-up models (BU models). Due to the inevitable limitations of both models, hybrid models that combine TD and BU models have been applied more frequently in recent years to capture both macroeconomic changes and technical details. Thus, the framework, as detailed in the methodology section, links the Integrated Model of Energy, Environment and Economy for Sustainable Development|Computable (IMED|CGE), Greenhouse Gas-Air Pollution Interactions and Synergies (GAINS) model, and health impact assessment model of Integrated Model of Energy, Environment and Economy for Sustainable Development|Health (IMED|HEL), which enables this study to determine the cost-efficient pathway to co-control air pollution and CO2 emissions in BTH. The policy implications could also provide a reference for other regions to achieve deep decarbonization and improve air quality.
The rest of the paper is arranged as follows. The methodology and data sources in this study are detailed in Section 2. The results and discussion of carbon reduction, air quality improvement and mutual effects of the two policies are presented in Section 3. Section 4 gives the conclusion and related policy implications.
2 Methodology
2.1 Scenario design and data sources
We design three scenarios for this study. The first one is a reference (REF) scenario, and it follows the newest Nationally Determined Contributions (NDC) target at the 75th United Nations General Assembly in 2020, proposed by President Xi Jinping (Mallapaty, 2020). The REF is designed to consider CO2 emission intensity of GDP reduced by 65% in 2030 compared with the 2005 level. The air pollution perspective uses the existing control measures and related policies (Table 1). The second scenario is set with an air pollution cap (CAP), which focuses on air pollution control by conducting a strict air quality policy to control air pollution. The third scenario is designed following climate change to limit global warming below 1.5° (1.5D) above the pre-industrial levels (UNFCC, 2015). The 1.5D scenario is designed strictly to control CO2 emissions in the BTH region through 2030.
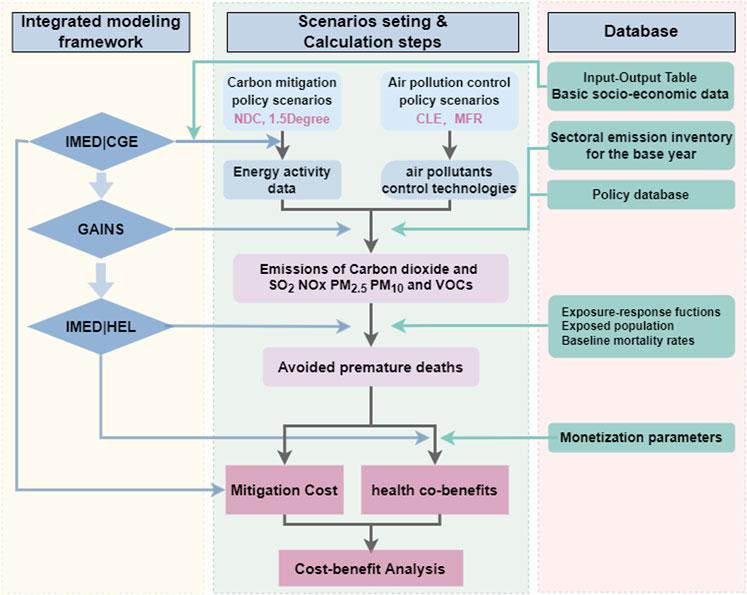
The REF scenario is the baseline to predict the current policy extension until 2030. The comparison between CAP and REF scenarios shows the co-benefits of CO2 emission reduction, air quality improvement and health effects because of the air pollution control policy. The difference between 1.5D and REF scenarios exhibits the impacts on the CO2 emission mitigation policy. Thus, based on these three scenarios, we could directly study the mutual co-benefits of carbon mitigation targets and air pollution policies in the BTH region until 2030. The research data in this study is mainly from the 2017 Input-Output Table, China Statistical Yearbook, China Financial Yearbook and China Energy Statistical Yearbook of Beijing, Tianjin and Hebei. The overall framework is shown in Figure 1.
2.2 Integrated model of energy, environment, and economy for sustainable development | Computable general equilibrium model
The Integrated Model of Energy, Environment, and Economy for Sustainable Development | Computable General Equilibrium (IMED | CGE) model can describe interactions and feedback effects between different entities in the economic system in great detail1. The IMED|CGE model is a multi-regional, recursive dynamic CGE model with 25 aggregated economic sectors developed by the Laboratory of Energy & Environmental Economics and Policy (LEEEP) at Peking University. It provides an integrated analysis framework to assess the global, national, and provincial economic and environmental impacts of various climate policies (Cheng et al., 2016). Mathematical Programming System solves the model for General Equilibrium under the General Algebraic Modeling System (GAMS/MPSGE) at a 1-year time step (Cheng et al., 2015). Furthermore, the CGE model consisted of four closely linked blocks: a production block, a trading block covering domestic and foreign markets, and the government and household income and expenditures blocks.
We build the CGE model for the BTH region and the base year is from 2017 to 2030. The 2017 energy balance table and input-output table of the BTH region are used to calibrate the base year data. The unique advantages of applying a CGE model in this study include: 1) its ability to capture the dynamic evolution of the energy system, which is largely affected by industry upgrading under carbon emission constraints, and 2) showing the corresponding costs that occurred for the whole system (e.g., GDP losses, consumption losses).
2.3 Greenhouse gas-air pollution interactions and synergies models
Developed and maintained by the International Institute of Applied Systems Analysis (IIASA), the GAINS model is an integrated assessment model, covering more than 160 regions worldwide in different versions. It has been widely used to assess the co-benefits reduction strategies of carbon mitigation and air pollution control policies (Klimont et al., 2017). In the setting for cost minimization, the model evaluates the technical cost and environmental benefits of different emission control policies and therefore identifies the cost-optimal pathway to achieve the carbon emission ceilings or air quality target (Wagner et al., 2012).
The GAINS-China Model is applied in this study to calculate PM2.5 concentration under different scenarios and technical features, including fuel types and fuel quantity (Mir et al., 2022). Activity data of energy consumption corresponding to research purposes are derived from IMED|CGE model and fed into the GAINS model. Based on current/future emissions in a specific range, the GAINS-China model then simulates the resulting atmospheric PM2.5 concentration fields. This estimation takes into account inter-transmission in the BTH region and inflow from other provinces. At last, premature deaths and monetized health benefits attributed to ambient PM2.5 exposure are estimated by IMED|HEL model.
2.4 Integrated model of energy, environment, and economy for sustainable development | Health model
The IMED|HEL model is a health impact assessment model that could evaluate the disease burden and induced economic losses attributed to air pollution or climate change. This model has been widely used in studies to analyze the health implications of global, national, or local air pollution control policies, as well as the health co-benefits under climate change mitigation policies. The IMED|HEL model can conduct a more comprehensive health and economic impact assessment of the PM2.5 pollution and allows for a more flexible choice of exposure-response functions (ERFs) and the gridded socioeconomic data used for the evaluation. The input data for this model include exposure or concentration level of air pollution, the exposed population, and the updated ERFs from epidemiologic studies. Available choices of ERFs include the log-linear form function, the integrated exposure-response (IER) function, and the Global Exposure Mortality Model (GEMM); these enable uncertainty analysis of the health co-benefit in terms of ERFs. In this study, the IMED|HEL model quantifies the relative risk of PM2.5-related morbidity and mortality for each 0.5°grid in the BTH region and estimates total excess morbidity, mortality, and work loss under each scenario. The monetization module in this model then assesses the corresponding economic losses induced by the disease burden, and the avoided financial losses under carbon mitigation scenarios were further compared with the costs of carbon mitigation.
2.5 Quantification of mutual co-benefits
This study uses two parameters for quantitatively assessing the mutual co-benefits between CO2 emission mitigation and air pollution reduction policies. The first parameter is S1, which reflects the synergistic effects of air pollutants control policy on CO2 mitigation. It is the ratio of the relative emission change rate of CO2 to air pollutants’ relative emission change rate, as shown in Eq. 1.
In contrast to S1, S2 is the ratio of the relative emission change rate of air pollutants to the relative change rate of CO2, as shown in Eq. 2.
where ΔCO2 represents the CO2 emission changes in policy scenario compared with REF, with a unit of Mt, and the ΔPollutant with a unit of Mt, represents the emission changes of five types of air pollutants in the policy scenario compared with REF. Five types of air pollutants include SO2, NOx, PM2.5, PM10, VOCs.
The parameters S1 and S2 have been used to estimate the magnitude of co-benefit effects (Jiao et al., 2020). Moreover, the meaning of two levels of positive and negative is: S < 0, which means that the mitigation measures will lead to a negative correlation; S = 0, means that the actions have no co-benefits; S > 0, means that the measures have positive co-benefits, and the higher value of S1 and S2 exhibits the better of co-benefit effects.
3 Results and discussion
3.1 CO2 and air pollutants emission trajectory
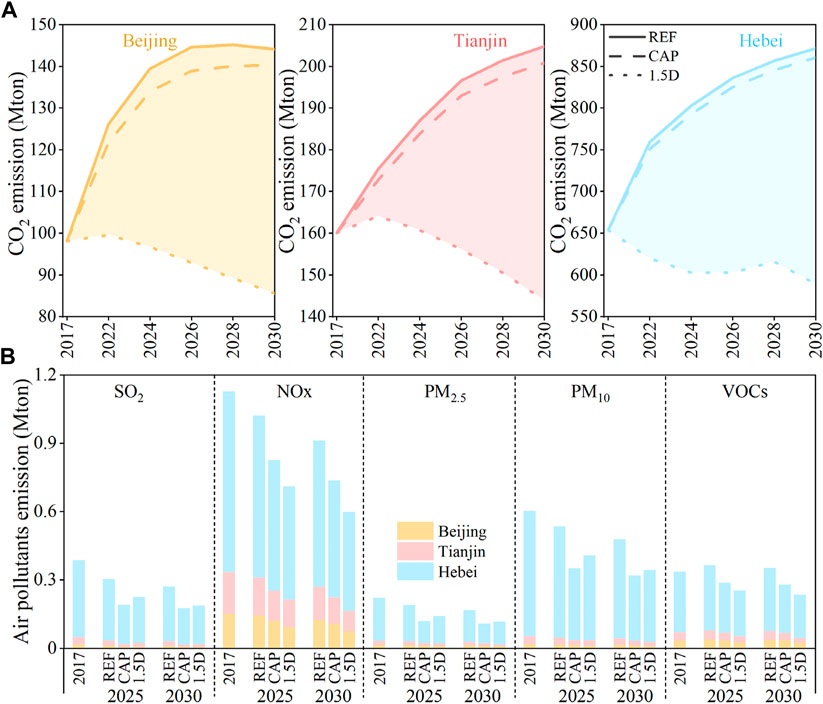
From the region’s perspective, we find that no matter CO2 or air pollutants, the highest emission quantity occurs in the Hebei province in the BTH (Figure 2). The main reason is that Hebei took the industry as the leading development, which resulted in high emissions (Gao and Wang, 2022). From the perspective of CO2 emissions, Tianjin is next to Hebei, and Beijing emits the least. The simulation results indicate that without more aggressive efforts on emission abatement, CO2 emissions in Tianjin and Hebei would keep increasing until 2030. In contrast, Beijing’s emissions grow first and then decrease (Figure 2A). The amount of CO2 emissions increased by about 46 Mton (+46.9%), 45 Mton (+27.9%) and 218 Mton (+33.3%) relative to 2017 in Beijing, Tianjin and Hebei, respectively in REF. Notably, CO2 emissions experience a plateau after 2026 in Beijing under the CAP scenario, while it shows the continuing rise in Hebei and Tianjin. CO2 emissions in Beijing, Tianjin and Hebei are reduced by 2.7, 1.9 and 1.3%, respectively, in CAP compared with the REF scenario in 2030. Under 1.5D scenario, all of Beijing, Tianjin and Hebei could achieve significant emission reductions. These three regions reduce their CO2 emissions respect by 13 Mton (−12.8%), 16 Mton (−10.1%) and 65 Mton (−9.9%) in 2030 relative to 2017 in 1.5D relative to REF. CO2 emissions in 2030 are 85.6, 144.0 and 589.3 Mton in 1.5D. It shows that under strict constraints of climate change, CO2 emissions could get deep reductions.
Air pollutants show decreasing trends from 2017 to 2030 in the BTH region under three scenarios, while only VOCs emission in REF slightly increases in 2025 and then declines (Figure 2B). This is mainly because VOCs are not emphasized enough in existing policies and their complex composition, as well as comprehensive sources, also contribute to the difficulties of emission reduction. Under the REF scenario, SO2, NOx, PM2.5, PM10 emissions in the BTH region are projected to be reduced by 29.9, 19.1, 24.6, 20.8% from 2017 to 2030, respectively. Such substantial reductions demonstrate the effectiveness of current air pollution control policies, even though GDP and energy consumption continues to increase. However, the emissions of VOCs have increased by 5.4%. Under the 1.5D scenario, the reductions in SO2 (50.6%), NOx (46.9%), PM2.5 (48.2%), PM10 (43.3%) and VOCs (30.2%) in 2030 relative to 2017 can be realized by the low-carbon energy transition required to meet the climate change target. With the maximal application of air pollution control measures (CAP), all pollutant emissions also achieve further reductions, SO2 (54.7%), NOx (34.7%), PM2.5 (51.3%), PM10 (47.1%) and VOCs (16.7%). Notably, air pollutants of SO2, PM2.5 and PM10 in CAP are lower than under the 1.5D scenario, while NOx and VOCs get the inverse result. It indicates that the climate mitigation policy could simultaneously decrease the emissions of NOx and VOCs. However, for SO2, PM2.5 and PM10, direct air pollution control policies are more effective. Air pollutants in Hebei account for more than 70% of the BTH region in three scenarios, mainly due to the geographical condition and high share of heavy industry in Hebei.
Therefore, our results reveal that the CO2 emissions difference between CAP and 1.5D were significant. Specifically, CO2 emission in 1.5D is lower than 39.0, 28.3 and 31.5% relative to CAP in 2030 in Beijing, Tianjin and Hebei, respectively. In addition, the CO2 emissions difference between 1.5D and REF is much higher than the difference between the CAP and REF scenarios in Beijing, Tianjin and Hebei in 2030. Nonetheless, SO2, PM2.5 and PM10 emissions in 1.5D are only around 6.9, 6.5 and 7.1% higher than in CAP in 2030 for three regions. NOx emission in CAP is higher than 45.9, 29.3 and 18.0% under 1.5D in 2030 in Beijing, Tianjin and Hebei, respectively. VOCs emission difference between CAP and 1.5D is 32.8, 36.4 and 10.5% in 2030 in Beijing, Tianjin and Hebei, respectively. These results reveal that the 1.5D scenario, which has a strict climate mitigation policy, shows a profound reduction in CO2 and air pollutants emissions. As the most prominent industry region, Hebei has the highest emissions reduction potential.
From the perspective of sectors, we figure out that more than 80% of CO2 is emitted from industry and energy supply sectors in three scenarios from 2017 to 2030 (Figure 3A). CO2 emission in each sector shows an increasing trend with time in REF, while the emission share of each sector differs slightly. Compared with REF, the highest CO2 emission reduction sector is the energy supply at 1.5D, which is lower than 179.5 Mton (35.2%) relative to the energy supply sector in the REF scenario in 2030. The most significant emissions of SO2 in the three scenarios are all in the residential, energy supply and industry sectors, mainly due to the high consumption of coal (Jiang et al., 2020). Generally speaking, the residential sector has the highest potential for SO2 reduction in BTH because it needs the energy transition from high emission energy to clear and efficient ones. For NOx and VOCs, the most prominent emission sector is transportation, mainly due to the high intensity of traffic and a large share of fossil fuel technologies in the transportation sector (Yu et al., 2014). However, for PM2.5 and PM10, the primary source is from the residential and industrial sectors, respectively (Figure 3B). In addition, air pollutants reductions in energy supply and transport sectors in 1.5D are lower than in CAP. It indicates that air pollution control could depend on the end-of-pipe pollution control technologies and the CO2 emission mitigation policies (Yang et al., 2021b). In addition, CO2 mitigation policies have a relatively good synergy with NOx and SO2, mainly due to their same root homology with CO2 (Xu et al., 2021).
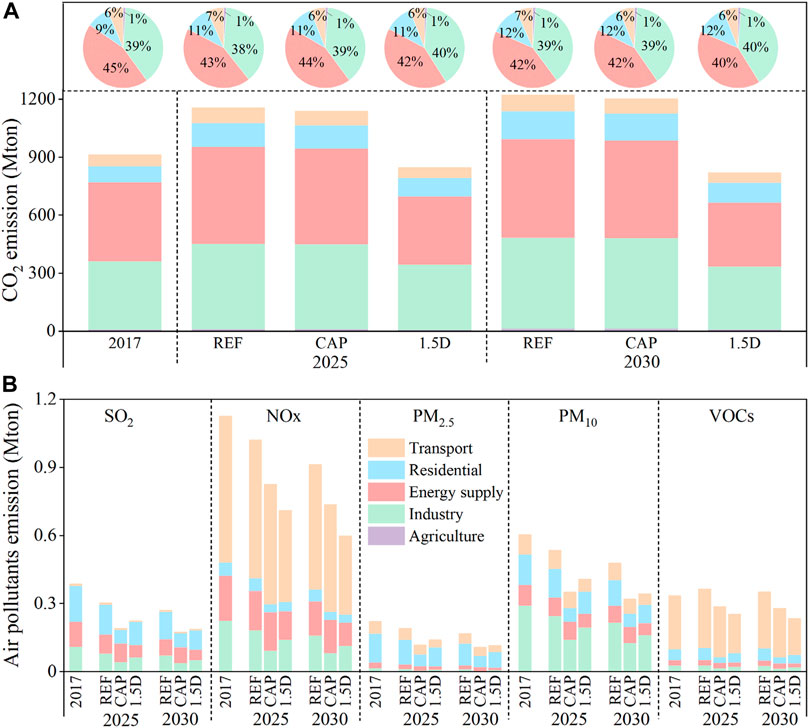
FIGURE 3. CO2 (A) and air pollutants (B) emissions in the Beijing-Tianjin-Hebei region by sectors. Inset charts in (A) presented the CO2 emission share of each sector in related years and scenarios.
3.2 Output change and emission intensity change trends
Both CO2 mitigation targets and air pollution policies would have a short-term negative impact on the economy, leading to a declining trend of total output under the CAP and the 1.5D scenarios relative to the REF scenario in 2030 (Figure 4A). The output change in the 1.5D scenario is much higher than in the CAP scenario. Under the CAP scenario, the total output in Beijing, Tianjin and Hebei is reduced by 5.54 billion USD (BUSD, −0.25%), 5.87 BUSD (−0.38%), 9.89 BUSD (−0.36%) relative to the REF scenario in 2030, respectively. While, under the 1.5D scenario, the total output decreases by 44.7 BUSD (−2.0%), 56.3 BUSD (−3.6%) and 122.4 BUSD (−4.4%) in Beijing, Tianjin and Hebei, respectively. Due to a cleaner energy system and more advanced technologies, Beijing suffers less economic loss than Tianjin and Hebei (Jin et al., 2020). From the perspective of sectors, we find that the output of the energy supply sector in all three regions has an evident decrease under the 1.5D scenario relative to the REF scenario. The net decline value ranges from 26.5 BUSD in Tianjin to 42.1 BUSD in Beijing. The principal output decrease in CAP relative to REF is in the transport sector in Beijing, Tianjin and Hebei. The transport and energy supply sectors have a similar output value reduction in the 1.5D scenario compared with REF in Beijing. The reduction output is 37.4 BUSD and 42.1 BUSD, respectively. However, the industry and residential sectors under the 1.5D scenario have an increased output relative to REF in Beijing.
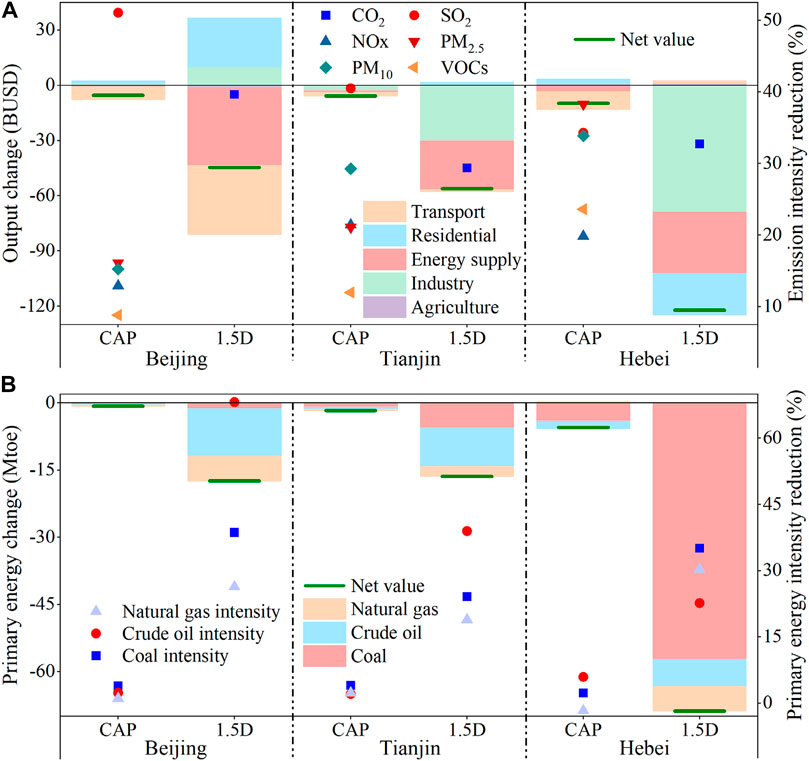
FIGURE 4. Output change and emission intensity change in Beijing, Tianjin and Hebei in different sectors of CAP and 1.5D scenarios compared with REF in 2030 (A), primary energy change and energy intensity reduction in Beijing, Tianjin and Hebei of different energy types in CAP and 1.5D scenarios compared with REF in 2030 (B). The change of air pollutants emission intensity and the 1.5D scenario shows the CO2 emission intensity change.
In contrast, the output value of the industry sector in the 1.5D scenario is lower than in REF in Tianjin and Hebei, which shares 53.8 and 56.4% of net output reduction in these two regions, respectively. Hebei is the only region with a declined output in the residential sector in the 1.5D scenario. Both scenarios show the emission intensity reduction compared to REF in three regions, exhibiting the positive effects of policies for emission reduction. The carbon intensity of the 1.5D scenario would be reduced by 40.6, 29.7, 32.4% relative to the REF scenario in Beijing, Tianjin, and Hebei in 2030, respectively (Figure 4A). Compared to 2005, the carbon intensity in 2030 reduce 82.3, 71.3, 65.5% in these three regions. Results show that the 1.5D scenario is well above the carbon mitigation target in 2030 required to meet the carbon neutral target, which declared a reduction of 65% from 2030 to 2005. Under the CAP scenario, all pollutants emissions are further reduced relative to the REF scenario, particularly SO2, PM2.5 and PM10, mainly resulting from more energy-efficient technologies and comprehensive implementation of the ultralow emission standards. However, in view of the increasingly serious environmental problems, NOx and VOCs need to be further reduced, requiring a mix of climate change and air pollution policies (Cao and Yin, 2020).
Consistent with previous studies, the reduction of energy consumption relative to REF under the 1.5D scenario is much larger than that under the CAP scenario. Under the 1.5D scenario, primary energy consumptions in Beijing, Tianjin and Hebei are reduced by 17.4 Mton (−45.0%), 16.4 Mton (−29.1%) and 68.9 Mton (−32.7%), respectively, to meet the climate change target, while only 0.75 Mton (−1.9%), 1.70 Mton (−3.0%), and 2.60 Mton (−2.6%) under the CAP scenario (Figure 4B). The significant difference between the two scenarios is mainly because with carbon emissions tightly linked to energy consumption, the climate change target requires significant reductions in fossil fuels. At the same time, air pollution control policies focus on end-of-pipe technologies. In addition, the energy consumption reduction potential varies across the three regions. In Hebei, the reduction potential of coal consumption under the 1.5D scenario is the most (57.3 Mtoe), accounting for 83.2% of the total reduction, but is the least significant (7.3%) in Beijing due to its low coal consumption. However, oil has the highest emission reduction potential in Beijing (61.0%) and Tianjin (52.5%) in the 1.5D scenario, reflecting the heterogeneity of provinces.
Moreover, the results of this study also show the changes in energy intensity of Beijing, Tianjin and Hebei under CAP and 1.5D scenarios compared with REF scenarios. In Beijing and Tianjin, the intensity of different energy sources declines in the same order in the 1.5D scenario, with crude oil first (68.1% in Beijing and 38.9% in Tianjin), followed by coal (38.6%, 24.1%) and natural gas (26.3%, 18.9%), while coal ranked the first (35.1%) in Hebei. However, under the CAP scenario, all kinds of energy intensity have not decreased significantly.
3.3 Mutual effects of CO2 emission mitigation and air pollution reduction
In the REF scenario, the energy supply sector is the main driving force for the growth of carbon emissions in Beijing and Tianjin (Figure 5), which accounts for almost 50% of the total increasing CO2 emissions from 2017 to 2030 in REF. Due to the heavy industries and relatively backward technologies, the industry sector drives the growth of carbon emissions in Hebei most (103.7 Mton), followed by the energy supply sector (59.6 Mton). The CAP scenario only achieves limited coordinated CO2 emission reduction relative to the REF scenario, which does not exceed 5% of total emissions. Notably, different regions’ main emission reduction sectors are different (Yang et al., 2021a). Compared with CAP, the 1.5D scenario significantly reduces carbon emissions, due to the emphasis on energy adjustment. In Tianjin and Hebei, the industry and energy supply sectors provide most of the reductions, accounting for more than 76% of the total. In Beijing, energy supply, residential and transportation departments respectively reduce emissions by 25.4 Mton (46.4%), 17.9 Mton (32.7%) and 10.5 Mton (19.2%).
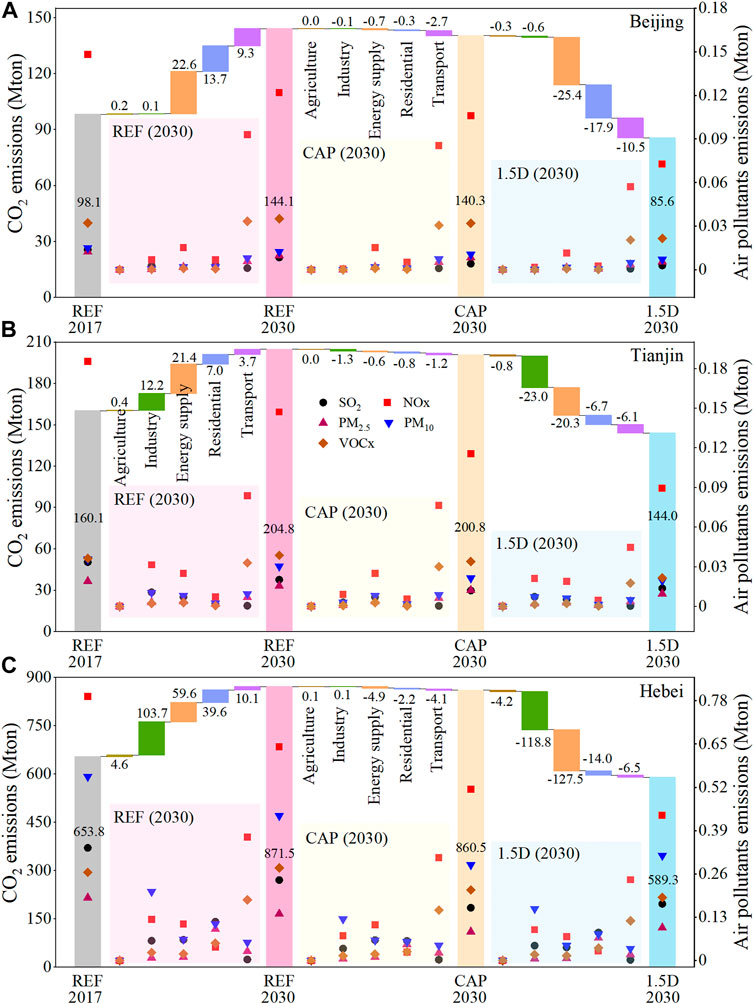
FIGURE 5. CO2 emissions of three scenarios from different sectors in Beijing (A), Tianjin (B) and Hebei (C). Light pink shaded portions are the air pollutants emission in each sector under REF scenario in 2030, light yellow shaded portions are the air pollutants emission in each sector under CAP scenario in 2030, light blue shaded portions are the air pollutants emission in each sector under 1.5D scenario in 2030.
CAP and 1.5D scenarios both have co-effects beneficial to CO2 and air pollutants reductions (Figure 6). This is consistent with the previous research (Xu et al., 2021). Under the CAP scenario, Beijing’s air pollutants reduction policy has relatively high CO2 emission decreasing effects (Figure 6A). From the perspective of study regions, we find that the VOCs emissions decreasing in Beijing and Tianjin have a high impact on CO2 reduction. CO2 emissions and air pollutants reduction ratio varies from 5 to 30% in Beijing, from 5 to 16% in Tianjin and from 3 to 8% in Hebei. The values of BTH and Hebei are consistent because emissions in Hebei dominate the total emission in BTH. In addition, results indicate that the energy supply and transport sectors have much higher co-effects with CO2 reduction in the BTH region, while the industry sector with the least co-effects. However, under the energy supply sector, PM2.5 reduction has a high potential for CO2 mitigation, while for the transport sector, four types of air pollutants have almost equally CO2 decreasing effects.
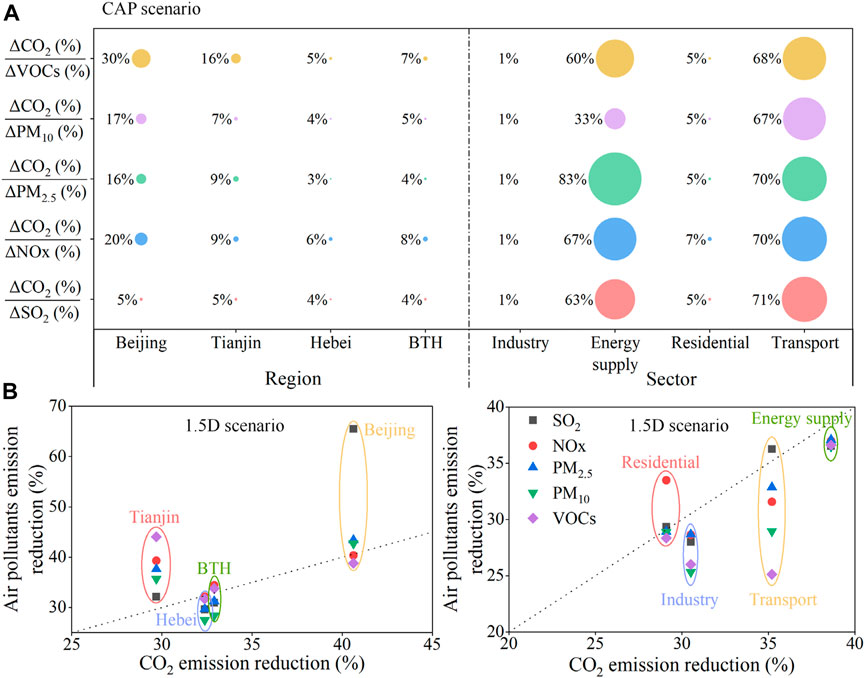
FIGURE 6. The value of CO2 emission reduction to air pollutant change in CAP scenario compared with REF from the region and sector perspectives (A), air pollutants emission and CO2 emission change compared with REF in 2030 from the region and sector perspectives (B).
All types of air pollutants in the 1.5D scenario have positive effects with CO2 reductions in each region and sector (Figure 6B), which means that CO2 mitigation policy has the co-effects of air pollutant reductions. From the regional viewpoint, the air pollution reduction with the CO2 mitigation policy in Tianjin and Beijing is higher than that in Hebei, especially in Beijing, which may be attributed to the differences in energy structure and industrial composition (Shu et al., 2022).
The co-effects of air pollutants and CO2 decreasing in the BTH region are similar to in Hebei. From the sector perspective, we find the energy supply sector with the highest CO2 emission reduction and air pollutants reductions compared with the other three sectors. In the residential sector, NOx and SO2 have a good synergy with CO2 mitigation, because both air pollutants have the same root homology with CO2, mainly from fossil fuel combustion (Radu et al., 2016). CO2 emission reduction potential in the industry sector is higher than air pollutants decreasing, and the transport sector has the same results, except for SO2 emission, with the reduction potential higher than CO2. In addition, the co-effects of various pollutants in the transport sector vary greatly, primarily due to the different emission sources of different air pollutants in the transport sector.
3.4 Co-benefits of CO2 emission mitigation and health impacts
Compared with the REF, both CAP and 1.5D scenarios have avoided premature deaths associated with PM2.5 exposure with the significant benefits of air quality improvement in three regions (Figure 7A). The reduced PM2.5 exposure-related deaths in the CAP scenario (an estimate of 3,488 cases decrement relative to REF) are slightly higher than in the 1.5D scenario (3,466 cases) in the BTH region. It implies that end-of-pipe pollution control technologies still have significant near-term emission reduction potential and health impacts. Due to its large population and severe pollution, Hebei gets the most quantity of avoided mortality (2,881 in CAP and 2,455 in 1.5D, respectively relative to REF), followed by Beijing (499 in CAP and 724 in 1.5D, respectively relative to REF) and Tianjin (108 in CAP and 285 in 1.5D, respectively, relative to REF). Notably, Beijing and Tianjin’s avoided premature deaths in 1.5D are more than in CAP, while Hebei gets the reverse result. These results indicate that air pollution control policy has significant effects on the high level of PM2.5 concentration. However, decarbonization policy would play a prominent role at the stage of “a microgram” situation. Climate change mitigation policies often produce more air quality improvement than the reverse. Nevertheless, the CAP scenario has substantial health effects and air quality improvement in Hebei, with high CO2 and air pollutants emissions.
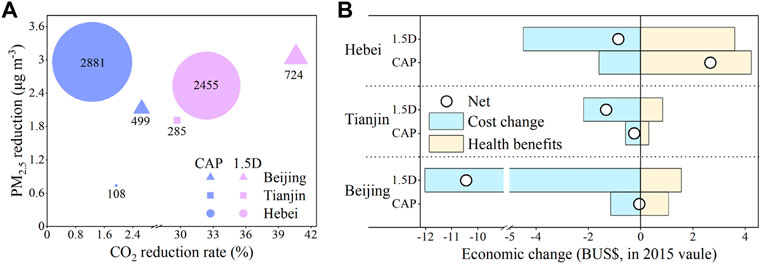
FIGURE 7. (A) Co-benefit of CO2 emission reduction and air quality improvement in CAP and 1.5D scenario relative to REF, the size of the geometrical shape represents the avoided premature deaths compared with REF. (B) Economic benefits of both air quality-related health benefits and decreasing CO2 emissions in two scenarios in three regions.
Moreover, the study compares the air pollutants control costs of CAP and CO2 mitigation policy of 1.5D scenarios relative to REF. The results indicate that 1.5D has more cost than CAP in each region (Figure 7B). The net economic change of Beijing, Tianjin and Hebei in CAP and 1.5D scenarios compared with REF is almost negative, only in Hebei in the CAP scenario with a positive net value. It shows that the health benefits of controlling the air pollutants emission in Hebei could offset the policy costs, which suggests that the air pollution control policy had significant health benefits in worse air quality regions. However, the net economic value is close to zero under the CAP scenario in Beijing and Tianjin. It presents the low health benefits resulting from the environment-improving policy in relatively good air quality regions. In contrast, under the 1.5D scenario, it could not offset the climate mitigation costs in all three regions with health benefits, particularly in Beijing, with the economic loss (12.0 BUSD) far more than the health benefits (1.57 BUSD). This phenomenon indicates that the climate mitigation policy before 2030 is difficult to show the health benefits, and the health risk would decrease in the long term under the strict climate change mitigation policy (Li et al., 2018; Wang et al., 2020), such as carbon neutrality and 1.5°C climate target.
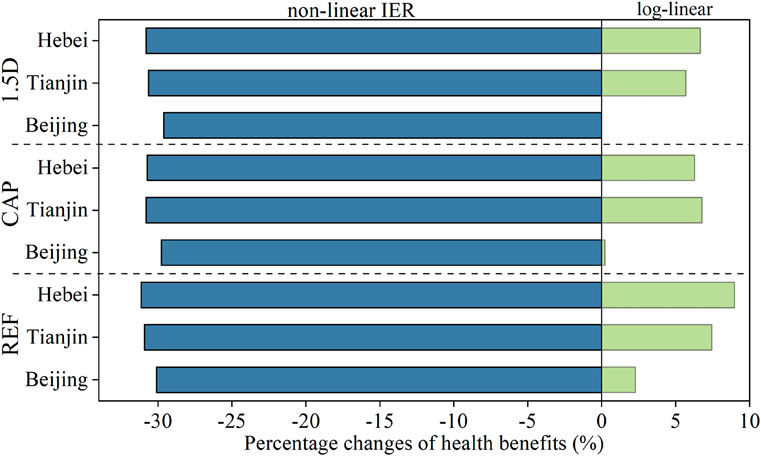
Previous studies have shown that the choice of ERFs may lead to great uncertainties in assessing PM2.5-related health benefits. In order to arrive at reasonable results and conclusions, a sensitivity analysis was further conducted with two additional different ERFs, log-linear form function and non-linear IER. The results represent that the health benefits of using the log-linear form function are slightly higher than those estimated using the GEMM function. In contrast, the results in using the non-linear IER are far lower than the original value. The difference in health benefits between the log-linear form function and the GEMM function in Beijing is smaller than in Beijing and Hebei, varying from almost zero to 2.3% in three scenarios, while Tianjin and Hebei vary from 5.7 to 9.0% (Figure 8). Under the non-linear IER function, the health benefits are about 30% lower in almost all scenarios in three regions compared to the GEMM function, ranging from 29.6 to 31.1%. The sensitivity analysis results in this study align with the previous research (Peng et al., 2020), which suggests that uncertainty in health impact assessments may affect health benefit results, but does not generally have a decisive impact on qualitative results.
4 Conclusion
This study provides an integrated analysis framework by combining a CGE model, an air quality model and a health impact assessment model to evaluate the overall impacts of climate mitigation and air pollution control measures in the Beijing-Tianjin-Hebei (BTH) region. More specifically, under three scenarios, we quantify the effects of different policies on CO2 and air pollutants emissions and economic change. Furthermore, the mutual influences of air pollution and CO2 emission from both climate change mitigation and air pollution control policies are also explored. At last, we conduct a cost-benefit analysis of different policies to find a better pathway for decarbonization and health benefits.
Our results reveal that the BTH region’s current air pollution control and climate mitigation measures are insufficient to meet the carbon neutrality target and air quality standards. There are mutual effects of CO2 emission mitigation and air pollution reduction. From the regional view, air pollutants control and CO2 mitigation policies have a relatively higher synergistic emission reduction effect in Beijing and Tianjin than in Hebei. Moreover, from the sector perspective, in the CAP scenario, the energy supply and transport sectors have much higher co-effects with CO2 reduction, while climate change mitigation policies have the best co-effects with air pollution reduction in the energy supply and residential sectors.
This study implies that air pollution control policy has significant health effects under the high level of PM2.5 concentration. The reduced PM2.5 exposure-related deaths in the CAP scenario (an estimate of 3,488 cases decrement relative to REF) are slightly higher than in the 1.5D scenario (3,466 cases) in the BTH region. However, decarbonization policy would play a prominent role at the stage of “a microgram” situation. Besides, we find that the cost of climate mitigation policy before 2030 is difficult to offset by health benefits.
These results reveal that though climate mitigation policies could have good synergistic air pollution reductions, they may not be economically affordable. In order to better achieve the climate and air quality targets at lower costs, these two types of policies should be better coordinated across sectors and regions. We suggest a mix of carbon mitigation and air pollution control measures, specifically in the energy supply and transport sectors, to maximize the synergies. Finally, information in this study about the mutual influences of air pollution and CO2 emission supply the co-benefits policies for both climate change mitigation and air pollution control. In addition, considering the diverse ratio of benefit-cost and regional financial situations, fiscal incentives are also necessary.
Data availability statement
The original contributions presented in the study are included in the article/Supplementary Material, further inquiries can be directed to the corresponding authors.
Author contributions
Conceptualization, YF, XH; methodology, KW, YF, XH, HD and XL; formal analysis, KW and YF; data curation, KW, YF, XL and CG; writing—original draft preparation, KW and YF; writing—review and editing, YF, XH, HD, XL, SZ, ZZ and CG; supervision, HD.
Funding
This work was supported by the Natural Science Foundation of Hebei Province [grant number G2021202013], the national youth talent support program, the Hong Kong RGC-CRF (project code C7041-21G), National Natural Science Foundation of China (NSFC) [grant number 71810107001, 72,073,003], the National Social Science Fund of China (21AZD060), and the 111 Project Urban Air Pollution and Health Effects (B20009).
Conflict of interest
The authors declare that the research was conducted in the absence of any commercial or financial relationships that could be construed as a potential conflict of interest.
Publisher’s note
All claims expressed in this article are solely those of the authors and do not necessarily represent those of their affiliated organizations, or those of the publisher, the editors and the reviewers. Any product that may be evaluated in this article, or claim that may be made by its manufacturer, is not guaranteed or endorsed by the publisher.
Footnotes
1More details are available here: http://scholar.pku.edu.cn/hanchengdai/imedcge.
References
Cao, B., and Yin, Z. (2020). Future atmospheric circulations benefit ozone pollution control in Beijing-Tianjin-Hebei with global warming. Sci. Total Environ. 743, 140645. doi:10.1016/j.scitotenv.2020.140645
Chen, S., Lu, X., Nielsen, C. P., Geng, G., He, K., McElroy, M. B., et al. (2022). Improved air quality in China can enhance solar-power performance and accelerate carbon-neutrality targets. One Earth 5, 550–562. doi:10.1016/j.oneear.2022.04.002
Cheng, B. B., Dai, H. C., Wang, P., Xie, Y., Chen, L., Zhao, D. Q., et al. (2016). Impacts of low-carbon power policy on carbon mitigation in Guangdong Province, China. Energy Policy 88, 515–527. doi:10.1016/j.enpol.2015.11.006
Cheng, B. B., Dai, H. C., Wang, P., Zhao, D. Q., and Masui, T. (2015). Impacts of carbon trading scheme on air pollutant emissions in Guangdong Province of China. Energy sustain. Dev. 27, 174–185. doi:10.1016/j.esd.2015.06.001
Dong, J., Li, S., Xing, J., Sun, Y., Yang, J., Ren, L., et al. (2022). Air pollution control benefits in reducing inter-provincial trade-associated environmental inequality on PM2.5-related premature deaths in China. J. Clean. Prod. 350, 131435. doi:10.1016/j.jclepro.2022.131435
Gao, S., and Wang, H. (2022). Analysis of industrial carbon transfer in beijing-tianjin-hebei city cluster and surrounding areas. Front. Env. Sci. 10, 1–9.
Guan, Y., Shan, Y., Huang, Q., Chen, H., Wang, D., and Hubacek, K. (2021). Assessment to China's recent emission pattern shifts. Earth's. Future 9 (11), e2021EF002241. doi:10.1029/2021ef002241
Jiang, H. D., Liu, L. J., and Deng, H. M. (2022). Co-benefit comparison of carbon tax, sulfur tax and nitrogen tax: The case of China. Sustain. Prod. Consum. 29, 239–248. doi:10.1016/j.spc.2021.10.017
Jiang, P., Khishgee, S., Alimujiang, A., and Dong, H. (2020). Cost-effective approaches for reducing carbon and air pollution emissions in the power industry in China. J. Environ. Manage. 264, 110452. doi:10.1016/j.jenvman.2020.110452
Jiao, J. D., Huang, Y., and Liao, C. P. (2020). Co-Benefits of reducing CO2 and air pollutant emissions in the urban transport sector: A case of guangzhou. Energy sustain. Dev. 59, 131–143. doi:10.1016/j.esd.2020.10.005
Jin, G., Shi, X., Zhang, L., and Hu, S. G. (2020). Measuring the SCCs of different Chinese regions under future scenarios. Renew. Sustain. Energy Rev. 130, 109949. doi:10.1016/j.rser.2020.109949
Klimont, Z., Kupiainen, K., Heyes, C., Purohit, P., Cofala, J., Rafaj, P., et al. (2017). Global anthropogenic emissions of particulate matter including black carbon. Atmos. Chem. Phys. 17 (14), 8681–8723. doi:10.5194/acp-17-8681-2017
Li, G., Li, Y., Tian, L., Guo, Q., and Pan, X. (2018). Future temperature-related years of life lost projections for cardiovascular disease in Tianjin, China. Sci. Total Environ. 630, 943–950. doi:10.1016/j.scitotenv.2018.02.261
Liang, X., Zhang, S., Wu, Y., Xing, J., He, X., Zhang, K. M., et al. (2019). Air quality and health benefits from fleet electrification in China. Nat. Sustain. 2 (10), 962–971. doi:10.1038/s41893-019-0398-8
Liu, G., Yang, Z., Chen, B., Zhang, Y., Su, M., and Ulgiati, S. (2016). Prevention and control policy analysis for energy-related regional pollution management in China. Appl. energy 166, 292–300. doi:10.1016/j.apenergy.2015.06.032
Mallapaty, S. (2020). How China could be carbon neutral by mid-century. Nature 586 (7830), 482–483. doi:10.1038/d41586-020-02927-9
Mao, X., Zeng, A., Hu, T., Zhou, J., Xing, Y., and Liu, S. (2013). Co-Control of local air pollutants and CO2 in the Chinese iron and steel industry. Environ. Sci. Technol. 47 (21), 12002–12010. doi:10.1021/es4021316
Mir, K. A., Purohit, P., Cail, S., and Kim, S. (2022). Co-benefits of air pollution control and climate change mitigation strategies in Pakistan. Environ. Sci. Policy 133, 31–43. doi:10.1016/j.envsci.2022.03.008
NBSC (2022). National Bureau of statistics of China. China statistical yearbook. Beijing: China Statistics Press.
Peng, W., Dai, H., Guo, H., Purohit, P., Urpelainen, J., Wagner, F., et al. (2020). The critical role of policy enforcement in achieving health, air quality, and climate benefits from India’s clean electricity transition. Environ. Sci. Technol. 54, 11720–11731. doi:10.1021/acs.est.0c01622
Portugal-Pereira, J., Koberle, A., Lucena, A. F. P., Rochedo, P. R. R., Imperio, M., Carsalade, A. M., et al. (2018). Interactions between global climate change strategies and local air pollution: Lessons learnt from the expansion of the power sector in Brazil. Clim. Change 148 (1-2), 293–309. doi:10.1007/s10584-018-2193-3
Qian, H. Q., Xu, S. D., Cao, J., Ren, F. Z., Wei, W. D., Meng, J., et al. (2021). Air pollution reduction and climate co-benefits in China's industries. Nat. Sustain. 4 (5), 417–425. doi:10.1038/s41893-020-00669-0
Radu, O. B., van den Berg, M., Klimont, Z., Deetman, S., Janssens-Maenhout, G., Muntean, M., et al. (2016). Exploring synergies between climate and air quality policies using long-term global and regional emission scenarios. Atmos. Environ. X. 140, 577–591. doi:10.1016/j.atmosenv.2016.05.021
Rafaj, P., Kiesewetter, G., Krey, V., Schoepp, W., Bertram, C., Drouet, L., et al. (2021). Air quality and health implications of 1.5 °C–2 °C climate pathways under considerations of ageing population: A multi-model scenario analysis. Environ. Res. Lett. 16 (5), 045005. doi:10.1088/1748-9326/abdf0b
Shu, Y., Hu, J., Zhang, S., Schöpp, W., Tang, W., Du, J., et al. (2022). Analysis of the air pollution reduction and climate change mitigation effects of the Three-Year Action Plan for Blue Skies on the "2+26" Cities in China. J. Environ. Manage. 317, 115455. doi:10.1016/j.jenvman.2022.115455
Tang, R., Zhao, J., Liu, Y. F., Huang, X., Zhang, Y. X., Zhou, D. R., et al. (2022). Air quality and health co-benefits of China's carbon dioxide emissions peaking before 2030. Nat. Commun. 13 (1), 1008. doi:10.1038/s41467-022-28672-3
UNFCC (2015). Paris agreement: Decision 1/CP.17 – UNFCCC document FCCC/CP/2015/L.9/Rev.1. Avialable at: http://unfccc.int/resource/docs/2015/cop21/eng/l09r01.pdf UNFCCC.
Wagner, F., Amann, M., Borken-Kleefeld, J., Cofala, J., Hoglund-Isaksson, L., Purohit, P., et al. (2012). Sectoral marginal abatement cost curves: Implications for mitigation pledges and air pollution co-benefits for annex I countries. Sustain. Sci. 7 (2), 169–184. doi:10.1007/s11625-012-0167-3
Wang, J., Feng, J. M., Yan, Z. W., and Chen, Y. (2020). Future risks of unprecedented compound heat waves over three vast urban agglomerations in China. Earth's. Future 8 (12), 1–17. doi:10.1029/2020ef001716
WHO 2021. Air pollution. Available at: https://www.who.int/health-topics/airpollution#tab=tab_1
Xian, Y. J., Yu, D., Wang, K., Yu, J., and Huang, Z. M. (2022). Capturing the least costly measure of CO2 emission abatement: Evidence from the iron and steel industry in China. Energy Econ. 106, 105812. doi:10.1016/j.eneco.2022.105812
Xie, Y., Dai, H. C., and Dong, H. J. (2018). Impacts of SO2 taxations and renewable energy development on CO2, NOx and SO2 emissions in Jing-Jin-Ji region. J. Clean. Prod. 171, 1386–1395. doi:10.1016/j.jclepro.2017.10.057
Xing, J., Lu, X., Wang, S. X., Wang, T., Ding, D., Yu, S., et al. (2020). The quest for improved air quality may push China to continue its CO2 reduction beyond the Paris Commitment. Proc. Natl. Acad. Sci. U. S. A. 117 (47), 29535–29542. doi:10.1073/pnas.2013297117
Xu, M., Qin, Z. F., and Zhang, S. H. (2021). Carbon dioxide mitigation co-effect analysis of clean air policies: Lessons and perspectives in China's beijing-tianjin-hebei region. Environ. Res. Lett. 16 (1), 015006. doi:10.1088/1748-9326/abd215
Yang, X., Lin, W. Q., Gong, R. X., Zhu, M. Z., and Springer, C. (2021a). Transport decarbonization in big cities: An integrated environmental co-benefit analysis of vehicles purchases quota-limit and new energy vehicles promotion policy in Beijing. Sustain. Cities Soc. 71, 102976. doi:10.1016/j.scs.2021.102976
Yang, X., Pang, J., Teng, F., Gong, R. X., and Springer, C. (2021b). The environmental co-benefit and economic impact of China's low-carbon pathways: Evidence from linking bottom-up and top-down models. Renew. Sustain. Energy Rev. 136, 110438. doi:10.1016/j.rser.2020.110438
Yu, Q. U., Junling, A. N., Jian, L. I., Chen, Y., Ying, L. I., Liu, X., et al. (2014). Effects of NOx and VOCs from five emission sources on summer surface O3 over the beijing-tianjin-hebei region. Adv. Atmos. Sci. 31 (4), 787–800. doi:10.1007/s00376-013-3132-x
Zhang, W., Wang, F., Hubacek, K., Liu, Y., Wang, J. N., Feng, K. S., et al. (2018). Unequal Exchange of air pollution and economic benefits embodied in China's exports. Environ. Sci. Technol. 52 (7), 3888–3898. doi:10.1021/acs.est.7b05651
Zheng, J. J., Jiang, P., Qiao, W., Zhu, Y., and Kennedy, E. (2016). Analysis of air pollution reduction and climate change mitigation in the industry sector of Yangtze River Delta in China. J. Clean. Prod. 114, 314–322. doi:10.1016/j.jclepro.2015.07.011
Keywords: Beijing-Tianjin-Hebei, decarbonization, air quality, human health, integrated model, co-benefits
Citation: Wu K, Liu X, Dai H, Zhang S, Zhou Z, Ma T, Guo C, He X and Fang YR (2022) Mutual effects of CO2 emission reduction and air pollution control policies in beijing-tianjin-hebei region. Front. Environ. Sci. 10:1006142. doi: 10.3389/fenvs.2022.1006142
Received: 29 July 2022; Accepted: 02 September 2022;
Published: 15 September 2022.
Edited by:
Shaohui Zhang, Beihang University, ChinaCopyright © 2022 Wu, Liu, Dai, Zhang, Zhou, Ma, Guo, He and Fang. This is an open-access article distributed under the terms of the Creative Commons Attribution License (CC BY). The use, distribution or reproduction in other forums is permitted, provided the original author(s) and the copyright owner(s) are credited and that the original publication in this journal is cited, in accordance with accepted academic practice. No use, distribution or reproduction is permitted which does not comply with these terms.
*Correspondence: Xiaojia He, aGV4akBhY2NhMjEub3JnLmNu; Yan Ru Fang, ZnlyMDAwQDEyNi5jb20=
 Kai Wu1
 Yan Ru Fang
