 Jiaogen Zhou
 Ying Li
 Qiuliang Lei
 Qingyu Feng5
 Jiafa Luo
- 1Jiangsu Provincial Engineering Research Center for Intelligent Monitoring and Ecological Management of Pond and Reservoir Water Environment, Huaiyin Normal University, Huaian, China
- 2State Key Laboratory of Resources and Environmental Information System, Institute of Geographic Sciences and Natural Resources Research, Chinese Academy of Sciences, Beijing, China
- 3University of Chinese Academy of Sciences, Beijing, China
- 4Key Laboratory of Nonpoint Source Pollution Control, Ministry of Agriculture and Rural Affairs, Institute of Agricultural Resources and Regional Planning, Chinese Academy of Agricultural Sciences, Beijing, China
- 5State Key Laboratory of Urban and Regional Ecology, Research Center for Eco-Environmental Sciences, Chinese Academy of Sciences, Beijing, China
- 6AgResearch Limited, Ruakura Research Centre, Hamilton, New Zealand
The asynchrony of urban expansion and urban water environmental protection is a common problem in the process of urbanization. Although urban expansion results in population agglomeration and dramatic changes of land use, it also brings municipal water infrastructures to enhance the water quality of urban water bodies. In order to understand the relationship between water quality and urban expansion and water environmental management, total nitrogen (TN) and total phosphorus (TP) concentrations were measured, which were taken from 68 small urban water bodies in three distance bands (<5 km, 5–10 km and >10 km away from the city center of Changsha City, China) and four main water management types of protection, recovery, degradation and fisheries. The results showed that: 1) with increase in distance away from the city center, TN and TP concentrations in small water bodies and the percentage of polluted samples (IV ∼ inferior V) showed an increasing trend. 2) The degree of protection of small urban water bodies in the study area has not been synchronistic with urban expansion. The protected water bodies (long-term protected and recovering) are mainly distributed in the <5 km distance band, and anthropogenic disturbances (degraded water bodies and small water bodies used for fish farming) were mainly distributed in the 5–10 km and >10 km distance bands. Also, degraded and fish-managed water bodies had higher TN and TP contents than protected and recovering water bodies, but their TN:TP ratios were significantly lower. 3) Overall, urban expansion and water body management contributed 55.8% of the variance of TN and TP concentrations and TN:TP ratios in the study area. Water body management alone contributed 22.2%, which was higher than the contribution of urban expansion (7.6%). This shows that the insufficient application of water environmental protection measures has significantly changed the spatial distribution patterns of N and P concentrations and TN:TP ratios in urban small water bodies as the Changsha urban area has expanded. In the process of urban expansion, the simultaneous development of urban water ecological management is essential to ensure the health protection of the urban water environment.
Introduction
Inland water bodies shape the spatial pattern of global terrestrial ecosystems. Quantitatively, small water bodies such as lakes, reservoirs, and ponds with an area of smaller than 1 km2 constitute the majority of the water contained in inland water bodies in the world (Downing et al., 2006). Small water bodies are vulnerable to human disturbance and environmental change, and are hot spots for global biogeochemical cycle processes (Downing, 2010). Small urban water bodies provide diversified ecological services and functions such as water conservation, sand control, water purification, fishing and leisure sightseeing, which are of great significance to the development of urban ecological environments and culture (Fu et al., 2018).
Urban expansion is characterized by expansion of the urban geospatial environment and an increase in urban population. While urban expansion promotes social and economic development, it also brings potential impacts to the urban ecological environment, including the atmosphere, water, and soil (Miller and Hutchins, 2017; Wang et al., 2019; Wang et al., 2021). Among these impacts, the shrinking and fragmenting of urban water bodies caused by urban expansion have aggravated the deterioration of urban water quality, making urban aquatic ecosystems one of the most threatened ecosystems in the process of urbanization (Wang et al., 2019; Yang et al., 2020). Studies have shown that increases in impervious areas during rapid urbanization resulted in rapid deterioration of surface water quality and elevated nitrogen (N) and phosphorus (P) concentrations (Paul and Meyer, 2001; Brabec et al., 2002; Song et al., 2020). In general, urban expansion brings negative impacts on urban water bodies such as water quality deterioration and algal blooms by affecting the connectivity of small urban water bodies and migration and accumulation of N and P pollutants (He et al., 2008; Wang et al., 2019; Yang et al., 2020). However, although urban expansion exacerbates agglomeration of population and dramatic changes in land use, it also brings about municipal water conservancy infrastructure that can have positive benefits to urban aquatic ecosystems. The positive benefits brought by the improvement of urban water conservancy supporting municipal facilities (especially sewage treatment facilities) are evident. For example, with the progress of urbanization from 2008 to 2017, the P concentration in urban lakes in China decreased, the N concentration was stable, and the TN:TP ratio showed an increasing trend (Tong et al., 2018, 2020). Therefore, the concept of simply characterizing urban expansion as having negative effects on urban water bodies is erroneous to some extent. The impact of urban expansion on the water quality of urban aquatic ecosystems should be systematically evaluated in combination with urban water environmental managements.
Studies have shown that TN:TP ratio has an important influence on the structure and function of aquatic ecosystem (Sterner, 2011), and TN:TP ratio is also used to identify the types of N or P limitation in water nutrient status (Downing, 2010; Schindler et al., 2008). When TN:TP < 20, the supply of N is the limiting factor for growth of aquatic organisms. When 20 ≤ TN:TP < 50, N and P are jointly limiting, and when TN:TP > 50, P is the limiting nutrient (Guildford and Hecky, 2000; Qin et al., 2020). The study of the changing characteristics of TN:TP ratio in water bodies can help to understand the occurrence pattern of nitrogen and phosphorus pollution in water bodies.
In the 1950s and 1970s, to ensure adequate water for agricultural irrigation, China carried out large-scale excavation and construction of small ponds and reservoirs; this resulted in artificially constructed small water bodies across the country, especially in southern China (Chen et al., 2019). In recent decades, the number and area of small water bodies in China have changed significantly due to climate change, flood damage, sludge blockage, anthropogenic landfills and other destructive activities, especially in urban small aquatic ecosystems (Yang and Lu, 2014; Chen et al., 2019). By comparing remote sensing data for China in 2005–2006 with data from the 1960s–1980s, it was found that 243 small water bodies had disappeared (Ma R. et al., 2010; Ma R. H. et al., 2010), and by 2015 there were 333 several small lakes that had disappeared, mainly in eastern China (Zhang et al., 2019).
As one of the important megacities in southern China, Changsha city is rich in water resources and has a large number of small water bodies. In the past 30 years, Changsha’s urban expansion has been rapid, and the urban land use has changed dramatically. The water quality of the urban aquatic ecosystem has been significantly affected. To protect the urban ecological environment, the municipal government of Changsha launched the “Urban Surface Water Protection Plan of Changsha city (Blue Line) (2006–2020)” in 2007 and began to implement the “Opinions on The Implementation of the River Chief System” promulgated by the government in 2016. However, like other rapidly urbanizing cities in China, the promulgation and implementation of water environmental protection policies in Changsha have not kept pace with urban expansion. Affected by factors such as economic conditions and social influence, the water environmental protection resources in Changsha are concentrated in the city center, while the water environmental protection resources allocated in the suburban areas are inadequate. This paper takes Changsha City as an example to study the impact of the uncoordinated urban expansion and urban water environmental protection measures on the changes of N and P concentrations in small water bodies within the urban area. The main objectives of this paper include: 1) describing the status of N and P concentrations in small water bodies in Changsha; 2) identifying the differences in N and P concentrations and TN:TP ratios in small water bodies under different urban distance bands and water management types; 3) determining the contribution of urban expansion and urban water environmental management types to changes in N and P concentrations in urban small water bodies.
Materials and methods
Study area
Changsha (111°53′-114°15′ E, 27°51′-28°40′ N) is the capital of Hunan Province in southern China and is one of the megacities in China. Changsha City with low terrain, a dense water network, and numerous small water bodies (such as small lakes, reservoirs, and ponds) is located in the lower reaches of the Xiangjiang River (Figure 1A). Changsha has a humid subtropical monsoon climate, which is both warm and wet, and four distinct seasons. The annual average temperature is 16.8–17.2°C, with the maximum temperature ranging from 39 to 40°C, and the minimum temperature ranging from −1-2°C. The average annual rainfall is 1,300 mm, and the rainy season starts in April and ends in June. Rainfall in the rainy season accounts for 51% of total annual precipitation. Data from the Statistical Yearbook of Changsha showed that in the past 16 years (2002–2018), Changsha’s urbanization has developed rapidly, with an average annual growth rate of the urban population of 4.76%, and an average annual growth rate of 69.91% for the secondary and tertiary industries. The urbanization rate (urban population over total population) of Changsha had risen from 61.25% in 2002 to 79.12% in 2018. In the process of urbanization, the demand for land for construction in Changsha greatly increased, including the occupation of large numbers of small urban water bodies due to their cheap land rent. At present the landscape pattern and ecological environment of small water bodies in Changsha City have been significantly impacted.

FIGURE 1. (A) The location of the study area, the spatial distribution of sampling sites for small water bodies and (B) the case diagram of the main management types for the small water bodies.
Land-use data processing
The 960 km2 study area is located within the inner circle of the Changsha urban ring-city expressway. Its land use changed drastically from 2002 to 2018. Two datasets for land use in 2002 and 2018 were extracted from remote sensing images with high spatial resolution (2 m). The extraction process was conducted using visual interpretation and the land was categorized into 4 types, including water bodies (rivers, small water bodies), construction land, agricultural land and forest. Taking the city center as a reference point (Central Square, 112.98°E, 28.20°N, Figure 1), the study area was divided into three distance bands, with distances of <5 km, 5–10 km and >10 km, which included all the remaining area out to the ring-city expressway. From 2002 to 2018, the severity of the land-use change increased with distance away from the city center. The land-use pattern within the <5 km distance band remained stable during the period from 2002 to 2018, while land use within the 5–10 km distance band changed moderately. Within the 5–10 km distance band, construction land increased 14%, but the area covered by water, farmland and forest decreased 3%, 10% and 1%, respectively. Outside the 10 km distance band, land use changed most severely, with construction land increasing by 17%, and the water body area, farmland and forest decreasing by 2%, 12% and 3%, respectively (Figures 2A,B). The land-use change trends within the three distance bands in the study area generally reflected the spatiotemporal pattern of urban expansion in Changsha over the past 16 years.
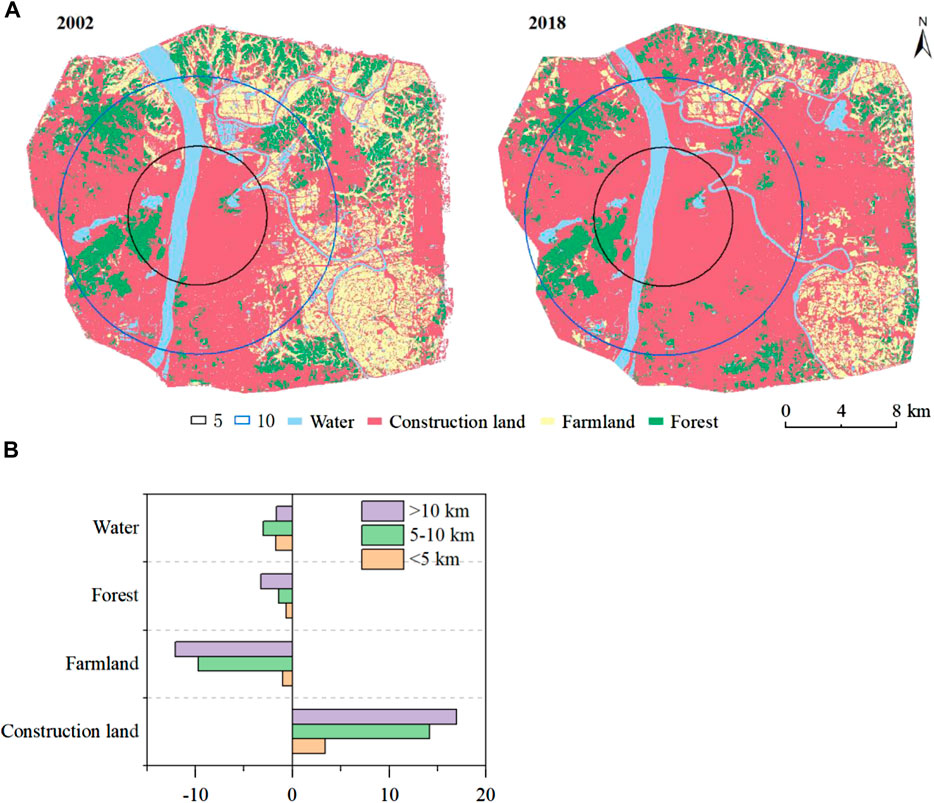
FIGURE 2. (A) Land-use in Changsha between 2002 and 2018 and (B) land-use change in different distance bands between 2002 and 2018 (%).
Water quality sampling
In the process of urban expansion, there has been no publicly historical and available data for water quality monitoring of small water bodies in the study area in the past. Thus, a survey of small water bodies within the study area was conducted to understand their current status and provide information for determination of representative sampling sites. In this study, 68 small water bodies were randomly selected as monitoring sample points from small water bodies that had been present for >15 years (Figure 1). Nine of these small water body monitoring sites were located in the <5 km distance band, 19 were located in the 5–10 km distance band, and 40 were located in the >10 km distance band.
Additionally, results of a preliminary survey of small water bodies within the study area showed that the small water body management types mainly included four types: 1) protected small water bodies (protection), 2) restored small water bodies (recovery), 3) degraded small water bodies (degradation) and 4) fish farming water bodies (fishery) (Figure 1B). 1) The protected small water bodies were mainly located in the city area, mostly landscape water bodies in parks and surrounding high-end communities. There were perfect sewage interception measures and wetland absorption zones around such water bodies. They had been operating stably for many years and were not affected by the input of pollutants from surrounding surface sources. 2) The restored small water bodies were mainly located around the newly built high-end communities, or were the small water bodies established for ecological management after 2016. These small water bodies had been built with relevant environmental protection measures, but their operation time had been relatively short. 3) Degraded small water bodies were mainly located around residential areas under construction or in the corners of cities. Because surrounding rain and sewage interception measures were not in place, such water bodies were subject to increasing pollution, and ecological functions were seriously degraded. 4) Fish farming water bodies were located in suburbs far away from the city center, and were used for freshwater fish farming. Due to the long-term feeding of fish, there was serious eutrophication of these water bodies. According to the statistics for water body management types, there were 24 monitoring points for long-term protected water bodies, 10 monitoring points for restored water bodies, 7 monitoring points for degraded water bodies, and 27 monitoring points for fish farming water bodies.
Water samples from small water body sampling sites in the study area were collected in August 2018. Water samples at a depth of 30 cm from the water surface at 5 different locations were collected with plastic bottles and mixed. Total nitrogen (TN) and total phosphorus (TP) concentrations in the water samples were analyzed within 3 days after sampling. TN was determined by alkaline potassium persulfate digestion-UV spectrophotometry, and TP was determined by potassium sulfate digestion-ammonium molybdate spectrophotometry. The contents of N and P components were determined with continuous flow analysis instrumentation (AA3, Germany).
Statistical analysis
The digital mapping of the spatial distribution of all target objects was done by ArcGIS 10.2. Variance analysis and correlation analysis was performed by using IBM SPSS Statistics 25. Canonical correlation analysis (CCA) method was used to quantify contributions of two variable groups of urban expansion and water management to the variance of TN and TP concentrations and TN:TP ratios in the study area. The variable group of urban expansion has a dataset of three distance bands (<5 km, 5–10 km, and >10 km), and water management variable group consists four water management types (protection, recovery, degradation and fishery).
Results
Concentrations and classification of TN and TP in small water bodies
The TN and TP concentrations of the water samples from the 68 small water body sampling sites in the study area varied widely. The average TN concentration of the small water body monitoring sample points was 1.17 mg/L, the range of TN concentrations was 0.02–10.71 mg/L, and the coefficient of variation (CV) was 134%; the average TP concentrations at the monitoring points of the small water bodies was 0.18 mg/L, the range of TP concentrations was 0.01–0.96 mg/L, and the CV was 115.22% (Table 1). Referring to the environmental quality standards for surface water in China (GB3838-2002), the surface water environment is divided into six grades of I, II, III, IV, V and inferior V, which represent very good, good, slightly polluted, polluted, seriously polluted and loss function, respectively. The TN and TP pollution status for the small water bodies in Changsha city were evaluated according to the above criteria. The results are shown in Figures 3A,B.
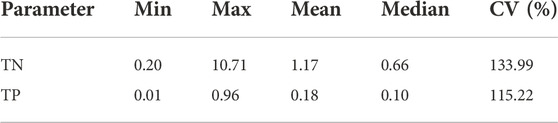
TABLE 1. Water quality analysis results of the water bodies of Changsha (mg/L).
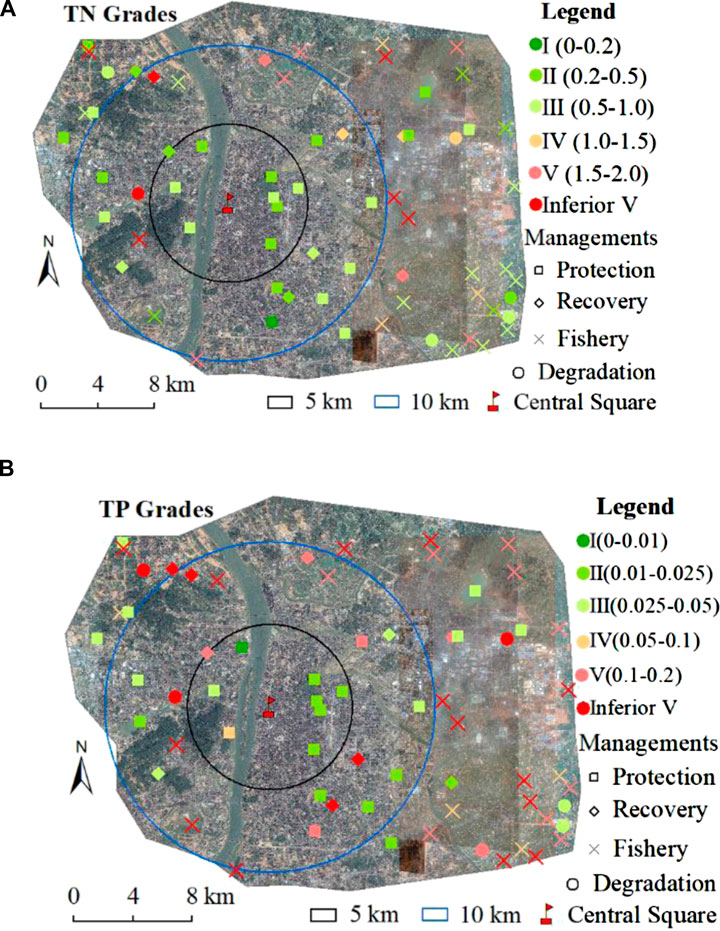
FIGURE 3. Classification levels of (A) TN and (B) TP in each sampled small water body.
The percentages of sampling sites with TN classifications of I (0–0.2 mg/L), II (0.2–0.5 mg/L), III (0.5–1.0 mg/L), IV (1.0–1.5 mg/L), V (1.5–2.0 mg/L) and inferior V (>2.0 mg/L) in the study area were 1%, 29%, 38%, 10%, 10% and 10%, respectively. Among them, 30% of the TN concentrations in the monitoring samples were classified as IV ∼ inferior V. The sampling sites with TN water pollution were mainly distributed in the >10 km distance band, accounting for 71% of the total polluted sampling sites. The percentages of sampling sites with TP classifications of I (0–0.01 mg/L), II (0.01–0.025 mg/L), III (0.025–0.05 mg/L), IV (0.05–0.1 mg/L), V (0.1–0.2 mg/L) and inferior V (>2.0 mg/L) in the study area were 1%, 18%, 21%, 7%, 22% and 31%, respectively. Among them, 60% of the samples belonged to classification IV ∼ inferior V. Moreover, 68% of the TP polluted samples were distributed in the distance band of >10 km. This indicates that urban expansion has exacerbated N and P pollution in small water bodies far from urban centers.
Comparison of TN and TP concentrations and classification in small water bodies in different distance bands
The concentrations of TN and TP in the small water bodies in the different urban distance bands in the study area were significantly different. The distribution of TN concentrations within the 5–10 km distance band had the highest variation, ranging from 0.20 to 10.71 mg/L, with an average value of 1.72 mg/L, which was higher than the average values for the <5 km and >10 km distance bands. The range of TN concentrations in the >10 km band was 0.21–4.33 mg/L, with an average value of 1.08 mg/L and a median value of 0.77 mg/L, which was higher than the median values for the 5–10 km (0.74 mg/L) and <5 km distance bands (0.40 mg/L). The distribution of TN concentration in the <5 km distance band had a comparatively lower variation, with a range of 0.25–0.75 mg/L and an average of 0.44 mg/L, which was significantly lower than the average values in the 5–10 km and >10 km distance bands (Figure 4). As for the TP concentrations, the distribution in the >10 km distance band had the highest variation, with a range of 0.01–0.96 mg/L, and an average of 0.22 mg/L. The TP concentrations in the water samples taken within the 5–10 km distance band ranged from 0.02 to 0.58 mg/L, with an average value of 0.19 mg/L. The range of TP concentrations within the <5 km distance band was 0–0.12 mg/L, with an average of 0.03 mg/L, which was significantly lower than the average values for the 5–10 km and >10 km distance bands (Figure 4).
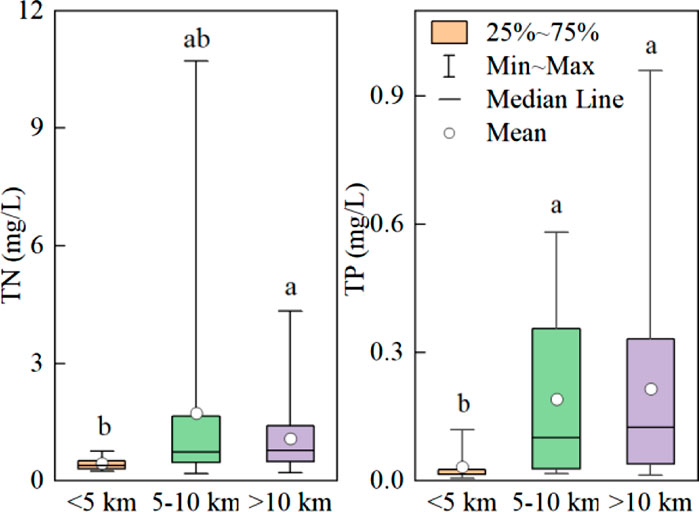
FIGURE 4. N and P concentrations in small water bodies in different distance bands in Changsha.
As far as the TN concentration classifications of water samples in the different distance bands in the study area was concerned, there were only two categories of TN concentration in the <5 km distance band, namely II and III, and the proportions of these two water quality levels were 56% and 44%, respectively. In the 5–10 km distance band and the >10 km distance band, the TN concentrations of the samples were mainly in the I ∼ III classifications. The proportions of the samples classified as I ∼ III were 68% and 63% for the 5–10 km and the >10 km distance bands, respectively; and the proportion of the sample sites with TN concentration levels inferior to III (IV, V and inferior V) were 32% and 37% for the 5–10 km and the >10 km distance bands, respectively (Figure 5). For the TP concentration classification, 56% of the samples in the <5 km distance band were in grade II, while the largest proportions of the samples in the 5–10 km and >10 km distance bands were in the inferior V classification, 37% and 35%, respectively. In general, the proportion of samples with TP concentrations inferior to III in the <5 km, 5–10 km and >10 km distance bands were 22%, 58% and 60%, respectively (Figure 5).
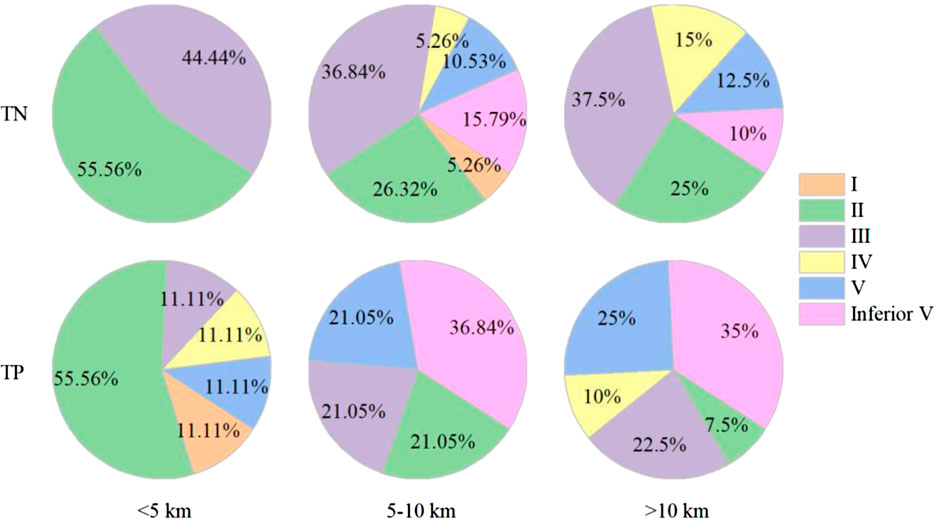
FIGURE 5. Grading comparison of TN and TP concentrations in three distance bands.
Impacts of management types on TN and TP in small water bodies
The TN and TP concentrations in the small water bodies varied under different management conditions in the study area (Figure 6). Among the four management types, including protection, recovery, degradation and fishery, the degradation small water bodies had the largest variation in TN concentrations; the CV was 164%, the range was 0.27–10.71 mg/L, and the average value was 2.28 mg/L, which was higher than the average TN concentrations in the protected, restored and fishery small water bodies. The variations in TN concentrations in the restoration and fishery small water bodies were in the middle, with CVs of 121.12% and 72.77%, respectively, and ranges of 0.10–6.65 mg/L and 0.29–4.33 mg/L, respectively. The mean values of TN concentration of the two were 1.54 mg/L and 1.38 mg/L, respectively, which were higher than the average TN concentrations in the protected small water bodies (0.46 mg/L). The variation in TN concentrations in the protected small water bodies was the smallest, ranging from 0.20 to 0.87 mg/L, and the mean value was significantly lower than that in the fishery small water bodies.
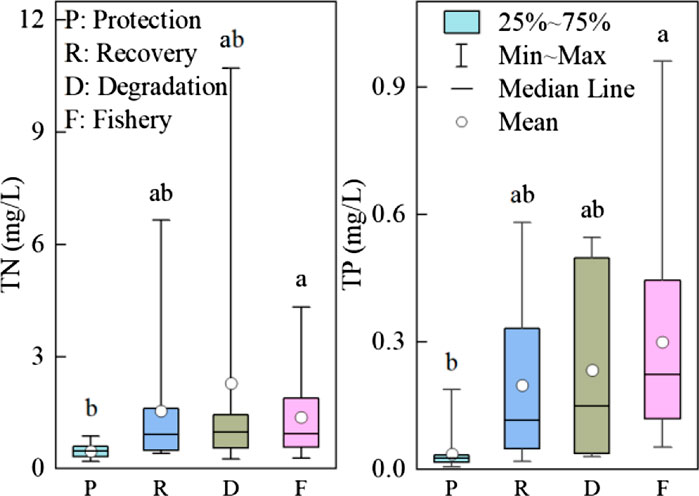
FIGURE 6. N and P concentrations in small water bodies under different management types.
The spatial distribution of TP concentrations in the small water bodies under the different management types was different from that of the TN. The TP concentrations were highest in the small water bodies with fishery management, with an average value of 0.3 mg/L, which was higher than the average values for the other three management types. The variation in TP concentrations in the fishery small water bodies was the largest, with a CV and range of 79.50% and 0.05–0.96 mg/L, respectively. The variations in TP concentrations in the degraded and restored small water bodies were relatively moderate, the CVs were 96.28% and 92.85%, respectively and the ranges were 0.03–0.55 mg/L and 0.02–0.58 mg/L, respectively. The average TP concentration in the protected small water bodies was 0.04 mg/L, which was lower than the average TP concentrations in the degraded and restored small water bodies and significantly lower than that of the fishery (Figure 6). In general, the differences in TN and TP concentrations under different small water body management types indicated that human activities increased the accumulation of N and P pollutants in the study area, resulting in higher concentrations of TN and TP in restored, degraded and fishery small water bodies than in protected small water bodies. Moreover, the responses of TN and TP concentrations in small water bodies to different anthropogenic management types were different, and fishery management aggravated the accumulation of TP to a greater degree than other management types.
Differences in TN:TP ratios in small water bodies under different distance bands and management types
The average TN:TP ratio (mol/mol) of the 68 monitored small water bodies in the study area was 31.93, with a range of 1.42–188.90. The TN:TP ratios of the small water bodies were significantly different within each distance band and under different management types. The variability of the TN:TP ratios of the small water bodies in the different distance bands was large, with ranges in the <5 km, 5–10 km and >10 km distance bands of 7.42–100.04, 1.42–91.19 and 2.88–188.90, respectively. In addition, the average values of the TN:TP ratios in the different distance bands ranked as follows: <5 km distance band (53.85) >5–10 km distance band (33.39) >10 km distance band (26.30). So, TN:TP ratios decreased with increase of distance away from the city center (Figure 7).
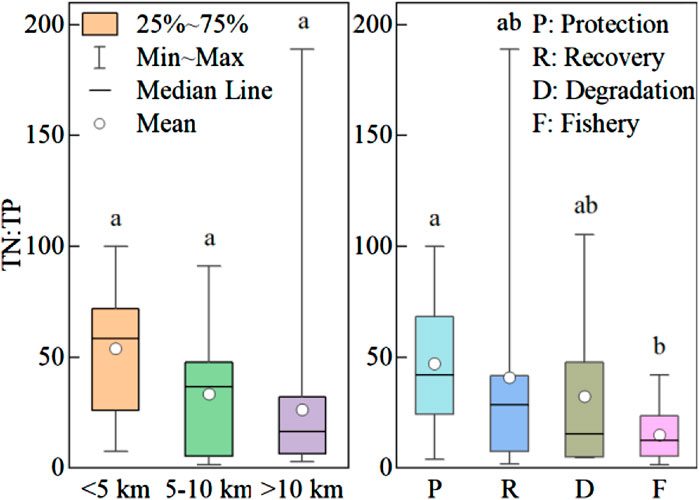
FIGURE 7. TN:TP ratios (mol/mol) in small water bodies under different distance bands and management types.
The TN:TP ratios of the restored small water bodies had the largest variability, ranging from 1.85 to 188.90. The TN:TP ratio of the small water bodies with fishery management had the smallest variability, ranging from 1.42 to 42.12. The variation in TN:TP ratios of the protected and degraded water bodies were relatively moderate, with ranges of 3.87–100.04 and 4.75–105.49, respectively. In addition, the average value of the TN:TP ratios in the small water bodies under different management types were ranked as follows: protection (47.19) > recovery (40.92) > degradation (32.31) > fishery (14.94), showing that the TN:TP ratios of small water bodies decreased with increase in human disturbance (Figure 7).
Accordingly, 45.59% of the small water bodies in the study area were N limited, 35.29% were N + P limited, and 19.12% were P limited (Table 2). In addition, there were large differences in the nutritional status of N and P in the small water bodies in different distance bands and management types. Small water bodies in the <5 km distance band were mainly limited by P, accounting for 56%. N limitation and N + P co-limitation were both 22%. Those in the 5–10 km distance band were mainly limited by N or N + P, accounting for 37% and 42%, respectively. However, the small water bodies in the >10 km zone were dominated by N limitation, accounting for 55% (Table 2 and Figure 8). Under different management types, the protected small water bodies were mainly limited by P or N + P, both accounting for 42%. The restored small water bodies were mainly limited by N or N + P, both accounting for 40%. The degraded small water bodies and fisheries were mainly limited by N, accounting for 57% and 70%, respectively (Table 2). It can be seen that the farther from the city center and the lower the degree of protection, the general trend of nutrient limitation in the small water bodies in the study area was: from P limitation to N + P combined limitation, and finally to N limitation.
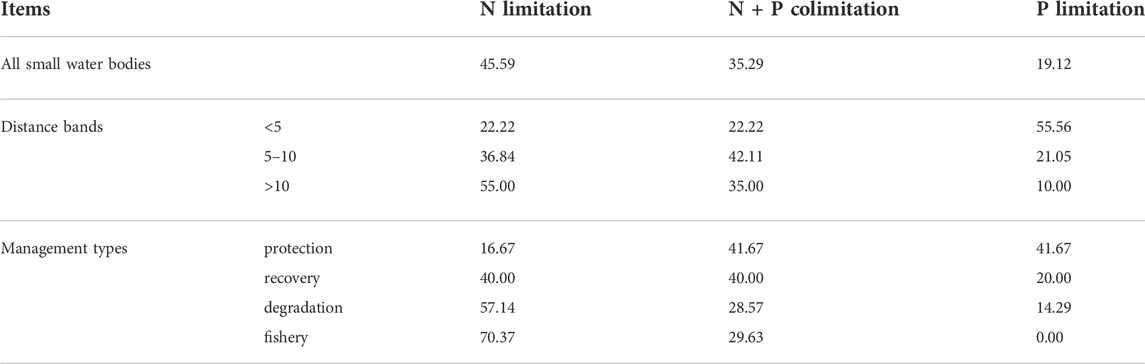
TABLE 2. Comparison of N and P nutrient limitation in small water bodies under different distance bands and management types.
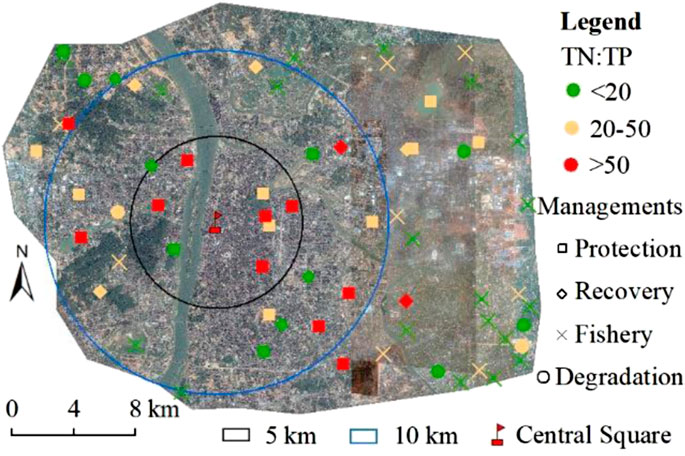
FIGURE 8. Distribution of TN:TP ratios (mol/mol) in each sampled small water body.
Quantitative effects of distance bands and water management on TN and TP concentrations and TN:TP ratios in the small water bodies
Canonical correlation analysis methods (CCA) was used to quantify the effects of distance bands and water management types on the status of TN and TP concentrations and TN:TP ratios in the small water bodies in the study area. The results showed that the distance bands and water management types played an important role in the variance of TN and TP concentrations and TN:TP ratios. Together, these two factors accounted for 55.6% of the variance in TN and TP concentrations (Figure 9). In addition, the variance interpretation of management types for the changes of TN and TP concentrations and TN:TP ratios in the small water bodies in the study area was 22.2%, which was 3 times that of the distance bands (7.6%). The combined interpretability of distance bands and water environmental management types on the changes in TN and TP concentrations and TN:TP ratios in the small water bodies was 25.80%, which was greater than each independent effect.
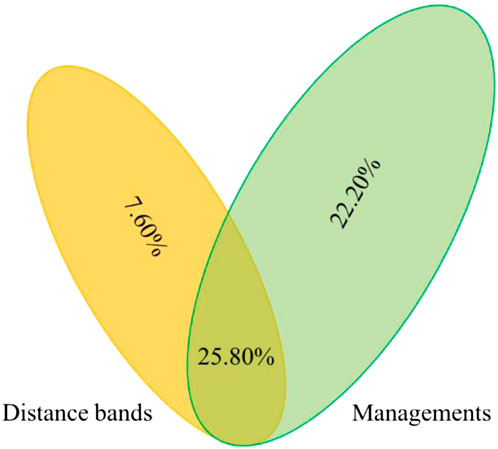
FIGURE 9. Contributions of urban expansion and management types to the variance interpretation of TN and TP concentrations and TN:TP ratios (mol/mol) in small water bodies in the study area.
Discussion
TN and TP concentration status and TN:TP ratios in urban small water bodies
N and P are two main nutrients that affect the primary productivity of freshwater ecosystems. Eutrophication caused by enrichment of N and P is a common water environment problem in the world today (Galloway et al., 2008; Canfield et al., 2010). The average concentrations of TN and TP in 573 lakes around the world were 0.837 mg/L and 0.043 mg/L, respectively; the average concentrations of TN and TP in lake waters in China were 1.71 mg/L and 0.107 mg/L, respectively, and the P pollution in the water is greater than N pollution (Qin et al., 2020). The mean values of TN and TP concentrations in the small water bodies in the study area were 1.17 mg/L and 0.18 mg/L, respectively, which were higher than the global average N and P concentrations. In the monitoring samples, the percentage of IV ∼ inferior V was 30% for TN and 60% for TP. Most of the polluted sampling sites were mainly distributed in the >10 km distance band. Therefore, the eutrophication risk of small water bodies in Changsha is high, especially in the >10 km distance band. The contents of TN and TP in lake water bodies in China and Changsha City are higher than the average global level, which largely reflects the general driving mechanism of water quality deterioration in inland water bodies in China, which is that China has been one of the fastest growing economies in the world, over the past 20–30 years and this economic growth has come with a cost of environmental pollution. In China, 27.3% of 209 sampled lakes were eutrophic (MEE, 2022).
The mean TN:TP ratio of the small water bodies in the study area was 31.93, significantly lower than the global lake data set (573 lakes) (70.45) (Qin et al., 2020), which indicated that the accumulation of N and P in the small water bodies in the study area was unbalanced. The imbalance of N and P accumulation may be related to the differential environmental behavior of N and P in water bodies. N is easily removed from water bodies through two pathways, denitrification and anammox. The N removal efficiency of the pathways in water is affected by biogeochemical process factors such as water temperature, organic matter, dissolved oxygen, hydraulic retention time, and water depth (Shen et al., 2021), and the nitrogen removal process in small water bodies is more active than in larger water bodies (Robertson and Groffman, 2015). Compared to N, P is relatively inert and difficult to remove. After P enters the water body, it usually enters the sediment, and the transformation processes mainly consist of P deposition and release, increasing the difficulty of P removal from the water body (Filippelli, 2002; Paerl et al., 2016; Stein and Klotz, 2016). This effectively explains the research phenomenon in this paper: compared with the small water bodies in the urban center, the N and P concentrations in the water bodies far from the urban center were significantly higher, while the TN:TP ratio in the water bodies far from the urban center were significantly lower. Therefore, to alleviate the eutrophication of the small water bodies in the study area, in terms of N and P management, P input in the study area should be reduced.
The impact of urban expansion and water environmental management on the quality of N and P in urban water bodies
With rapid development of urban areas, avoiding the deterioration of the water environment and realizing the harmonious development of humans and nature is an urgent problem to be solved (Miller and Hutchins, 2017; Wang et al., 2021). Therefore, it is necessary to better understand the responses of water quality in small water bodies to human activities (Fu et al., 2018; Feng et al., 2019). In this study, the results showed that serious TN and TP pollution occurred during the urbanization development period (5–10 km and >10 km distance bands); however, when the urbanization reached the mature stage (<5 km distance band), both TN and TP pollution were effectively controlled. The small water bodies in the mature stage of urbanization (<5 km distance band) are all under protection and restoration, with low N and P concentrations; while severely polluted degraded wetlands and fish ponds are mainly distributed in the urbanization development stages at 5–10 km and >10 km distance bands. TN:TP ratio showed a decrease with distance from the urban center and with human disturbance. This indicates that the TN and TP concentrations are higher and TN:TP ratio are lower in the earlier stage of urban expansion due to the large N and P nutrient inputs and the lag of water management. That’s because of the difference in the removal efficiency of N and P in the process of urban wastewater treatment with a higher removal efficiency of P than N (Tong et al., 2020).
Our results show that urban expansion is generally beneficial to the water quality protection of small water bodies in the study area, but the incompatibility of urban expansion and water environmental protection leads to the deterioration of water quality in small water bodies farther from the urban center of the study area. This opinion is corroborated by results in existing literature. Research in China and other parts of the world confirm an inverted U-shaped relationship between economic growth and surface water quality during urban expansion, with water quality regulated by water use policies (Wang et al., 2008; Li et al., 2018). This leads to the fact that when urbanization and environmental protection measures are not coordinated, areas with a higher degree of urbanization have a wide range of water environmental measures with varying degrees of merit (Zhao et al., 2015), and there are spatial differences in the sensitivity of urban water quality to urbanization (Carstens and Amer, 2019). The results of a survey of urban water quality in Shanghai, China showed that the quality of surface water in urban centers and suburban areas with strong environmental supervision improved significantly, while the quality of surface water in rural areas in the outer suburbs with weak environmental supervision deteriorated (Wang et al., 2008; Li et al., 2018). Similarly, the findings of Wanek et al. (2021) confirmed that urbanization resulted in significantly better water quality in urban ponds in the United States than in rural ponds. However, areas that are more deficient in urban environmental management during the process of urbanization will show results contrary to the above conclusions. In Bangalore of India, the water quality of lakes in urbanized watersheds deteriorated more than in peri-urbanized watersheds (Birawat et al., 2021).
Implications for the governance of urban small water bodies
In developed countries that completed the urbanization process earlier, the top-down water environmental regulations have gradually shifted from rivers and lakes to artificial or natural shallow small water bodies (Leibowitz et al., 2018). In comparison, the scarcity of clean water in developing cities around the world is related to hasty urbanization, inadequate regulatory regimes or lack of infrastructure (Kumar, 2021). As the country with the fastest urbanization in the world, China lacks “legislative” support for small water bodies (Chen et al., 2019), and the lag in water environmental governance has led to the pollution of small water bodies in many cities (Yang et al., 2020). Studies have shown that overall surface water quality in China has been significantly improved or maintained at favorable levels due to reductions in industrial, rural and urban wastewater discharge (Ma et al., 2020), but lake water quality has not improved (Qin et al., 2022).
The results of this study showed that under the current urban construction model, the basic projects related to water quality protection in the study area seriously lag behind the expansion of urban land. This incompatibility between urban expansion and water environmental protection leads to an aggravated trend of N and P pollution in small water bodies far from the city center. This means that the pollution of small water bodies in Changsha faces the risk of pollution transfer, that is, the environmental protection results obtained by the large investment in the central urban area are at the cost of the pollution generated by the development of the new urban area. In addition, the areas with weak protection measures for small water bodies in the study area are often located in the outer suburbs. These areas are important food resource supply areas in cities. Human activities such as agricultural production, aquaculture and domestic sewage discharge will aggravate the deterioration of water quality in those small water bodies. Therefore, it is necessary to strengthen the management of the suburban water environment, especially the management of farmland drainage, domestic sewage and aquaculture tail water to reduce N and P pollution in small water bodies (Sonneveld et al., 2019). In general, in the process of urbanization, the synergy between urban expansion and water body ecological protection should be prioritized; when funds and resources are limited, attention should be paid to water environmental protection in suburban areas to ensure water quality security in the city.
Conclusion
The TN and TP contents and TN:TP ratios of small water bodies in Changsha area have high spatial variation, with the ranges of 0.2–10.71 mg/L, 0.01–0.96 mg/L and 1.85–188.91, respectively. In the study area, resource allocation of water environmental protection resources is more concentrated in urban centers and less to areas far from urban centers, resulting in serious TN and TP pollution of water bodies in areas far from urban areas. This reminds us that the government should ensure that simultaneous development of urban water ecological protection work is undertaken in the process of urban expansion, especially ensuring that sufficient resources are allocated to water environmental protection in suburban areas.
Data availability statement
The original contributions presented in the study are included in the article/supplementary material, further inquiries can be directed to the corresponding authors.
Author contributions
JZ and QL contributed to conception, and JZ performed design and experiments of the study. YL performed the statistical analysis and wrote the original draft. JZ, YL, QL, QF, JL, and SL revised the manuscript. All authors have read and agreed to the published version of the manuscript.
Funding
This research was supported by the National Natural Science Foundation of China (Grant No: 41877009 and U20A20114) and the Natural Science Foundation of Huai’an (Grants No: HABL202105).
Conflict of interest
Authors JL and SL were employed by the company AgResearch Limited.
The remaining authors declare that the research was conducted in the absence of any commercial or financial relationships that could be construed as a potential conflict of interest.
Publisher’s note
All claims expressed in this article are solely those of the authors and do not necessarily represent those of their affiliated organizations, or those of the publisher, the editors and the reviewers. Any product that may be evaluated in this article, or claim that may be made by its manufacturer, is not guaranteed or endorsed by the publisher.
References
Birawat, K. K., T, H., Nachiyar, M. C., N.A, M., and C.V, S. (2021). Impact of urbanisation on lakes—A study of Bengaluru lakes through water quality index (WQI) and overall index of pollution (OIP). Environ. Monit. Assess. 193, 408. doi:10.1007/s10661-021-09131-w
Brabec, E., Schulte, S., and Richards, P. L. (2002). Impervious surfaces and water quality: A review of current literature and its implications for watershed planning. J. Plan. Lit. 16, 499–514. doi:10.1177/088541202400903563
Canfield, D. E., Glazer, A. N., and Falkowski, P. G. (2010). The evolution and future of earth's nitrogen cycle. Science 330 (6001), 192–196. doi:10.1126/science.1186120
Carstens, D., and Amer, R. (2019). Spatio-temporal analysis of urban changes and surface water quality. J. Hydrol. X. 569, 720–734. doi:10.1016/j.jhydrol.2018.12.033
Chen, W. J., He, B., Nover, D., Lu, H. M., Liu, J., Sun, W., et al. (2019). Farm ponds in southern China: Challenges and solutions for conserving a neglected wetland ecosystem. Sci. Total Environ. 659, 1322–1334. doi:10.1016/j.scitotenv.2018.12.394
Downing, J. A. (2010). Emerging global role of small lakes and ponds: Little things mean a lot. Limnetica 29 (1), 9–24. doi:10.23818/limn.29.02
Downing, J. A., Prairie, Y. T., Cole, J. J., Duarte, C. M., Tranvik, L. J., Striegl, R. G., et al. (2006). The global abundance and size distribution of lakes, ponds, and impoundments. Limnol. Oceanogr. 51 (5), 2388–2397. doi:10.4319/lo.2006.51.5.2388
Feng, S. L., Liu, S. G., Huang, Z. H., Jing, L., Zhao, M. F., Peng, X., et al. (2019). Inland water bodies in China: Features discovered in the long-term satellite data. Proc. Natl. Acad. Sci. U. S. A. 116 (51), 25491–25496. doi:10.1073/pnas.1910872116
Filippelli, G. (2002). The global phosphorus cycle. Rev. Mineral. Geochem. 48 (1), 391–425. doi:10.2138/rmg.2002.48.10
Fu, B., Xu, P., Wang, Y. K., Yan, K., and Chaudhary, S. (2018). Assessment of the ecosystem services provided by ponds in hilly areas. Sci. Total Environ. 642, 979–987. doi:10.1016/j.scitotenv.2018.06.138
Galloway, J. N., Townsend, A. R., Erisman, J. W., Bekunda, M., Cai, Z., Freney, J. R., et al. (2008). Transformation of the nitrogen cycle: Recent trends, questions, and potential solutions. Science 320 (5878), 889–892. doi:10.1126/science.1136674
Guildford, S. J., and Hecky, R. E. (2000). Total nitrogen, total phosphorus, and nutrient limitation in lakes and oceans: Is there a common relationship? Limnol. Oceanogr. 45 (6), 1213–1223. doi:10.4319/lo.2000.45.6.1213
He, H. M., Zhou, J., Wu, Y., Zhang, W. C., and Xie, X. P. (2008). Modelling the response of surface water quality to the urbanization in Xi’an, China. J. Environ. Manage. 86 (4), 731–749. doi:10.1016/j.jenvman.2006.12.043
Kumar, P. (2021). Water quality assessments for urban water environment. Water 13 (12), 1686. doi:10.3390/w13121686
Leibowitz, S. G., Wigington, P. J., Schofield, K. A., Alexander, L. C., Vanderhoof, M. K., and Golden, H. E. (2018). Connectivity of streams and wetlands to downstream waters: An integrated systems framework. J. Am. Water Resour. Assoc. 54 (2), 298–322. doi:10.1111/1752-1688.12631
Li, H. X., Wang, C. Z., Huang, X., and Hug, A. (2018). Spatial assessment of water quality with urbanization in 2007–2015, Shanghai, China. Remote Sens. (Basel). 10 (7), 1024. doi:10.3390/rs10071024
Ma, R. H., Duan, H. T., Hu, C. M., Feng, X. Z., Li, A. N., Ju, W. M., et al. (2010b). A half-century of changes in China's lakes: Global warming or human influence? Geophys. Res. Lett. 37 (24), L24106. doi:10.1029/2010GL045514
Ma, R., Yang, G. S., Duan, H. T., Jiang, J. H., Wang, S. M., Feng, X. Z., et al. (2010a). China’s lakes at present: Number, area and spatial distribution. Sci. China Earth Sci. 54, 283–289. doi:10.1007/s11430-010-4052-6
Ma, T., Zhao, N., Ni, Y., Yi, J. W., Wilson, J. p., He, L. H., et al. (2020). China’s improving inland surface water quality since 2003. Sci. Adv. 6, eaau3798. doi:10.1126/sciadv.aau3798
Mee, (2022). China's ecology and environment bulletin 2021. Ministry of ecology and environment of the people’s Republic of China. Available at:.
Miller, J. D., and Hutchins, M. (2017). The impacts of urbanisation and climate change on urban flooding and urban water quality: A review of the evidence concerning the United Kingdom. J. Hydrology Regional Stud. 12, 345–362. doi:10.1016/j.ejrh.2017.06.006
Paerl, H., Scott, J., McCarthy, M., Newell, S., Gardner, W., Havens, K., et al. (2016). It takes two to tango: When and where dual nutrient (N & P) reductions are needed to protect lakes and downstream ecosystems. Environ. Sci. Technol. 50 (20), 10805–10813. doi:10.1021/acs.est.6b02575
Paul, M. J., and Meyer, J. L. (2001). Streams in the urban landscape. Annu. Rev. Ecol. Syst. 32 (1), 333–365. doi:10.1146/annurev.ecolsys.32.081501.114040
Qin, B. Q., Zhang, Y. L., Deng, J. M., Zhu, G. W., Liu, J. G., Hamilton, D. P., et al. (2022). Polluted lake restoration to promote sustainability in the Yangtze River Basin, China. Natl. Sci. Rev. 9 (1), nwab207. doi:10.1093/nsr/nwab207
Qin, B. Q., Zhou, J., Elser, J. J., Gardner, W. S., Deng, J. M., and Brookes, J. D. (2020). Water depth underpins the relative roles and fates of nitrogen and phosphorus in lakes. Environ. Sci. Technol. 54 (6), 3191–3198. doi:10.1021/acs.est.9b05858
Robertson, G. P., and Groffman, P. M. (2015). “Chapter 14 - nitrogen transformations,” in Soil microbiology, ecology and biochemistry. Editor E. A. Paul. Fourth Edition (Boston: Academic Press), 421–446.
Schindler, D. W., Hecky, R. E., Findlay, D. L., Stainton, M. P., Parker, B. R., Paterson, M. J., et al. (2008). Eutrophication of lakes cannot be controlled by reducing nitrogen input: Results of a 37-year whole-ecosystem experiment PNAS 105 (32), 11254–11258. doi:10.1073/pnas.080510810
Shen, W. Z., Li, S. S., Mi, M. H., Zhuang, Y. H., and Zhang, L. (2021). What makes ditches and ponds more efficient in nitrogen control? Agric. Ecosyst. Environ. 314, 107409. doi:10.1016/j.agee.2021.107409
Song, Y., Song, X. D., and Shao, G. F. (2020). Response of water quality to landscape patterns in an urbanized watershed in hangzhou, China. Sustainability 12 (14), 5500. doi:10.3390/su12145500
Sonneveld, B., Thoto, F., Houessou, D., and Wesenbeeck, L. (2019). Tragedy of the inland lakes. Int. J. Commons 13 (1), 609–636. doi:10.18352/ijc.911
Sterner, R. W. (2011). C: N: P stoichiometry in Lake Superior: Freshwater sea as end member. Inland Waters 1 (1), 29–46. doi:10.5268/IW-1.1.365
Stein, L. Y., and Klotz, M. G. (2016). The nitrogen cycle. Curr. Biol. 26 (3), 94–98. doi:10.1016/j.cub.2015.12.021
Tong, Y. D., Qiao, Z., Wang, X. J., Chen, G. Y., Zhang, W., Dong, X., et al. (2018). Human activities altered water N:P ratios in the populated regions of China. Chemosphere 210, 1070–1081. doi:10.1016/j.chemosphere.2018.07.108
Tong, Y. D., Wang, M. Z., Penuelas, J., Liu, X. Y., Paerl, H. W., Elser, J. J., et al. (2020). Improvement in municipal wastewater treatment alters lake nitrogen to phosphorus ratios in populated regions. Proc. Natl. Acad. Sci. U. S. A. 117 (21), 11566–11572. doi:10.1073/pnas.1920759117
Wanek, A., Hargiss, C. L. M., Norland, J., and Ellingson, N. (2021). Assessment of water quality in ponds across the rural, peri-urban, and urban gradient. Environ. Monit. Assess. 193 (11), 694. doi:10.1007/s10661-021-09471-7
Wang, J. Y., Da, L. J., Song, K., and Li, B. L. (2008). Temporal variations of surface water quality in urban, suburban and rural areas during rapid urbanization in Shanghai, China. Environ. Pollut. 152 (2), 387–393. doi:10.1016/j.envpol.2007.06.050
Wang, R. Z., Kimb, J. H., and Li, M. H. (2021). Predicting stream water quality under different urban development pattern scenarios with an interpretable machine learning approach. Sci. Total Environ. 761, 144057. doi:10.1016/j.scitotenv.2020.144057
Wang, Y. C., Shen, J. K., Yan, W. T., and Chen, C. D. (2019). Effects of landscape development intensity on river water quality in urbanized areas. Sustainability 11 (24), 7120. doi:10.3390/su11247120
Yang, K., Luo, Y., Chen, K. X., Yang, Y., Shang, C. X., Yu, Z. Y., et al. (2020). Spatial–temporal variations in urbanization in Kunming and their impact on urban lake water quality. Land Degrad. Dev. 31, 1392–1407. doi:10.1002/ldr.3543
Yang, X. K., and Lu, X. X. (2014). Drastic change in China's lakes and reservoirs over the past decades. Sci. Rep. 4, 6041. doi:10.1038/srep06041
Zhang, G. Q., Yao, T. D., Chen, W. F., Zheng, G. X., Shum, C. K., Yang, K., et al. (2019). Regional differences of lake evolution across China during 1960s–2015 and its natural and anthropogenic causes. Remote Sens. Environ. 221, 386–404. doi:10.1016/j.rse.2018.11.038
Keywords: urban expansion, water environmental protection, small water bodies, spatial pattern, nitrogen and phosphorus, TN:TP ratios
Citation: Zhou J, Li Y, Lei Q, Feng Q, Luo J and Lindsey S (2022) Asynchrony between urban expansion and water environmental protection reshapes the spatial patterns of nitrogen and phosphorus concentrations and N:P stoichiometry in inland small water bodies in Changsha, China. Front. Environ. Sci. 10:1018408. doi: 10.3389/fenvs.2022.1018408
Received: 13 August 2022; Accepted: 20 October 2022;
Published: 18 November 2022.
Edited by:
Jian Liu, Norwegian Institute of Bioeconomy Research (NIBIO), NorwayCopyright © 2022 Zhou, Li, Lei, Feng, Luo and Lindsey. This is an open-access article distributed under the terms of the Creative Commons Attribution License (CC BY). The use, distribution or reproduction in other forums is permitted, provided the original author(s) and the copyright owner(s) are credited and that the original publication in this journal is cited, in accordance with accepted academic practice. No use, distribution or reproduction is permitted which does not comply with these terms.
*Correspondence: Ying Li, bGl5aW5nOTM5MUAxMjYuY29t; Qiuliang Lei, bGVpcWl1bGlhbmdAY2Fhcy5jbg==