 Tianli Lan1
 Qinguo Ma
- 1State Key Laboratory of Subtropical Building Science, South China University of Technology, Guangzhou, Guangdong, China
- 2State Key Laboratory of Frozen Soil Engineering, Northwest Institute of Eco-Environment and Resources, Chinese Academy of Sciences, Lanzhou, Gansu, China
As the heat exchange interface between atmosphere and permafrost, land cover regulates the influence of climate warming on permafrost. With the development of desertification on the Qinghai-Tibetan Plateau (QTP), aeolian sand has emerged as a significant environmental factor influencing the hydrothermal process of permafrost. To reveal the hydro-thermal process within aeolian sand layer and the thermal effect of sand layer on permafrost in the QTP, a coupled hydro-thermo-vapor model considering rainfall and evaporation was established, and the long-term hydrothermal variation of stratum covered by aeolian sand were analyzed. The results show that: 1) Aeolian sand layer is conducive to alleviating permafrost degradation. The alleviation effect is related to the thickness of sand layer. 2) Water redistribution in sand layer and water accumulation in stratum are connected to thickness of sand layer. For the thin sand layer, the water content is low and remains unchanged in different years. The thick sand layer, acting as a permeability diode, makes the degree of water accumulation in sand layer considerable and the water storage of the stratum increase continuously. 3) When the sand layer becomes thicker, the increment of the equivalent thermal conductivity in cold season is larger than that in warm season, which will lead to the decrease of annual conductive heat. 4) In thin sand layer, heat convection and heat conduction are relatively small in the early stage, and heat conduction is the primary mode in the long term. In thick sand layer, heat transfer is dominated by heat convection and heat conduction in the early stage, but it is primarily reliant on heat convection in the long term.
1 Introduction
Recently, permafrost degradation caused by climate warming leads to a serious of freezing-thawing disasters and damage to engineering and infrastructure in permafrost regions (Hjort et al., 2022; Smith et al., 2022). Especially in the Qinghai-Tibetan Plateau (QTP), covering an area of approximately 1.06 km2 × 106 km2 (Figure 1A) and occupying approximately 40% of the plateau’s total area (Zou et al., 2017; Cheng et al., 2019), permafrost is facing a more severe test due to higher warming rate than the global average level and the high permafrost temperature (Zhang et al., 2015). Permafrost plays an important role in the surface landscape, carbon nitrogen cycle, ecosystems, and hydrogeological conditions of the QTP (Cheng and Jin, 2013; Wang et al., 2016; Wu et al., 2018; Jia et al., 2020; Mu et al., 2020), and has profound influence on regional climate regulation and sustainable development (Immerzeel and Bierkens, 2010; Yao et al., 2012; Yao et al., 2015). Land cover, as the heat exchange interface between atmosphere and permafrost, regulates the influence of climate change on permafrost (Peng et al., 2020; Smith et al., 2022). In the QTP, a large amount of quaternary loose sediments, the frequent frost weathering effect, and the strong wind provide rich sand sources for the large-scale aeolian sand desertification (Huang et al., 1993; Li, 2006; Wu et al., 2006), and the area of aeolian desertification area is approximately 3.93 km2 × 105 km2 in 2015 (Figure 1B), accounting for 15.1% of the total area of the QTP (Zhang et al., 2018). With the development of desertification on the QTP, aeolian sand has emerged as a significant environmental factor influencing the hydrothermal process of permafrost (Wang et al., 2002; Yang et al., 2004; Lü et al., 2008; Xie et al., 2012; Wang et al., 2020; Wang et al., 2021).
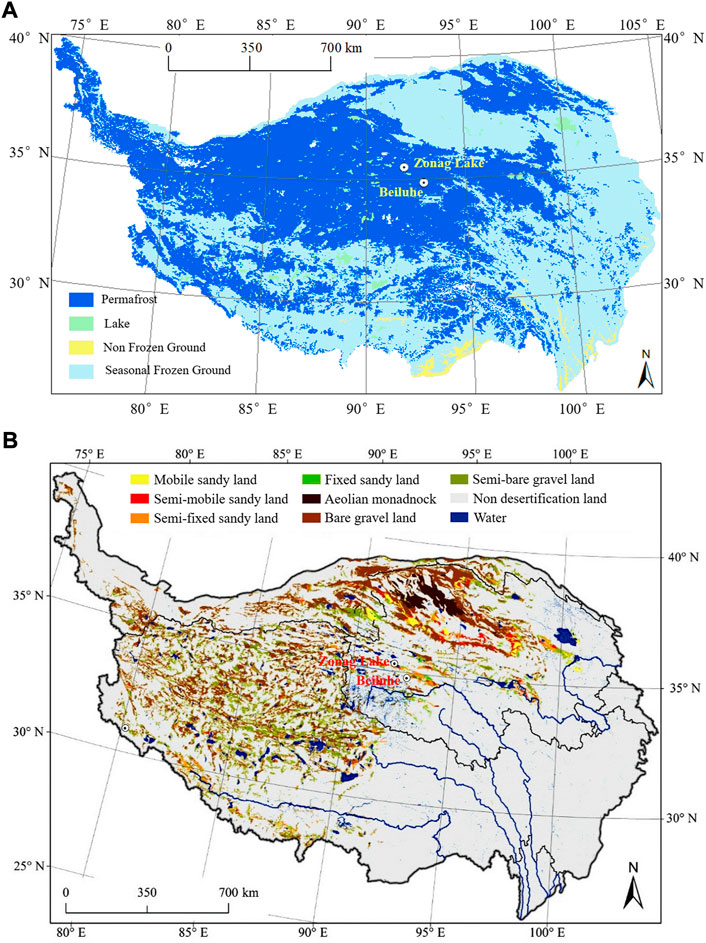
FIGURE 1. (A) Permafrost distribution and (B) Aeolian desertified land distribution on the Qinghai-Tibetan Plateau (Zhang et al., 2018).
The distinctive hydrothermal characteristics of the aeolian sand break the thermal energy balance and water balance between the atmosphere and stratum, and finally affect the hydrothermal state of permafrost (Wang et al., 2002; Chen et al., 2020). Firstly, owing to the higher albedo, the solar radiation absorbed by aeolian sand is less than that absorbed by bare land, leading to a lower average surface temperature than that of the bare land (Xie et al., 2015; You et al., 2017). Meanwhile, compared with the natural surface, the annual amplitude of geotemperature under aeolian sand increases due to the relatively smaller specific heat capacity of aeolian sand (Wang et al., 2020; Wang et al., 2021). Secondly, pore water content affects the heat conductivity of aeolian sand. The heat conductivity of dry sand is very small (Chen et al., 2014), and the dry sand covering on ground surface acts like a thermal insulation layer, weakening the heat exchange intensity of atmosphere and underlying permafrost (Wu et al., 2017; Chen et al., 2020). However, its thermal conductivity increases considerably with the increase of water content (Chen et al., 2014), and the heat conduction strengthens when the rainfall infiltrates into the sand layer. Thirdly, with the loose particle structure and high pore connectivity, the aeolian sand has high permeability (Chen et al., 2014). The concentrated rainfall rapidly infiltrates downward in rainy season, which strengthens the process of heat convection (Wu et al., 2017).
Some research have investigated the thermal impact of aeolian sand on underlying stratum, but there is still no unanimous conclusion. According to the monitoring geotemperature in the aeolian sand area of Hongliang River Basin, the temperature of stratum under natural surface is lower than that under sand layer (Wang et al., 2020). However, the opposite phenomenon was also found (Xie et al., 2012). Some other field studies showed that aeolian sand may have a duality effect on changing the geotemperature depending on its thickness (Wang et al., 2002; Lü et al., 2008). At present, the field measured data are mostly only 1–2 years, which cannot reflect the long-term influence of aeolian sand on underlying permafrost. Some studies pointed out that the thermal impact of aeolian sand on permafrost is related to its water content and thickness (Chen et al., 2020). As the sand layer thickens, the rise of the permafrost table is larger (Chen et al., 2021). The dry sand layer increases the geotemperature, while the wet sand layer decreases the geotemperature (Chen et al., 2018). Nevertheless, water migration in sand layer was not considered in previous research. Moreover, the effect of rainfall and evaporation was rarely involved. Water migration and the increase of water content within sand layer can strengthen the process of heat conduction and heat convection, and then affects the thermal regime of the underlying permafrost. Thus, it is necessary to analyze the long-term variation of water content within sand layer and reveal the influence mechanism by which aeolian sand affect the thermal regime of permafrost.
In this study, considering the rainfall, evaporation, freezing-thawing process, and climate warming, a coupled hydro-thermo-vapor model of unsaturated soil including the ice-water-vapor phase transition and the water migration and its convective heat effect was established. Based on the coupling model, the thermal state and soil water distribution of stratum covered by aeolian sand were simulated, and the long-term hydro-thermal process of aeolian sand with different thickness was analyzed. Lastly, the equivalent heat conductivity (ETC) of sand layer and the heat transfer mode in the sand-soil interface were studied to reveal the thermal impact mechanism of aeolian sand on permafrost.
2 Mathematical methods
2.1 Heat and mass conservation equations
For the unsaturated frozen soil, pore water migrates in the forms of liquid and vaporous water (Philip and De Vries, 1957; Saito et al., 2006). The variation in thermal energy including sensible heat and latent heat of ice-water-vapor phase change is equal to the sum of conductive heat and convective heat of the migration water during the freezing-thawing process (Zhang et al., 2016; Bai et al., 2018). The governing equations can be given as:
The frozen soil is composed of soil particles, ice, water and air, and its thermal properties are related to the proportion of their phases, which can be expressed as (Zhang et al., 2016):
Analogous to the drying process, the soil-water characteristic curve can be adopted to describe the reduction of unfrozen water during freezing. The measured unfrozen water content and matrix potential (Lu et al., 2018) in the freeze-thaw test was fitted by the VG model (Van Genuchten 1980) as follow:
where α, m and n are experimental parameters, and m = 1–1/n.
For frozen soil, as the negative temperature decreases, the maximum unfrozen water content reduces, and their relationship and the total water content allow for the determination of unfrozen water content as follow (Xu et al., 2010):
where a and b are experimental parameters.
The above equations constitute the coupled hydro-thermo-vapor model of unsaturated soil during the freezing-thawing process. Table 1 introduces the variations of the model. Table 2 shows the expressions of the parameters and variations mentioned in the mathematical model.
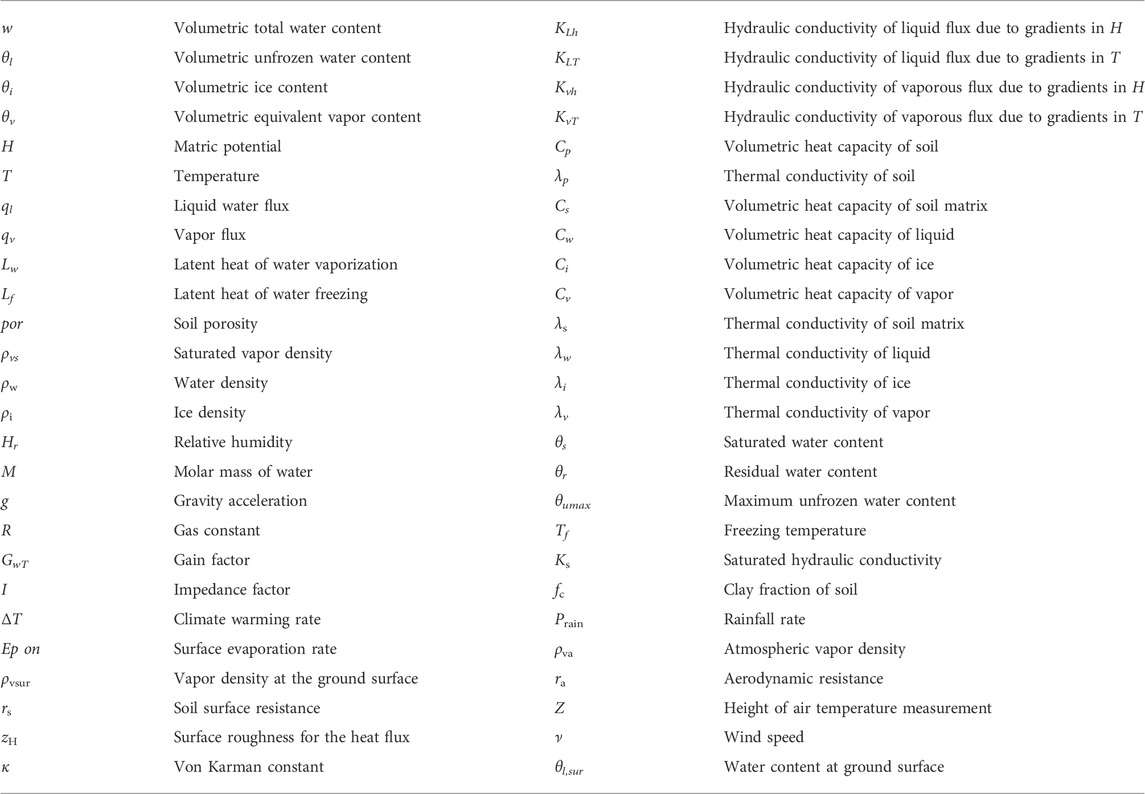
TABLE 1. List of symbols.
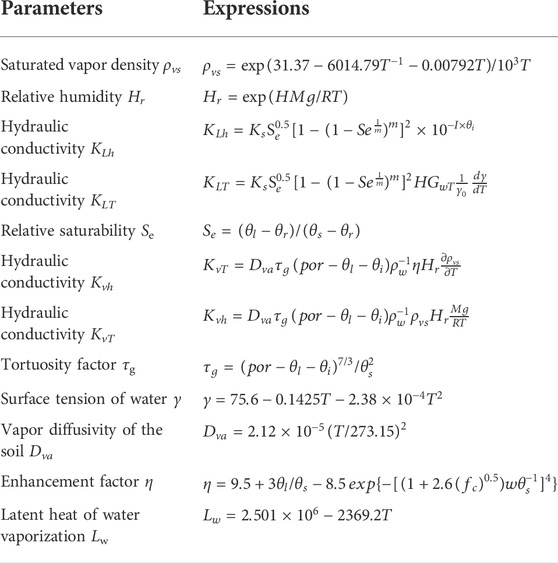
TABLE 2. Expressions for related parameters.
2.2 Boundary conditions
2.2.1 Thermal boundary conditions
2.2.1.1 Dirichlet boundary
The temperature on the boundary is given directly:
where
2.2.1.2 Neumann boundary
The thermal flux on the boundary is given:
where
2.2.1.3 Robbin boundary
The linear combination of temperature and its exterior normal derivative on the boundary:
where h is convection coefficient; and Ta is ambient temperature.
2.2.2 Water boundary conditions
2.2.2.1 Dirichlet boundary
The water content on the boundary is given directly:
where
2.2.2.2 Neumann boundary
When precipitation cannot form surface water and surface runoff, the water flux on the boundary is given:
where
2.2.2.3 Robbin boundary
When precipitation forms surface ponding and surface runoff, the water boundary is a linear combination of saturation water content and water flux:
where c and d are both experimental constant.
2.3 Derivation of finite element equation
The governing Eqs 1, 2 are highly non-linear and cannot be solved directly. Combining the total water content w and temperature T as the independent variable, the partial differential equations are discretized by finite element method and backward difference method, and the nonlinear Newton iteration method was used to solve the discrete equations. Other variations can be obtained by algebraic equation based on w and T as shown in Eqs 3, 4 and Eqs 8–10. The solution procedure was facilitated by COMSOL Multiphysics.
2.4 Model validation
The proposed model was verified by the field measured soil water content and temperature of the Beiluhe station on the QTP (Zhang et al., 2015). The station is located at 34.854°N/92.940°E, with an elevation of 4,620 m. It belongs to the arid climate area of the QTP, with an annual average temperature of -3.8°C and an annual average precipitation of 290–300 mm. The meteorological data including air temperature, daily precipitation, wind speed, and air relative humidity are shown in Figure 2.
FIGURE 2. The meteorological data at the Beiluhe station (A) air temperature, (B) daily precipitation, (C) wind speed, (D) air relative humidity.
Geological data shows that three soil layers are contained within a depth of 30 m: sandy clay (0∼−2.0 m), silty clay (−2.0∼−8.0 m), mudstone (below −8.0 m). A one-dimensional model was developed as the site is flat and the transfer of water and heat within stratum main occurs longitudinally. Table 3 shows the hydrothermal parameters of each soil layer.

TABLE 3. Hydrothermal parameters of different soil layers.
The temperature boundary condition at the ground surface is affected by air temperature, solar radiation, wind speed, rainfall, etc (Luo et al., 2020). Based on the adherent layer theory (Zhu, 1988), considering global warming, the temperature boundary at the ground surface can be expressed as Eq. 17. According to the field geothermal data at the Beiluhe, the heat flux of soil at the bottom boundary was given as 0.04 W/m2.
where th is time; φ is the phase radian; the climate warming rate ΔT is 0.052°C/a in the QTP (Qin et al., 2002). Considering the small rainfall and low rainfall intensity, the surface is considered as no ponding and runoff, and the water boundary shown in Eq. 15 was used at the ground surface, and the water flux
Controlled by atmospheric condition and soil water condition, the surface evaporation Ep can be calculated by (Camillo and Gurney 1986):
For bare soil surface, neglecting the influence of atmospheric stability, the aerodynamic resistance ra and soil surface resistance rs can be calculated as (Adriaan et al., 1994):
Considering the soil at a certain depth is frozen throughout the year in the permafrost regions, the water boundary at the bottom boundary is regarded as a zero flux.
Figure 3 show the variations of measured and calculated ground temperature and unfrozen water content at different depths from October 2012 to October 2013. It can be seen that the variation trends of the simulated ground temperature and water content throughout the year are basically the same as those of the measured results. On the one hand, this numerical model can simulate the seasonal periodic change of soil temperature in different depths, as shown in Figures 3A–C. On the other hand, this model can simulate the change of unfrozen water content during the freezing-thawing process, especially at the ground surface, where the soil water responds sharply to rainfall and evaporation, as shown in Figures 3D–F. Thus, the proposed coupled model is applicable to simulate the hydro and thermal variations of the stratum during the freezing-thawing process considering the rainfall and evaporation.
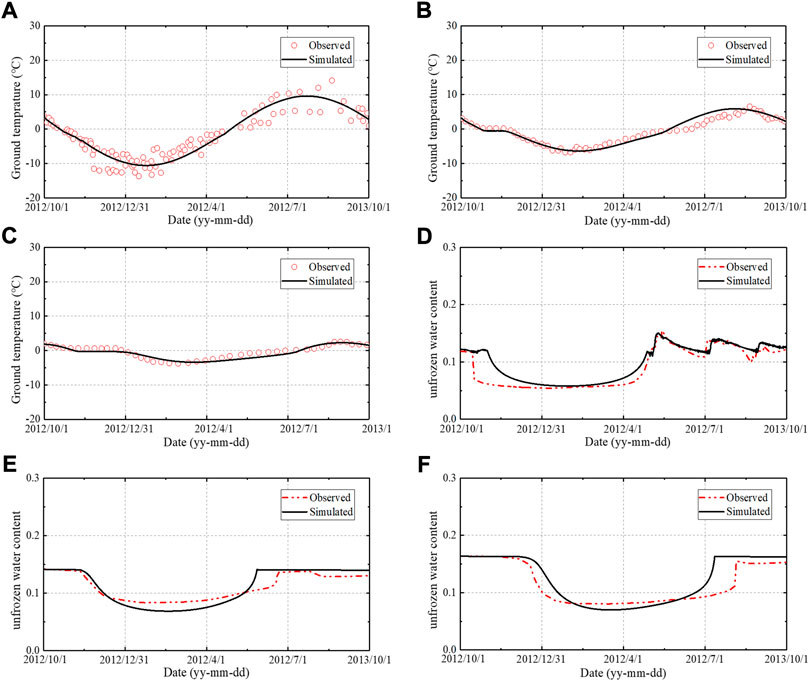
FIGURE 3. Variation of measured and calculated ground temperature at (A) 0.15 m, (B) 0.75 m, (C) 1.50 m, and measured and calculated unfrozen water content at (D) 0.05 m, (E) 0.75 m, (F) 1.50 m.
3 Influence of sand layer on the hydro-thermal process of permafrost
3.1 Field site description
The permafrost and aeolian sand desertification in the Zonag Lake region are developed (Xie et al., 2020), as shown in Figure 1B. Located at the northwest (35.490°N/91.960°E) of the QTP, the elevation is 4,800 m, the annual average air temperature is −3.8∼−4.8°C and the annual precipitation is approximately 200–300 mm. A one-dimensional model was established, and three soil layers were contained within the depth of 30 m: sandy clay (0∼−2.0 m), silty clay (−2.0∼−8.0 m), mudstone (−8.0∼−30.0 m). The hydrothermal parameters of the stratum can be referred to Table 3. In order to analyze the influence of sand layer on the thermal process of permafrost, the sand layer with different thicknesses (the thicknesses are 0, 0.25, 0.50, 0.75, and 1.0 m, respectively) was covered on the ground surface, and the long-term hydrothermal change of the sand-stratum system was simulated by the coupled model. The hydrothermal parameters of aeolian sand were obtained by fitting the data from the freezing-thawing test (Lu et al., 2018; Hu et al., 2019), as shown in Table 3.
3.2 Boundary conditions
The meteorological data from the Zonag Lake meteorological station is shown in Figure 4 (Zhao et al., 2021). According to the adherent layer theory (Zhu, 1988) and the measured air temperature Figure 4A, the temperature boundary at the ground surface without being covered by the sand layer was set as Eq. 22:
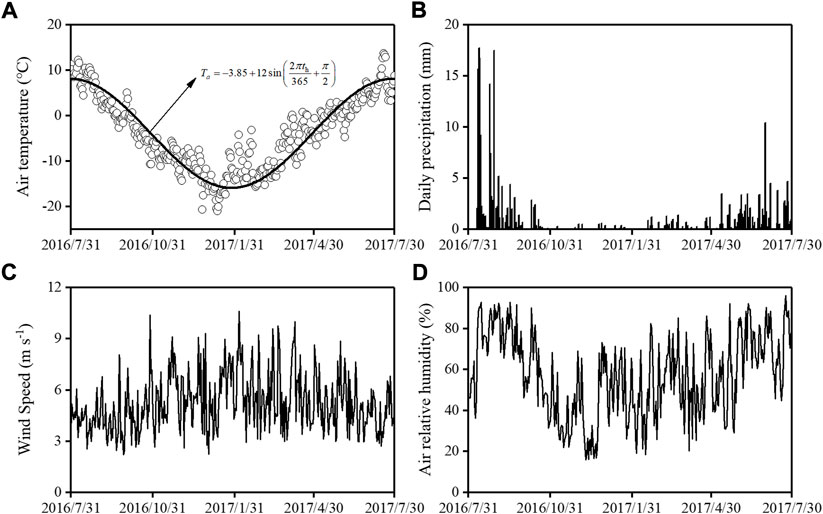
FIGURE 4. The measured meteorological data at the Zonag Lake station (A) air temperature, (B) daily precipitation, (C) wind speed, (D) air relative humidity.
Due to the higher surface albedo of aeolian sand, the mean annual temperature at sand surface is lower than that at ground surface (Xie et al., 2015; You et al., 2017). The specific heat capacity of aeolian sand is smaller than that of clays, and the thermal diffusivity is relatively larger, which leads to a higher temperature amplitude (Wang et al., 2021). Thus, the temperature at the sand surface was set as Eq. 23, which was applied as the temperature boundary at the sand surface.
The water boundary condition at the ground surface for the stratum without covering sand layer and at the sand surface can be calculate by Eqs. 18–21. The precipitation rate minus the evaporation rate were directly obtained from the meteorological data in Figure 4.
According to the measured geothermal data, the heat flux of soil at the bottom was given as 0.04 W/m2. The water boundary at the bottom was considered as a zero flux because the soil keeps frozen.
Through a long-term transient solution under the natural boundary conditions, the initial geotemperature and soil water content of the stratum were obtained. According to the in-situ measured data, the initial water content within sand layer was set as 5% (Chen et al., 2014).
3.3 Results and analysis
3.3.1 Analysis of thermal regime
Figure 5 shows the variation of permafrost table of the stratum covered by sand layer with different thickness over 20 years. The permafrost table was calculated from natural surface. It can be found that the permafrost table of the stratum without covering sand layer declines with time and moves down to –2.30 m in the 20th year. While the permafrost table of the stratum covered by sand layer rises first and then declines. When the thickness of sand layer is 0.25 m, the permafrost table firstly rises to –1.57 m in the third year, and then continuously declines to −1.82 m in the 20th year; when the thickness is 1.00 m, the permafrost table rises to −0.89 m in the 10th year, and then continuously declines to −1.08 m in the 20th year. Meantime, it can be found that compared with the permafrost table of stratum covered with sand layer, the permafrost table of stratum without covering sand layer is relatively deeper, which was also found in the previous study (Chen et al., 2021). Moreover, the thicker the sand layer is, the higher the permafrost table is in different years. From the perspective of permafrost table, although the sand layer cannot prevent the permafrost from degrading, it is conducive to alleviating the permafrost degradation induced by climate warming.
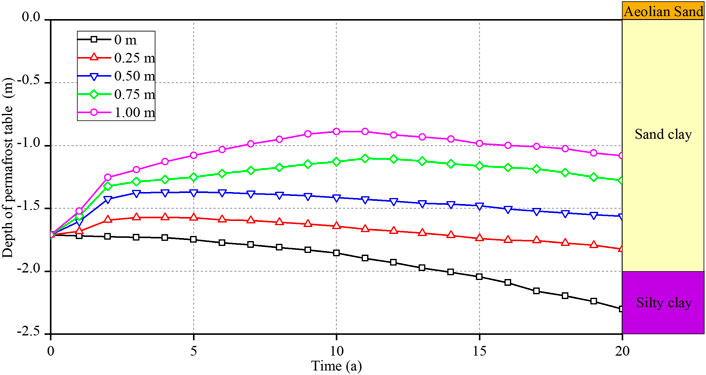
FIGURE 5. Variation of permafrost table of the stratum covered by sand layer with different thickness during 20 years.
The evolutions of temperature at −1.00 m under ground surface are shown in Figure 6. As shown in Figure 6A, the temperature at depth of −1.00 m periodically varies with the air temperature. As the sand layer thickens, the maximum value and the amplitude of the temperature decrease and the minimum value increases, which is in accord with the field measured result in Wang’s study (Wang et al., 2021). The annual average temperature of soil at the depth of −1.00 m is shown in Figure 6B. For the stratum without covering sand layer, the annual average temperature increases from −0.91 to 0.06 °C with a heating rate of 0.049 °C/a during 20 years, implying that permafrost is warming up. For the stratum covered with sand layer, the average temperature in the first year increases due to the heat energy carried by sand layer. The thicker the sand layer, the more thermal energy it carries, and the higher the average temperature in the first year. With the sand layer thickening from 0.25 to 1.00 m, the average temperature in the first year increases from −0.87 to −0.37°C. After the first year, with the thermal energy carried by sand layer releasing, the average temperature rapidly decreases. For example, when the thickness of the sand layer is 0.25 m, the temperature decreases to −1.07°C in the third year; when the thickness is 1.00 m, the temperature decreases to −1.09°C in the 10th year. The decrease in the soil temperature is a result of the high albedo of the sand surface, which reduces the heat absorption at sand surface. As the climate warms, the heat absorbed by the sand surface progressively rises, and the heat is transferred to the underlying permafrost, causing the soil temperature to steadily increase rather than decrease. However, functioning as an insulation on the natural ground surface, the sand layer postpones the soil temperature increasing. Consequently, thick sand layer turns to warming later. For the stratum under sand layer with thicknesses of 0.25, 0.50, 0.75, and 1.00 m, the soil temperature at the depth of −1.00 m increases to −0.40, −0.53, −0.70, and −0.66°C in the 20th year. The warming rates are 0.044, 0.040, 0.039, and 0.045°C/a, respectively in the warming period, which are lower than that of the stratum without covering sand layer. From the perspective of variation of soil temperature, the permafrost is in the cooling state in the early stage, but in the warming state in the long term, which is consistent with the evolution law of the permafrost table Figure 5. The sand layer is conducive to alleviating the permafrost warming induced by climate warming.
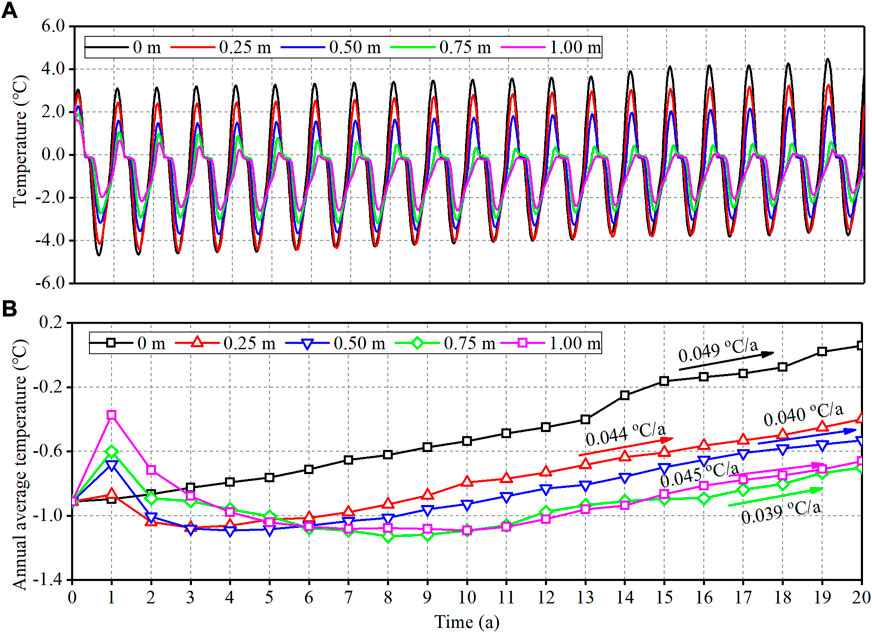
FIGURE 6. Variation of the soil temperature at −1.00 m under ground surface during 20 years (A) the temperature, (B) the annual average temperature.
Figure 7 shows the average temperature distribution of stratum covered by sand layer with different thickness in the 20th year. The average soil temperature in the 20th year is apparently higher than the initial average temperature, meaning that the permafrost is warming up, which is resulted from the climate warming. Meanwhile, it also can be found that the average temperature distribution of stratum covered by sand layer is much lower than the stratum without covering sand layer, which means that the sand layer has the effect of delaying permafrost warming. The delaying effect extends to the soil at the depth of −15.00 m. This delaying effect of the sand layer on permafrost warming was also verified by the field observation result in Xie’s study (Xie and Qu, 2013).
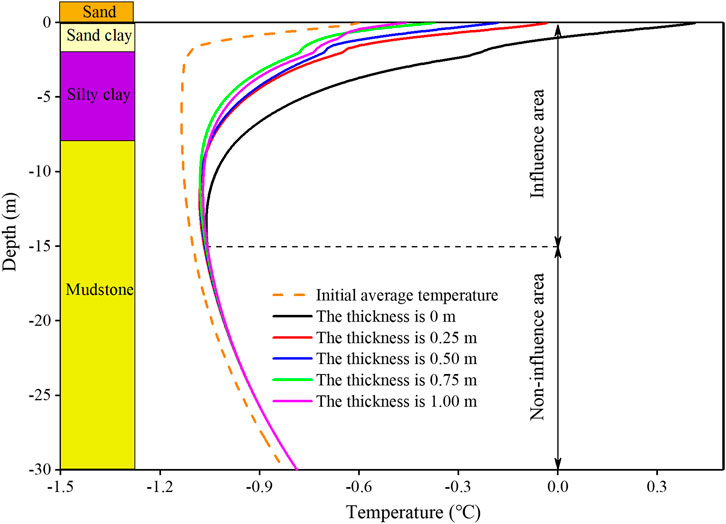
FIGURE 7. Average geotemperature of stratum covered by sand layer with different thickness in the 20th year.
From the analysis of the evolution of permafrost table and soil temperature, it can be found that the sand layer can alleviate the permafrost degradation caused by climate warming in the long run. Thicker sand layer has a stronger alleviating effect than thinner sand layer.
3.3.2 Analysis of soil water content
During rainfall, evaporation and freezing-thawing process, the water within unsaturated soil migrates. The evolution of water content at 0.10 m below the sand surface is shown in Figure 8. The climate on the QTP has the characteristics of synchronous rainfall and temperature (Figure 8), and the evolution of water content at 0.10 m below the sand surface presents seasonal differences. In the warm and rainy season (from the first of May to the end of October), the water content responds rapidly and sharply to the precipitation. While in the cold and dry season (from the end of October to the first of following May), due to the scarce precipitation and strong evaporation, the water content settles in 4.0%–5.0%. Compared with the warm and rainy season, the water content is more stable in the cold and dry season. As shown in Figure 9, the water content distributions sand layer and soil layer below on October 15 in different years were analyzed to explore the interannual variation of soil water content.
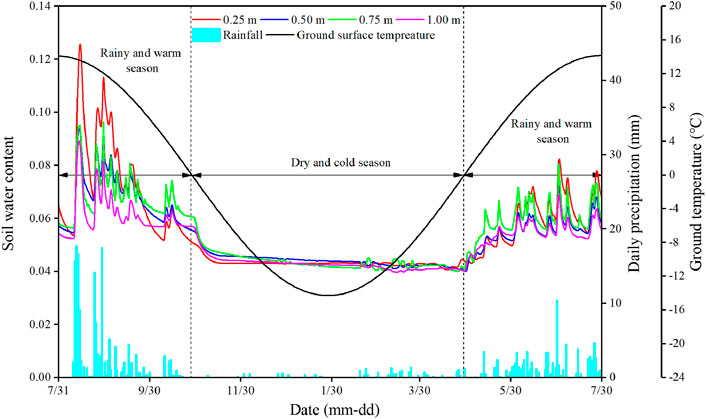
FIGURE 8. The evolution of water content of soil 0.10 m below the sand surface in the 20th year.
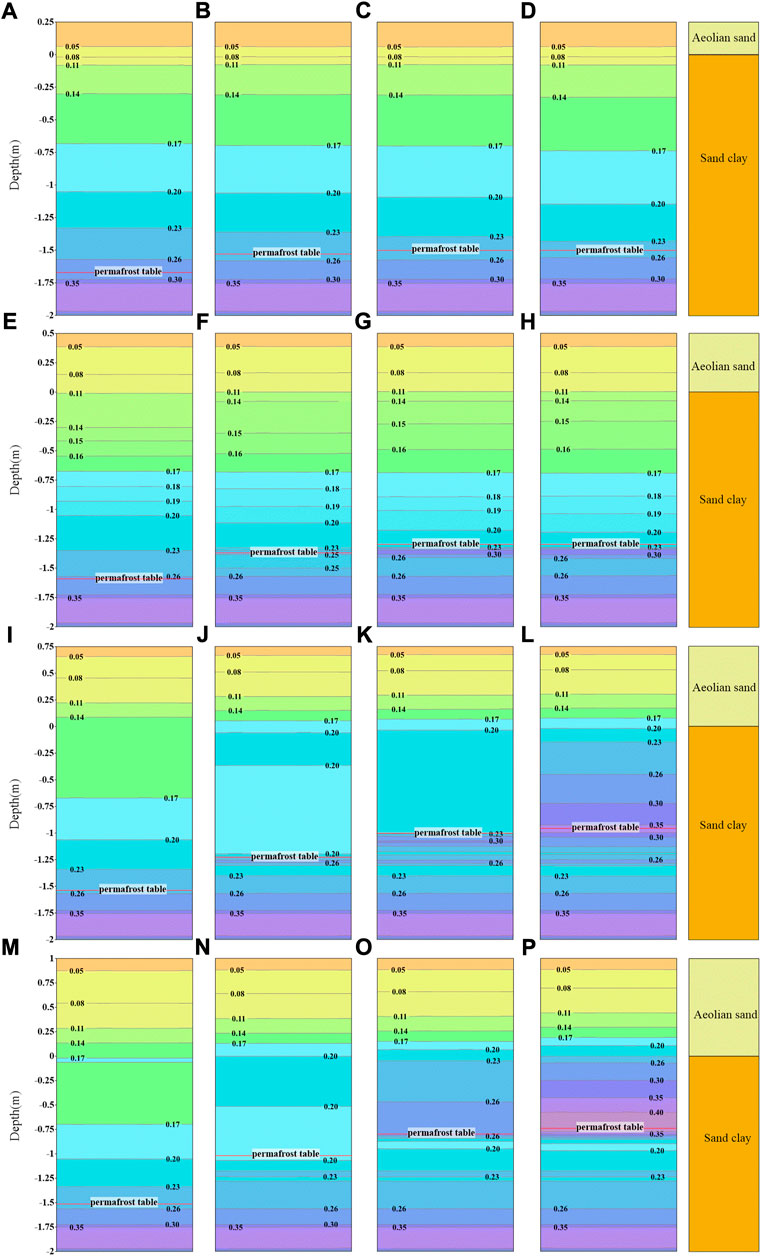
FIGURE 9. The water content distributions of stratum and sand layer with thickness of 0.25 m in the (A) first year (B) fifth year (C) 10th year (D) 20th year, 0.50 m in the (E) first year (F) fifth year (G) 10th year (H) 20th year, 0.75 m in the (I) first year (J) fifth year (K) 10th year (L) 20th year, and 1.00 m in the (M) first year (N) fifth year (O) 10th year (P) 20th year.
From Figures 9A–D, it can be found that in 0.25 m sand layer, the water content on the top and bottom surfaces are 5.0% and 8.0%, respectively, and the values almost remain unchanged in different years. The water content distributions of sand layer also remain unchanged in different years. The minimum water content in stratum is at the top surface of the sand clay, and the maximum water content is located at the depth of permafrost table. Meantime, the water content distributions of sand clay also remain unchanged in different years. The constant distributions of water content within aeolian sand and sand clay in different years mean that the water content distribution of soil covered by 0.25 m sand layer is relatively stable under the comprehensive effect of the rainfall, evaporation and freezing-thawing cycle.
From Figures 9E–H, it can be found that the water content on the top and bottom of 0.50 m sand layer is 5.0% and 11.5%, respectively, which is higher than that of 0.25 m sand layer. It means that more water infiltrates to the bottom of aeolian sand and is stored here due to the less permeability coefficient of sand clay than that of aeolian sand. However, the distribution of water content in sand layer remain unchanged as time goes on. Similarly to the soil beneath 0.25 m sand layer, the water content distributions of sand clay beneath 0.50 m sand layer almost unchanged during 20 years, expect for the isoline with water content 14.0% rising slightly from −0.29 m to −0.23 m.
From Figures 9I–L, it can found that the water content is redistributed as time goes on in 0.75 m sand layer. In the first year, the minimum water content and the maximum water content are at the top and bottom surfaces of sand layer, and their values are 5.0% and 17%, respectively. However, in the 20th year, the maximum water content is 22.0%. It means that the rainfall can infiltrate to at the bottom of the sand layer and accumulate here. Meanwhile, soil water in sand clay above the permafrost table is also significantly redistributed. The isoline with water content 17.0% is at the depth of −0.67 m in the first year, while it disappeared in the following years, and water content of sand clay is larger than 23%. It indicates that the accumulated water can further infiltrate the sand clay.
From Figures 9M–P, it can be found that the water within 1.0 m sand layer is redistributed as time goes on, which is similar to that of 0.75 m sand layer. The minimum water content at the sand surface is 5.0% over 20 years. However, the maximum water content is at the bottom surface with value from 17.2% to 25.4% during 20 years. The redistribution effect of water in sand clay is more significant than those of sand clay covered by the sand layer with the thickness of 0.25, 0.50, and 0.75 m. In the 20th year, two areas with water content reaching 35.0% are existed in the sand clay. One is near the permafrost table, the other one locates at the depth of the initial permafrost table.
It is noticeable that the degree of water accumulation at the sand-soil interface and the water content increment in stratum due to water infiltration from the sand layer to the sand clay is closely related to the thickness of the sand layer. When the thickness is less than 0.50 m, the degree of water accumulation and the redistribution of water content are slight. However, when the thickness is larger than 0.50 m, the degree is significant. The reason is that the rainfall can rapidly infiltrate downward accumulate at the sand-soil interface due to the less permeability coefficient of sand clay than that of aeolian sand. During evaporation, the infiltrated water is migrated unward. However, the influence depth of water evaporation in the sand layer is approximately 0.60 m (Wang et al., 2021). Hence, for the sand layer with thin thickness, the infiltrated water in the sand layer can evaporate back into the atmosphere, resulting in that the water content distributions of sand layer almost unchanged in different years and even decrease, as shown in Figures 9A–H. For the sand layer with thick thickness, the infiltrated water in the sand layer at a position deeper than 0.60 cm is difficult to be evaporated, resulting in that infiltrated water is accumulated at the sand-soil interface and part of the accumulated water migrates to the sand clay as time goes on, as show in Figures 9I–P. The thick sand layer acts as a “permeability diode,” which breaks the water balance between the atmosphere and the stratum, making the water storage of the stratum increase continuously. In other desert areas in China, the phenomenon of atmospheric precipitation transforming into soil water in thick sand layer is also confirmed by the previous researches (Zhao et al., 2010; Zhao et al., 2011; Zhao et al., 2012).
3.4 Discussion
By analyzing the thermal state of permafrost and the variation of water content in the sand layer and stratum, it can be found that in the long run, with the thickening of sand layer, the alleviation effect of sand layer on the permafrost degradation is strengthened, and the degree of water accumulation is also intensified. Under aeolian sand, the thermal state of permafrost is closed related to the energy transmission in sand layer, including heat conduction and heat convection. Because the thermal conductivity of soil is related to the water content (Chen et al., 2014), and the heat convection caused by water migration affects the heat exchange (Ma et al., 2018). The variation of water content deeply affects the thermal energy transmission within sand layer. Based on the water content distribution in the sand layer, the mechanism of the sand layer alleviating permafrost degradation can be revealed by analyzing the heat conduction and heat convection in the sand-soil interface.
3.4.1 Effect of sand layer on heat convection
During rainfall, evaporation and freezing-thawing process, the water within unsaturated soil migrates in the form of liquid water and vaporous water (Philip and De Vries, 1957; Saito et al., 2006). The convective effect of water influences the heat transfer in the unsaturated soil (Ma et al., 2022a; Ma et al., 2022b).
Figure 10 shows the annual heat flux at the sand-soil interface, and the negative value means that the heat transfers from stratum to sand layer, while the positive value means that the heat transfers from sand layer to stratum. It can found from Figure 10A that for the sand layer with the thickness of 0.25 and 0.50 m, the annual convective heat is transferred from stratum to sand layer. However, the value is very small and shows a slightly decreasing trend as time goes on. The convective heat is closely related to water migration. The tiny annual convective heat means that the water content distributions of sand layer remain almost unchanged in different years, which is consistent with the variation of the water content within sand layer with the thickness of 0.25 and 0.50 m in different years (Figures 9A–H).
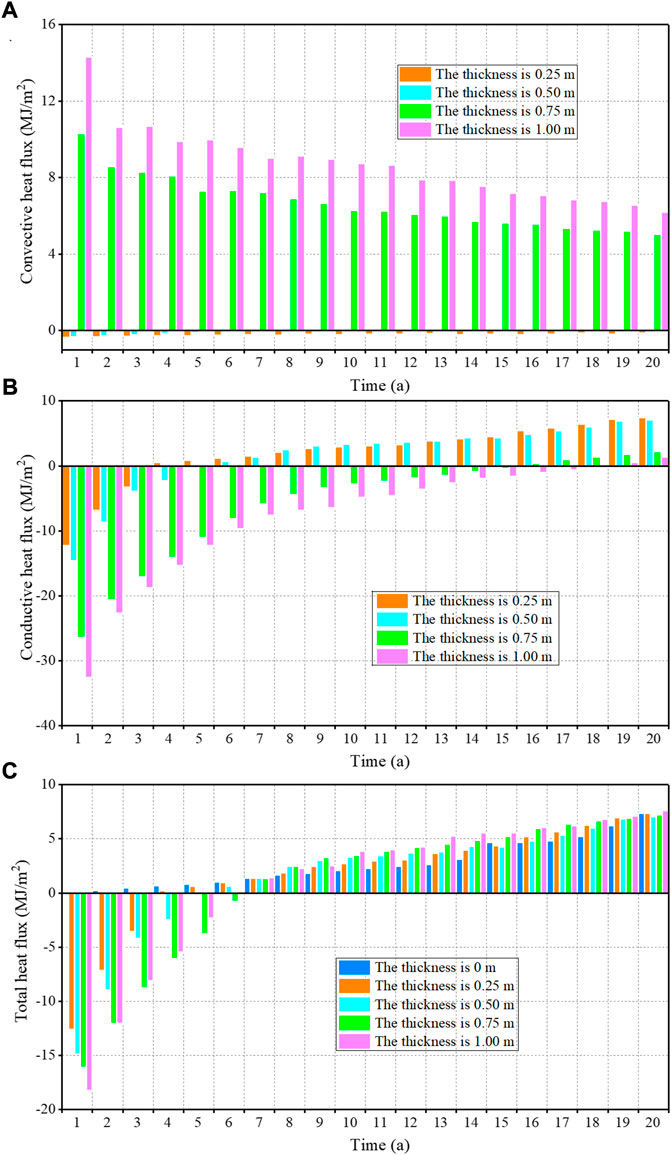
FIGURE 10. The annual heat flux at the sand-soil interface in different years (A) Convective heat flux, (B) Conductive heat flux, (C) Total heat flux.
However, for the sand layer with the thickness of 0.75 and 1.00 m, the annual convective heat is transferred from sand layer to stratum. The value in different years and its decreasing trend are both much larger than those of sand layer with the thickness of 0.25 and 0.50 m. It means that the water migration in thick sand layer are more significant than those in thin sand layer, resulting in that the degree of water accumulation within thick sand layer are much more obvious, which is consistent with the variation of the water content distributions as shown in Figures 9I–P.
3.4.2 Effect of sand layer on heat conduction
As Figure 10B shows, the annual conductive heat flux at the sand-soil interface under sand layer with different thickness increases with time and changes from heat release to heat absorption in a certain year due to the climate warming. For example, for the sand layer with the thickness of 0.50 m, the annual conductive heat flux increases from -14.58 MJ/m2 in the first year to 0.10 MJ/m2 in the fifth year, and keeps increasing to 7.11 MJ/m2 in the 20th year. However, the amount of total heat conduction of the stratum under the sand layer with different thickness varies greatly over 20 years. When the thickness is 0.25, 0.50, 0.75 and 1.00 m, the amount of total heat conduction is 40.8, 31.7, −116.5 and −152.7 MJ/m2, respectively. It also can be found that as the sand layer thickens, the conductive heat decreases. From the perspective of heat conduction of sand layer, thicker sand layer has a stronger alleviating effect than thinner sand layer.
The heat conduction in sand layer is closely related to its thermal conductivity. To further analyze the difference of heat conduction between sand layers with different thicknesses, the equivalent heat conductivity (ETC) of sand layer was calculated. Firstly, the thermal conductivity of sand layer in different depth can be calculated by Eq. 6 based on the content of each phase. And then, regarding the sand layer as a composite multi-layer thermal conducting plate laid in the ground surface, the superposition principle of series thermal resistance in Eq. 24 was adopted to calculate the ETC of sand layer with different thickness.
where Reff is the equivalent thermal resistance; d is the thickness of sand layer; dk and λk are the thickness and heat conductivity of each layer.
The evolution of ETC of sand layer with different thickness in the 20th year is shown in Figure 11. For the sand layer with the thickness of 0.25 and 0.50 m, the ETCs of sand layer in the rainy and warm season are larger than those in the dry and cold season. This is because the sand layer is replenished by rainfall in rainy and warm season, but the infiltration rainwater has been gradually evaporated before it comes to dry and cold season, which implies that the influence of water-ice phase transition on ETC in dry and cold season is slight (Figure 11) due to the low water content within sand layer. However, for the sand layer with the thickness of 0.75 and 1.00 m, the ETCs of sand layer in the rainy and warm season are less than those in the dry and cold season. This is because the total water content of thick sand layer has been high (Figures 9L,P), and the rainfall in the warm and rainy season has little impact on the ETC, but the large amount of ice generated in dry and cold season leads to the remarkable enhancement of the ETC (Figure 11). Conclusively the rainfall and evaporation has a greater impact on the ETC when the water content is low, while the freezing and thawing of soil water has a greater impact on the ETC when the water content is high. As shown in Figure 11, the increment of the ETC in cold season is larger than that in warm season when the sand layer thickens, which indicates that the increment of conductive heat flowing out of the stratum in cold season is larger than the increment of conductive heat flowing into the stratum in warm season when the sand layer thickens. Finally, the thicker the sand layer, the lower the annual conductive heat (Figure 10B).
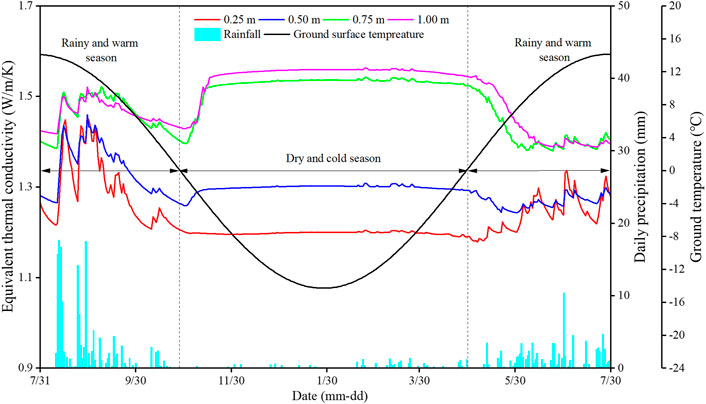
FIGURE 11. The ETC of sand layer with different thickness in the 20th year.
3.4.3 Total heat flux under sand layer
Comparing the annual convective heat flux, as shown in Figure 10A and the annual conductive heat flux at the sand-soil interface, as shown in Figure 10B, it can be found that the heat transfer modes in the sand layer with different thickness are different, which is closely related to the water content distribution. Within the sand layer with thickness of 0.75 and 1.00 m, the heat transfer is dominated by both the heat convection and heat conduction in the early stage, but it is based primarily on heat conduction in the long term. However, for the sand layer with the thickness of 0.25 and 0.50 m, the heat convection and heat conduction are relatively small, but heat conduction is the main mode of heat transfer in the long term.
Combining the conductive and convective heat fluxes showed in Figures 10A,B, the total heat fluxes at the sand-soil interface in different years are shown in Figure 10C. The negative value means that the heat transfers from stratum to sand layer, while the positive value means that the heat transfers from sand layer to stratum. Under the natural surface, the annual total heat flux increases from 0.09 to 7.35 MJ/m2 during 20 years. It means that heat flowed into the stratum gradually increases with the climate warming, resulting in permafrost table declining and permafrost warming, which is consistent with the variations of permafrost table and soil temperature in Figures 5, 6. Under the sand layer with different thickness, the annual total heat flux also increases with time, and it is negative in the first few years and changes to be positive in the following years, which means that the stratum is in exothermic state in the early stage and is in endothermic state in the long term. As a result, the permafrost table rises and soil temperature decreases in the early stage, and then the permafrost table declines and the soil temperature increases in the long term, which is also consistent with the variations of permafrost table and soil temperature in Figures 5, 6.
4 Conclusion
With the development of desertification on the QTP, the heat exchange between the atmosphere and underlying permafrost is disturbed by the aeolian sand layer. In this paper, a coupled hydro-thermo-vapor model considering the rainfall and evaporation was established, and the thermal influence mechanism of sand layer on permafrost was analyzed. The conclusions are listed as follows:
(1) Aeolian sand layer significantly influences the thermal state of underlying stratum. As the sand layer thickens from 0.25 to 1.00 m, the permafrost table decreases from −1.08 ∼ −1.82 m in the 20th year, which is shallower than 2.30 m under natural surface. The annual average geotemperature under sand layer with different thickness is higher that the initial average temperature, but lower than that under natural surface in the 20th year. Although the sand layer cannot protect the permafrost from degradation under climate warming, it is conducive to alleviating the permafrost degradation. Thicker sand layer has a stronger alleviating effect than thinner sand layer.
(2) The degree of water accumulation at the middle and bottom of aeolian sand layer and the water content redistribution in the stratum are connected to the sand layer thickness. As the sand layer thickens from 0.25 to 1.00 m, the maximum water content within sand layer is 8.0%, 11.5%, 22.0% and 25.4% in the 20th year, respectively. For the thin sand layer (0.25 and 0.50 m), the degree of water accumulation is slight, and the water content distribution of sand layer remains unchanged in different years. The thick sand layer (0.75 and 1.00 m), acting as a permeability diode, makes the degree of water accumulation in sand layer considerable and the water storage of the stratum increase continuously.
(3) The ETC of sand layer is tightly connected to the distributions of water content and ice content. When the sand layer becomes thicker, the increment of the ETC in cold season is larger than that in warm season, which indicates that the increment of conductive heat flowing out of the stratum in cold season is larger than the increment of conductive heat flowing into the stratum in warm season. The thicker the sand layer, the lower the annual conductive heat.
(4) As the climate warming, the annual total heat flux shifts from flow out to flow into the stratum, and the inflow heat grows with years. However, the mode of heat transfer in the sand layer is affected by its thickness. For the thin sand layer, the heat convection and heat conduction are relatively small, and heat conduction is the main mode in the long term. For the thick sand layer, the heat transfer is dominated by heat convection and heat conduction in the early stage, but it is based primarily on heat conduction in the long term.
Data availability statement
The original contributions presented in the study are included in the article/Supplementary Material, further inquiries can be directed to the corresponding author.
Author contributions
TL: Methodology; Software; Validation; Writing-original draft. QM: Methodology; Review and editing, Formal analysis. HX: Conceptualization; Review and editing, Formal analysis. XL: Conceptualization; Methodology; Supervision; Validation; Writing review and editing.
Funding
The Second Tibetan Plateau Scientific Expedition and Research (STEP) Program (No. 2019QZKK0905), China Postdoctoral Science Foundation (No. 2021TQ0114), Natural Science Foundation of Guangdong Province (No. 2021A1515110408), Open Fund of the State Key Laboratory of Frozen Soil Engineering (No. SKLFSE201810), Science and Technology Projects in Guangzhou (Nos. 202102020486 and 202201010262) and Guangdong Provincial Key Laboratory of Modern Civil Engineering Technology (No. 2021B1212040003).
Conflict of interest
The authors declare that the research was conducted in the absence of any commercial or financial relationships that could be construed as a potential conflict of interest.
Publisher’s note
All claims expressed in this article are solely those of the authors and do not necessarily represent those of their affiliated organizations, or those of the publisher, the editors and the reviewers. Any product that may be evaluated in this article, or claim that may be made by its manufacturer, is not guaranteed or endorsed by the publisher.
References
Adriaan, A., Van Genuchten, M. T., and Owe, M. (1994). Bare soil surface resistance to evaporation by vapor diffusion under semiarid conditions. Water Resour. Res. 30 (2), 181–188. doi:10.1029/93wr02747
Bai, R. Q., Lai, Y. M., Zhang, M. Y., and Yu, F. (2018). Theory and application of a novel soil freezing characteristic curve. Appl. Therm. Eng. 129, 1106–1114. doi:10.1016/j.applthermaleng.2017.10.121
Camillo, P. J., and Gurney, R. J. (1986). A resistance parameter for bare-soil evaporation models. Soil Sci. 141 (2), 95–105. doi:10.1097/00010694-198602000-00001
Chen, L., Yu, H., Li, X. X., and Ding, Z. H. (2021). Study on the effect of unilateral sand deposition on the spatial distribution and temporal evolution pattern of temperature beneath the embankment. Adv. Mater. Sci. Eng. 27, 1–14. doi:10.1155/2021/5403567
Chen, L., Yu, W. B., Han, F. L., Lu, Y., and Zhang, T. Q. (2020). Effects of desertification on permafrost environment in Qinghai-Tibetan Plateau. J. Environ. Manage. 262, 110302. doi:10.1016/j.jenvman.2020.110302
Chen, L., Yu, W. B., Yang, C. S., Yi, X., and Liu, W. B. (2014). Conductivity of aeolian sand on the Tibet Plateau based on microstructure. J. Glaciol. Geocryol. 36, 1220–1226. doi:10.7522/j.issn.1000-0240.2014.0146
Chen, L., Yu, W. B., Yi, X., Hu, D., and Liu, W. B. (2018). Numerical simulation of heat transfer of the crushed-rock interlayer embankment of Qinghai-Tibet Railway affected by aeolian sand clogging and climate change. Cold Reg. Sci. Technol. 155, 1–10. doi:10.1016/j.coldregions.2018.07.009
Cheng, G. D., and Jin, H. J. (2013). Permafrost and groundwater on the Qinghai tibet plateau and in northeast China. Hydrogeol. J. 21, 5–23. doi:10.1007/s10040-012-0927-2
Cheng, G. D., Zhao, L., Li, R., Wu, X. D., Sheng, Y., Hu, G. J., et al. (2019). Characteristic, changes and impacts of permafrost on Qinghai-Tibet Plateau. Chin. Sci. Bull. 64 (27), 2783–2795. doi:10.1360/tb-2019-0191
Hjort, J., Streletskiy, D., Doré, G., Wu, Q. B., Bjella, K., and Luoto, M. (2022). Impacts of permafrost degradation on infrastructure. Nat. Rev. Earth Environ. 3, 24–38. doi:10.1038/s43017-021-00247-8
Hu, D., Yu, W. B., Lu, Y., Chen, L., Han, F. L., and Liu, W. B. (2019). Experimental study on unfrozen water and soil matric suction of the aeolian sand sampled from Tibet Plateau. Cold Reg. Sci. Technol. 164, 102784. doi:10.1016/j.coldregions.2019.102784
Huang, Y. Z., Guo, D. X., and Zhao, X. F. (1993). The desertification in the permafrost region of Qinghai-Xizang Plateau and its influences on environment. J. Glaciol. Geocryol. 15 (1), 52–57.
Immerzeel, W. W., and Bierkens, M. F. P. (2010). Asian water towers: More on monsoons response. Science 330 (6004), 585. doi:10.1126/science.330.6004.585-a
Jia, L., Fan, C. Y., Mu, M., Chen, X., Zhong, W., Shang, J. G., et al. (2020). Studies of thermokarst and its effects on ecosystem carbon cycle in the Third Polar regions and the Arctic. J. Glaciol. Geocryol. 42, 157–169. doi:10.7522/j.issn.1000-0240.2020.0006
Li, P. Z. (2006). Study on geological environment of formation and development of desertification in north China. Xi'an, China: Northwest University. PhD Dissertation.
Lü, L. Z., Jin, H. J., Wang, S. L., Xue, X., He, R. X., and Yu, S. P. (2008). Dual influences of local environmental variables on ground temperatures on the interior-eastern qinghai-tibet plateau (II): Sand-layer and surface water bodies. J. Glaciol. Geocryol. 30 (4), 546–555. (in Chinese).
Lu, Y., Yu, W. B., Hu, D., and Liu, W. B. (2018). Experimental study on the thermal conductivity of aeolian sand from the Tibetan Plateau. Cold Reg. Sci. Technol. 146, 1–8. doi:10.1016/j.coldregions.2017.11.006
Luo, X. X., Yu, Q. H., Ma, Q. G., and Guo, L. (2020). Study on the heat and deformation characteristics of an expressway embankment with shady and sunny slopes in warm and ice-rich permafrost regions. Transp. Geotech. 24, 100390. doi:10.1016/j.trgeo.2020.100390
Ma, Q. G., Luo, X. X., Gao, J. Q., Sun, W. Y., Li, Y. D., and Lan, T. L. (2022a). Numerical evaluation for cooling performance of a composite measure on expressway embankment with shady and sunny slopes in permafrost regions. Energy 244, 123194. doi:10.1016/j.energy.2022.123194
Ma, Q. G., Luo, X. X., Lai, Y. M., Niu, F. J., and Gao, J. Q. (2018). Numerical investigation on thermal insulation layer of a tunnel in seasonally frozen regions. Appl. Therm. Eng. 138, 280–291. doi:10.1016/j.applthermaleng.2018.04.063
Ma, Q. G., Luo, X. X., Niu, F. J., Sun, W. Y., Lan, T. L., and Xia, H. X. (2022b). Numerical analysis of cooling performance of a novel structure affected by aeolian sand clogging on expressway embankment in permafrost regions. Int. J. Heat. Mass Tran. 187, 122538. doi:10.1016/j.ijheatmasstransfer.2022.122538
Mu, C. C., Shang, J. G., Zhang, T. J., Fan, C. Y., Wang, S. F., Peng, X. Q., et al. (2020). Acceleration of thaw slump during 1997–2017 in the Qilian Mountains of the northern Qinghai-Tibetan plateau. Landslides 17 (5), 1051–1062. doi:10.1007/s10346-020-01344-3
Peng, X. Q., Zhang, T. J., Frauenfeld, O. W., and Du, R. (2020). Permafrost response to land use and land cover change in the last millennium across the Northern Hemisphere. Land Degrad. Dev. 31 (14), 1823–1836. doi:10.1002/ldr.3578
Philip, J. R., and De Vries, D. A. (1957). Moisture movement in porous materials under temperature gradients. Trans. AGU. 38 (2), 222–232. doi:10.1029/tr038i002p00222
Qin, D. H., Ding, Y. H., and Wang, S. W. (2002). A study of environment change and its impacts in Western China. Earth Sci. Front. 9 (2), 321–328. doi:10.3321/j.issn:1005-2321.2002.02.009
Saito, H., Simunek, J., and Mohanty, B. P. (2006). Numerical analysis of coupled water, vapor, and heat transport in the vadose zone. Vadose zone J. 5 (2), 784–800. doi:10.2136/vzj2006.0007
Smith, S. L., O’Neill, H. B., Isaksen, K., Noetzli, J., and Romanovsky, V. E. (2022). The changing thermal state of permafrost. Nat. Rev. Earth Environ. 3, 10–23. doi:10.1038/s43017-021-00240-1
Van Genuchten, M. T. (1980). A closed-form equation for predicting the hydraulic conductivity of unsaturated soils. Soil Sci. Soc. Am. J. 44 (5), 892–898. doi:10.2136/sssaj1980.03615995004400050002x
Wang, L. Y., Wu, Q. B., and Jiang, G. L. (2020). The effect of desertification on frozen soil on the Qinghai-Tibet Plateau. Sci. Total Environ. 711, 134640. doi:10.1016/j.scitotenv.2019.134640
Wang, L. Y., Jiang, G. L., Fu, Z. T., Liu, Y. L., Gao, S. R., Zhao, H. T., et al. (2021). A study on the hydrothermal regime of aeolian sand and the underlying soil in the frozen soil zone on the Qinghai-Tibetan Plateau. Agric. For. Meteorol. 299, 108294. doi:10.1016/j.agrformet.2020.108294
Wang, S. L., Ding, Y. J., Zhao, L., and Koike, T. (2002). The influence of local factor on surface layer ground temperature in Qinghai-Tibet Plateau. Plateau Meteorol. 21 (1), 85–89. (in Chinese).
Wang, W. K., Yin, H. M., Huang, J. T., and Li, J. T. (2021). Estimation of groundwater evaporation based on lysimeter experiment and analytical solution in the Mu Us sandy land. Hydroge. Eng. Geol. 48 (4), 1–6. doi:10.16030/j.cnki.issn.100
Wang, Z. W., Wang, Q., Zhao, L., Wu, X. D., Yue, G. Y., Nan, Z. I., et al. (2016). Mapping the vegetation distribution of the permafrost zone on the Qinghai-Tibet Plateau. J. Mt. Sci. 13 (06), 1035–1046. doi:10.1007/s11629-015-3485-y
Wu, Q. B., Yu, W., and Jin, H. (2017). No protection of permafrost due to desertification on the Qinghai-Tibet Plateau. Sci. Rep. 7 (1), 1544. doi:10.1038/s41598-017-01787-0
Wu, X. D., Zhao, L., Hu, G. J., Liu, G. M., Li, W. P., and Ding, Y. J. (2018). Permafrost and land cover as controlling factors for light fraction organic matter on the southern Qinghai-Tibetan Plateau. Sci. Total Environ. 613, 1165–1174. doi:10.1016/j.scitotenv.2017.09.052
Wu, Z. H., Hu, D. G., Zhao, X., and Ye, S. P. (2006). Features of early miocene large paleolakes in the interior of the Qinghai-Tibet Plateau and their tectonic significance. Geol. Bull. China 7, 782–791. doi:10.3969/j.issn.1671-2552.2006.07.003
Xie, C. W., Liu, W. H., Wu, C. J., Yang, G. Q., Zhang, Y. X., Wang, W., et al. (2020). Environmental changes caused by the outburst of Zonag Lake and the possible outburst mode of Yanhu Lake in the Hoh Xil region. J. Glaciol. Geocryol. 42 (4), 1344–1352. doi:10.7522/j.issn.1000-0240.2019.0051
Xie, S. B., and Qu, J. J. (2013). Effect of sand sediments accumulated in sand-control projects on the thermal regime of underlying permafrost and its mechanism. J. China Railw. Soc. 35 (12), 77–82. doi:10.3969/j.issn.1001-8360.2013.12.012
Xie, S. B., Qu, J. J., Lai, Y. M., Xu, X. T., and Pang, Y. J. (2015). Key evidence of the role of desertification in protecting the underlying permafrost in the Qinghai-Tibet Plateau. Sci. Rep. 5, 15152. doi:10.1038/srep15152
Xie, S. B., Qu, J. J., Zu, R. P., Zhang, K. C., and Han, Q. J. (2012). New discoveries on the effects of desertification on the ground temperature of permafrost and its significance to the Qinghai-Tibet Plateau. Chin. Sci. Bull. 57 (8), 838–842. doi:10.1007/s11434-011-4901-5
Yang, M. X., Wang, S. L., Yao, T. D., Gou, X. H., Lu, A. X., and Guo, X. J. (2004). Desertification and its relationship with permafrost degradation in Qinghai-Xizang (Tibet) plateau. Cold Reg. Sci. Technol. 39, 47–53. doi:10.1016/j.coldregions.2004.01.002
Yao, T. D., Thompson, L., Yang, W., Yu, W. S., Gao, Y., Guo, X. J., et al. (2012). Different glacier status with atmospheric circulations in Tibetan Plateau and surroundings. Nat. Clim. Chang. 2 (9), 663–667. doi:10.1038/nclimate1580
Yao, T. D., Wu, F., Ding, L., Sun, J. M., Zhu, L. P., Piao, S. L., et al. (2015). Multispherical interactions and their effects on the Tibetan plateau’s Earth system: A review of the recent researches. Natl. Sci. Rev. 2 (4), 468–488. doi:10.1093/nsr/nwv070
You, Q. G., Xue, X., Peng, F., Dong, S. Y., and Gao, Y. H. (2017). Surface water and heat exchange comparison between alpine meadow and bare land in a permafrost region of the Tibetan Plateau. Agric. For. Meteorol. 232, 48–65. doi:10.1016/j.agrformet.2016.08.004
Zhang, C. L., Li, Q., Shen, Y. P., Zhou, N., Wang, X. S., Li, J., et al. (2018). Monitoring of aeolian desertification on the Qinghai-Tibet Plateau from the 1970s to 2015 using Landsat images. Sci. Total Environ. 619, 1648–1659. doi:10.1016/j.scitotenv.2017.10.137
Zhang, M. L., Wen, Z., Xue, K., Cheng, L. Z., and Li, D. S. (2016). A coupled model for liquid water, water vapor and heat transport of saturated-unsaturated soil in cold regions: Model formulation and verification. Environ. Earth Sci. 75, 701–719. doi:10.1007/s12665-016-5499-3
Zhang, M. L., Wen, Z., and Xue, K. (2015). Soil moisture-heat migration characteristics within the permafrost active layer in Beiluhe. J. Arid. Land Res. Environ. 29 (9), 176–181. doi:10.13448/j.cnki.jalre.2015.313
Zhang, R. H., Su, F. G., Jiang, Z. J., Gao, X. J., Guo, D. L., Ni, J., et al. (2015). An overview of projected climate and environment changes across the Tibetan Plateau in the 21st century. Chin. Sci. Bull. 60 (32), 3036–3047. doi:10.1360/n972014-01296
Zhao, J. B., Ma, Y. D., Xing, S., Yu, K. K., and Dong, Z. B. (2010). Study on moisture content in sandy layer of Tengger Desert in Zhongwei. Ningxia. Mt. Res. 28 (6), 653–659. doi:10.3969/j.issn.1008-2786.2010.06.002
Zhao, J. B., Shao, T. J., Hou, Y. L, Lü, X. H., and Dong, Z. B. (2011). Moisture content of sand Layer and its origin in a mega-dune area in the Badain Jaran Desert. J. Nat. Resour. 26 (4), 694–702. doi:10.11849/zrzyxb.2011.04.015
Zhao, J. B., Xing, S., Shao, T. J., Dong, Z. B., Yu, K. K., Yue, Y. L., et al. (2012). A study on content and balance of moisture in the southern Tengger Desert. J. Nat. Resour. 27 (3), 480–488. doi:10.11849/zrzyxb.2012.03.014
Zhao, L., Zou, D. F., Hu, G. J., Wu, T. H., Du, E. J., Liu, G. Y., et al. (2021). A synthesis dataset of permafrost thermal state for the Qinghai-Tibet (Xizang) Plateau. China. Earth Syst. Sci. Data 13 (8), 4207–4218. doi:10.5194/essd-13-4207-2021
Zhu, L. N. (1988). Study of the adherent layer on different types of ground in permafrost regions on the Qinghai-Xizang Plateau. J. Glaciol. Geocryol. 10 (1), 8–14.
Keywords: aeolian sand, permafrost, hydrothermal process, rainfall and evaporation, climate warming, Qinghai-Tibetan plateau
Citation: Lan T, Ma Q, Xia H and Luo X (2022) The hydrothermal process of aeolian sand and its thermal effect on permafrost in Qinghai-Tibetan Plateau considering rainfall and evaporation under climate warming. Front. Environ. Sci. 10:1047719. doi: 10.3389/fenvs.2022.1047719
Received: 18 September 2022; Accepted: 29 September 2022;
Published: 13 October 2022.
Edited by:
Jing Luo, Northwest Institute of Eco-Environment and Resources (CAS), ChinaReviewed by:
Shengbo Xie, Northwest Institute of Eco-Environment and Resources, (CAS), ChinaMingtang Chai, Ningxia University, China
Copyright © 2022 Lan, Ma, Xia and Luo. This is an open-access article distributed under the terms of the Creative Commons Attribution License (CC BY). The use, distribution or reproduction in other forums is permitted, provided the original author(s) and the copyright owner(s) are credited and that the original publication in this journal is cited, in accordance with accepted academic practice. No use, distribution or reproduction is permitted which does not comply with these terms.
*Correspondence: Xiaoxiao Luo, bHVveGlhb3hpYW9Ac2N1dC5lZHUuY24=