 Lan Li
 Xindi Zhang2
- 1College of Architecture Engineering, HuangHuai University, Zhumadian, China
- 2School of Energy Engineering, Huainan Vocational Technical College, Huainan, China
- 3College of Geological Engineering and Geomatics, Chang’an University, Xi’an, China
A thermokarst lake is generally defined as a lake that occupies a closed basin and is created by the massive melting of ground ice in ice-rich permafrost regions, which has a great impact on regional hydro-ecological equilibrium and permafrost-engineering infrastructure facilities. Global warming and increasing human activities have been accompanied by permafrost degradation and glacier retreat in the Qinghai–Tibet Plateau (QTP). The QTP, source of many international rivers in Asia, is known as the “Asian Water Tower.” The number and area of lakes in the QTP have increased in the past 40 years; however, lakes with areas of less than 1 km2 have been overlooked when calculating the water storage. To address the evolution of thermokarst lakes in the QTP, visual interpretation and the Modified Normalized Difference Water Index were applied to extract the water area based on Landsat data from the 1980s to 2020. The results indicate that thermokarst lake area was reduced from 932.5 km2 to 799.25 km2 from the 1980s to 1990. From 1990 to 2020, the number and area of lakes grew substantially, with the number increasing from 66506 to 120374 and the area increasing by 113.14% (932.5 km2 in 1980s and 1703.56 km2 in 2020). As heat carriers, thermokarst lakes transfer heat vertically and horizontally. The temperature of the surrounding permafrost rises as the number and area of lakes increase and when permafrost is extensively degraded. Longtime carbon stocks are also released into atmosphere during lake formation, which affects the regional carbon cycle.
Introduction
Thermokarst lakes are formed in permafrost areas due to surface subsidence and depression caused by the melting of ice-rich permafrost or the thawing of massive ice (van Everdingen, 2005; Niu et al., 2011; Streletskiy et al., 2015). Thermokarst lakes, a characteristic landscape element, are widely distributed in ice-rich permafrost in some Arctic and sub-Arctic regions such as Richards Island (Burn, 2002), northwestern Alaska (Jones et al., 2011; Farquharson et al., 2016), northeastern Siberia (Grosse et al., 2005; Bryksina and Polishchuk, 2014; Veremeeva et al., 2021), northern Eurasia (Smith et al., 2005), and the Tuktoyaktuk Peninsula (Plug et al., 2008). Yoshikawa and Hinzman (2003) found that thermokarst lakes in discontinuous permafrost have drained and shrunk during the past 50–100 years. The area of thermokarst lakes in Alaska has declined from 31% to 4% during the years 1950–2002 (Riordan et al., 2006; Ingmar et al., 2020). Veremeeva et al. (2021) observed that the area of thermokarst lakes in the Kolyma Lowland Yedoma region and northeastern Siberia exhibited an upward trend between the years 1999 and 2018, due to the influence of geomorphological and climatic factors. Polishchuk and Sharonov (2014) noted that thermokarst lakes increased by 31% during 1993–2010 in Gorny Altai. Saruulzaya et al. (2016) used Landsat imagery from 1999 to 2007 to monitor thermokarst lake changes in Mongolia, concluding that the total number of lakes increased from 347 to 420 and that the area of the lakes expanded from 36.80 km2 to 39.69 km2.
The Qinghai–Tibet Plateau (QTP), known as the Third Pole, has a permafrost area of 115.02 × 10⁴ km2, accounting for nearly 46% of its total area (Ran et al., 2020). Global warming in recent decades has been most pronounced at high altitude and has accelerated permafrost degradation (Li et al., 2012; Ke and Ding, 2017; Luo et al., 2018; Luo et al., 2019). It was estimated that the permafrost area might decline by 25% ± 1% in the case of a 2°C rise in air temperature (Guo and Wang, 2017). Scholars have demonstrated that thermokarst lakes are sensitive indicators of climate change and permafrost degradation (Kirpotin et al., 2008; Morgenstern et al., 2011; Grosse et al., 2013; Arp et al., 2018; Nitze et al., 2018). Recently, permafrost degradation at the global scale has attracted wide attention resulting from its remarkable environmental effects. Infrastructure stability, food security, water supply, and hydrological and habitat functions may be extensively influenced when a major area of permafrost becomes degraded (Streletskiy et al., 2015; Istomin and Habeck, 2016). Similarly, numerous studies have documented changes in thermokarst lakes in the QTP using geological mapping and remote sensing data combined with field surveys (Luo et al., 2022). Pan et al. (2017) suggested that supra-permafrost is distributed with a mean ratio of more than 170% of precipitation in ice-free seasons in the northeastern QTP. Luo et al. (2015) stated that in the Beiluhe River Basin, the total number and area of thermokarst lakes increased by about 534 and 4.10 km2 , respectively, between 1967 and 2010. Climate change and increased human activities are the decisive factors. Ni et al. (2021) used Landsat sensor images to extract thermokarst lakes from the Beiluhe River Basin from 2000 to 2016; the results illustrated that the area of the lakes increased year by year. Based on a high-resolution dataset, Chen et al. (2021) have determined that the number and area of thermokarst lakes in QTP were 121151 and 1730.34 km2, respectively.
Many studies have detected the number and area of lakes on the QTP with areas of over 1 km2, and thermokarst lake dynamics have been reported primarily in Beiluhe River Basin. Researchers have investigated thermokarst lakes throughout the plateau only in 2018. Therefore, we quantified changes in thermokarst lakes from the 1980s to 2020, using satellite image interpretation and object-based long-term lake detection to accurately understand changes in thermokarst lakes across the QTP. Simultaneously, comprehensive permafrost change analysis provided a better understanding of the eco-environmental effects of thermokarst lake evolution.
Study area
The QTP, located at 26°–39°47′ N and 73°19′–104°47′ E, is the world’s highest and largest plateau, averaging over 4000 m above sea level and covering an area of 250 × 104 km2. Most of the QTP is underlain by continuous permafrost, of which the largest permafrost thickness was measured to be about 128 m (Cheng et al., 2019). In the context of global warming, the annual temperature, precipitation, and soil moisture in most of the QTP have shown clear upward trends from 1980 to 2018 (Yang et al., 2019; Zhao et al., 2019). The active-layer thickness on the QTP increased in varying degrees, and the rising rate along the Qinghai–Tibet Highway was 19.5 cm/10a between 1982 and 2018 (Zhao et al., 2019). Ran et al. (2020) divided the permafrost into five categories based on permafrost temperature: very stable, stable, semi-stable, transitional, and unstable types, with areas of 0.86 km2, 9.62 km2, 38.45 km2, 42.29 km2, and 23.80 km2, respectively.
Data and methods
Data sources
Landsat TM/ETM+/OLI images with 30 m spatial resolution are readily available from the 1980s onward and can reveal long-term changes in land cover (Giardino and Harbor, 2013; Nitze et al., 2017). Landsat data were obtained from the USGS Global Visualization Viewer (http://glovis.usgs.gov/) and the Geospatial Data Cloud (http://www.gscloud.cn/). To ensure the clarity of the images, the cloud cover is usually less than 10%. The Landsat images have temporal resolutions of 16 days and cover an area of 185 km × 185 km. In this study, a total of 138 × 40 Landsat images from the 1980s to 2020 were selected. All datasets were registered to the Albers Conical Equal Area coordinate system zones 26N–40N, and elevation was referenced to WGS 1984 data.
Elevation information was downloaded from the ASTER Global Digital Elevation Model (GDEM) with 90 m spatial resolution and was extracted by the QTP boundary shapefile mask.
Climate data analysis
Long-term (1980–2020) temperature and precipitation data were available from “The spatial dataset of climate on the Tibetan Plateau,” hosted by the National Tibetan Plateau Data Center (Zou et al., 2017; http://data.tpdc.ac.cn). Annual mean temperature and precipitation data were retrieved from the Center to assess any variations in climate between the time periods used to monitor lake change. The Parameter-Elevation Regions on Independent Slopes Model (PRISM) was used to generate grid data for the source dataset (Daly et al., 1994) from the 1980s to 1990, and the interpolation model was adjusted and verified based on the site data. From 1991 to 2020, regional climate-scenario simulation data were downscaled to generate grid data using terrain-trend surface interpolation. Part of the source data comes from the simulation results of the GCM model: the Hadley Centre climate model HadCM2-SUL was adopted for the GCM model (Mitchell et al., 1995; Johns et al., 1997).
Permafrost
As the world’s largest middle-low-latitude and high-altitude permafrost region, the QTP occupies a vast area underlain by permafrost, which is estimated to be as high as 1.06 × 10⁴ km2 (Zou et al., 2017). In recent decades, permafrost on the QTP has experienced clear degradation, as indicated by increasing ground temperatures (Hu et al., 2019) and further thickening of its active layers (Zhao et al., 2019). In this study, permafrost data for the 1980s was derived from the National Cryosphere Desert Data Center (http://www.ncdc.ac.cn; Wang et al., 2017), and the permafrost dataset for 2017 was provided by the National Tibetan Plateau Data Center (http://data.tpdc.ac.cn; Zhao et al., 2020).
Thermokarst lake interpretation
Thermokarst lake extraction requires two steps: the first is to extract the water bodies of the QTP, and the second is to distinguish the thermokarst lakes from the total water bodies.
In 1977, Bartolucci et al. (1977) found that waters have strong absorption characteristics in the near infrared band. Further research has showed that in the wavelength ranges of almost all sensors, waters have weak reflectance compared with other ground objects. Especially in the near-infrared and mid-infrared bands (0.7–2.5 um), the reflectance of waters is extremely low, while that of vegetation, soil, and buildings is high (Jensen, 2004). Xu (2005) proposed the Modified Normalized Difference Water Index (MNDWI), shown in Formula 1, which can easily distinguish between shadow and waters, to solve the problem of shadow elimination in water extraction:
where Green is the green band and MIR is the middle-infrared band.
Even when rivers and small streams are manually removed, thermokarst lakes are not easy to distinguish from other types of lakes. Compared with tectonic lakes, thermokarst lakes are usually smaller, forming active lakes and ponds with areas of typically less than 0.5 km2 (Luo et al., 2015). In this study, we identified thermokarst lakes as those lakes distributed in permafrost areas and not directly connected with rivers. To ensure the accuracy of the lake extraction, we checked the lakes one by one after the mechanical interpretation.
Results and discussion
Thermokarst lake dynamics
It can be seen from Table 1 and Figures 1–4 that thermokarst lakes in the QTP showed an increasing trend overall and were accompanied by fluctuant decreases. The number of lakes can be assessed in two stages: 1) from the 1980s to 2010, the number of lakes continued to increase to the maximum value of 123053; and 2) from 2010 to 2020, they showed a slight downward trend. Lake area can be summarized in two cycles and four stages. In the first cycle, from the 1980s to 1990, the lakes’ area decreased from 932.5 km2 to 799.25 km2, and in 2010, the lakes’ area had risen to a peak 1871.94 km2, more than doubling that of the 1980s. In the second cycle, from 2010 to 2015, the lakes’ area declined to 1511.12 km2 and then increased to 1703.56 km2 in 2020.
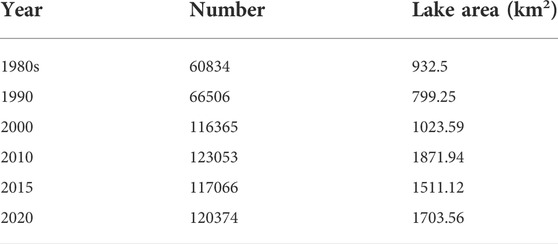
TABLE 1. Dynamics of thermokarst lakes in the QTP, 1980s–2020.
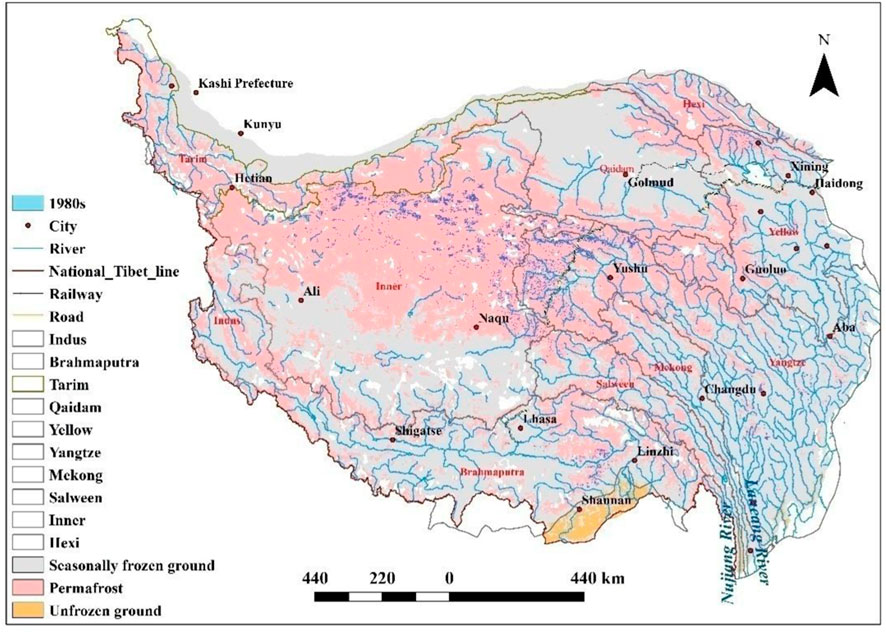
FIGURE 1. Thermokarst lakes in 1980s.

FIGURE 2. Thermokarst lakes in 2000.
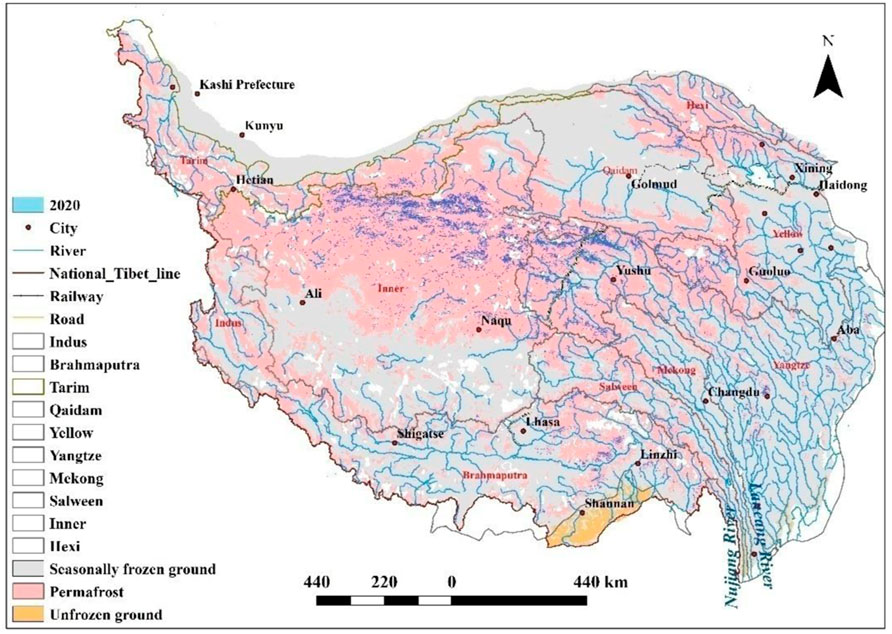
FIGURE 3. Thermokarst lakes in 2020.
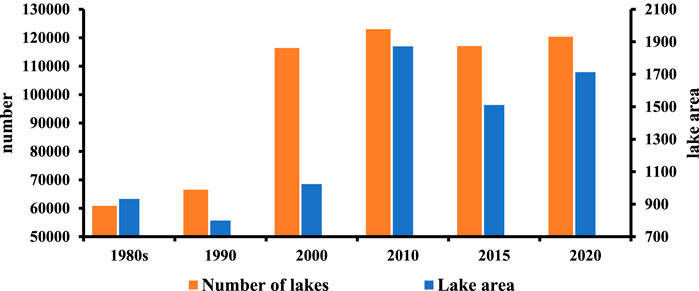
FIGURE 4. Number and area of thermokarst lakes in QTP, 1980s–2020.
Great spatial changes have taken place, mainly in the Inner Basin, which includes the Hoh Xil region and the Beiluhe River Basin. These changes are primarily because continuous permafrost is widely distributed in the Inner Basin, and the terrain is relatively flat, which provides a better geological condition for the development of thermokarst lakes.
As the aforementioned results suggest, previous research about thermokarst lake dynamics was insufficient. Luo et al. (2015) found that the number and area of thermokarst lakes in the Beilu River Basin on the QTP increased by 534 and 4.10 km2, respectively, between 1969 and 2010. Using Sentinel-2A data from 2018, Chen et al. (2021) found the total thermokarst lake area to be 1730.34 km2 and the number to be 121151. Zhang et al. (2018) observed that the number and area of lakes on the QTP have clearly increased in recent decades. In addition, Song et al. (2013) used multi-mission satellite data and found that lake level in the QTP showed an obvious upward trend (0.2–0.6 m/a) between 2003 and 2009. In conclusion, the results of this research are highly consistent with those of previous studies.
Natural influence of thermokarst lakes
The QTP is one of the ecologically sensitive areas in which the strongest climate warming has been observed in recent decades, in both warm and cold seasons. In the QTP, the annual mean temperature increase during the period 1961–2018 was over 2°C for both seasons, and a moist climate was also noticed. The warming climate is likely connected to permafrost degradation in the QTP.
Annual mean temperature has showed a fluctuating and increasing trend since the 1980s (Figure 5). The annual mean temperatures in the 1980s and in 1990 were −0.41°C and −0.89°C, respectively. There was a downward trend in the annual mean temperature from the 1980s to 1990, which exactly corresponded to the decrease in lake area during this time. Since 1990, the annual mean temperature has increased in most regions. As Figure 5 shows, from 1980 to 2020 there was only a slight decline in the southeast region of the QTP, as in the city of Shannan. The maximum and minimum temperature-change rates are 0.08°C/yr and −0.02°C/yr, respectively, and the Inner Basin, which has the most extensive distribution of thermokarst lakes, has a temperature change rate of 0.03–0.04°C/yr.
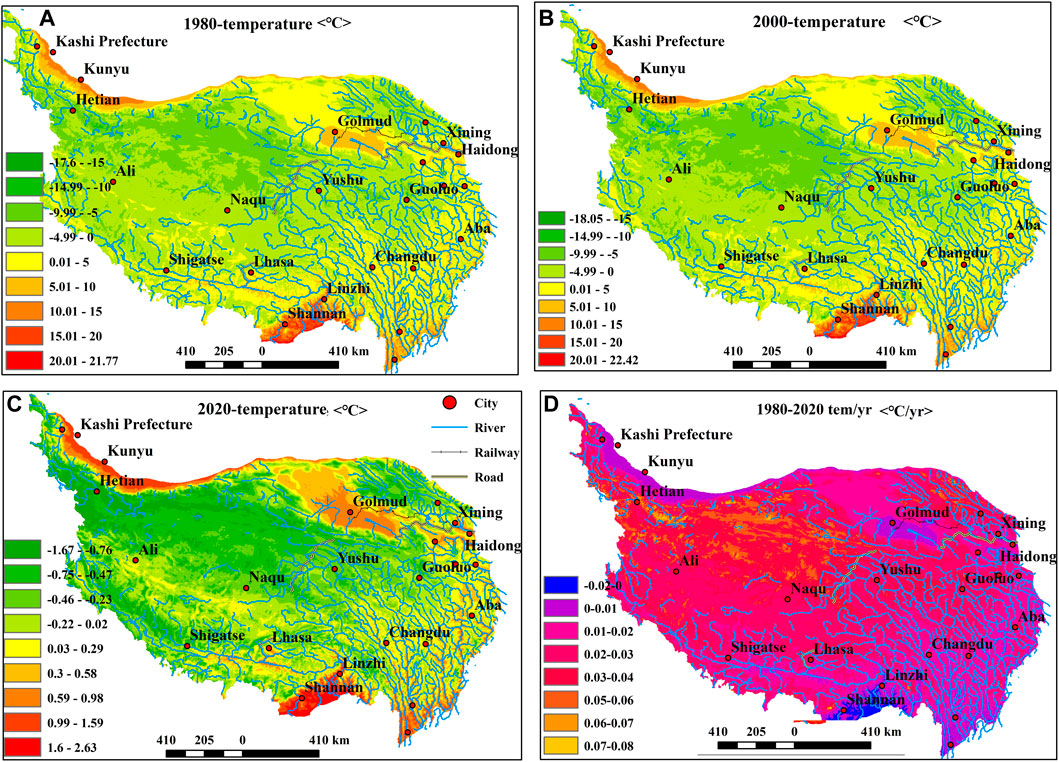
FIGURE 5. Annual mean temperature, 1980–2020 (A–C), and annual mean temperature change rate (D) of the QTP.
The annual mean precipitation in the QTP in 1980 and 1990 was 480.36 mm and 493.43 mm, respectively, with the minimum and maximum precipitation observed in Qaidam Basin and Brahmaputra Basin (Figure 6). Due to long-term heavy rainfall, the annual mean precipitation reached 683.78 mm in July 2010, so the number and area of lakes increased sharply in this year. The annual mean precipitation decreased from 2015 to 2020, compared with 2010, but increased compared with the 1980s. Figure 6 demonstrates that the annual mean precipitation in most areas of the QTP shows an increasing trend, with increasing rates of 0.1–8 mm/yr. The growth rates of the Inner Basin and the Qaidam Basin can reach 2–3 mm/yr (Figure 6).
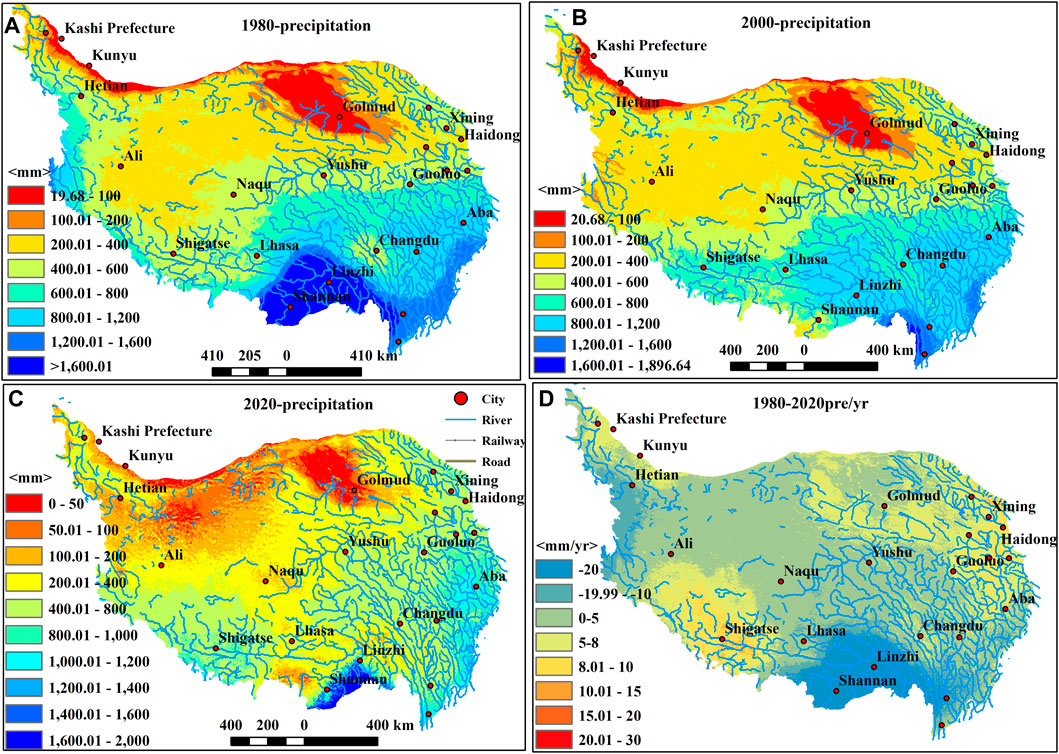
FIGURE 6. Annual mean precipitation, 1980–2020 (A–C), and annual mean precipitation change rate (D) of the QTP.
Permafrost thaw
The QTP has the largest permafrost distribution in the middle latitude worldwide. In the context of global warming, the permafrost of the QTP has undergone extensive degradation, which is significant to regional climatic, hydrological, and ecological processes. According to measured and simulated predictions in the 1980s (Nan et al., 2005; Cheng et al., 2011), the permafrost area and seasonally frozen ground area of the QTP were 127.19 km2 and 126.06 km2, respectively. As predicted by Ran et al. (2018) in 2017, the areas of permafrost, seasonally frozen ground, and unfrozen ground were 105.6 km2, 145.22 km2, and 2.93 km2, respectively. From the 1980s to 2017, the permafrost area shrank by 21.59 km2. According to the relationship between permafrost change and thermokarst lakes from the 1980s to 2017 (Figure 7), thermokarst lakes are densely distributed in the change area.
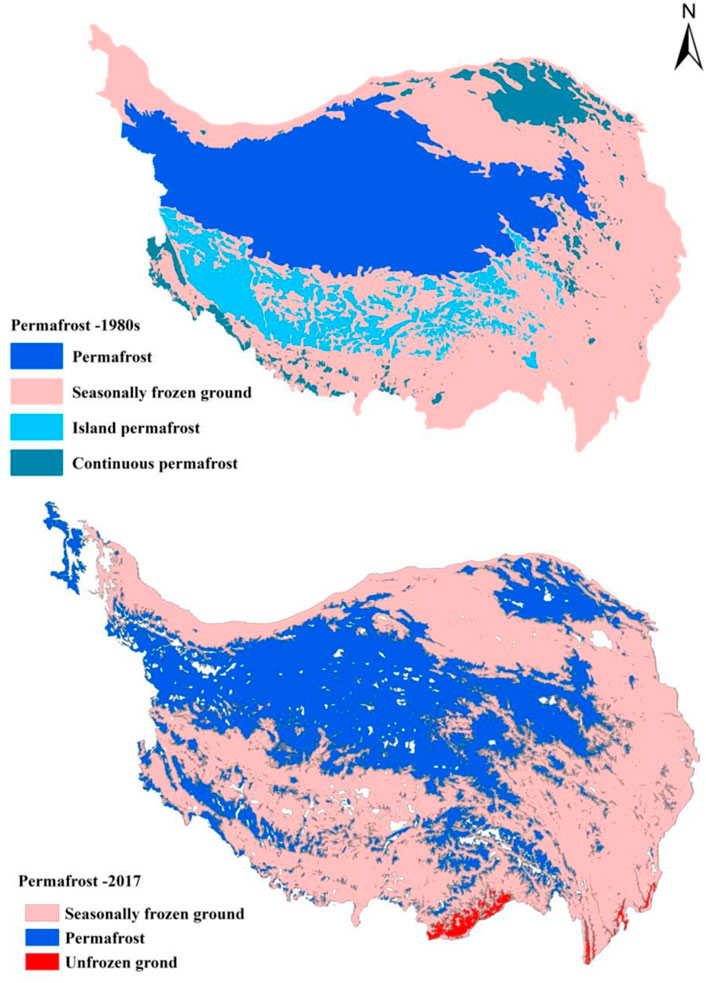
FIGURE 7. Permafrost change of the QTP from the 1980s to 2017.
Soil
According to the American soil classification system “Keys to Soil Taxonomy” (2010 version), the permafrost area of the QTP is dominated by Gelisols and Inceptisols, which account for 34% and 28% of the total area, respectively (Li et al., 2015). According to the Chinese Soil Taxonomy, alpine desert soil and alpine meadow soil are widely distributed in the QTP, accounting for 71.61% and 4.74% of the total soil, respectively. Alpine desert soil is sandy and has a thin soil layer, large sand content, rough particles, fast water seepage rate, and good ventilation performance. As Figure 8 shows, thermokarst lakes are mainly distributed in alpine desert soil. The strata in the permafrost area of the QTP are mainly mudstone and sandstone, and the surface water is not easily converted to groundwater.

FIGURE 8. Annual mean precipitation of the QTP, 1980–2020.
Conclusion
In this work, thermokarst lakes in the QTP between the 1980s and 2020 were systematically studied, and the QTP’s annual mean temperature, annual mean precipitation, permafrost area, and soil were also analyzed in detail. The main conclusions are as follows:
1) Based on the series of Landsat data for the QTP, the number of thermokarst lakes has increased from 60834 in the 1980s to 120374 in 2020, and their area has increased from 932.5 km2 in the 1980s to 1703.56 km2.
2) We analyzed the influence of natural factors on the lakes’ area change, finding that the substantial decrease in lake area in 1990 was due to an annual mean temperature decrease since 1980, and that the increase in lake number and area since 1990 has been due to a corresponding temperature rise.
Our results contribute to an explicit understanding of thermokarst lake dynamics and support the accurate calculation of the water volume of the “Chinese Water Tower.” We showed that natural factors play an important role in thermokarst lake development. Meanwhile, human factors, which are not easy to estimate quantitatively, also have considerable impacts.
Data availability statement
The original contributions presented in the study are included in the article/Supplementary Material; further inquiries can be directed to the corresponding author.
Author contributions
LL and WN coordinated and supervised the paper. LL and XZ contributed to data analysis, research framework design, and writing the first drafts. XL and SZ prepared data for all figures. XL, SZ, and ZY revised the manuscript. All co-authors contributed to the interpretation of the results and to the text.
Funding
This work was supported by the Second Tibetan Plateau Scientific Expedition Program (2019QZKK0905).
Acknowledgments
We grateful to the editor and reviewers for their constructive suggestions and comments.
Conflict of interest
The authors declare that the research was conducted in the absence of any commercial or financial relationships that could be construed as a potential conflict of interest.
Publisher’s note
All claims expressed in this article are solely those of the authors and do not necessarily represent those of their affiliated organizations, or those of the publisher, the editors, and the reviewers. Any product that may be evaluated in this article, or claim that may be made by its manufacturer, is not guaranteed or endorsed by the publisher.
References
Arp, C., Jones, B., Engram, M., Alexeev, V. A., Cai, L., Parsekian, A., et al. (2018). Contrasting lake ice responses to winter climate indicate future variability and trends on the Alaskan Arctic Coastal Plain. Environ. Res. Lett. 13 (12), 125001. doi:10.1088/1748-9326/aae994
Bartolucci, L., Robinson, B., and Silva, L. (1977). Field measurements of the spectral response of natural waters. Photogrammetric Eng. remote Sens. 43 (5), 595–598.
Bryksina, N., and Polishchuk, Y. (2014). Analysis of changes in the number of themokarst lakes in permafrost of Western Siberia on the basis of satellite images. Kriosf. Zemli 2, 100–105.
Burn, C. (2002). Tundra lakes and permafrost, Richards Island, Western arctic coast, Canada. Can. J. Earth Sci. 39, 1281–1298. doi:10.1139/e02-035
Chen, X., Mu, C., Jia, L., Li, Z., Fan, C., Mei, M., et al. (2021). High-resolution dataset of thermokarst lakes on the Qinghai–Tibet Pleteau. Copernicus GmbH. doi:10.5194/essd-2020-378
Cheng, G., Li, S., Nan, Z., and Tong, B. (2011). Map of permafrost on the Qinghai–Tibet plateau (1:3000000) (1983-1996). China: National Tibetan Plateau Data Center. doi:10.11888/geocry.tpdc.270014.CSTR
Cheng, G., Wu, Q., Li, X., Sheng, Y., Hu, G., Wu, X., et al. (2019). Characteristic, changes and impacts of permafrost on Qinghai–Tibet Plateau. Chin. Sci. Bull. 64 (27), 2783–2795. doi:10.1360/TB-2019-0191
Daly, C., Neilson, P., and Phillips, D. (1994). A statistical-topographic model for mapping climatological precipitation over mountainous terrain. J. Appl. Meteor. 33, 140–158. doi:10.1175/1520-0450(1994)033<0140:astmfm>2.0.co;2
Farquharson, L., Walter Anthony, K., Bigelow, N., Edwards, M., and Grosse, G. (2016). Facies analysis of yedoma thermokarst lakes on the northern Seward Peninsula, Alaska. Sediment. Geol. 340, 25–37. doi:10.1016/j.sedgeo.2016.01.002
Giardino, J. R., and Harbor, J. M. (2013). Glacial and periglacial geomorphology. Cambridge: Academic Press, 325–353.
Grosse, G., Jones, B., and Arp, C. (2013). 8.21 thermokarst lakes, drainage, and drained basins. Treatise Geomorphol. 8, 325–353. doi:10.1016/B978-0-12-374739-6.00216-5
Grosse, G., Schirrmeister, L., Kunitsky, V., and Hubberten, H. (2005). The use of CORONA images in remote sensing of periglacial geomorphology: An illustration from the NE-siberian coast. Permafr. Periglac. Process. 16, 163–172. doi:10.1002/ppp.509
Guo, D., and Wang, H. (2017). Permafrost degradation and associated ground settlement estimation under 2°C global warming. Clim. Dyn. 49 (7), 2569–2583. doi:10.1007/s00382-016-3469-9
Hu, G., Zhao, L., Li, R., Wu, X., Wu, T., Xie, C., et al. (2019). Variations in soil temperature from 1980 to 2015 in permafrost regions on the Qinghai–Tibet an Plateau based on observed and reanalysis products. Geoderma 337, 893–905. doi:10.1016/j.geoderma.2018.10.044
Ingmar, N., Sarah, W., Duguay, C. R., Jones, B. M., and Grosse, G. (2020). The catastrophic thermokarst lake drainage events of 2018 in northwestern Alaska: fast-forward into the future. Cryosphere 14, 4279–4297. doi:10.5194/TC-14-4279-2020
Istomin, K., and Habeck, J. (2016). Permafrost and indigenous land use in the northern Urals: Komi and Nenets reindeer husbandry. Polar Sci. 10 (3), 278–287. doi:10.1016/j.polar.2016.07.002
Jensen, J. R. (2004). Introductory digital image processing: a remote sensing perspective. New Jersey: Prentice-Hall.
Johns, T., Carnell, R., Crossley, J., Gregory, J. M., Mitchell, J. F. B., Senior, C. A., et al. (1997). The second Hadley Centre coupled ocean-atmosphere GCM: model description, spinup and validation. Clim. Dyn. 13, 103–134. doi:10.1007/s003820050155
Jones, B., Grosse, G., Arp, C. D., Jones, M. C., Walter Anthony, K. M., and Romanovsky, V. E. (2011). Modern thermokarst lake dynamics in the continuous permafrost zone, northern seward Peninsula, Alaska. J. Geophys. Res. 116, G00M03. doi:10.1029/2011JG001666
Ke, L., Ding, X., Li, W., and Qiu, B. (2017). Remote sensing of glacier change in the central Qinghai–Tibet Plateau and the relationship with changing climate. Remote Sens. 9 (2), 114. doi:10.3390/rs9020114
Kirpotin, S., Polishchuk, Yu., and Bryksina, N. (2008). Dynamics of areas of thermokarst lakes in perennial and non-perennial cryolithic zones of West Siberia under global warming condition. Vestn. Tomsk. Gos. Univ. 311, 185–189.
Li, J., Sheng, Y., Wu, J., Wang, J., Zhang, B., Ye, B., et al. (2012). Modeling regional and local-scale permafrost distribution in Qinghai–Tibet Plateau using equivalent-elevation method. Chin. Geogr. Sci. 22 (3), 278–287. doi:10.1007/s11769-012-0520-6
Li, W., Zhao, L., Fang, H., and Zhao, Y. (2015). Distribution of soils and landform relationships in the permafrost regions of Qinghai-Xizang (Tibetan) Plateau. Chin. Sci. Bull. 60, 2216–2226. doi:10.1360/N972014-01206
Luo, D., Jin, H., and Bense, V. F. (2019). Ground surface temperature and the detection of permafrost in the rugged topography on NE Qinghai–Tibet Plateau. Geoderma 333, 57–68. doi:10.1016/j.geoderma.2018.07.011
Luo, J., Niu, F., Lin, Z. j., Liu, M. h., and Yin, G. a. (2018). Variations in the northern permafrost boundary over the last four decades in the Xidatan region, Qinghai–Tibet Plateau. J. Mt. Sci. 15 (04), 765–778. doi:10.1007/s11629-017-4731-2
Luo, J., Niu, F., Lin, Z., Liu, M., Yin, G., and Gao, Z. (2022). Abrupt increase in thermokarst lakes on the central Tibetan Plateau over the last 50 years. Catena 217, 106497. doi:10.1016/j.catena.2022.106497
Luo, J., Niu, F., Lin, Z., Liu, M., and Yin, G. (2015). thermokarst lake changes between 1969 and 2010 in the Beilu River basin, Qinghai–Tibet Plateau, China. Sci. Bull. (Beijing). 60 (5), 556–564. doi:10.1007/s11434-015-0730-2
Mitchell, J., Johns, T., Gregory, J., and Tett, S. F. B. (1995). Climate response to increasing levels of greenhouse gases and sulphate aerosols. Nature 376, 501–504. doi:10.1038/376501a0
Morgenstern, A., Grosse, G., Gunther, F., Fedorova, I., and Schirrmeister, L. (2011). Spatial analyses of thermokarst lakes and basins in Yedoma landscapes of the Lena Delta. Cryosphere 5 (4), 849–867. doi:10.5194/tc-5-849-2011
Nan, Z., Li, S., and Cheng, G. (2005). Prediction of permafrost distribution on the Qinghai–Tibet Plateau in the next 50 and 100 years. Sci. China Ser. D-Earth. Sci. 48, 797–804. doi:10.1360/03yd0258
Ni, Z., Lu, X., and Huang, G. (2021). Impact of meteorological factors on thermokarst lake changes in the Beilu River basin, Qinghai–Tibet Plateau, China (2000–2016). Water 13 (11), 1605. doi:10.3390/w13111605
Nitze, I., Grosse, G., Jones, B., Arp, C., Ulrich, M., Fedorov, A., et al. (2017). Landsat-based trend analysis of lake dynamics across northern permafrost regions. Remote Sens. (Basel). 9 (7), 640. doi:10.3390/rs9070640
Nitze, I., Grosse, G., Jones, B. M., Romanovsky, V. E., and Boike, J. (2018). Remote sensing quantifies widespread abundance of permafrost region disturbances across the Arctic and Subarctic. Nat. Commun. 9 (1), 5423. doi:10.1038/s41467-018-07663-3
Niu, F., Lin, Z., Liu, H., and Lu, J. (2011). Characteristics of thermokarst lakes and their influence on permafrost in Qinghai–Tibet Plateau. Geomorphology 132 (3-4), 222–233. doi:10.1016/j.geomorph.2011.05.011
Pan, X., Yu, Q., You, Y., Chun, K. P., Shi, X., and Li, Y. (2017). Contribution of supra-permafrost discharge to thermokarst lake water balances on the northeastern Qinghai–Tibet Plateau. J. Hydrology 555, 621–630. doi:10.1016/j.jhydrol.2017.10.046
Plug, L., Walls, C., and Scott, B. (2008). Tundra Lake Changes from 1978 to 2001 on the Tuktoyaktuk Peninsula, western Canadian arctic. Geophys. Res. Lett. 35 (3), 035022. doi:10.1029/2007GL032303
Polishchuk, Y. M., and Sharonov, D. S. (2014). Studying the dynamics of thermokarst lake fields in altai mountain valleys. Izv. Atmos. Ocean. Phys. 49, 1074–1077. doi:10.1134/s000143381309020x
Ran, Y., Li, X., and Cheng, G. (2018). Climate warming over the past half century has led to thermal degradation of permafrost on the Qinghai–Tibet plateau. Cryosphere 12 (2), 595–608. doi:10.5194/tc-12-595-2018
Ran, Y., Li, X., Wu, X., Jin, H., Wu, Q., Che, J., et al. (2020). Mapping the permafrost stability on the Tibetan Plateau for 2005–2015. Sci. China Earth Sci. 64 (1), 62–79. doi:10.1007/s11430-020-9685-3
Riordan, B., Verbyla, D., and McGuire, A. D. (2006). Shrinking ponds in subarctic Alaska based on 1950-2002 remotely sensed images. J. Geophys. Res. 111 (G4), 1–11. doi:10.1029/2005JG000150
Saruulzaya, A., Ishikawa, M., and Jambaljav, Y. (2016). Thermokarst lake changes in the Southern fringe of Siberian permafrost region in Mongolia using Corona, Landsat, and ALOS Satellite imagery from 1962 to 2007. Adv. Remote Sens. 05 (4), 215–231. doi:10.4236/ars.2016.54018
Smith, L., Sheng, Y., MacDonald, G. M., and Hinzman, L. D. (2005). Disappearing arctic lakes. Science 308 (5727), 1429. doi:10.1126/science.1108142
Song, C., Huang, B., and Ke, L. (2013). Modeling and analysis of lake water storage changes on the Tibetan Plateau using multi-mission satellite data. Remote Sens. Environ. 135 (1), 25–35. doi:10.1016/j.rse.2013.03.013
Streletskiy, D., Anisimov, O., and Vasiliev, A. (2015). “Permafrost degradation,” in Snow and ice-related hazards, risks and disasters (Netherland: Elsevier), 303–344. doi:10.1016/B978-0-12-394849-6.00010-X
Van Everdingen, R. O. (2005). Multi-language glossary of permafrost and related ground-ice terms. Canada: Arctic Inst. of North America University of Calgary.
Veremeeva, A., Nitze, I., Gunther, F., Grosse, G., and Rivkina, E. (2021). Geomorphological and climatic drivers of thermokarst lake area increase trend (1999-2018) in the Kolyma Lowland Yedoma region, north-eastern Siberia. Remote Sens. 13 (2), 178. doi:10.3390/rs13020178
Wang, C., Wu, D., Kong, Y., and Shi, H. (2017). Changes of soil thermal and hydraulic regimes in northern hemisphere permafrost regions over the 21st century. Arct. Antarct. Alp. Res. 49 (2), 305–319. doi:10.1657/aaar0016-026
Xu, H. (2005). A study on information Extraction of water body with the Modified Normalized Difference water index (MNDWI). J. Remote Sens. 9 (5), 589–596.
Yang, M., Wang, X., Pang, G., and Liu, Z. (2019). The Tibetan plateau cryosphere: observations and model simulations for current status and recent changes. Earth. Sci. Rev. 190, 353–369. doi:10.1016/j.earscirev.2018.12.018
Yoshikawa, K., and Hinzman, L. D. (2003). Shrinking thermokarstpondsand groundwater dynamics in discontinuous permafrost nearCouncil, Alaska. Permafr. Periglac. Process. 14 (2), 151–160. doi:10.1002/ppp.451
Zhang, Z., Jiang, L., Liu, L., Sun, Y., and Wang, H. (2018). Annual glacier-wide mass balance (2000-2016) of the interior Tibetan Plateau reconstructed from MODIS albedo products. Remote Sens. 10 (7), 1031. doi:10.3390/rs10071031
Zhao, L., Hu, G., Zou, D., Wu, X., Ma, L., Sun, Z., et al. (2019). Permafrost changes and its effects on hydrological processes on Qinghai–Tibet Plateau. Bull. Chin. Acad. Sci. 11, 1233–1246. doi:10.16418/j.issn.1000-3045.2019.11.006
Zhao, L., Zou, D., Hu, G., Du, E., Pang, Q., Xiao, Y., et al. (2020). Changing climate and the permafrost environment on the Qinghai–Tibet (Xizang) plateau. Permafr. Periglac. Process. 31, 396–405. doi:10.1002/ppp.2056
Keywords: thermokarst lakes, permafrost, MNDWI, Qinghai–Tibet Plateau, climate warming
Citation: Li L, Zhang X, Li X, Zhao S, Ni W and Yang Z (2022) Thermokarst lake changes over the past 40 years in the Qinghai–Tibet Plateau, China. Front. Environ. Sci. 10:1051086. doi: 10.3389/fenvs.2022.1051086
Received: 22 September 2022; Accepted: 10 October 2022;
Published: 28 October 2022.
Edited by:
Jing Luo, Northwest Institute of Eco-Environment and Resources (CAS), ChinaReviewed by:
Longwei Yang, China Coal Technology Engineering Group, ChinaHuini Wang, Wuhan Institute of Technology, China
Guoan Yin, Northwest Institute of Eco-Environment and Resources (CAS), China
Copyright © 2022 Li, Zhang, Li, Zhao, Ni and Yang. This is an open-access article distributed under the terms of the Creative Commons Attribution License (CC BY). The use, distribution or reproduction in other forums is permitted, provided the original author(s) and the copyright owner(s) are credited and that the original publication in this journal is cited, in accordance with accepted academic practice. No use, distribution or reproduction is permitted which does not comply with these terms.
*Correspondence: Lan Li, MTUwNTMwMjA5MUBxcS5jb20=