 Jun Hou1,2
 Denghua Yan1
 Tianling Qin1*Shanshan Liu1Sheng Yan1,2Jian Li1,3Sintayehu A. Abebe1,4Xuchao Cao5
- 1State Key Laboratory of Simulation and Regulation of Water Cycle in River Basin, China Institute of Water Resources and Hydropower Research, Beijing, China
- 2School of Water Conservancy and Engineering, Zhengzhou University, Zhengzhou, China
- 3School of Environment, Liaoning University, Shenyang, China
- 4Hydraulic and Water Resources Engineering Department, Debre Markos University Institute of Technology, Debre Markos, Ethiopia
- 5Baoding Water Conservancy and Hydropower Surveying and Designing Institute, Baoding, China
Our aim in this research was to detect historical and future water yield coefficient evolution and attribution. Based on the calibrated and validated water yield coefficient model in the Yiluo River Basin, the coefficient for the years 2000–2020 was simulated, along with the future projection for 2030–2050 under four Shared Socioeconomic Pathways (SSP126, SSP245, SSP370, and SSP585). The spatio-temporal evolution of historical and future water yield coefficients was then analyzed. Moreover, the geographical detector model was used to detect the impacts of climate, land use, and terrain factors on the water yield coefficient. The results showed that the water yield coefficient increased by 8.53% from 2000 to 2020, with the coefficient of farmland increasing by 10.47% and that of forestland decreasing by 8.93%. The coefficient was highest under the SSP370 scenario and the lowest under the SSP585 scenario in projections for 2030–2050. Compared to 2000–2020, the coefficients of the two scenarios increased by 12.2% and 2.0%, respectively. Consequently, under the SSP370 and SSP585 scenarios, the coefficient of farmland increased by 13.2% and 2.7%, and that of the forestland decreased by 0.9% and 14.6%, respectively. Driving factors detection indicated that land use types had the strongest explanatory power affecting the water yield coefficient; the explanatory value reached 26.5% in 2000–2020 and will exceed 29.5% in 2030–2050. In addition, the interaction between any two factors was stronger than a single factor. This research provides scientific support for the precise management of watershed and water-land resources.
1 Introduction
The water yield coefficient is an indicator of the capacity of regional water yield, which refers to the proportion of water yield to precipitation. The water yield coefficient has changed under the dual impacts of climatic variation and human activity, profoundly influencing the development and utilization of available water resources (Liu et al., 2016; Schwärzel et al., 2020; Gbohoui et al., 2021). Climate variation, accompanied by temperature increments and extreme precipitation, have fundamentally affected the state of water resources (Capo et al., 2018; Li and Wang, 2021; Ouyang, 2021). Additionally, human activity has greatly changed the properties of water yield and consumption through underlying surface construction (Hu et al., 2021; Li et al., 2022a; Xu et al., 2022). In the context of climate warming and intensified human activity, it is critical to analyze the spatio-temporal evolution of the water yield coefficient and identify driving factors in development of watershed and water-land resources.
Scholars worldwide have conducted extensive studies assessing historical water yield capacity (Li H. et al., 2021; Guo et al., 2021; Li et al., 2022b; Zhou et al., 2022). Hydrological modeling is the principal approach in quantitative simulation of regional water yield. Hydrological models, such as the Soil and Water Assessment Tool (SWAT) (Ayivi and Jha, 2018; Chiang et al., 2019), MIKE European Hydrological System (MIKE SHE) (Wang et al., 2013; Zheng et al., 2020), and the Integrated Valuation of Ecosystem Services and Tradeoffs (InVEST) model (Yang X. et al., 2021; Jin et al., 2022), have been used for this purpose. Yang et al. (2019) evaluated water yield based on the SWAT model and pointed out that the annual water yield decreased by 38.48% in the Yanhe Basin due to the implementation of the Grain for Green Project. Pei et al. (2022)adopted the InVEST model and noted that the annual water yield had an increasing trend of 1.96 mm/a (p < 0.1) in the Agro-pastoral ecotone of Northern China from 2000 to 2019. Moreover, historical water yield coefficient evaluation has been conducted in recent years. Shi et al. (2018)analyzed spatio-temporal variation of the water yield coefficient based on gross water resources and reported that the coefficient was between 0.03 and 0.58 in the Huang-Huai-Hai River Basin from 1961 to 2011. Li et al. (2017) employed the Budyko framework and proposed that vegetation restoration significantly reduced the water yield coefficient during the growing season in the Yangtze River source region, with a decrease from 0.37 ± 0.07 in 1982–1999 to 0.24 ± 0.07 in 2000–2012.
For identification of attributes related to water yield capacity, common methods include scenario analysis (Yang J. et al., 2021; Shao and Yang, 2021), model analysis (Sun et al., 2019; Wang X. et al., 2022), and statistical analysis (Rizzo et al., 2020; Deng et al., 2022). Dai and Wang (2020) studied the influence of climate factors and land use factors on water yield using the geographic detector model and reported that precipitation and evapotranspiration were the primary driving factors in the Hengduan Mountain region. Zhang et al. (2021) used the automatic linear and geographically weighted regression models to evaluate the interactive effects of diverse driving factors on water yield and observed that annual precipitation and urban expansion were the dominant factors in the Yangtze River Basin during 2000–2015. However, the evolution and attribution of the future water yield coefficient remain unclear.
The Yiluo River Basin is the largest tributary below the Sanmenxia Dam of the Yellow River Basin, which is mainly composed of the Yi River and the Luo River. The study area plays an important role in flood control, water resource allocation, and water-sediment regulation in the lower reaches of the Yellow River Basin (Wang et al., 2019; Hou et al., 2021). To prevent soil erosion and improve the ecological environment, large-scale water and soil conservation work has been carried out in the basin. Along with climate variation and urban expansion, water yield and consumption properties have been altered, which has greatly impacted the watershed water yield coefficient. Our aim was to analyze the spatio-temporal variation of historical and future water yield coefficients and identify driving factors affecting water yield in the Yiluo River Basin.
2 Data and methods
2.1 Study area
The Yiluo River Basin (109°43′-113°10′ E and 33°39′-34°54′ N) flows through more than 20 counties of the Henan and Shaanxi provinces; it covers an area of 18.9 thousand km2 (Figure 1). The Yiluo River is a typical “twins river,” where the north bank is the Luo River and the south bank is the Yi River; the Yiluo River results from the convergence of the two rivers. The trunk stream (Luo River) originates in the Shaanxi Province and has a total length of 446.9 km and an area of 11.9 thousand km2. The main tributary (Yi River) originates in Henan and has a total length of 264.8 km and an area of 6.1 thousand km2. The Yiluo River Basin is in the continental monsoon climate zone. The climate is hot and rainy in summer due to the warm and humid flow of the Pacific Ocean and cold and rainless in winter due to cold air from the north. The annual average temperature is 13.1°C, and the annual average precipitation is 688.1 mm. The precipitation occurs mainly from May to October, accounting for more than 80% of the annual precipitation. During 2000–2020, the watershed land use categories primarily consisted of cultivated land and woodland, with proportions exceeding 38.2% and 48.3%, respectively, while grassland, urban land, and bodies of water accounted for a relatively small proportion.
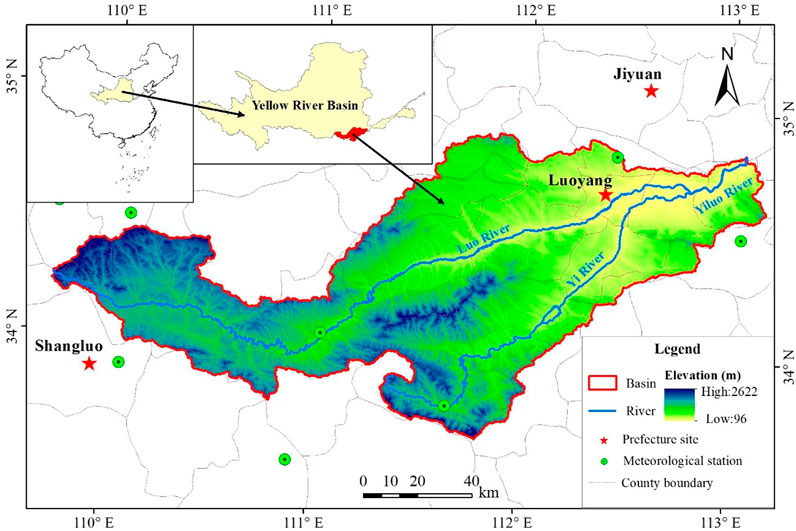
FIGURE 1. Location, main cities, meteorological stations, major rivers, basin boundary, and elevation of the Yiluo River Basin.
2.2 Data
The data collected in this research included historical climate data, underlying surface data, water resource data, and future climate data (Table 1). Historical climate data were obtained from the China Meteorological Data Service Center. Underlying surface data included land use, the digital elevation model (DEM), and soil and bedrock depth. Land use data were derived from the National Geomatics Center of China. The DEM was obtained from the Geospatial Data Cloud, and the slope and aspect were generated from the DEM. Soil data was obtained from the National Cryosphere Desert Data Center; bedrock depth was obtained from an article in Scientific Data (Yan et al., 2020). Water resource data included soil water content and the amount of gross water resources; soil water content was derived from the United States Geological Survey. The data on gross water resources were obtained from the Water Resources Bulletin.

TABLE 1. Study data description and sources.
Future precipitation and temperature data used in the future climate model was provided by Coupled Model Intercomparison Project Phase 6 (CMIP6). The authentic data considered the Representative Concentration Pathways (RCPs) and the Shared Socioeconomic Pathways (SSPs), which confront the challenges of future climate variation more comprehensively. Fifteen models of CMIP6 (Table 2) were selected to decrease uncertainty in the future climate model data. The scenarios SSP126, SSP245, SSP370, and SSP585 were considered in this study. The equidistant cumulative distribution function (EDCDF) method was used for downscaling correction (Li et al., 2010; Piao et al., 2021), and historical climate data were used for correction and verification of the CMIP6 data.
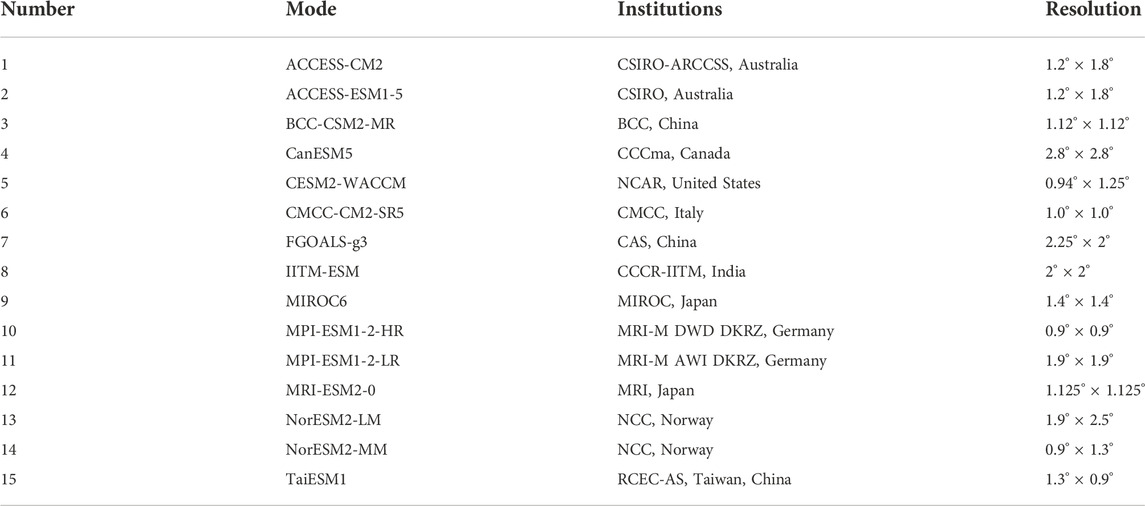
TABLE 2. Global climate models selected for this study.
2.3 Methods
The research workflow of this study included model simulation, trend analysis, and attribution identification (Figure 2). First, based on the water yield coefficient calculation model, the watershed water yield coefficients for 2000–2020 and 2030–2050 were simulated. Next, the temporal and spatial variations of the historical and future water yield coefficients in the basin were analyzed. Finally, the impacts of different driving factors on the basin’s historical and future water yield coefficients were identified based on the geographical detector model.
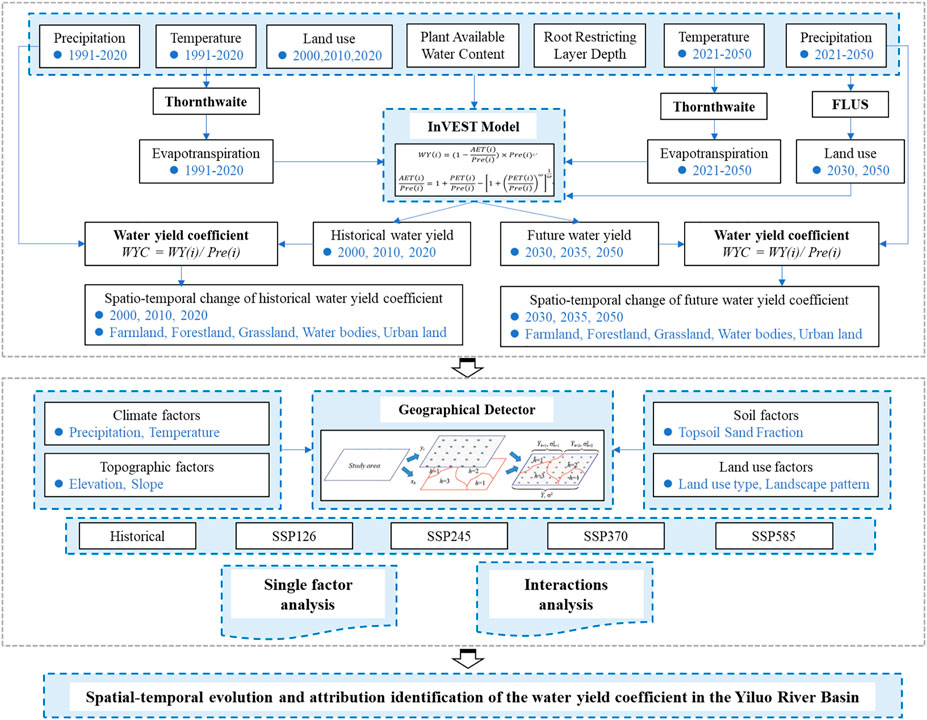
FIGURE 2. Research workflow.
2.3.1 Calculation of the water yield coefficient
The water yield coefficient refers to the proportion of regional water yield to precipitation. The methods are described as follows:
where
where:
where
where
2.3.2 Future land use simulation
In this study, the future land use simulation (FLUS) model was applied to simulate the future land use distribution in 2030 and 2050. First, the model employed the neural network algorithm to obtain the suitability probability between the land use types and their driving factors. Second, the Markov model was used to calculate the pixel number of each land use type in the prediction year. Last, the land use types were allocated to each pixel on the strength of a roulette selection method (Liu X. et al., 2017; Liang et al., 2018). Based on the land use data in 2010, the land use in 2020 was simulated. Then, the actual data in 2020 was used to verify the simulation result. On this basis, the calibrated and verified model was used to simulate future land use in 2030 and 2050 by adjusting the input parameters.
2.3.3 Geographical detector
A geographical detector is a new statistical method to detect spatial differentiation and reveal its driving factors. The model includes single-factor detection, interaction detection, risk detection, and ecological detection (Wang et al., 2016; Wang and Xu, 2017). This study used primarily single-factor and interaction detection. Single-factor detection is used to determine the explanatory power of the driving factor X on the variable Y. The q value measures the explanatory power, and a higher q value indicates a better explanatory power of X on Y. Interaction detection determines the explanatory power of the combined effect of two driving factors, X, on the variable Y. In this study, the geographical detector method was applied to identify the impacts of precipitation (X1), temperature (X2), elevation (X3), slope (X4), land use types (X5), Shannon’s diversity index (SHDI) of landscape pattern (X6), and topsoil sand fraction (X7) on water yield coefficient (Y).
3 Results
3.1 Spatio-temporal evolution of the historical water yield coefficient
The relative error between the volume of simulated water yield and the amount of gross water resources was within 5% in the Yiluo River Basin during 2000–2020 (Table 3), indicating that the model has good simulation capability and is useful for subsequent simulation and prediction. Further, the model for water yield coefficient calculation was used to obtain the water yield coefficient of the basin for 2000–2020 (Figure 3). We found an annual average water yield coefficient of 0.23 in 2000–2020, with spatial distribution higher in the east and lower in the west. The water yield coefficient in the most recent 20 years has shown an increase of 8.53%. Within this time span, the coefficient increased by 26.75% in 2000–2010 and decreased by 14.38% in 2010–2020 (Figure 3A–C). In terms of different land use types, the water yield coefficient of urban land was the highest (0.67), followed by farmland (0.26), grassland (0.20), and woodland (0.15). Bodies of water had the lowest water yield coefficient. During the study period, the water yield coefficients of woodland and grassland decreased by 8.93% and 1.12%, respectively. The coefficients of cultivated land, urban land, and bodies of water increased by 10.47%, 3.24%, and 2.85%, respectively (Figure 3D).
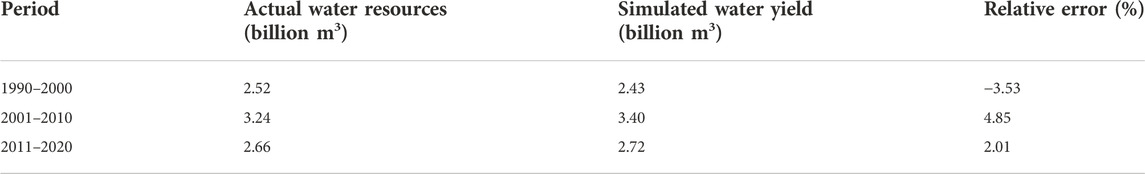
TABLE 3. Water yield results verification.
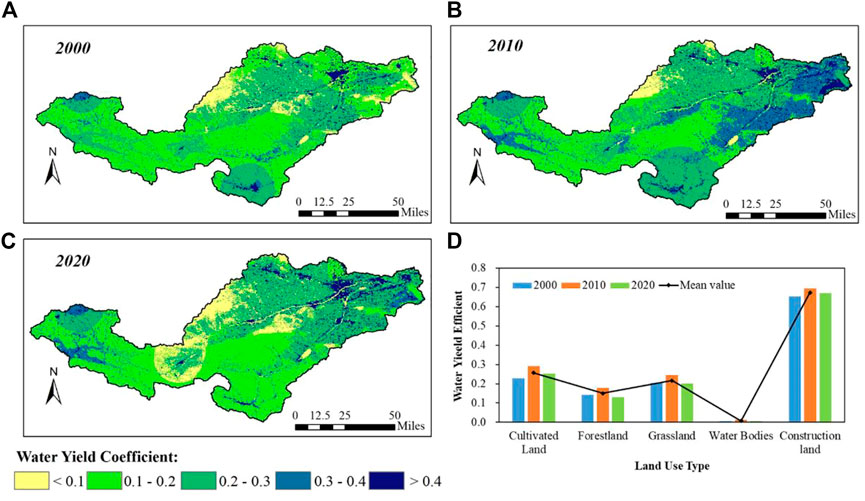
FIGURE 3. Water yield coefficient of the Yiluo River Basin during 2000–2020. (A–C) Water yield coefficients of 2000, 2010, and 2020, respectively. (D) Water yield coefficients of different land use types.
Spatially, the trend in variation of the water yield coefficient in the Yiluo River Basin showed obvious spatial heterogeneity (Figure 4). During 2000–2020, the water yield coefficients in 57.93% of the regions were increasing. Approximately 41.7% of the regions showed decreasing trends. The trends were distributed mainly in the middle reaches of the Yiluo River Basin (Figure 4C). During the 20-year span, the water coefficients were mostly increasing in 2000–2010 (Figure 4A), and then decreasing in 2010–2020 (Figure 4B). In addition, the area proportion of water yield coefficient variation in different land types was calculated. During 2000–2020, the coefficients of cultivated land, grassland, and bodies of water had increasing trends that accounted for 82.4%, 60.8%, and 96.2% of those land types, respectively; in contrast, the coefficients of woodland and urban land showed primarily decreasing trends that occurred in 66.8% and 59.9% of those land types, respectively (Figure 4D).
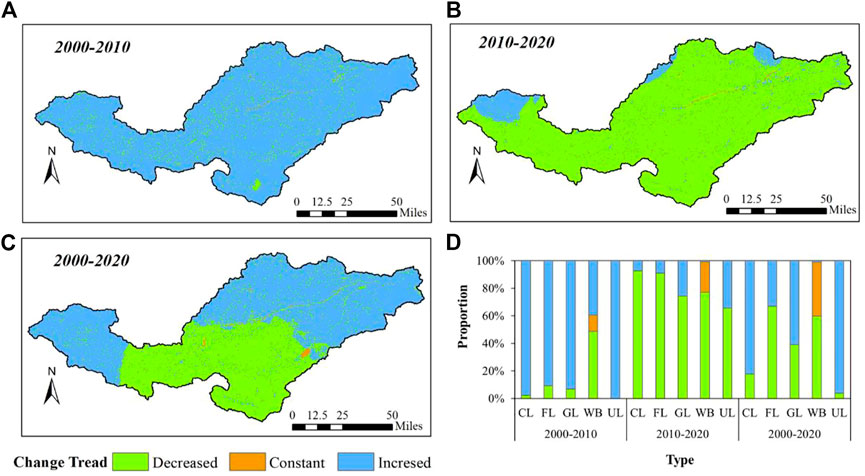
FIGURE 4. Spatio-temporal variation of the water yield coefficient in the Yiluo River Basin during 2000–2020. (A–C) Trends in change of the water yield coefficient in 2000–2010, 2010–2020, and 2000–2020, respectively. (D) Area proportion of the water yield coefficient variation in different land use types. CL, FL, GL, WB, and UL indicate cultivated land, forestland, grassland, water body, and urban land, respectively.
3.2 Spatio-temporal evolution of the future water yield coefficient
The Kappa coefficient was 0.87 between the simulated and actual land use in 2020, which indicated that the FLUS model provided a reliable simulation of the spatial distribution of land use in the Yiluo River Basin. The land use in 2030 and 2050 was then simulated. By using predicted future climate data, the water yield coefficient model was applied to simulate the spatial distribution of the water yield coefficient during 2030–2050. We used the SSP126, SSP245, SSP370, and SSP585 scenarios (Figure 5). The results indicated that the water yield coefficient of the Yiluo River Basin in 2030–2050 had spatial distribution that was higher in the east and lower in the west, therefore similar to that of the historical period. The multi-year average water yield coefficient was highest under the SSP370 scenario (Figure 5G–I) and lowest under the SSP585 scenario (Figure 5J–L). Compared with the historical periods, the coefficients of the two scenarios increased by 12.2% and 2.0%, respectively. In 2030–2050, the water yield coefficient increased by 4.9% under the SSP126 scenario (Figure 5A–C). The water yield coefficient decreased by 0.4% and 3.2% under the SSP245 (Figure 5D–F) and SSP585 scenarios and continuously increased by 8.1% under the SSP370 scenario.
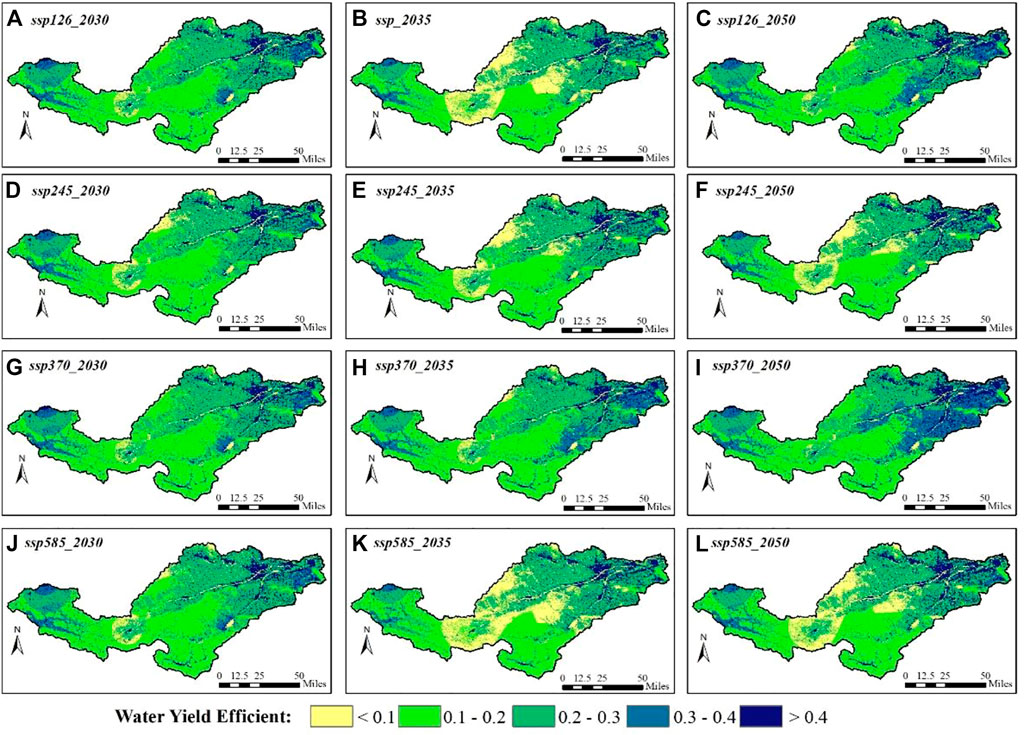
FIGURE 5. Water yield coefficient of the Yiluo River Basin in 2030–2050. (A–L) Coefficients for 2030, 2035, and 2050 under the SSP126, SSP245, SSP370, and SSP585 scenarios, respectively.
Considering different land use types, the multi-year average water yield coefficient was highest under the SSP370 scenario and lowest under the SSP585 scenario in 2030–2050 (Figure 6). Compared with 2000–2020, the water yield coefficients of cultivated land and forestland changed the most. Under the SSP370 and SSP585 scenarios, the coefficients of cultivated land increased by 13.2% and 2.7%, respectively. Similarly, the coefficients of forestland decreased by 0.9% and 14.6%, respectively. The coefficients of grassland, urban land, and bodies of water changed slightly. During the study period, the water yield coefficients of different land use types showed a primarily increasing trend under the SSP126 and SSP370 scenarios. The coefficient of forestland showed the greatest change under the SSP126 scenario, with an increase of 2.6%. Similarly, cultivated land showed the greatest change under the SSP370 scenario, with an increase of 7.1%. The water yield coefficients of different land use types showed primarily decreasing trends under the SSP245 and SSP585 scenarios, and the coefficients of forestland with the greatest change showed decreases of 11.1% and 8.2%, respectively.
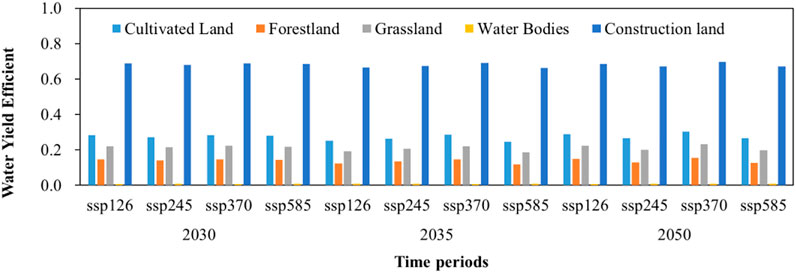
FIGURE 6. Water yield coefficients of different land use types in 2030, 2035, and 2050 under the SSP126, SSP245, SSP370, and SSP585 scenarios.
3.3 Detection of driving factors of the water yield coefficient
The impacts of precipitation, temperature, elevation, slope, land use, SHDI, and topsoil sand fraction on the water yield coefficient in the Yiluo River Basin were analyzed based on the geographical detector model. Single-factor detection results showed that the land use types in the Yiluo River Basin had the strongest explanatory power on the water yield coefficient (Figure 7). The q value reached 26.5% in 2000–2020 and is projected to exceed 29.5% in 2030–2050. After land use type, the factors with greatest impact were elevation, slope, precipitation, and temperature, which had q values between 5% and 25% in the historical and future periods. The q values of the topsoil sand fraction and the SHDI were less than 5%.
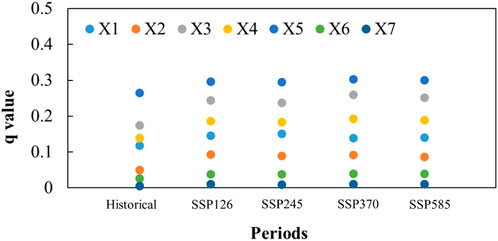
FIGURE 7. Summary of q values for each driving factor assessed for effects on water yield coefficients. X1, X2, X3, X4, X5, X6, and X7 indicate precipitation, temperature, elevation, slope, land use type, Shannon’s diversity index, and topsoil sand fraction, respectively.
Based on the interactive detection module of the geographical detector model, the interaction of each driving factor with the water yield coefficient in the Yiluo River Basin was analyzed (Figure 8). The results show that the interaction between different driving factors presented mainly bilinear and nonlinear enhancements. These enhancements indicate that the interaction between any two factors was stronger than a single-factor effect on the water yield coefficient. The interactions of the land use types with other driving factors were the strongest. Explanatory values of 27%–35% in 2000–2020 (Figure 8A) and 30–44% in 2030–2050 were obtained under the SSP126 (Figure 8B), SSP245 (Figure 8C), SSP370 (Figure 8D), and SSP585 (Figure 8E) scenarios. The results indicated that interaction between land use and other driving factors had enhanced influence on the spatial variation of the water yield coefficient in the Yiluo River Basin. Precipitation, temperature, elevation, slope, and the interaction between these driving factors with other factors had additional impact, with explanatory value of more than 8%.
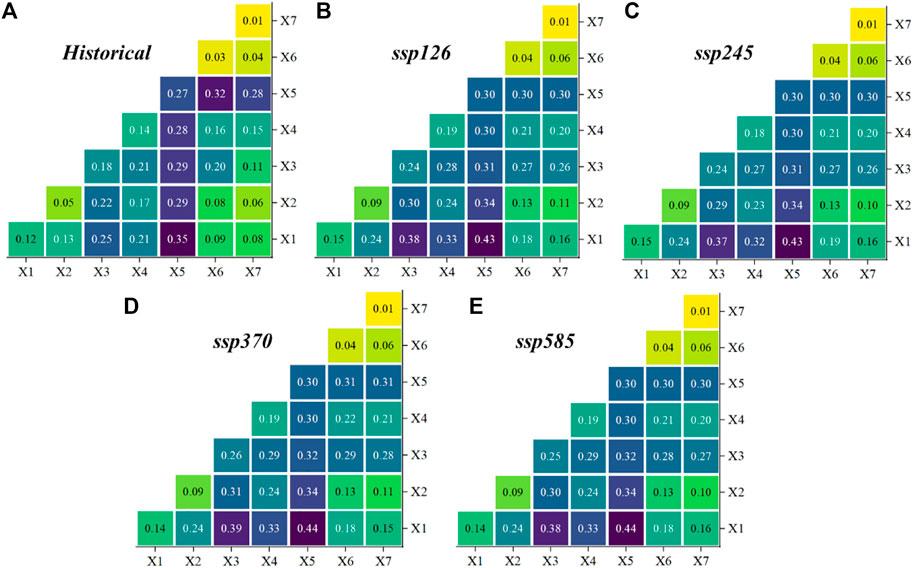
FIGURE 8. Detection of interaction among different driving factors. X1, X2, X3, X4, X5, X6, and X7 indicate precipitation, temperature, elevation, slope, land use type, Shannon’s diversity index, and topsoil sand fraction, respectively. (A–E) Historical and future periods under the SSP126, SSP245, SSP370, and SSP585 scenarios, respectively.
4 Discussion
4.1 Influence of climate factors on the water yield coefficient
The explanatory values of the precipitation and temperature factors on the water yield coefficient were 11.9% and 5.1%, respectively, in 2000–2020, and accounted for 14.0%–15.1% and 8.7%–9.4%, respectively, in projections for 2030–2050. Moreover, the effects of interaction between climate factors on the water yield coefficient were stronger than the effects of a single factor. These results were consistent with previous studies (Fang et al., 2021; Wang X. et al., 2022). According to the definition of the water yield coefficient, precipitation intensity affects the water yield coefficient directly. The watershed precipitation increased by 3.4% in 2000–2020, and is projected to increase by 5.8%–8.5% in 2030–2050 compared with the historical period. The precipitation variation tendency was consistent with the trend in change of the water yield coefficient. Simultaneously, rising temperature resulted in precipitation being increasingly allocated to evapotranspiration rather than water yield (Liu L. et al., 2017; Ouyang, 2021). From 2000 to 2020, the average annual temperature of the basin increased by 3.2%, and the actual evapotranspiration increased by 1.3%. Compared with the historical period, the temperature is projected to increase by 4.4%–8.6%, and the evapotranspiration to increase by 4.7%–5.8% in 2030–2050. In addition, climate warming has led to an increased frequency of extreme weather events in the Yiluo River Basin, and changed the precipitation regimes, which further exacerbated the trend in change of the water yield coefficient (Tian et al., 2018; Xu et al., 2020; Yu et al., 2022).
4.2 Influence of land use factors on the water yield coefficient
Land use types had the strongest explanatory power affecting the water yield coefficient in the Yiluo River Basin; the q value reached 26.5% in 2000–2020 and the value is projected to exceed 29.5% in 2030–2050. Moreover, the interaction between land use types and other driving factors resulted in enhanced influence on water yield coefficient spatial variation. The results were consistent with previous studies (Gao et al., 2020; Yu et al., 2020; Liu et al., 2022). In the historical period, the population and Gross Domestic Product (GDP) of the basin increased by 76% and 269%, respectively. With economic development and population growth, urban land area increased by 86%. In the future, the urban land area will continue to expand, with a projected increase of 41% between 2020 and 2050. The expansion of urban land will primarily involve conversion from cultivated land. In the lower reaches of the Luo River, the expansion of urban land was associated with a large amount of impervious area, resulting in a decrease in infiltration and an increase in water yield (Zang et al., 2019; Yang Y. et al., 2021). The Grain for Green Project implementation in 1999 and increasing public awareness of the need to protect forest resources led to an increase of 0.39% in woodland area from 2000 to 2020. Compared with 2020, further increase in forestland area is projected, with a forecast of approximately 1% increase in 2050. Forestland area has increased mainly in the middle reaches of the Yi River. With the increase of forest area, canopy interception of moisture and evapotranspiration has increased, resulting in decreased water yield. In this study, the landscape pattern index SHDI had weak explanatory power in affecting the water yield coefficient (the q value was less than 5%), which may be due to the large size of the calculated raster (Xu et al., 2019; Zong et al., 2020).
4.3 Effects of topography and soil factors on the water yield coefficient
The q value of the elevation and slope factors on the water yield coefficient in the historical and future periods was 15%–30%, and the q value of the topsoil sand fraction factor was less than 5%. The regional elevation and slope jointly determined the land use and vegetation types, which are closely related to the capacity for water yield and consumption (Gao et al., 2021; He et al., 2022). The upper reaches of the Yiluo River Basin are mountainous, with large slopes, and the primary land utilization type is woodland. The lower reaches are plains with gentle terrain, and the main land use types are cultivated and urban. The spatial distribution of elevation and slope was consistent with the water yield coefficient. The topsoil sand fraction determined the soil category and texture, which affects infiltration rate. In this study, the topsoil sand fraction factor had a weak explanatory power in affecting the water yield coefficient, which may be due to the extended time scale (Qi et al., 2020; Li J. et al., 2021).
5 Conclusion
Our research focused on the Yiluo River Basin and trends in spatial and temporal variation of the historical and future water yield coefficients were analyzed. We also assessed the influence of climate, topography, land use, and soil composition on the water yield coefficient. Our main conclusions are:
(1) The annual average water yield coefficient of the Yiluo River Basin is 0.23, which has increased by 8.53% in the last 20 years. Compared with the historical period, the coefficient is projected to increase by 2.0–12.2% from 2030 to 2050.
(2) During the study period, the water yield coefficients of farmland and forestland changed the most. The coefficient of farmland increased by 10.47% and that of the forestland decreased by 8.93% from 2000 to 2020. Compared with the historical period, the water yield coefficient of farmland is projected to increase by 2.7–13.2% and that of the forestland projected to decrease by 0.9%–14.6% in 2030–2050.
(3) Based on our model, increasing precipitation (10.6%–13.4%) and urban expansion (163%) from 2000 to 2050, are, and will continue to be, the immediate causes of increased water yield coefficients in the Yiluo River Basin. At the same time, the rate of increase of the water yield coefficient will be inhibited by rising temperature (5.6%–9.9%). Increased water consumption caused by forest construction (4.1%) was one of the main reasons for decrease in water yield capacity in the upper reaches of the Yi River.
(4) Future studies are needed to analyze dynamic mutual feeding mechanisms of water and land resources in greater depth.
Data availability statement
The raw data supporting the conclusion of this article will be made available by the authors, without undue reservation.
Author contributions
All the authors contributed to the completion of this article. JH conducted the original draft preparation. DY and TQ reviewed and edited the article. SL designed the structure of the manuscript. SY, JL, and SA edited and polished the manuscript. XC provided assistance in model building and data processing. All authors have read and agreed to the published version of the manuscript.
Funding
This research was supported by the National Science Fund Project (52130907 and 51725905) and Five Major Excellent Talent Programs of IWHR (WR0199A012021).
Acknowledgments
We acknowledge the China Meteorological Data Service Center for providing the basic meteorological data. Moreover, we would like to thank the reviewers for their constructive and detailed comments.
Conflict of interest
The authors declare that the research was conducted in the absence of any commercial or financial relationships that could be construed as a potential conflict of interest.
Publisher’s note
All claims expressed in this article are solely those of the authors and do not necessarily represent those of their affiliated organizations, or those of the publisher, the editors, and the reviewers. Any product that may be evaluated in this article, or claim that may be made by its manufacturer, is not guaranteed or endorsed by the publisher.
References
Ayivi, F., and Jha, M. K. (2018). Estimation of water balance and water yield in the Reedy Fork-Buffalo Creek Watershed in North Carolina using SWAT. Int. Soil Water Conservation Res. 6, 203–213. doi:10.1016/j.iswcr.2018.03.007
Capon, S. J., Leigh, C., Hadwen, W. L., George, A., McMahon, J. M., Linke, S., et al. (2018). Transforming environmental water management to adapt to a changing climate. Front. Environ. Sci. 6, 80. doi:10.3389/fenvs.2018.00080
Chiang, L. C., Chuang, Y. T., and Han, C. C. (2019). Integrating landscape metrics and hydrologic modeling to assess the impact of natural disturbances on ecohydrological processes in the chenyulan watershed, taiwan. Int. J. Environ. Res. Public Health 16, 266. doi:10.3390/ijerph16020266
Dai, E., and Wang, Y. (2020). Attribution analysis for water yield service based on the geographical detector method: A case study of the hengduan mountain region. J. Geogr. Sci. 30, 1005–1020. doi:10.1007/s11442-020-1767-y
Deng, L., Li, Y., Cao, Z., Hao, R., Wang, Z., Zou, J., et al. (2022). Revealing impacts of human activities and natural factors on dynamic changes of relationships among ecosystem services: A case study in the huang-huai-hai plain, China. Int. J. Environ. Res. Public Health 19, 10230. doi:10.3390/ijerph191610230
Fang, L., Wang, L., Chen, W., Sun, J., Cao, Q., Wang, S., et al. (2021). Identifying the impacts of natural and human factors on ecosystem service in the Yangtze and Yellow River Basins. J. Clean. Prod. 314, 127995. doi:10.1016/j.jclepro.2021.127995
Gao, J., Jiang, Y., and Anker, Y. (2021). Contribution analysis on spatial tradeoff/synergy of Karst soil conservation and water retention for various geomorphological types: Geographical detector application. Ecol. Indic. 125, 107470. doi:10.1016/j.ecolind.2021.107470
Gao, J., Jiang, Y., Wang, H., and Zuo, L. (2020). Identification of dominant factors affecting soil erosion and water yield within ecological red line areas. Remote Sens. (Basel). 12, 399. doi:10.3390/rs12030399
Gbohoui, Y. P., Paturel, J. E., Fowe, T., Mounirou, L. A., Yonaba, R., Karambiri, H., et al. (2021). Impacts of climate and environmental changes on water resources: A multi-scale study based on nakanbé nested watersheds in west african sahel. J. Hydrology Regional Stud. 35, 100828. doi:10.1016/j.ejrh.2021.100828
Guo, M., Ma, S., Wang, L., and Lin, C. (2021). Impacts of future climate change and different management scenarios on water-related ecosystem services: A case study in the jianghuai ecological economic zone, China. Ecol. Indic. 127, 107732. doi:10.1016/j.ecolind.2021.107732
He, J., Zhao, Y., and Wen, C. (2022). Spatiotemporal variation and driving factors of water supply services in the three gorges reservoir area of China based on supply-demand balance. Water 14, 2271. doi:10.3390/w14142271
Hou, J., Qin, T., Liu, S., Wang, J., Dong, B., Yan, S., et al. (2021). Analysis and prediction of ecosystem service values based on land use/cover change in the Yiluo river basin. Sustainability 13, 6432. doi:10.3390/su13116432
Hu, J., Wu, Y., Wang, L., Sun, P., Zhao, F., Jin, Z., et al. (2021). Impacts of land-use conversions on the water cycle in a typical watershed in the southern Chinese Loess Plateau. J. Hydrol. X. 593, 125741. doi:10.1016/j.jhydrol.2020.125741
Jin, T., Yan, L., Wang, S., and Gong, J. (2022). Spatiotemporal variation in ecological risk on water yield service via land-use and climate change simulations: A case study of the ziwuling mountainous region, China. Front. Environ. Sci. 10, 908057. doi:10.3389/fenvs.2022.908057
Li, H., Liu, L., Koppa, A., Shan, B., Liu, X., Li, X., et al. (2021a). Vegetation greening concurs with increases in dry season water yield over the Upper Brahmaputra River basin. J. Hydrol. X. 603, 126981. doi:10.1016/j.jhydrol.2021.126981
Li, H., Sheffield, J., and Wood, E. F. (2010). Bias correction of monthly precipitation and temperature fields from Intergovernmental Panel on Climate Change AR4 models using equidistant quantile matching. J. Geophys. Res. 115, D10101. doi:10.1029/2009jd012882
Li, J., Chen, X., Kurban, A., Van de Voorde, T., De Maeyer, P., and Zhang, C. (2021b). Coupled SSPs-RCPs scenarios to project the future dynamic variations of water-soil-carbon-biodiversity services in Central Asia. Ecol. Indic. 129, 107936. doi:10.1016/j.ecolind.2021.107936
Li, J., Liu, D., Wang, T., Li, Y., Wang, S., Yang, Y., et al. (2017). Grassland restoration reduces water yield in the headstream region of Yangtze River. Sci. Rep. 7, 2162. doi:10.1038/s41598-017-02413-9
Li, Y., Chen, P., Niu, Y., Liang, Y., and Wei, T. (2022b). Dynamics and attributions of ecosystem water yields in China from 2001 to 2020. Ecol. Indic. 143, 109373. doi:10.1016/j.ecolind.2022.109373
Li, Y., Deng, J., Zang, C., Kong, M., and Zhao, J. (2022a). Spatial and temporal evolution characteristics of water resources in the Hanjiang River Basin of China over 50 years under a changing environment. Front. Environ. Sci. 10, 968693. doi:10.3389/fenvs.2022.968693
Li, Z., and Wang, S. (2021). Water yield variability and response to climate change across Canada. Hydrological Sci. J. 66, 1–16. doi:10.1080/02626667.2021.1925122
Liang, X., Liu, X., Li, X., Chen, Y., Tian, H., and Yao, Y. (2018). Delineating multi-scenario urban growth boundaries with a CA-based FLUS model and morphological method. Landsc. Urban Plan. 177, 47–63. doi:10.1016/j.landurbplan.2018.04.016
Liu, H., Xiao, W., Li, Q., Tian, Y., and Zhu, J. (2022). Spatio-temporal change of multiple ecosystem services and their driving factors: A case study in beijing, China. Forests 13, 260. doi:10.3390/f13020260
Liu, L., Xu, H., Wang, Y., and Jiang, T. (2017b). Impacts of 1.5 and 2 °C global warming on water availability and extreme hydrological events in Yiluo and Beijiang River catchments in China. Clim. Change 145, 145–158. doi:10.1007/s10584-017-2072-3
Liu, X., Liang, X., Li, X., Xu, X., Ou, J., Chen, Y., et al. (2017a). A future land use simulation model (FLUS) for simulating multiple land use scenarios by coupling human and natural effects. Landsc. Urban Plan. 168, 94–116. doi:10.1016/j.landurbplan.2017.09.019
Liu, Y., Xiao, J., Ju, W., Xu, K., Zhou, Y., and Zhao, Y. (2016). Recent trends in vegetation greenness in China significantly altered annual evapotranspiration and water yield. Environ. Res. Lett. 11, 094010. doi:10.1088/1748-9326/11/9/094010
Ouyang, Y. (2021). New insights on evapotranspiration and water yield in crop and forest lands under changing climate. J. Hydrol. X. 603, 127192. doi:10.1016/j.jhydrol.2021.127192
Pei, H., Liu, M., Shen, Y., Xu, K., Zhang, H., Li, Y., et al. (2022). Quantifying impacts of climate dynamics and land-use changes on water yield service in the agro-pastoral ecotone of northern China. Sci. Total Environ. 809, 151153. doi:10.1016/j.scitotenv.2021.151153
Piao, J., Chen, W., Wang, L., and Chen, S. (2021). Future projections of precipitation, surface temperatures and drought events over the monsoon transitional zone in China from bias-corrected CMIP6 models. Int. J. Climatol. 42 (2), 1203–1219. doi:10.1002/joc.7297
Qi, Y., Lian, X., Wang, H., Zhang, J., and Yang, R. (2020). Dynamic mechanism between human activities and ecosystem services: A case study of qinghai lake watershed, China. Ecol. Indic. 117, 106528. doi:10.1016/j.ecolind.2020.106528
Redhead, J. W., Stratford, C., Sharps, K., Jones, L., Ziv, G., Clarke, D., et al. (2016). Empirical validation of the InVEST water yield ecosystem service model at a national scale. Sci. Total Environ. 569-570, 1418–1426. doi:10.1016/j.scitotenv.2016.06.227
Rizzo, R., Garcia, A. S., Vilela, V. M. d. F. N., Ballester, M. V. R., Neill, C., Victoria, D. C., et al. (2020). Land use changes in Southeastern Amazon and trends in rainfall and water yield of the Xingu River during 1976–2015. Clim. Change 162 (3), 1419–1436. doi:10.1007/s10584-020-02736-z
Schwarzel, K., Zhang, L., Montanarella, L., Wang, Y., and Sun, G. (2020). How afforestation affects the water cycle in drylands: A process-based comparative analysis. Glob. Chang. Biol. 26 (2), 944–959. doi:10.1111/gcb.14875
Shao, S., and Yang, Y. (2021). Effects of precipitation and land use/cover changes on the spatio-temporal distribution of the water yield in the Huang-Huai-Hai basin, China. Environ. Earth Sci. 80, 812. doi:10.1007/s12665-021-10119-5
Shi, X., Qin, T., Yan, D., Sun, R., Cao, S., Jing, L., et al. (2018). Analysis of the changes in the water yield coefficient over the past 50 Years in the huang-huai-Hai River basin, China. Adv. Meteorology 2018, 1–20. doi:10.1155/2018/6302853
Sun, F., Mejia, A., and Che, Y. (2019). Disentangling the contributions of climate and basin characteristics to water yield across spatial and temporal scales in the Yangtze river basin: A combined hydrological model and boosted regression approach. Water Resour. manage. 33 (10), 3449–3468. doi:10.1007/s11269-019-02310-y
Tian, W., Liu, X., Liu, C., and Bai, P. (2018). Investigation and simulations of changes in the relationship of precipitation-runoff in drought years. J. Hydrol. X. 565, 95–105. doi:10.1016/j.jhydrol.2018.08.015
Wang, H., Wang, W. J., Wang, L., Ma, S., Liu, Z., Zhang, W., et al. (2022b). Impacts of future climate and land use/cover changes on water-related ecosystem services in changbai mountains, northeast China. Front. Ecol. Evol. 10, 854497. doi:10.3389/fevo.2022.854497
Wang, J., and Xu, C. (2017). Geodetector: Principle and prospective. Acta Geogr. Sin. 72, 19. doi:10.11821/dlxb201701010
Wang, J., Zhang, T., and Fu, B.-J. (2016). A measure of spatial stratified heterogeneity. Ecol. Indic. 67, 250–256. doi:10.1016/j.ecolind.2016.02.052
Wang, S., Zhang, Z., Mc Vicar, R. T., Guo, J., Tang, Y., et al. (2013). Isolating the impacts of climate change and land use change on decadal streamflow variation: Assessing three complementary approaches. J. Hydrol. X. 507, 63–74. doi:10.1016/j.jhydrol.2013.10.018
Wang, X., Wu, J., Liu, Y., Hai, X., Shanguan, Z., and Deng, L. (2022a). Driving factors of ecosystem services and their spatiotemporal change assessment based on land use types in the Loess Plateau. J. Environ. Manage. 311, 114835. doi:10.1016/j.jenvman.2022.114835
Wang, X., Zhang, P., Liu, L., Li, D., and Wang, Y. (2019). Effects of human activities on hydrological components in the Yiluo river basin in middle Yellow River. Water 11, 689. doi:10.3390/w11040689
Xu, C., Duan, Z., Wu, S., Li, R., Zhang, X., Zhang, X., et al. (2020). Detection and attribution of flood responses to precipitation change and urbanization: A case study in qinhuai river basin, southeast China. Hydrol. Res. 51, 351–365. doi:10.2166/nh.2020.063
Xu, C., Jiang, Y., Su, Z., Liu, Y., and Lyu, J. (2022). Assessing the impacts of grain-for-green programme on ecosystem services in jinghe river Basin, China. Ecol. Indic. 137, 108757. doi:10.1016/j.ecolind.2022.108757
Xu, J., Liu, S., Zhao, S., Wu, X., Hou, X., An, Y., et al. (2019). Spatiotemporal dynamics of water yield service and its response to urbanisation in the beiyun river basin, beijing. Sustainability 11, 4361. doi:10.3390/su11164361
Yan, F., Shangguan, W., Zhang, J., and Hu, B. (2020). Depth-to-bedrock map of China at a spatial resolution of 100 meters. Sci. Data 7, 2. doi:10.1038/s41597-019-0345-6
Yang, X., Sun, W., Li, P., Mu, X., Gao, P., and Zhao, G. (2019). Integrating agricultural land, water yield and soil conservation trade-offs into spatial land use planning. Ecol. Indic. 104, 219–228. doi:10.1016/j.ecolind.2019.04.082
Yang, X., Chen, R., Ji, G., Wang, C., Yang, Y., and Xu, J. (2021a). Assessment of future water yield and water purification services in data scarce region of northwest China. Int. J. Environ. Res. Public Health 18, 8960. doi:10.3390/ijerph18178960
Yang, J., Xie, B., Zhang, D., and Tao, W. (2021b). Climate and land use change impacts on water yield ecosystem service in the Yellow River Basin, China. Environ. Earth Sci. 80, 72. doi:10.1007/s12665-020-09277-9
Yang, Y., Li, M., Feng, X., Yan, H., Su, M., and Wu, M. (2021c). Spatiotemporal variation of essential ecosystem services and their trade-off/synergy along with rapid urbanization in the Lower Pearl River Basin, China. Ecol. Indic. 133, 108439. doi:10.1016/j.ecolind.2021.108439
Yu, Y., Zhao, W., Martinez-Murillo, J. F., and Pereira, P. (2020). Loess plateau: From degradation to restoration. Sci. Total Environ. 738, 140206. doi:10.1016/j.scitotenv.2020.140206
Yu, Y., Zhu, R., Ma, D., Liu, D., Liu, Y., and Gao, Z. (2022). Multiple surface runoff and soil loss responses by sandstone morphologies to land-use and precipitation regimes changes in the Loess Plateau, China. Catena 217, 106477. doi:10.1016/j.catena.2022.106477
Zang, W., Liu, S., Huang, S., Li, J., Fu, Y., Sun, Y., et al. (2019). Impact of urbanization on hydrological processes under different precipitation scenarios. Nat. Hazards 99, 1233–1257. doi:10.1007/s11069-018-3534-2
Zhang, X., Zhang, G., Long, X., Zhang, Q., Liu, D., Wu, H., et al. (2021). Identifying the drivers of water yield ecosystem service: A case study in the Yangtze River basin, China. Ecol. Indic. 132, 108304. doi:10.1016/j.ecolind.2021.108304
Zheng, Q., Hao, L., Huang, X., Sun, L., and Sun, G. (2020). Effects of urbanization on watershed evapotranspiration and its components in southern China. Water 12, 645. doi:10.3390/w12030645
Zhou, Y., Zhao, L., Cao, J., and Wang, Y. (2022). Using an improved SWAT model to simulate karst sinkholes: A case study in southwest China. Front. Environ. Sci. 10, 950098. doi:10.3389/fenvs.2022.950098
Keywords: InVEST, geographical detector, SSPs, water yield coefficient, Yiluo river basin
Citation: Hou J, Yan D, Qin T, Liu S, Yan S, Li J, Abebe SA and Cao X (2022) Evolution and attribution of the water yield coefficient in the Yiluo river basin. Front. Environ. Sci. 10:1067318. doi: 10.3389/fenvs.2022.1067318
Received: 11 October 2022; Accepted: 07 November 2022;
Published: 24 November 2022.
Edited by:
Yang Yu, Beijing Forestry University, ChinaReviewed by:
Batsuren Dorjsuren, National University of Mongolia, MongoliaHong Wang, Institute of Geographic Sciences and Natural Resources Research, China
Henian Wang, Chinese Academy of Forestry, China
Copyright © 2022 Hou, Yan, Qin, Liu, Yan, Li, Abebe and Cao. This is an open-access article distributed under the terms of the Creative Commons Attribution License (CC BY). The use, distribution or reproduction in other forums is permitted, provided the original author(s) and the copyright owner(s) are credited and that the original publication in this journal is cited, in accordance with accepted academic practice. No use, distribution or reproduction is permitted which does not comply with these terms.
*Correspondence: Tianling Qin, cWludGxAaXdoci5jb20=