 Guoxin Lan1,2
 Xiaolan Jiang
- 1Research Institute of Three Gorges, Chongqing Three Gorges University, Chongqing, China
- 2Key Laboratory of Water Environment Evolution and Pollution Control in Three Gorges Reservoir, Chongqing Three Gorges University, Chongqing, China
- 3College of Ecology and Environment, Xinjiang University, Xinjiang, China
- 4Key Laboratory of Oasis Ecology, Ministry of Education, Xinjiang University, Xinjiang, China
The ecological vulnerability evaluation index was established through Normalized Difference Vegetation Index (NDVI), Wetness (WET), Normalized Difference Build-up and Soil Index (NDBSI) and Land Surface Temperature (LST) indicators, comprehensively evaluate the ecological vulnerability of Zhongxian County of Chongqing in 2002, 2009, and 2016 by Principal Components Analysis (PCA), and analyze its spatio-temporal evolution. The vulnerability areas of five levels were calculated respectively, and the overall index of ecological vulnerability was also calculated. The index of remote sensing ecological index (RSEI) and Normalized Difference Vegetation Index decreased first and then increased; the Wetness index showed an upward trend; the Normalized Difference Build-up and Soil Index index increased first and then decreased; and the Land Surface Temperature index decreased. The ecological vulnerability body index (EVBI) shows a downward trend, and the incremental changes are mainly concentrated in the negligible vulnerability areas and light vulnerability area, while the medium vulnerability, strong vulnerability and extreme vulnerability area generally show a downward trend. Furthermore, the new increment of ecological vulnerability grade area concentrates on negligible vulnerability area and light vulnerability area from 2002 to 2016. In general, the ecological vulnerability gradually shifts to low vulnerability, and the ecological environment tends to develop healthily.
1 Introduction
The social economy is developing rapidly, with intensifying contradiction between human and ecological environment. The irrational utilization of resources leads to the destruction of the surrounding ecological balance to a certain extent (Yan and Zhao, 2009), and affects the sustainable development of the ecosystem. The ecological fragility problem is more serious, which is the focus of sustainable development research and has attracted the attention of many scholars worldwide (Jackson et al., 2004; Ma et al., 2015; Gao and Zhang, 2018; Tian et al., 2021; Wang et al., 2021). The deepening scientific research diversifies ecological vulnerability assessment methods. For example, Zhang et al. (2021a) used fuzzy comprehensive method and analytic hierarchy process to study the ecological fragility of Yongding River. Teng et al. (2022) constructed an exposure-sensitivity-adaptive vulnerability assessment framework, established an ecological and social index system, determined the index weight by entropy weight method, and evaluated the change rules of ecological vulnerability (EV) and social vulnerability (SV). Zhang et al. (2021b) calculated the vulnerability of landscape types to determine the ecological vulnerability of coastal zone. Based on remote sensing (RS) and geographic information system (ArcGIS) technology, Wang and Su (2018) constructed the “Pressure-State-Response” framework and used PCA to evaluate the ecological vulnerability. Besides, Liu et al. (2020) built an ecological sensitivity-ecological resilience-ecological pressure model to calculate the weight using the PCA method, and systematically evaluate the ecological vulnerability. The ecological vulnerability assessment helps us to understand the current the status quo of regional ecological vulnerability, which has a positive effect on the implementation of ecological environment governance plan. The data sources of evaluation indicators mainly include remote sensing, meteorological and other data. In addition, some studies combine RS and ArcGIS technology for ecological vulnerability evaluation. However, there are few studies that make full use of remote sensing indicators and remote sensing models for in-depth analysis of ecological vulnerability evaluation. Wu (2005) constructed the ecological environment vulnerability equation and evaluation system based on RS technology, and used ASTER and TM data fusion technology to conduct quantitative remote sensing research on ecological environment vulnerability vegetation; Bai et al. (2009) extracted eight ecological factors including vegetation index, soil brightness and soil moisture index, elevation and slope, temperature and precipitation, and land use through RS and ArcGIS technology as evaluation indicators, and used the analytical hierarchy process (AHP) to evaluate the vulnerability of ecological environment; Zhu (2020) created 10 small indicators and 4 large indicators through the analysis of long time series multi-source remote sensing data (NDVI data, reflectance data, land use data, DEM data, lighting data, soil moisture data, precipitation data) and non-remote sensing data (protected areas), forming a set of assessment system to analyze the ecological vulnerability of the study area. Since the index system is subject to subjective influence, all the selected indicators are included in the evaluation model and the independence of the indicators is ignored, resulting in increased calculation and inaccurate results (Yao et al., 2016). Based on previous research results, multi index comprehensive evaluation model built by the evaluation method of the combination of ArcGIS and RS technology can effectively solve the problem of large-scale ecological vulnerability evaluation. It can not only reflect the current situation and distribution characteristics of ecological vulnerability, but also have objectivity and high reliability.
Zhongxian County is in the middle of Chongqing and in the hinterland of the sensitive and vulnerable area of ecological environment-the Three Gorges Reservoir area. Ecological vulnerability assessment is of great significance to master its ecological vulnerability characteristics and identify ecological and environmental problems (Wang et al., 2010). Therefore, this study employed remote sensing and geographic information system technology, and established an index system with NDVI, WET, NDBSI and LST based on RSEI (Xu, 2013) to comprehensively evaluate the ecological vulnerability of Zhongxian County from 2002 to 2016 using PCA, and reveal the spatio-temporal evolution of ecological vulnerability. This study aims to provide theoretical support and scientific basis for government decision-making for the ecological vulnerability protection of Zhongxian County.
2 Materials and methods
2.1 Study area
Zhongxian County (107° 3′E-108° 14′E, 30° 03′N-30° 35′N) is adjacent to Wanzhou District in the northeast, Dianjiang County in the west, Shizhu Tujia Autonomous County in the southeast, Fengdu County in the southwest and Liangping District in the north, with an area of about 2,178 km2 (Figure 1). The territory of Zhongxian County is characterized by rolling hills, crisscross streams and rivers, and mainly hilly landform. It has the subtropical southeast monsoon mountain climate with the characteristics of warm and cold, sufficient sunshine and so on, which is significantly affected by the hilly terrain. Zhongxian County is a subtropical evergreen broad-leaved forest belt with various vegetation types, which is suitable for the growth of many plants.
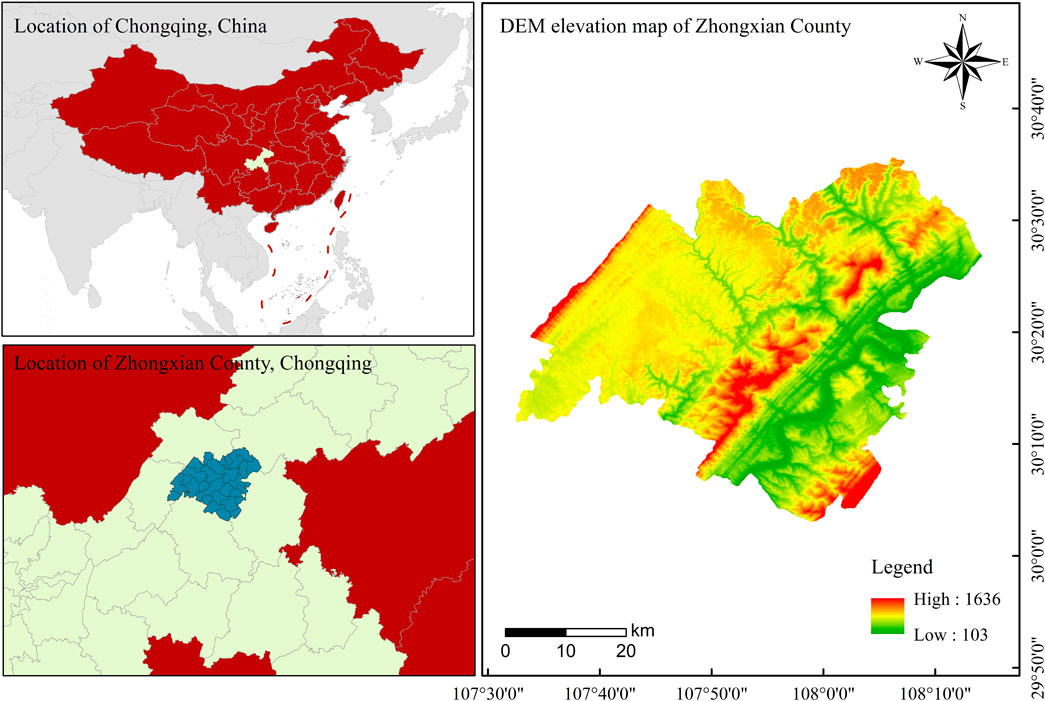
FIGURE 1. Location of Zhongxian County, China.
2.2 Data source and processing
Zhongxian County of Chongqing was chosen as the research area, and the remote sensing data set is provided by Geospatial Data Cloud site, Computer Network Information Center, Chinese Academy of Sciences (http://www.gscloud.cn) Landsat 5 TM image in 2002 and 2009, and Landsat 8 OLI image in 2016. Landsat 5 TM is a thematic mapper improved on the basis of MSS. It consists of seven bands, with a spatial resolution of 30 m for bands 1–5 and 7, and 120 m for band 6 (thermal infrared band). Landsat 8 carries an OLI land imager and a TIRS thermal infrared sensor. The OLI land imager consists of 9 bands with a spatial resolution of 30 m, including a 15 m panchromatic band. The TIRS thermal infrared sensor consists of 2 separate thermal infrared bands with a resolution of 100 m.The remote sensing images in 2002, 2009, and 2016 were radiometric calibrated by the environment for visualizing images (ENVI5.3) software, and the pixel value of the original image was converted into the reflectivity of the sensor. FLAASH (Fast line-of-sight atmospheric analysis of spectral hypercubes) absolute atmospheric correction images were adopted to reduce the differences in atmosphere and terrain of remote sensing images in different periods, and the impact on RSEI comparison between different images. The images of the study area were cropped, and the images of different phases were registered according to the quadratic polynomial and the nearest pixel method. The root mean square error of registration is less than .5 pixels. The data must be preprocessed, which is especially important for RSEI comparison between different categories and different temporal phases (Landsat 5 TM and Landsat 8 OLI_TIRS). When calculating the humidity index of the tasseled cap transformation, the correct formula should be selected, and the humidity of OLI cannot be calculated by the formula of TM, and the data based on reflectance cannot be calculated by the formula based on DN value. The DEM image of Zhongxian County is derived from the SRTMDEM 90M resolution raw elevation data provided by Geospatial Data Cloud site, Computer Network Information Center, Chinese Academy of Sciences (http://www.gscloud.cn). The world map is derived from the Natural Earth website (http://naturalearthdata.com), the administrative division map of China is derived from the website (https://github.com/GaryBikini/ChinaAdminDivisonSHP), and the administrative division map of Chongqing City and Zhongxian County is derived from 91 Weitu Assistant.
2.3 Research methods
2.3.1 Construction of evaluation index
Normalized Difference Vegetation Index (NDVI). Normalized Difference Vegetation Index (NDVI) is closely related to plant biomass, leaf area index and vegetation coverage (Goward et al., 2002), which was chosen in this paper to replace the greenness index, and the formula is as follows:
where
Wetness (WET): The brightness, greenness and humidity components of tassel hat transformation are related to surface physical parameters (Huang et al., 2002; Wang and Dong, 2013). Here, the Wetness index (WET) is expressed by humidity component. The expressions of reflectance image data of Landsat 5 TM and Landsat 8 OLI_TIRS are as follows (Crist, 1985; Baig et al., 2014):
where
Normalized Difference Build-up and Soil Index (NDBSI). Urban land leads to the “drying” of the surface. In this paper, index-based built-up index (IBI) is used to replace the building index in the NDBSI. At the same time, the exposed land on the surface will also cause surface drying. NDBSI (Xu, 2013) can be calculated by the combination of index-based built-up index (IBI) and soil index (SI) (NASA, 2012):
among,
where
Land Surface Temperature (LST): The LST index is represented by land surface temperature (Xu, 2013), and the temperature value T at the sensor was calculated by using the model (NASA, 2018) in Landsat user manual. The real land surface temperature can be obtained only through specific emissivity correction:
where L is the radiance value of Landsat 5 TM thermal infrared 6 band and Landsat 8 OLI_TIRS thermal infrared 10 band, and DN is the pixel value of the band. Gain and bias are the gain value and offset value of thermal infrared band respectively.
2.3.2 Index standardization
Different dimensions will cause the weight of each indicator to be unbalanced. Therefore, it is necessary to standardize the indicators and unify their dimensions between [0, 1] before PCA calculation (Xu, 2013). The normalization formula of each indicator is as follows:
where
2.3.3 Evaluation method
The ecological vulnerability index (EVI) can be calculated to understand the status and characteristics of ecological vulnerability. The construction of the eco-index should accommodate both the appearance of a single indicator and the combination of information from the above four indicators. Therefore, how to represent multiple variables above with a single variable, that is key to this study. A frequently used method is to simply add up the individual indicators (Kearney et al., 1995), or to group the indicators to find the mean value and then add them up (Wang et al., 2007), or to multiply them by their respective weights and then add them up (Williams et al., 2009). However, both the correlation between indicators and the artificial determination of weights and other relevant factors can affect the results. Multidimensional statistical method of principal component analysis is a multidimensional data compression technique that selects a few important variables by linear transformation of multiple variables, and it takes the method of sequentially rotating the coordinate axes vertically to concentrate the multidimensional information into a few characteristic components, which often represent certain characteristic information (Xu, 2013). Therefore, this study was conducted by using the principal component transformation to construct the remote sensing ecological index, and the main information was concentrated on the first 1–2 principal components by removing the correlation among the indicators through the rotation of the spatial axes of the feature spectra. One of the other advantages of using principal component analysis is that the weights of each indicator are not artificially determined, but are determined automatically and objectively based on the contribution of each indicator to each principal component quantity. What this leads to is that bias in the results caused by weight settings that vary from individual to individual and from method to method can be avoided in the calculation. However, there is correlation among the evaluation indicators, and the information of each indicator will overlap during calculation, so the principal component analysis method is used. Principal component analysis can transform multiple indicators into a few uncorrelated comprehensive indicators, and reflect the information expressed by more variables using fewer comprehensive indicators. Based on GIS 10.7 system calculation, this paper made principal component analysis on standardized indexes of NDVI, WET, NDBSI and LST. When the cumulative contribution rate of principal component reaches more than 85%, it can represent the information reflected by most variables (Table 1), and further calculate EVI (Yao et al., 2016; Wang and Su, 2018):
where EVI is the ecological vulnerability index. rn and

TABLE 1. Principal component analysis of each index.
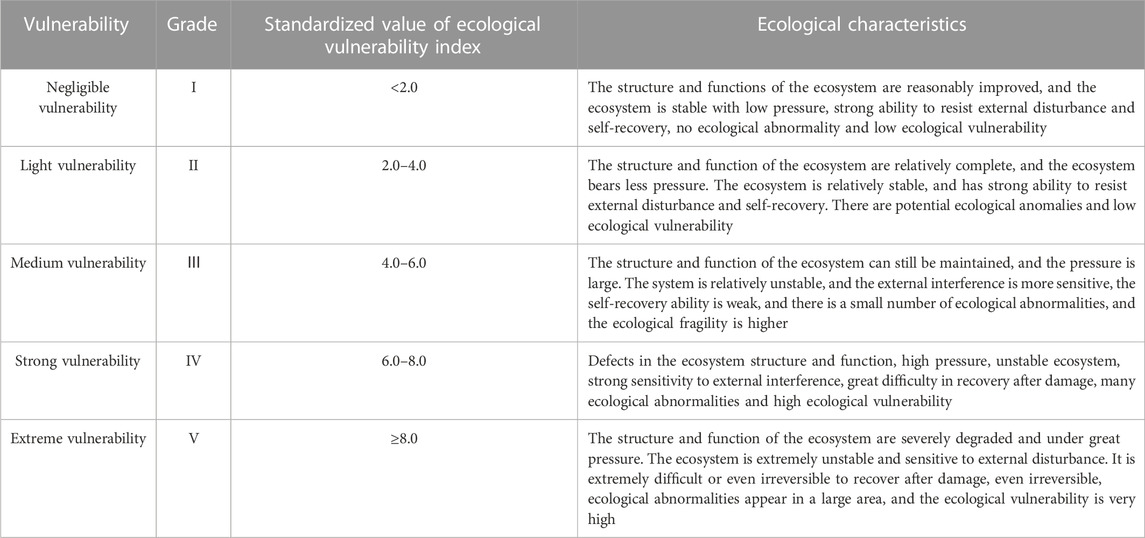
TABLE 2. Classification standard of ecological vulnerability in Zhongxian County, Chongqing (Fan et al., 2009; Ifeanyi et al., 2010; Ma et al., 2015; He et al., 2018).
Table 1 shows that the cumulative contribution rates of the PC1, PC2 and PC3 among the four indicators in Zhongxian County in 2002, 2009, and 2016 were 99.0235%, 98.8468%, and 99.3816% respectively, all greater than 85%, suggesting that they have concentrated the main information of the four indicators. In PC1, both NDVI and WET are positive, suggesting that both are good for the environment development, and both NDBSI and LST are negative.
Based on the PCA, the inversion model of ecological vulnerability assessment was calculated through Eq. 11 and Table 1 as follows:
where
2.3.4 Classification of ecological vulnerability and overall index of ecological vulnerability
In order to better measure the ecological vulnerability, vulnerability index need to be standardized, and the formula is as follows:
where
The ecological vulnerability body index (EVBI) calculated by multiplier model can analyze the overall difference of ecological vulnerability in Zhongxian County, and the algorithm is as follows (Yao et al., 2016):
where
2.3.5 Extracting the spatio-temporal evolution pattern of ecological fragility
Based on ArcGIS 10.7 system, this paper spatially superimposed the ecological vulnerability level map in 2002–2009, 2009–2016 and 2002–2016 to extract the dynamic map of ecological vulnerability change. The algorithm is as follows (Deng et al., 2016; Guo et al., 2019):
where
3 Results
3.1 Change characteristics of ecological vulnerability index
Table 3 demonstrates the statistical values of four indicators and the RSEI in 2002, 2009, and 2016. Due to the great diurnal temperature variation, the Land surface temperature index (LST) can only be compared through normalization (Carlson and Arthur, 2000; Xu et al., 2009). Therefore, the four indexes were normalized and the null value was removed to obtain the statistical values of each index. Table 3 shows the analysis results, the mean value of NDVI index beneficial to the ecological environment decreased from .6716 in 2002 to .3834 in 2009, with a decreased of 42.91%, and then increased to .4931 in 2016, indicating that the decrease of vegetation coverage in Zhongxian County gradually increased after a significant decline. In the other hand, the mean value of WET index increased from .6675 in 2002 to .7644 in 2016, an increase of 14.52%, suggesting that the water conservation capacity of Zhongxian County has improved. The mean values of NDBSI and LST indicators that having adverse effects on the ecological environment have decreased. The mean values of NDBSI increased from .6248 in 2002 to .7572 in 2009, and decreased to .5668 in 2016, and LST decreased significantly from .5721 in 2002 to .2234 in 2009 and increased to .2731 in 2016, indicating that the surface exposure of Zhongxian County has been reduced, the difference between hydrothermal balance has been reduced, and the adverse impact on the future ecological environment has been weakened. Based on the changes of the above four indicators, it roughly shows that the ecological environment of Zhongxian County is on the rise as a whole, and the environmental change is gradually developing in a good direction. The mean value of the RSEI decreased from .5405 in 2002 to .5122 in 2009 and increased to .7098 in 2016, indicating that the ecological environment quality in the study area fluctuated from 2002 to 2016, but the overall development trend showed a benign development trend, which was basically consistent with the comprehensive results of the indicators. The RSEI of Zhongxian County in 2002, 2009, and 2016 were shown in Figure 2. In order to further highlight the representativeness of the RSEI, the ecological index was divided into five grades, representing five grades including poor (I: .0–.2), poor (II: .2–.4), medium (III: .4–.6), good (IV: .6–.8) and excellent (V: .8–1.0). In 2002, the RSEI was dominated by medium (III) grade, accounting for 69.83%, and the percentages of good (IV) and excellent (V) grades were 22.47% and 1.39%, respectively, which were mainly distributed in areas with high terrain and little impact of human activities, while poor (I) and poor (II) areas accounted for .09% and 6.22%, which were mainly distributed in areas with frequent human activities. In 2009, the RSEI was dominated by medium (III) grade, accounting for 59.11%, poor (I) and poor (II) grades accounted for 1.06% and 17.17% respectively, and good (IV) and excellent (V) grades accounted for 19.94% and 2.72% respectively. In 2016, the RSEI was dominated by good (IV) grade, accounting for 72.17%, and medium (III) and excellent (V) grades accounted for 11.21% and 14.89% respectively and the area of poor (I) and poor (II) areas was the least, accounting for .12% and 1.62%. Among them, the areas with poor ecological environment quality were mainly concentrated in urban areas. On the whole, the quality of the ecological environment of Zhongxian County from 2002 to 2016 has improved.

TABLE 3. Four indicators and RSEI statistics in 2002 and 2016.
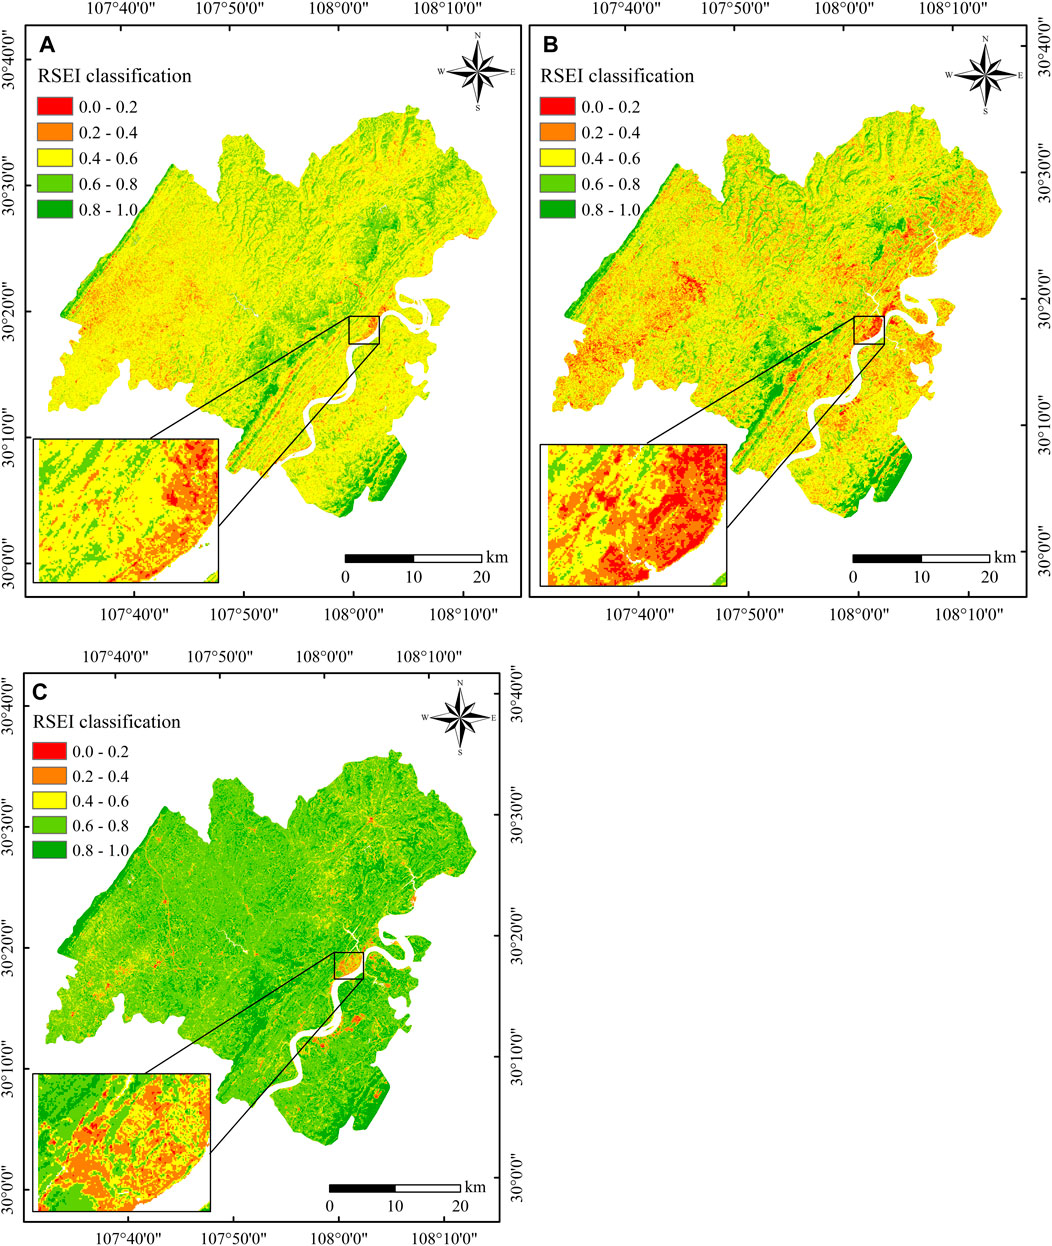
FIGURE 2. 2002 (A), 2009 (B) and 2016 (C) RSEI of Zhongxian County (water body mask treatment, the picture at the lower left corner shows the location of Zhongxian County administrative center).
3.2 Overall characteristics of ecological vulnerability
By calculating the ecological vulnerability body index (EVBI) of the four indicators, the ecological vulnerability grade area and EVBI distribution in 2002, 2009, and 2016 were inversed (Table 4), and the overall distribution pattern of ecological vulnerability in Zhongxian County was analyzed. The total ecological vulnerability area of the five grades of Zhongxian County decreased from 2,134.0152/km2 in 2002–2,119.1328/km2 in 2009, and increased to 2,123.0626/km2 in 2016. The total value of ecological vulnerability body index (EVBI) decreased from 2.9986 in 2002 to 2.759961 in 2009, and fell to 1.75681 in 2016, with a large decline. According to the classification standard of ecological fragility in Zhongxian County, the ecological vulnerability was mainly medium vulnerability and strong vulnerability in 2002, the medium vulnerability grade accounted for 62.21% of the total area, while the strong vulnerability grade was 17.86%. In 2009, it was mainly medium vulnerability and light vulnerability, accounting for 62.51% and 26.26% of the total area respectively. In 2016, it was mainly light vulnerability and negligible vulnerability, accounting for 57.36% and 29.90% of the total area respectively. The areas of medium vulnerability, strong vulnerability and extreme vulnerability areas in 2009 decreased by 35.8680/km2, 221.1363/km2 and 3.6009/km2 respectively compared with 2002, and the areas of strong vulnerability areas decreased significantly. In 2016, the area of medium vulnerability, strong vulnerability and extreme vulnerability areas decreased by 1,142.8840/km2, 138.915/km2 and 1.4868/km2 respectively compared with 2009, and the area of medium vulnerability areas decreased significantly. From 2002 to 2016, the area of negligible vulnerability and light vulnerability areas continued to grow, with an increase of 626.9328/km2 and 906.0096/km2 respectively, indicating significant changes in vulnerability.

TABLE 4. Area and EVBI distribution of ecological vulnerability in different years in Zhongxian County, Chongqing.
As shown in Figure 3, the ecological vulnerability grade of Zhongxian County was dominated by medium vulnerability and strong vulnerability in 2002, which were distributed in bands and flakes, and the negligible, light and extreme vulnerability areas were roughly distributed in dots and blocks. Among them, the spatial distribution of medium vulnerability and strong vulnerability areas in the southwest was dense, which was mainly due to the densely populated distribution and the great impact of human activities. In 2009, Zhongxian County was mainly distributed in light and medium vulnerability areas, and negligible vulnerability areas, strong vulnerability areas and extreme vulnerability areas were generally distributed in bands and dots. The areas with high vulnerability were significantly affected by human activities, while areas with low vulnerability were mainly affected by terrain, with less human activities, less pressure, and strong ability to resist external interference and self-recovery. In 2016, Zhongxian County was mainly distributed in negligible vulnerability areas and light vulnerability areas, and the medium vulnerability, strong vulnerability and extreme vulnerability areas were roughly scattered in dots. The areas with high vulnerability were mostly areas with high economic level, large urbanization construction land, small green space and frequent human economic activities. The areas with low vulnerability were mainly limited by their geographical conditions, small population density and low impact of human economic activities. The good surface vegetation coverage can promote the reduction of its ecological vulnerability. Through the analysis of the overall situation of ecological vulnerability, the overall ecological vulnerability of Zhongxian County in Chongqing was found to be mainly increased to the negligible vulnerability and light vulnerability area from 2002 to 2016, and the medium vulnerability, strong vulnerability and extreme vulnerability areas showed a downward trend. The overall index of ecological vulnerability decreased. The ecological vulnerability weakened with the implementation of ecological restoration and protection measures, and the ecosystem was restored and improved.
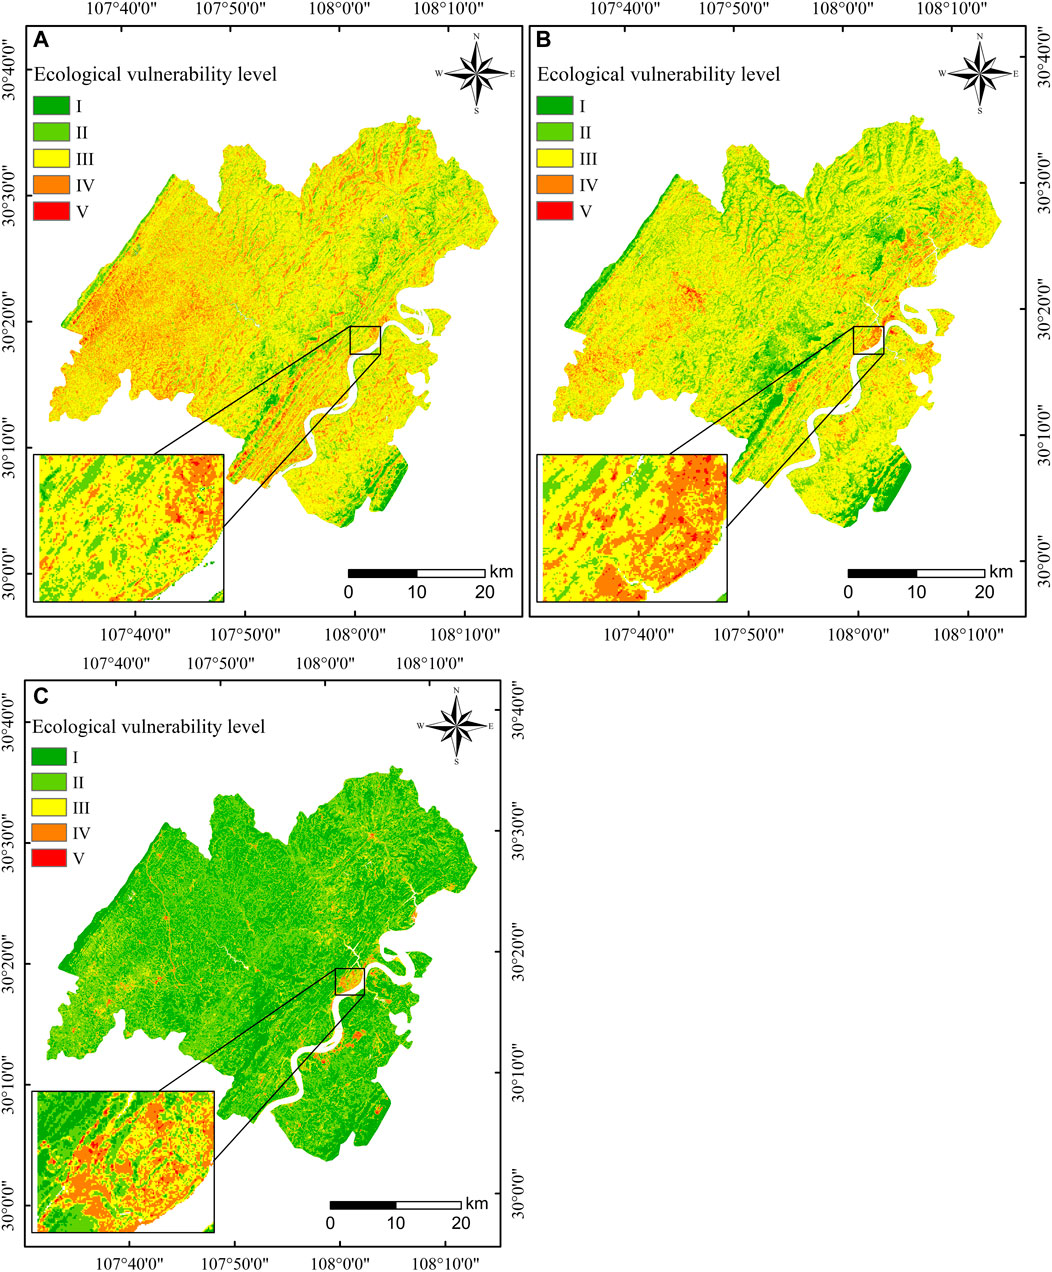
FIGURE 3. Spatial distribution of ecological vulnerability level in Zhongxian County in 2002 (A), 2009 (B) and 2016 (C) (water body mask treatment, the picture at the lower left corner shows the location of Zhongxian administrative center).
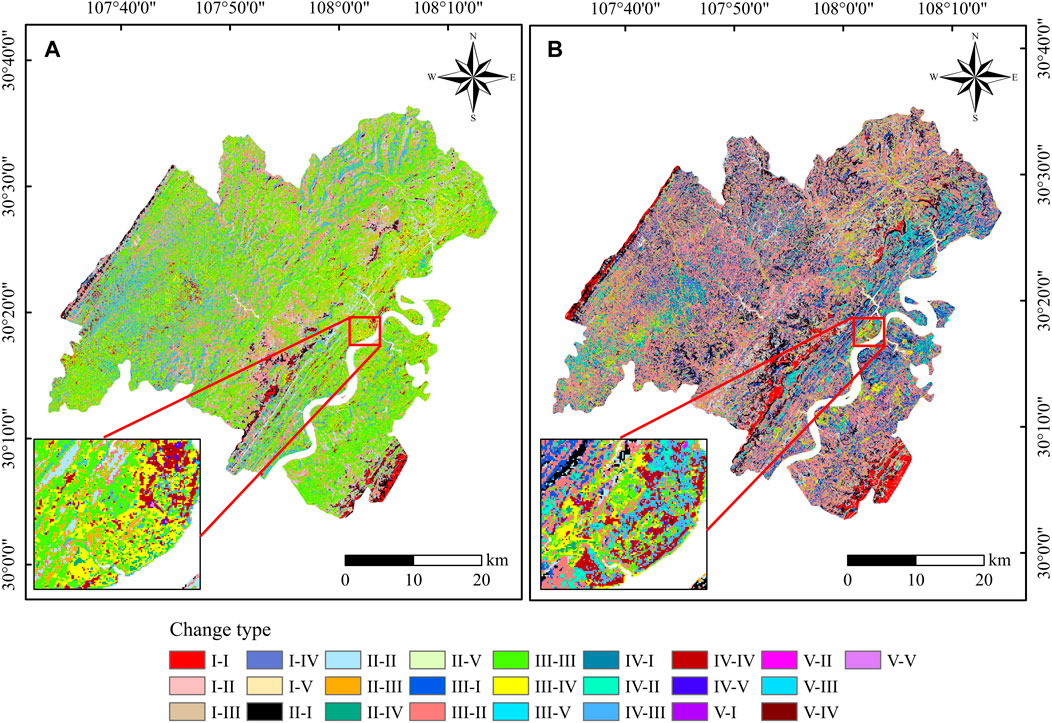
FIGURE 4. 2002–2009 (A), 2009–2016 (B) temporal and spatial evolution pattern of ecological vulnerability in Zhongxian County (water mask treatment, the picture at the lower left corner shows the location of Zhongxian County administrative center).
3.3 Spatio-temporal evolution characteristics of ecological vulnerability
The spatial variation of ecological vulnerability level in Zhongxian County during the past 15 years was further analyzed, the study was divided into two periods (2002–2009 and 2009–2016) for longitudinal comparative analysis. The spatial-temporal evolution characteristics of ecological vulnerability was calculated by Eqs 17, 18 (Figure 4), and the area transfer matrix of different levels of ecological vulnerability was calculated during 2002–2009 and 2009–2016 (Tables 5, 6). From 2002 to 2009, the area transfers of various ecological vulnerability levels totaled 896.3946/km2 (Table 5). From 2002 to 2009, the level of ecological vulnerability mainly transferred from medium vulnerability and strong vulnerability to light vulnerability and medium vulnerability. In 2002, the transfer amount of medium vulnerability and strong vulnerability was 424.1340/km2 and 326.1600/km2 respectively, accounting for 47.31% and 36.39% of the total amount of ecological vulnerability; the transfer amount of negligible, light and extreme vulnerability was 6.4152/km2, 132.4818/km2 and 7.2036/km2, respectively, accounting for .72%, 14.78% and .80% of the total transfer volume. In 2009, the new increment of light vulnerability and medium vulnerability was 343.9386/km2 and 396.3465/km2 respectively, accounting for 38.37% and 44.22% of the total new increment; the new increment of negligible vulnerability, strong vulnerability and extreme vulnerability was 45.8109/km2, 106.6446/km2 and 3.6540/km2, accounting for 5.11%, 11.90% and .41% of the total increment. From 2009 to 2016, the area transfers of various ecological vulnerability levels totaled 1,656.2745/km2 (Table 6). From 2002 to 2009, the level of ecological vulnerability mainly transferred from light vulnerability and medium vulnerability to negligible vulnerability and light vulnerability. In 2009, the transfer amount of light vulnerability and medium vulnerability was 292.1850/km2 and 1,191.1788/km2 respectively, accounting for 17.64% and 71.92% of the total amount of ecological vulnerability; the transfer volume of negligible, strong and extreme vulnerability was 8.7939/km2, 160.4871/km2, and 3.6297/km2, accounting for .53%, 9.69% and .22% of the total transfer volume. In 2016, the new increment of negligible vulnerability and light vulnerability was 598.1805/km2 and 990.9576/km2 respectively, accounting for 36.12% and 59.83% of the total new increment; the new increment of medium vulnerability, strong vulnerability and extreme vulnerability was 44.892/km2, 20.0925/km2, and 2.1519/km2 respectively, accounting for 2.71%, 1.21%, and .13% of the total increment.
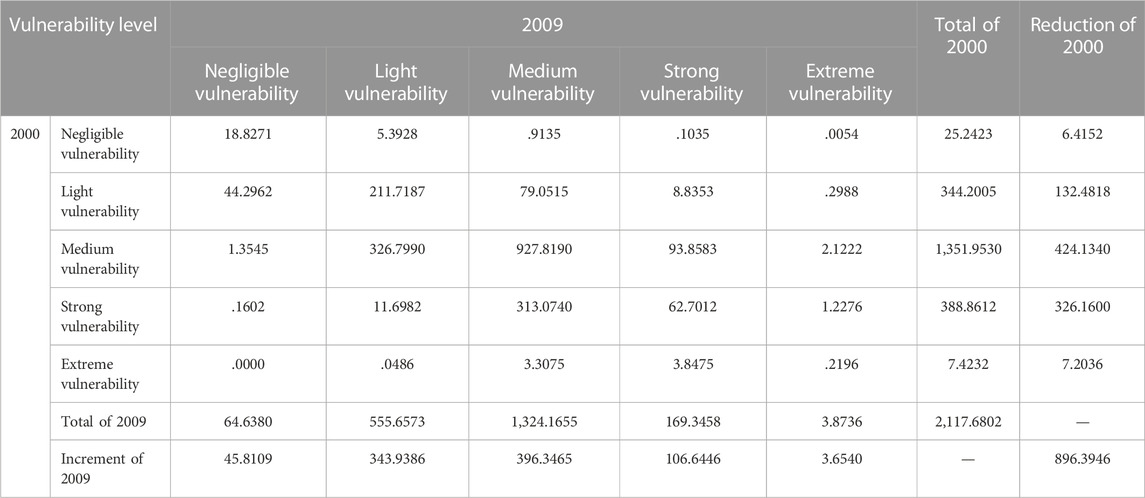
TABLE 5. Area transfer matrix of different ecological vulnerability levels in Zhongxian County from 2002 to 2009 (km2).
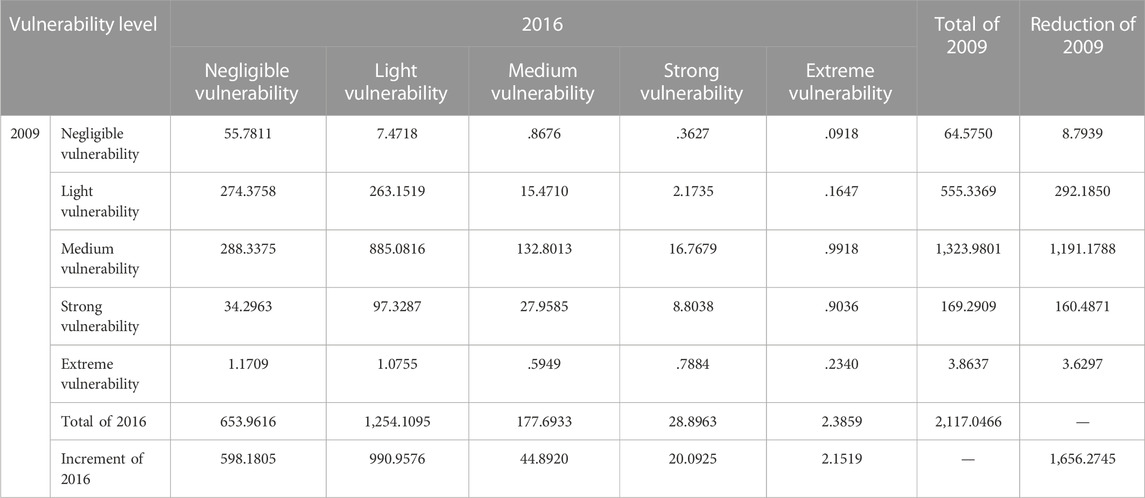
TABLE 6. Area transfer matrix of different ecological vulnerability levels in Zhongxian County from 2009 to 2016 (km2).
With the support of ArcGIS 10.7 software, the spatial variation of ecological vulnerability levels during 2002–2016 was calculated by Eq. 19 (Figure 5), and the area dynamic change of different ecological vulnerability levels in Zhongxian County during 2002–2016 was obtained (Table 7). Overall, the new increase in the area of ecological vulnerability level from 2002 to 2016 is mainly in the area of negligible vulnerability areas, light vulnerability areas and medium vulnerability areas, while the transfer amount is mainly light vulnerability areas, medium vulnerability areas and strong vulnerability areas. Affected by natural and geographical conditions, areas with large topographic fluctuations and less human activities have low ecological vulnerability, flat terrain and areas along the river basin have high ecological vulnerability (Figure 5). On the whole, the distribution pattern of ecological vulnerability is higher in the eastern and southwestern regions, and lower in the central and southeastern regions. With the promulgation of national policies and the implementation of ecological and environmental protection measures, ecological vulnerability has been gradually shifted to low vulnerability. Although the accelerated urbanization process has led to the growth of strong vulnerability areas and extreme vulnerability areas, the growth rate is still small, and shows a downward trend. Generally speaking, the ecological environment of Zhongxian County is gradually developing in a good direction.
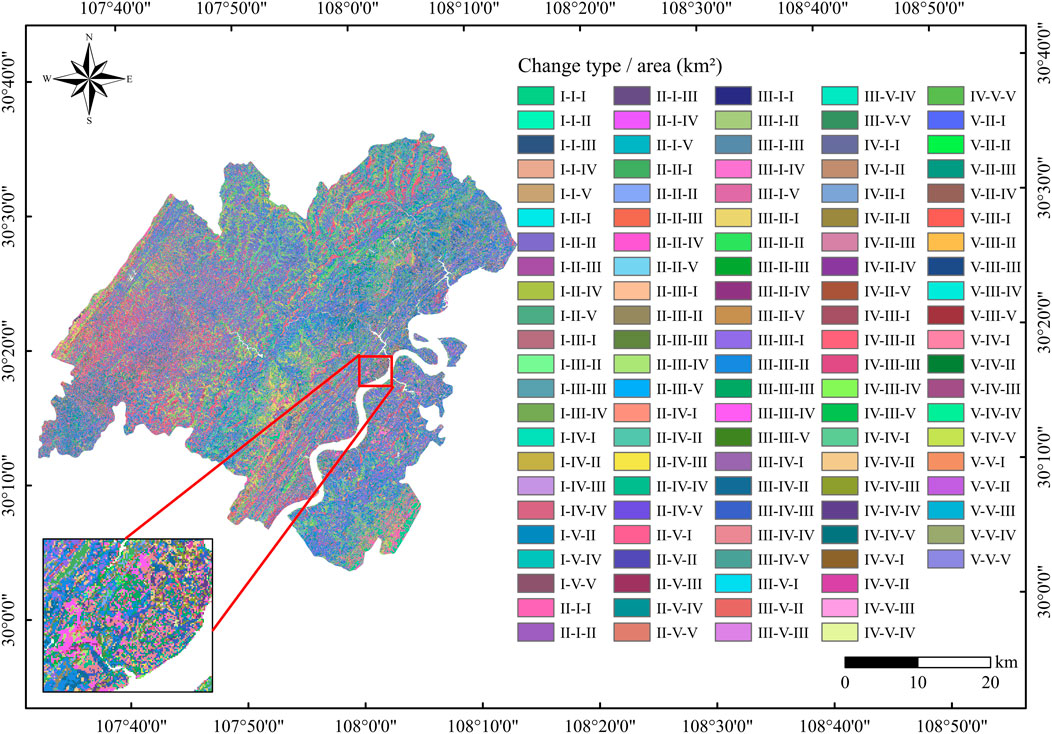
FIGURE 5. Temporal and spatial evolution pattern of ecological vulnerability in Zhongxian County from 2002 to 2016 (water mask treatment, the picture at the lower left corner shows the location of Zhongxian administrative center).
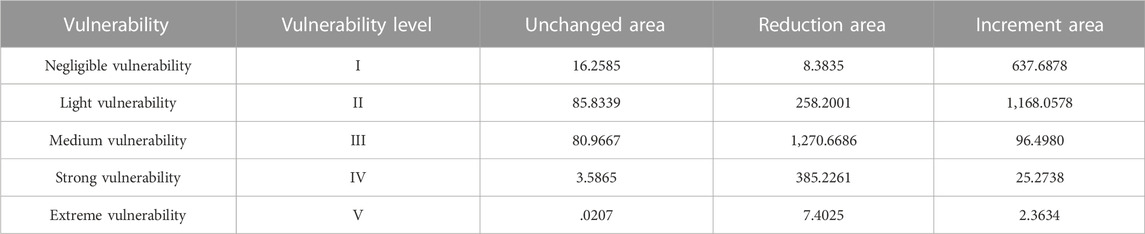
TABLE 7. Dynamic change of area of different ecological vulnerability levels from 2002 to 2016 (km2).
4 Discussion
The purpose of this study is to make a comprehensive quantitative assessment of ecological vulnerability in Zhongxian County, and to analyze the spatio-temporal evolution characteristics of ecological vulnerability. In order to evaluate the ecological vulnerability in more detail, the RSEI in 2002, 2009 and 2016 was calculated, and the ecological vulnerability assessment index system was constructed by using the indicators of NDVI, WET, NDBSI, and LST, and the ecological vulnerability of Zhongxian County was analyzed by the principal component analysis method. From 2002 to 2016, the RSEI showed a trend of first decreasing and then increasing, in which the WET index showed an increasing trend, the LST index showed a decreasing trend, the NDVI index showed a decreasing trend and then increasing trend, and the NDBSI index showed a rising trend and then decreasing trend. In general, the ecological environment quality was developing towards a good trend. The degree of ecological vulnerability is related to vegetation index, wetness, bare land surface, urban land and land surface temperature, which is consistent with the results of other studies (Tang et al., 2022; Zhang et al., 2022). In addition to investigating the change characteristics of ecological vulnerability indicators, another aspect of this study is to analyze the spatial and temporal evolution pattern of ecological vulnerability. From 2002 to 2016, the overall index of ecological vulnerability showed a downward trend. By 2016, the level of ecological vulnerability was mainly negligible vulnerability and light vulnerability, and most areas shifted to negligible vulnerability and light vulnerability, and the ecological vulnerability gradually changed to low vulnerability. In terms of spatial distribution, the distribution of ecological vulnerability from high to low basically showed a trend of gradual transition from plain to mountainous region, which was consistent with other reports (Li, 2010; Jin and Xu, 2022; Singh et al., 2022).
Due to the characteristics of multi-band and strong correlation of multispectral images, the internal information of multispectral images is highly redundant (Sun et al., 2016). The index calculated based on remote sensing image may have information redundancy. In order to avoid the influence of human factors and subjective conditions when constructing the ecological vulnerability assessment index system, the index system of RSEI was selected (Xu, 2013). There was no obvious correlation between the index systems. In addition, it can reflect the vegetation cover, soil moisture, surface exposure and land surface temperature (Wang et al., 2016), while the spatial principal component analysis can remove certain correlations among indicators and reduce data redundancy (Xu, 2013; Pan and Xiao, 2015). To sum up, this paper selects the indicators of NDVI, WET, NDBSI, and LST to construct an ecological vulnerability assessment index system, and principal component analysis is a desirable evaluation method. In this study, the ecological vulnerability of Zhongxian County was objectively evaluated through remote sensing and evaluation model to reveal the evolution drivers of its ecological vulnerability. In view of the obvious spatial differentiation characteristics of each index impact factor in different geographical units, the local government should coordinate the effective balance between economic development and ecological vulnerability management. Appropriate measures should be taken to prevent ecological fragility from becoming more fragile.
5 Results
Combined with remote sensing and ArcGIS technology, this paper calculates the RSEI through remote sensing model and constructs the ecological vulnerability evaluation index system, comprehensively and quantitatively evaluates the ecological vulnerability of Zhongxian County in 2002, 2009, and 2016 by PCA method, and analyzes the spatio-temporal evolution characteristics of ecological vulnerability. The key points of my conclusion are as follows.
(1) Based on the distribution characteristics, the RSEI showed a trend of first decreasing and then increasing, from .5405 in 2002 to .5122 in 2009, and then rising to .7098 in 2016. Among them, the average value of NDVI that are conducive to the ecological environment quality has a trend of first decreasing and then increasing, the WET has an upward trend, while the average value of NDBSI that are not conducive to the ecological environment quality has a trend of first increasing and then decreasing, and the LST has a downward trend, indicating that the vegetation coverage in Zhongxian County has decreased and then increased, the degree of surface exposure has decreased, and the difference between water and heat balance has decreased. On the whole, the impact on future ecological vulnerability is weakened.
(2) The EVBI of Zhongxian County shows a downward trend. From 2002 to 2016, the EVBI changed from medium vulnerability and strong vulnerability to negligible vulnerability and light vulnerability, and the medium vulnerability, strong vulnerability and extreme vulnerability showed a general downward trend. The ecological vulnerability gradually weakens with the implementation of ecological restoration and protection measures, that is, the improvement of ecological environment is gradual.
(3) The increment of ecological vulnerability level in 2002–2009 is mainly the increase in the area of light and medium vulnerability area, while the transfer amount is mainly the transfer of medium vulnerability and strong vulnerability. The increment of ecological vulnerability level in 2009–2016 is mainly the increase in the area of negligible vulnerability and light vulnerability area, while the transfer amount is mainly the transfer of light vulnerability and medium vulnerability. In general, the ecological vulnerability gradually changes to low vulnerability, and the ecological environment of Zhongxian County tends to benign development.
Data availability statement
The original contributions presented in the study are included in the article/supplementary material, further inquiries can be directed to the corresponding author.
Author contributions
GL: conceptualization; development or design of methodology; validation; formal analysis; writing–original draft preparation; visualization; data curation. XJ: supervision; writing–review and editing. DX: supervision; funding acquisition; writing–review and editing. XG: supervision; project administration; funding acquisition; writing–review and editing. YW: writing–review; data curation. YL: data curation. YY: data curation. All authors have read and agreed to the published version of the manuscript.
Funding
This research was funded by XG, grant number (National Social Science Fund I: 21BMZ141, Supported by the Open Fund of the Research Center for Sustainable Development of the Three Gorges Reservoir Area: 2021sxxyjd01, Humanities and Social Sciences Research Planning Project of Chongqing Municipal Education Commission: 21SKGH432) and GL, grant number (Chongqing Wanzhou District Science and Technology Committee Project: 201503050, Open Fund for Chongqing Key Laboratory of Water Environment Evolution and Pollution Control in the Three Gorges Reservoir Area: WEPKL2012MS-03).
Conflict of interest
The authors declare that the research was conducted in the absence of any commercial or financial relationships that could be construed as a potential conflict of interest.
Publisher’s note
All claims expressed in this article are solely those of the authors and do not necessarily represent those of their affiliated organizations, or those of the publisher, the editors and the reviewers. Any product that may be evaluated in this article, or claim that may be made by its manufacturer, is not guaranteed or endorsed by the publisher.
References
Bai, Y., Ma, H., Zhang, B., Liang, j., Li, Z., Li, H., et al. (2009). Eco-environmental vulnerability analysis around Qinghai lake based on RS and GIS technology[J]. Remote Sens. Technol. Appl. 24 (05), 635–641. doi:10.11873/j.issn.1004-0323.2009.5.635
Baig, M. H. A., Zhang, L. F., Shuai, T., and Tong, Q. (2014). Derivation of a tasselled cap transformation based on Landsat 8 at-satellite reflectance. Remote Sens. Environ. 5 (5), 423–431. doi:10.1080/2150704x.2014.915434
Carlson, T. N., and Arthur, S. T. (2000). The impact of land use — Land cover changes due to urbanization on surface microclimate and hydrology: A satellite perspective. Glob. Planet. Change 25 (1/2), 49–65. doi:10.1016/s0921-8181(00)00021-7
Crist, E. P. (1985). A TM Tasseled Cap equivalent transformation for reflectance factor data. Remote Sens. Environ. 17 (3), 301–306. doi:10.1016/0034-4257(85)90102-6
Deng, H., Shao, J., Wang, J., Gao, M., and Wei, C. (2016). Land use driving forces and its future scenario simulation in the Three Gorges Reservoir Area using CLUE-S model[J]. Acta Geogr. Sin. 71 (11), 1979–1997. doi:10.11821/dlxb201611009
Fan, Z., Liu, M., Shen, W., and Lin, L. (2009). GIS-Based assessment on eco-vulnerability of jiangxi province. J. Geo-information Sci. 11 (02), 202–208. doi:10.3724/sp.j.1047.2009.00202
Gao, Y., and Zhang, H. (2018). The study of ecological environment fragility based on remote sensing and GIS. J. Indian Soc. Remote Sens. 46 (5), 793–799. doi:10.1007/s12524-018-0759-1
Goward, S. N., Xue, Y. K., and Czajkowski, K. P. (2002). Evaluating land surface moisture conditions from the remotely sensed temperature/vegetation index measurements: An exploration with the simplified simple biosphere model [J]. Remote Sens. Environ. 79 (2/3), 225–242. doi:10.1016/s0034-4257(01)00275-9
Guo, Z., Wei, W., Pang, S., Li, Z., Zhou, J., and Xie, B. (2019). Spatio-temporal evolution and motivation analysis of ecological vulnerability in arid inland river basin based on spca and remote sensing index: A case study on the shiyang river basin[J]. Acta Ecol. Sin. 39 (07), 2558–2572. doi:10.5846/stxb201805211114
He, L., Shen, J., and Zhang, Y. (2018). Ecological vulnerability assessment for ecological conservation and environmental management. J. Environ. Manag. 206, 1115–1125. doi:10.1016/j.jenvman.2017.11.059
Huang, C., Wylie, B., Yang, L., Homer, C., and Zylstra, G. (2002). Derivation of a tasselled cap transformation based on Landsat 7 at-satellite reflectance. Int. J. Remote Sens. 23 (8), 1741–1748. doi:10.1080/01431160110106113
Ifeanyi, C. E., Adoh, E. N., and Alabi, M. O. (2010). Evaluation of eco-environmental vulnerability in Efon-Alaye using remote sensing and GIS techniques [J]. J. Geogr. Regional Plan. 3 (1), 8–16. doi:10.5897/JGRP.9000051
Jackson, L. E., Bird, S. L., Matheny, R. W., O'Neill, R. V., White, D., Boesch, K. C., et al. (2004). A regional approach to projecting land-use change and resulting ecological vulnerability. Environ. Monit. Assess. 94 (1-3), 231–248. doi:10.1023/b:emas.0000016891.24052.bf
Jin, L., and Xu, Q. (2022). Ecological vulnerability assessment of Sichuan Province based on SRP model[J]. Ecol. Sci. 41 (02), 156–165. doi:10.14108/j.cnki.1008-8873.2022.02.019
Kearney, M. S., Rogers, A. S., and Townshend, J. R. G. (1995). Developing a model for determining coastal marsh “health”//third thematic conference on remote sensing for marine and coastal environments [J]. Seattle, Washington, 527–537.
Li, Wei (2010). Study on the ecological vulnerability in shiyang river basin based on RS and GIS approach[D]. Lanzhou: Northwest Normal University.
Liu, J., Zhao, J., Shen, S., and Zhao, Y. (2020). Ecological vulnerability assessment of Qilian Mountains region based on SRP conceptual model[J]. Arid. Land Geogr. 43 (06), 1573–1582. doi:10.12118/j.issn.1000-6060.2020.06.19
Ma, J., Li, C., Hong, W., Peng, M., Yujing, Y., Qingshui, R., et al. (2015). Dynamic evaluation of ecological vulnerability in the three Gorges Reservoir region in chongqing municipality, China[J]. Acta Ecol. Sin. 35 (21), 7117–7129. doi:10.5846/STXB201309252364
Pan, J., and Xiao, L. (2015). Assessment of landscape ecological security and optimization of landscape pattern based on spatial principal component analysis and resistance model in arid inland area: A case study of ganzhou District, zhangye city. Northwest China[J] 26 (10), 3126–3136. doi:10.13287/j.1001-9332.20150921.027
Singh, B M., Komal, C., Rustam, P., and Alexander, K. (2022). Using RS/GIS for spatiotemporal ecological vulnerability analysis based on DPSIR framework in the Republic of Tatarstan, Russia[J]. Ecol. Inf. 67. 101490. doi:10.1016/j.ecoinf.2021.101490
Sun, W., Zhang, L., Zhang, L., and Lai, Y. M. (2016). A dissimilarity-weighted sparse self-representation method for band selection in hyperspectral imagery classification. IEEE J. Sel. Top. Appl. Earth Observations Remote Sens. 9 (9), 4374–4388. doi:10.1109/jstars.2016.2539981
Tang, H., Fang, J., Xie, R., Ji, X., Li, D., and Yuan, J. (2022). Impact of land cover change on a typical mining region and its ecological environment quality evaluation using remote sensing based ecological index (RSEI). Sustainability 14 (19), 12694. doi:10.3390/su141912694
Teng, Y., Zhan, J., Liu, S., Agyemanga, F. B., Li, Z., Wang, C., et al. (2022). Integrating ecological and social vulnerability assessment in Qinghai Province, China. Phys. Chem. Earth 126 (2), 103115. doi:10.1016/j.pce.2022.103115
Tian, J., Guo, C., and Wang, J. (2021). Quantitative Assessment of the Ecological Vulnerabiliyt of Baiyangdian Wetlands in the north China Plain[J]. J. Resour. Ecol. 12 (06), 814–821. doi:10.5814/J.ISSN.1674-764X.2021.06.009
Wang, L., Xi, C., Fu, Q., and Su, Y. (2010). Landscape Pattern-Based Eco-Environment Vulnerability Assessment of Three Gorges Reservoir Area[J]. Res. Environ. Sci. 23 (10), 1268–1273. doi:10.13198/j.res.2010.10.56.wanglj.008
Wang, P., Zhao, W., and Ke, X. (2021). Evaluation and Spatiotemporal Evolution of Ecological Vulnerability of Qianjiang Based on SRP Model[J]. Res. Soil Water Conservation 28 (05), 347–354. doi:10.13869/j.cnki.rswc.2021.05.040
Wang, S., Zhang, X., Zhu, T., Yang, W., and Zhao, J. (2016). Assessment of ecological environment quality in the Changbai Mountain Nature Reserve based on remote sensing technology[J]. Prog. Geogr. 35 (10), 1269–1278. doi:10.18306/dlkxjz.2016.10.010
Wang, Y., and Dong, Z. (2013). Extraction of Remote Sensing Image Vegetation Information Based on the Tasseled Cap Transformation Image Fusion[J]. Geospatial Inf. (04), 85–86+9. doi:10.11709/j.issn.1672-4623.2013.04.031
Wang, Z. H., Ma, H. Z., Zhou, D. J., and Sha, Z. (2007). Integrated evaluation of eco-environment based on RS/GIS: a case study of the South-to-north Water Transfer Project in Yalongjiang River [J]. J. Salt Lake Res. 15 (1), 1–4. doi:10.3969/j.issn.1008-858X.2007.01.001
Wang, Z., and Su, Y. (2018). Analysis of Eco-environment vulnerability characteristics of Hanzhong City, near the water source midway along the route of the south-to-north water transfer project, China[J]. Acta Ecol. Sin. 38 (02), 432–442. doi:10.5846/stxb201609261944
Williams, M., Longstaff, B., Buchanan, C., Llanso, R., and Dennison, W. (2009). Development and evaluation of a spatially-explicit index of Chesapeake Bay health. Mar. Pollut. Bull. 59 (1/3), 14–25. doi:10.1016/j.marpolbul.2008.11.018
Wu, H. (2005). The ration RS research of eco-environment frangibility based on multi-source data[D]. Fuzhou: Fujian Normal University.
Xu, H. Q., Ding, F., and Wen, X. L. (2009). Urban Expansion and Heat Island Dynamics in the Quanzhou Region, China. IEEE J. Sel. Top. Appl. Earth Observations Remote Sens. 2 (2), 74–79. doi:10.1109/jstars.2009.2023088
Xu, H. (2013). A remote sensing urban ecological index and its application[J]. Acta Ecol. Sin. 33 (24), 7853–7862. doi:10.5846/stxb201208301223
Yan, M., and Zhao, G. (2009). Ecological environment condition evaluation of estuarine area based on quantitative remote sensing——a case study in Kenli County[J]. China Environ. Sci. 29 (02), 163–167. doi:10.3321/j.issn:1000-6923.2009.02.010
Yao, X., Yu, K., Liu, J., Yang, S. P., He, P., Deng, Y. B., et al. (2016). Spatial and temporal changes of the ecological vulnerability in a serious soil erosion area, Southern China. Chin. J. Appl. Ecol. 27 (03), 735–745. doi:10.13287/j.1001-9332.201603.022
Zhang, J., Gao, P., Dong, X., Teng, L., Xu, J., and Dun, X. (2021). Ecological Vulnerability Assessment of Qingdao Coastal Zone Based on Landscape Pattern Analysis[J]. J. Ecol. Rural Environ. 37 (08), 1022–1030. doi:10.19741/j.issn.1673-4831.2020.0860
Zhang, X., Hantong, Q., and Yang, W. (2021). Assessment of ecological vulnerability of water source in Yongding River based on fuzzy comprehensive evaluation method[J]. Environ. Prot. Sci. 47 (03), 159–163. doi:10.16803/j.cnki.issn.1004-6216.2021.03.027
Zhang, X., Liu, K., Li, X., Wang, S., and Wang, J. (2022). Vulnerability assessment and its driving forces in terms of NDVI and GPP over the Loess Plateau, China. Phys. Chem. Earth 125, 103106. doi:10.1016/j.pce.2022.103106
Keywords: ecological vulnerability, RSEI, PCA, spatiotemporal evolution, ecological environment
Citation: Lan G, Jiang X, Xu D, Guo X, Wu Y, Liu Y and Yang Y (2023) Ecological vulnerability assessment based on remote sensing ecological index (RSEI): A case of Zhongxian County, Chongqing. Front. Environ. Sci. 10:1074376. doi: 10.3389/fenvs.2022.1074376
Received: 19 October 2022; Accepted: 28 December 2022;
Published: 12 January 2023.
Edited by:
Yonghao Xu, Institute of Advanced Research in Artificial Intelligence (IARAI), AustriaReviewed by:
Shizhen Chang, Institute of Advanced Research in Artificial Intelligence (IARAI), AustriaIman Rousta, Yazd University, Iran
Copyright © 2023 Lan, Jiang, Xu, Guo, Wu, Liu and Yang. This is an open-access article distributed under the terms of the Creative Commons Attribution License (CC BY). The use, distribution or reproduction in other forums is permitted, provided the original author(s) and the copyright owner(s) are credited and that the original publication in this journal is cited, in accordance with accepted academic practice. No use, distribution or reproduction is permitted which does not comply with these terms.
*Correspondence: Denghui Xu, YTUwNDA5NTkxOUAxNjMuY29t