 Yang Yu1
 Qing Zhu1
 Qianshan He2Yang Gao3
 Xu Zhou3Rong Zhang3Xiaotuo Zhang3Hongyu Li3*Weijie Wang4
 Tiantao Cheng1,5,6,7,8*
- 1Department of Atmospheric and Oceanic Sciences & Institute of Atmospheric Sciences, Fudan University, Shanghai, China
- 2Shanghai Meteorological Bureau, Shanghai, China
- 3Weather Modification Centre, China Meteorological Administration (CMA), Beijing, China
- 4Environmental Research Center, Duke Kunshan University, Kunshan, China
- 5IRDR ICoE on Risk Interconnectivity and Governance on Weather/Climate Extremes Impact and Public Health, Fudan University, Shanghai, China
- 6Shanghai Qi Zhi Institute, Shanghai, China
- 7Innovation Center of Ocean and Atmosphere System, Zhuhai Fudan Innovation Research Institute, Zhuhai, China
- 8Institute of Eco-Chongming (SIEC), Shanghai, China
Vertical information about aerosols and clouds is vital to understanding aerosol transport, aerosol-cloud interactions, and pollution-weather-climate feedback so as to reduce uncertainties in estimating their climatic effects. The combination of sounding, lidar, aircraft, and satellite measurements is widely used to obtain the vertical information of aerosols and clouds. We used an aircraft measurement over southern Anhui, the upstream regions of Shanghai, on 1 November which conducted to ensure good air quality for the Third China International Import Expo to examine the vertical characteristics of aerosol and cloud microphysical properties and their variations before and after cloud seeding. Observations showed aerosols and clouds were vertically stratified. Most aerosols trapped within the boundary layer are small particles with sizes less than 0.12 µm. Aerosol number concentrations (Na) generally decreased with altitude in the cloudless atmosphere, with the largest particles occurring in 2500–3500 m due to dust transported from distant regions and high ambient humidity. Four separate cloud layers with unequal depths dominated by altostratus and nimbostratus appeared at different heights. The maximum cloud droplet concentration (Nc) and the minimum cloud droplet diameter (Dc) that appeared in the mid-level cloud (2246–2482 m) were 107.7 cm−3 and 4.03 μm, respectively, owing to the high proportion of hygroscopic particles. Hygroscopic particles played an important role in the growth of droplets and the activation of cloud condensation nuclei, especially under high ambient humidity. Cloud droplet size spectrum showed a unimodal distribution with a single peak at 5 µm in low- (970–1000 m) and mid-level clouds, but a trimodal distribution with peaks at 7 μm, 12 μm, and 17 μm in the mid-high- and high-level clouds, indicating the broadening of spectra with increasing altitude. An artificial seeding experiment was conducted in the high-level clouds. Big cloud droplets and ice crystals increased significantly after cloud seeding. Meanwhile, cloud particle populations showed less Nc, larger Dc, and a wider size spectrum. Our results suggest that the artificial precipitation experiment promoted rainfall to a certain extent and contributed to the removal of pollutants from upstream regions, which is beneficial to the air quality of Shanghai.
1 Introduction
Aerosols can act as cloud condensation nuclei (CCN) and ice nuclei (IN) to alter cloud microphysical properties, such as droplet phase, size, number, and liquid water content (LWC), and thereby indirectly affect rainfall and climate (Andreae and Rosenfeld, 2008; Berg et al., 2011; Hudson and Noble, 2014a; Hudson and Noble, 2014b; Altaratz et al., 2014; Rosenfeld et al., 2019). Given stable LWC, aerosols play an important role in increasing CCN of warm clouds by raising cloud droplet number concentration (Nc) and reducing droplet effective radius (Twomey, 1977), thus elongating cloud lifetime and enlarging cloud cover (Albrecht 1989). Aerosols can also provide IN to impact the heterogeneous nucleation of cold clouds (Lopez and Avila, 2013; Kohn et al., 2016). Due to the complexity of aerosol-cloud interactions, aerosol-radiation-cloud feedbacks remain uncertain in predicting global climate change (IPCC, 2022).
The vertical distributions of aerosols and clouds are crucial to understand aerosol-cloud interactions and evaluate aerosol direct and indirect radiative forcing (Gobbi et al., 2004; Landman, 2010). Various projects used in-situ aircraft measurements with high temporal and spatial resolutions to explore the vertical and horizontal heterogeneity of aerosols and clouds (Schnitzhofer et al., 2009), for example, the Aerosol Characterization Experiment over the Southern Ocean (Bates et al., 1998; Raes et al., 2000; Huebert et al., 2003), the Intercontinental Chemical Transport Experiment over North America (Singh et al., 2006; Singh et al., 2009), and the Observations of Aerosols Above Clouds and Their Interactions over the Southeast Atlantic basin (Redemann et al., 2021). Aircraft measurements also contribute to the understanding of sources and transport of aerosols. For example, Yang J. M. et al. (2020) pointed out that the vertical stratification of aerosol and CCN spectrum is attributed to aerosols at different layers originating from various sources based on aircraft observation in Shanxi, China. Adachi et al. (2021) found that the sources, transport, and aging of Arctic aerosols vary depending on altitude and air-mass history during the Polar Airborne Measurements and Arctic Regional Climate Model Simulation Project 2018. In addition, such measurements provide insights into cloud microphysics. Allen et al. (2011) reported that Nc is well correlated with accumulation aerosols with sizes larger than 0.15 μm at low supersaturations in the South East Pacific during the VAMOS Ocean-Cloud-Atmosphere-Land Regional Experiment. Earle et al. (2011) found that polluted clouds have a narrower droplet size spectrum, higher Nc, and higher albedo compared to clean clouds throughout the Indirect and Semi-Direct Aerosol Campaign. Zhao et al. (2018) found larger values of LWC in averaged profiles under polluted than clean conditions and a robust negative relationship between aerosol and cloud effective radius under constant LWC in Hebei, China.
Weather modification is an effective approach for altering small-scale weather. The most common form of weather modification is cloud seeding, which is used for precipitation enhancement, hail suppression, fog prevention, etc. (Kenneth, 1996). Silver iodide (AgI) and salt are the most widely used glaciogenic and hygroscopic seeding agents in weather modification (Marcolli et al., 2016). The vertical feature of aerosols and clouds is important for evaluating the seeding conditions of clouds and estimating their seeding efficiency (Guo and Zheng, 2010), and differences in cloud microphysics are often observed after cloud seeding. For example, the Seeded and Natural Orographic Wintertime clouds: the Idaho Experiment performed ground-based, remote sensing, and aircraft observations on clouds in Wyoming and Idaho and observed the changes in radar reflectivity and cloud microphysics inside and outside the seeding line (French et al., 2018; Tessendorf et al., 2019). Sun et al. (2017) found that the effective diameters of cloud droplets enlarged, and their size spectra widened and dispersed after seeding in Hebei, China. Dong et al. (2020) reported spherical liquid droplets were dominant before cloud seeding, but a large number of ice crystals with shapes of needle, plate, and columns appeared after seeding.
Recently, artificial precipitation, along with emission reduction, has often been used to mitigate urban air pollution through wet scavenging in China, especially during severely polluted days (Sun et al., 2019; Zhao et al., 2019). To guarantee good air quality during the Third China International Import Expo held in Shanghai from 5 to 10 November 2020, the government took measures to reduce local emissions in targeted regions and potential sources according to forecasts of air pollutants between 20 October and 10 November and applied artificial precipitation operations to alleviate external pollutants from upstream before they arrived at Shanghai. This paper presents aircraft measurements over southern Anhui to examine the vertical distributions and variations of aerosols, CCN, and cloud droplets before and after the artificial precipitation experiment. The goal is to provide insights into the vertical microphysical characteristics of aerosols and clouds and the combined effects of natural, anthropogenic and man-made aerosols on clouds. The results will help understand aerosol-cloud interactions and evaluate the potential impacts of particulate pollutants transported from upstream regions on downstream cities.
2 Material and methods
2.1 Aircraft platform and seeding campaign
The aircraft platform used to detect aerosols and cloud droplets consists of an airplane (King-Air 350) and several onboard instruments manufactured by Droplet Measurement Technology of the United States. Their probes and functions are listed in Table 1. The Cloud Droplet Probe (CDP) can detect 2–50 µm liquid cloud droplets or particles (30 bins). The Cloud Imaging Probe (CIP) can detect ice crystals and big cloud droplets ranging from 25 to 1550 µm (25 bins). The Cloud Condensation Nuclei Counter can measure CCN number concentrations at various supersaturation levels. The Passive Cavity Aerosol Spectrometer Probe (PCASP) can detect particles ranging from 0.1 to 3 µm (30 bins). In addition, the Aircraft-Integrated Meteorological Measurement System was employed to collect ambient temperature, relative humidity, wind speed, wind direction, and other meteorological factors.
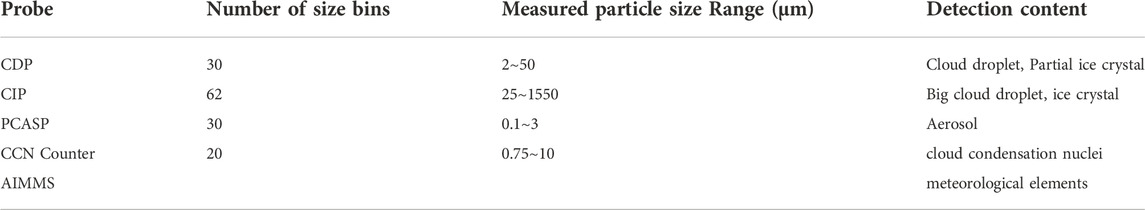
TABLE 1. Aircraft platform and onboard instruments.
Figure 1 shows a 3-D full flight track and its vertical view over southern Anhui on 1 November. The airplane took off from the Jiuhuashan airport (117.68°E, 30.74°N) at 14:24 local time (henceforth, LT)and then flew horizontally at 2000 m height towards Huangshan between 14:34 LT and 14:46 LT. After that, the airplane spiraled up to a maximum altitude of 5679 m, during which it passed through four cloud layers, a low layer at 970–1000 m, a middle layer at 2240–2500 m, a mid-high layer at 3400–4050 m, and a high layer at 4350–5400 m (Figure 1A). Later, the airplane started to conduct artificial seeding for precipitation enhancement at 15:06 LT, with an approximately horizontal “8”-shape cross closed track (A-B-C-D-B1-E-A) around 5000 m (Figure 1B). The artificial seeding lased two circles with nearly the same trajectory. According to records, freezing occurred on the airplane wings above 5300 m at 15:13 LT, and heavy icing appeared at 15:19 LT, indicating abundant supercooled water within high clouds. During the flight, air temperatures were −4 ∼ −6°C within seeded clouds. The seeding operation released 40 AgI strips (seeding agent), about 1440 g in total, with a burning time of 16 min for each one. The seeding experiment finished at 16:07 LT, and subsequently, the airplane returned to the airport.
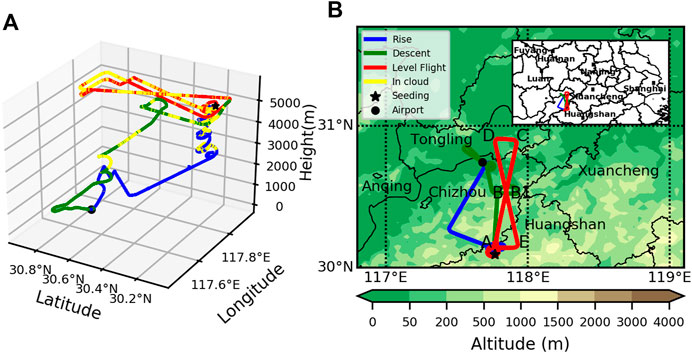
FIGURE 1. (A) Flight trajectory and (B) its vertical view over southern Anhui on 1 November 2020. Blue line is ascent track, red line is horizontal flight and green line is descent track. Color shading represents the terrain heights using NOAA data (https://www.ngdc.noaa.gov). A, C, D, E are four turning points, and B, B1 is overlapped points on the track.
2.2 Data and methodology
The cloud properties, such as cloud top height, brightness temperature, cloud type, and cloud phase, were obtained from Himawari-8 (https://www.eorc.jaxa.jp) and FY-4 (http://data.nsmc.org.cn) satellites. The quality of precipitation datasets have been greatly improved in Integrated Multisatellite Retrievals for GPM (IMERG) which provides seamless precipitation estimates at 0.1 × 0.1 grid every half hour (https://gpm.nasa.gov/data). Reanalysis data were from the National Centers for Environmental Prediction (https://psl.noaa.gov/data). Aerosol optical depth (AOD) at 550 nm and aerosol classification data were from the version 2 Modern-Era Retrospective Analysis for Research and Applications (MERRA-2, https://disc.gsfc.nasa.gov). MERRA-2 provides five types of aerosols at 72 terrain-following hybrid σ–p model layers, including dust and sea salt in five bins, sulfate, organic carbon, and black carbon (Buchard et al., 2017; Randles et al., 2017). Since this study focuses on submicron aerosols, here we only calculate the first two bins of dust and sea salt. The mass concentrations of PM2.5 were obtained from the China National Environmental Monitoring Center (https://www.cnemc.cn).
Based on particle size, the droplets less than 50 μm measured by CDP are defined as small cloud droplets, and their number concentrations and effective diameters are recorded as Nc (cm−3) and Dc (μm). The droplets larger than 50 μm measured by CIP are defined as big cloud droplets, and their number concentrations and effective diameters are recorded as Ncip (m−3) and Dcip (μm). The droplets larger than 100 μm can be treated as ice crystals (Dong et al., 2021). Due to the low accuracy of the first bin (0.1–0.11 μm), it was excluded from the total measurements of PCASP, so aerosols mainly include accumulation (0.11–1 μm) and coarse (1–3 μm) particles. In clouds, aerosol detection by PCASP reveals more uncertainty compared to outside clouds due to supersaturation conditions, where part of particles can act as CCN and convert into cloud droplets (Kleinman et al., 2012; Yang et al., 2019). To avoid errors, we screened the data observed inside clouds in the following analysis of aerosol vertical distributions. The profiles of vertical data were averaged at an interval of 50 m.
Previous studies have proposed many cloud mask algorithms to detect clouds, such as Nc > 10 cm−3 (Rangno and Hobbs, 2005), LWC >0.01 g m−3 (Gultepe et al., 1996), and Nc > 0.1 cm−3 and LWC >0.0005 g m−3 (Gultepe and Isaac, 2004). To eliminate the influence of large aerosol particles on Nc measurements, we used the method of Zhang et al. (2011) to identify cloud appearance, namely thresholds of Nc > 10 cm−3 and LWC >0.001 g m−3.
3 Results and discussion
3.1 Synoptic situation and cloud macro physical properties
Precipitation occurred on 1 November over southern Anhui. One cold vortex originating from northeast areas moved southward and strengthened the transport of cold air and water vapor, meanwhile a low-level convergence enhanced in east China. Wind shear at 850 hPa caused strong upward air motion at this level. The targeted area is located in the westerlies, controlled by winds primarily from west and southwest at 500 hPa with wind speeds about 20 ms−1, and the relative humidity was above 90% (Figure 2). Affected by the wind direction, the seeded clouds moved eastward.
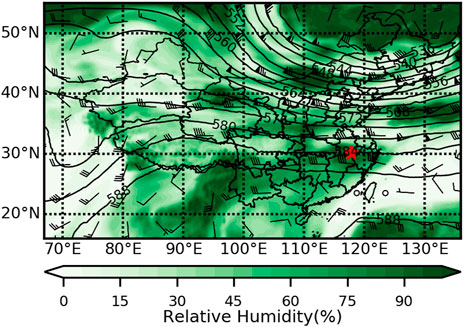
FIGURE 2. 500 hPa geopotential height (black contour), wind (barb) and relative humidity (green shading) fields on 1 November 2020. Red star is the flight area.
Figure 3 shows the spatial distribution of PM2.5 concentrations and AOD on 1 November. Ground-based observations indicated that Henan and northern Anhui were slightly polluted with PM2.5 of 75–115 μg m−3. A possible reason is that air pollution was mainly concentrated in metropolitan areas and heavy industry areas (Miao et al., 2022). The pollutants from these regions can be transported eastward to downstream cities such as Shanghai. High AOD values ranging from 1.2 to 1.6 were found in one belt from southwest to northeast, corresponding to the airflow field at 500 hPa.
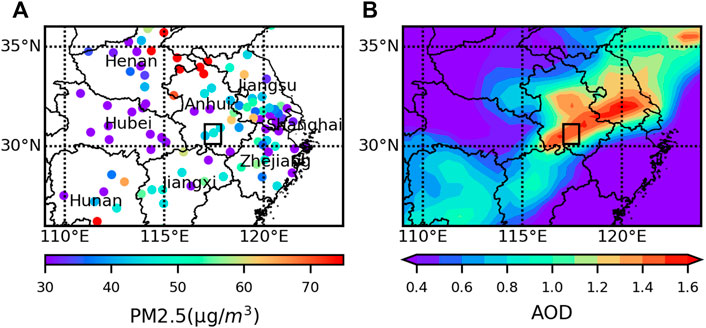
FIGURE 3. Spatial distributions of (A) surface PM2.5 concentrations and (B) AOD (550 nm) at 15:00 LT on 1 November 2020. The black box refers to the flight area.
Figure 4 presents cloud macro properties at 15:00 LT on 1 November. According to images of Himawari-8, the cloud cluster covered the belt with high AOD (Figure 3B). The clouds over southern Anhui were dominated by altostratus and nimbostratus (Figure 4A) with cloud top height about 6500 m (Figure 4B). The brightness temperature was −6 ∼ −12°C (Figure 4C). The corresponding cloud phase products of the FY-4 satellite implied the existence of abundant supercooled water in clouds.
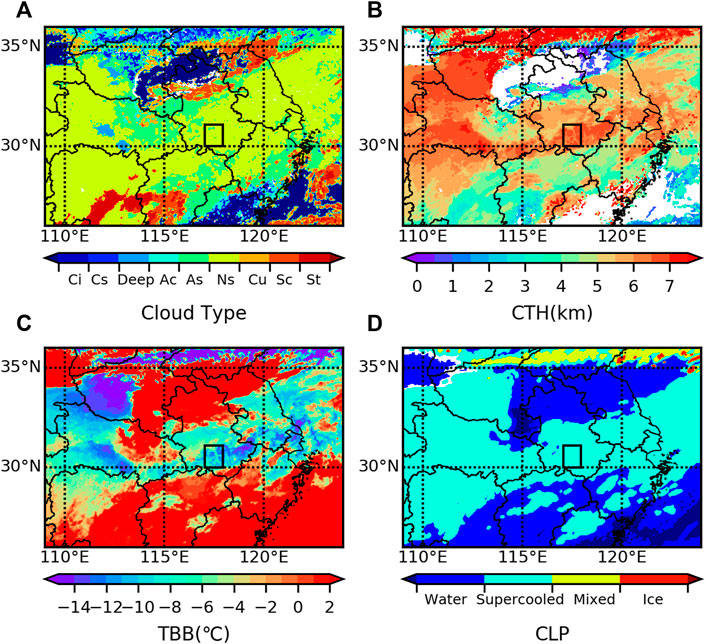
FIGURE 4. (A) Cloud types including cirrus (Ci), cirrostratus (Cs), deep convection cloud (Deep), altocumulus (Ac), altostratus (As), nimbostratus (Ns), cumulus (Cu), stratocumulus (Sc) and stratus (St), (B) Cloud top height (CTH) and (C) Brightness temperature (TBB) of Himawari-8 satellite, and (D) Cloud phase of FY-4 satellite at 15:00 LT on 1 November 2020. The black box refers to the flight area.
3.2 Vertical distribution of aerosols
Spatial-temporal variations of aerosol composition, size, and concentrations can be influenced by emissions, atmospheric advection and diffusion, conversion of gaseous precursors, and aging processes (Quan et al., 2015; Zhang et al., 2015). Figures 5A–E shows vertical distributions of aerosol particles. Aerosols exhibited vertical stratification and heterogeneity. Large amounts of aerosols were constrained below 1050 m, near the top of the boundary layer, indicating that the upward transmission of aerosols to the free troposphere was limited (Figure 5B). In general, aerosol number concentration (Na) decreased with increasing altitude below the bottom of the low-level clouds (1050 m), while aerosol effective diameter (Da) keeped stablewith an average of 0.12 μm near the surface (Figure 5C). Since aerosols in the lower atmosphere mainly originate from local emissions, especially under unfavorable dilution conditions, their properties are complex and greatly affected by anthropogenic activities. Sulfate and organic aerosols made up a large fraction of aerosol mass in the lower atmosphere (Figure 6), where aerosols mainly consist of primary and secondary aerosols generated through gas-to-particle conversion (Jimenez et al., 2009; Li et al., 2015; Li et al., 2018). Da showed an evident maximum between 2500 and 3000 m with an maximum of 1.72 μm (Figure 5C). However, above 3000 m, dust took a higer proportion, Da was smaller than 2500–3000 m. The possible reason is particle hygroscopicity under high ambient humidity, where an obviously positive correlation (r = 0.58) exists between Da and supersaturation rate (Figure 7). At other cloudless atmospheric layers, Na declined slightly with altitude, while Da remained nearly unchanged. Figure 8 shows the mean aerosol size spectrum observed in five cloudless atmospheric layers. Clearly, fine particles, especially particles with sizes of less than 0.15 μm, predominated at all altitudes. The peak of the unimodal spectrum centers at 0.12 μm. Accumulation mode aerosols account for up to 98% of total number concentrations. Such a result is similar to Hao et al. (2017), in which they found that accumulation mode aerosols accounted for more than 95% during August 2014 over Anhui Province.
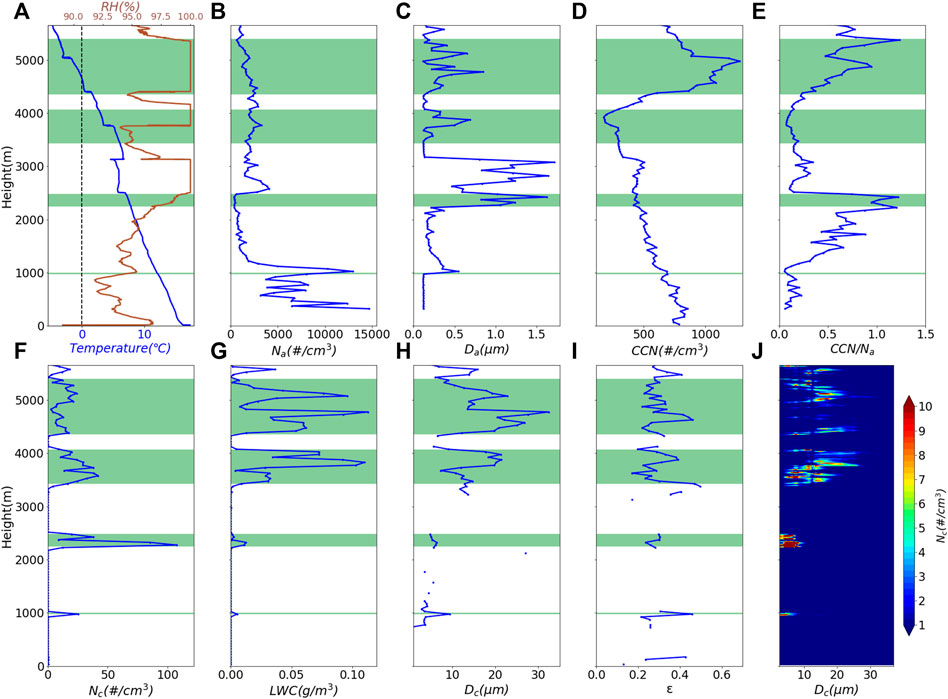
FIGURE 5. Vertical distributions of (A) temperature (blue line) and relative humidity (RH, brown line), (B) aerosol number concentration (Na, cm–3), (C) aerosol effective diameter (Da, µm), (D) CCN at 0.2% supersaturation and (E) CCN/Na ratios, (F) cloud droplet number concentration (Nc, cm−3), (G) liquid water content (LWC, g m−3), (H) cloud droplet effective diameter (Dc, µm), (I) relative dispersion rate (ε) and (J) size spectrum of cloud particles on 1 November 2020. The green shading denotes cloud layers.
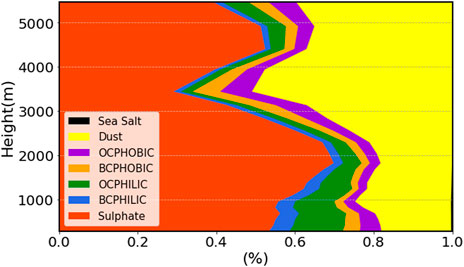
FIGURE 6. Relative fractions of aerosol composition types as a function of altitude (PHOBIC: hydrophobic, PHILIC: hydrophilic).

FIGURE 7. Linear relationship between aerosol effective diameter (Da, µm), supersaturation ratio and CCN/Na ratios in 2500–3000 m.
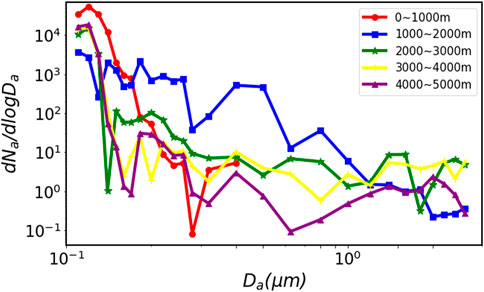
FIGURE 8. Aerosol size spectrum at different cloudless heights.
3.3 CCN vertical distribution
Aerosols from several large-scale industrial districts in southern Anhui have been found to have a high hygroscopic growth ability (He et al., 2016). Figure 5D shows vertical distributions of CCN concentrations at a 0.2% supersaturation level. CCN concentrations decreased with altitude from the ground until 4000 m and increased sharply at higher levels. The ratio of CCN to Na represents the activation ability of aerosols to become CCN under certain supersaturation conditions. Note that due to the detection limit of instruments, the absence of particles with sizes less than 0.1 μm or greater than 3 μm may result in somewhat underestimation for Na and CCN/Na exceeding 1.0 at various altitudes. Aerosol CCN activation is known to be closely related to aerosol size, composition, mixing state, and ambient humidity (McFiggans et al., 2006; Bauer and Menon, 2012; Farmer et al., 2015; Kanji et al., 2017). It is also known that aerosol chemical composition and the initial periods of activation play important roles in aerosol CCN activation under low supersaturation conditions, particularly for fine particles with low-hygroscopicity, such as primary organic aerosol (Zhang et al., 2012). However, aerosol CCN activation depends on aerosol size more under high supersaturation ratio due to strong hygroscopicity (Figure 7).
In terms of CCN/Na and Da, the cloudless atmosphere can be divided into three layers below 5300 m. Below 2200 m, CCN/Na increased with altitude and reached the maximum at 2200 m (Figure 5E). CCN/Na was lowest within the boundary layer (Figure 5E), where aerosols were mainly composed of sulfate and hydrophilic organic carbon with Da less than 0.12 μm (Figure 6). Moreover, hydrophobic organic aerosols (i.e., black carbon and soot) from local emissions are difficult to activate into CCN (Zhang et al., 2017; Yu et al., 2022). The CCN ability of low-hygroscopic organic aerosols can be significantly enhanced under pollution due to their mixing with local and regional pollutants (Hu et al., 2020). Between 2200 and 3000 m, CCN/Na was stable. Above 3000 m, CCN began to increase and CCN/Na was relatively higher than the boundary layer due to a higher proportion of dust transported from upstream regions (Figure 6). Li and Shao. (2009) reported that aerosol aging and secondary material generation occur in long-distance transportation of air mass. Dust hygroscopicity increases after its aging, and aged dust aerosol become activated to be CCN in the atmosphere (Tang et al., 2015).
3.4 Cloud vertical distribution
The zero level (0°C) of ambient temperature appeared at 4650 m (Figure 5A). There were four layers of clouds located at different heights in the atmosphere (Figure 1A, Figure 5). Specifically, the maximum Nc was 125 cm−3 at 2284 m in the mid-level clouds (Figure 5F), and the maximum Dc was 34.25 μm at 4777 m in the high-level clouds (Figure 5H). Overall, inside each cloud layer, Nc and Dc increased with altitude and reached the maximum in the middle, and then decreased with altitude until the cloud top. Such variability is related to the entrainment of drier air from the environment that induces fewer cloud droplets by promoting evaporation (Freud et al., 2011).
The low-level clouds at the top of the boundary layer were very thin, with a mean Nc of 25.21 cm−3 (Figure 5F). At this level, a large number of fine particles uplifted from the boundary layer are difficult to grow into large cloud droplets due to the competition for limited water vapor (Yuan et al., 2008; Grandey and Stier, 2010), and therefore, cloud droplets sizes were small, with a maximum Dc of 12 μm (Figure 5H). The mid-level cloud layer was also thin, but the maximum Nc and the minimum Dc appeared here approximately 107.7 cm−3 and 4.03 μm, respectively. According to Swietlicki et al. (2008), hygroscopic particles are mainly composed of inorganic salts like sulfates. The average CCN/Na of aerosols was about 0.78 at 200 m below the mid-level cloud base (Figure 5E). Sulfate accounted for 69.8% of the aerosol mass (Figure 6), indicating that the aerosol particles here have a high ability of hygroscopic growth to activate into cloud droplets when entrained into the cloud, resulting in more cloud droplets with smaller size (Jones et al., 1994; Ishizaka and Adhikari, 2003). The mean Nc and Dc of the mid-high level clouds were 24.73 cm−3 and 16.46 μm, respectively, while they were 12.54 cm−3 and 16.65 μm in the high-level clouds. Although the mid-high and high-level clouds had relatively low cloud droplet loading, their Dc was relatively larger due to sufficient LWC and lower temperature.
Both cloud droplet size spectra in the low- and mid-level clouds showed a single peak at 5 μm, and no droplets greater than 12 μm appeared (Figure 5J). By contrast, in the mid-high layer cloud, the spectra showed a bimodal pattern, with the first peak at 8 μm and the second peak at 15 μm. Moreover, a trimodal pattern with peaks at 7 μm, 12 μm, and 17 μm appeared in the high-level clouds. Relative dispersion rate (ε), defined as the ratio of the standard deviation of cloud droplet size spectrum and average radius of cloud droplets, is used to illustrate the relative spectral width of cloud droplet spectrum. It is usually linked with the physical and chemical properties of aerosols, related activation process and hygroscopic growth (Ma et al., 2010; Wang et al., 2019), the development stage of clouds, atmospheric temperature, humidity, entrainment process, and turbulence (Lu et al., 2013). A positive correlation was found between the relative dispersion rate and Dc (Figures 5H,I, r = 0.78). In addition to the coalescence process (Liu and Daum, 2002; Pandithurai et al., 2012), the appearance of ice crystals with large sizes also increases cloud droplet inhomogeneity which leads to a broadening cloud droplet size spectrum in higher cloud layers.
3.5 Impacts of artificial seeding on cloud and precipitation
To examine cloud evolution during the artificial seeding experiment, we compared the cloud microphysical properties detected by CDP and CIP (Figure 9). The cloud seeding began at 15:06 LT. Before that, cloud droplets smaller than 25 μm prevailed, accounting for about 97%, and cloud droplets greater than 50 μm hardly existed. The size spectra of cloud droplets showed a trimodal pattern, with the first peak at 7 μm, the second at 12 μm, and the third at 17 μm, indicating sufficient supercooled water in clouds. Moreover, there was a negative relation between Dc and Nc, indicating that the effect of strong coalescence caused some small cloud droplets to convert into large droplets and ice crystals. The man-made ice nuclei seeded into the clouds grew through the Wegener–Bergeron–Findeisen mechanism (Wegener, 1911; Bergeron, 1935; Findeisen, 1938). Supercooled water droplets were converted into ice crystals, resulting in the evaporation and dissipation of small cloud droplets and the formation of large cloud droplets or ice crystals (Figure 10).
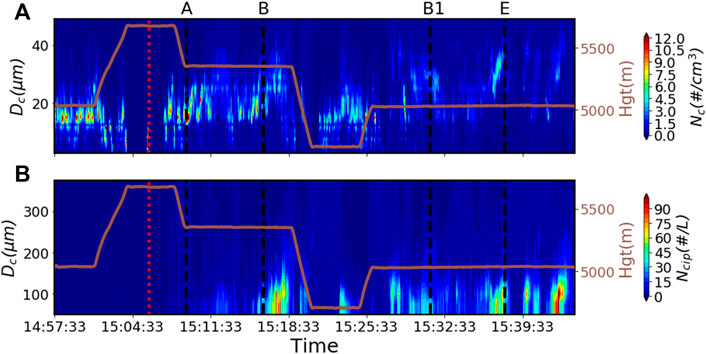
FIGURE 9. Size spectra of cloud droplets before and after cloud seeding measured by (A) Cloud Droplet Probe (CDP) and (B) Cloud Imaging Probe (CIP). The red dotted line refers to seeding start time, the black dashed lines correspond to the routes of A–B and B1–E marked in Figure 1.
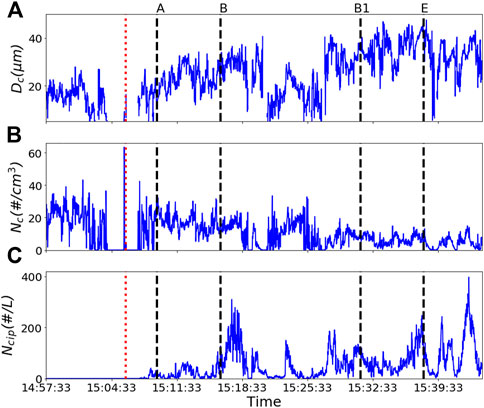
FIGURE 10. Time series of (A) cloud droplet effective diameter (Dc, µm), (B) cloud droplet number concentration (Nc, cm−3) and (C) big cloud droplet and ice crystals number concentration (Ncip, cm−3). The red dotted line refers to seeding start time, the black dashed lines correspond to the routes of A-B and B1-E.
Considering the horizontal movement of air mass near the flight track line, seeding agent diffusion, and cloud spatial inhomogeneity, we selected the A–B and B1–E sub-tracks (Figure 1B) to compare changes in clouds before and after artificial seeding. Before seeding, mean Nc and Dc were 20.87 cm−3 and 15.98 μm, respectively, and CIP almost detected nothing. After seeding, the mean Nc reduced to 16.62 cm−3 in the A-B sub-track and 6.36 cm−3 in the B1-E sub-track, while the mean Dc was raised to 23.33 μm and 38.90 μm in these stages. Meanwhile, the mean Ncip increased slightly to 20 L−1 and 70 L−1 in two sub-tracks. Especially, cloud droplets bigger than 25 μm increased significantly from 3% to 16% in the A-B sub-track and to 56% in the B1-E sub-track, indicating a broader cloud droplet size spectrum because of condensation growth. The initiation of precipitation is often considered to occur when Rc exceeds 12–14 μm (Rosenfeld et al., 2012; Bera et al., 2016; Braga et al., 2017), corresponding to Dc of 24–28 μm (Sheng et al., 2022). During this experiment, Nc decreased while Dc increased, owing to the AgI agent that worked as artificial ice nuclei to enhance the condensation growth of cloud droplets. Ice crystals continued to grow and formed ice crystal coagulation through condensation, riming, and collision, thus widening the cloud droplet size spectrum (Rosenfeld and Bell, 2011; Chen et al., 2017; Lerach and Cotton, 2018). In this conversion process, latent heat was released due to seeding-induced glaciation to strengthen updraft in clouds, and thereby some cloud droplets and ice crystals were brought to higher levels.
Satellites provide products with high spatio-temporal resolutions to examine cloud and precipitation changes in real situation (Rosenfeld et al., 2019; Yue et al., 2019). Reananlysis data can be regard as the case of cloud and precipitation not influenced by cloud seeding. We calculate the 1-h air-moving influence area affected by the seeding agent through advection and diffusing with wind speed about 20 m s−1 above 5000 m. Figure 11 shows the cloud droplet effective radius observed by the Himawari-8 satellite at 15:00 LT (before seeding) and at 16:00 LT (after seeding). Before seeding, cloud droplets smaller than 20 μm predominated, and droplets greater than that only accounted for 5%. After seeding, cloud droplets larger than 20 μm increased notably up to 15% over downstream regions. In Figure 12, the spatial average of hourly precipitation over air-moving influence area is stable around 0.2 mm based on reanalysis data. However, comparing with satellite products, an obviously increment of precipitation shows after cloud seeding (15:00 LT) with maximum up to 1.05 mm. On the whole, the artificial precipitation experiment enhanced rainfall, reduced cloud cover, and contributed to the removal of pollutants from the atmosphere through wet scavenging, which was beneficial to the air quality in the downstream regions (e.g., Shanghai). Previous studies have shown that precipitation has a significant wet removal effect on aerosols of different sizes, especially fine particles (Zhao et al., 2015; Guo et al., 2016). Lu et al. (2019) analyzed the PM2.5 removal effect by precipitation with different intensities and duration, raindrops spectrum, and wind speeds and found that strong precipitations often exert higher removal rates on aerosols. Since Huangshan, Xuancheng, and Nanjing are located downstream of the seeding operation area (Figure 1B), air quality in these cities was improved by the experiment. PM2.5 decreased since 15:00 LT in Huangshan and then followed with a 1 hour interval in Xuancheng and Nanjing, respectively (Figure 13A), corresponding to the air-moving influence area. Comparing with PM2.5 before cloud seeding, it decreased by 23%, 18% and 26% at most in Huangshan, Xuancheng, and Nanjing, respectively. However, PM2.5 of Fuyang, Huaian, and Luan located in northern Anhui, out of the seeding operation area, was at high levels and worsening (Figure 13B). This result demonstrated that the artificial seeding experiment could reduce pollutants by wet scavenging and mitigate pollution in downstream regions efficiently. It is worth noting that how to more quantitatively evaluate the contribution of artificial seeding precipitation and natural rainfall to the removal of pollutants is an issue that warrants further studies.
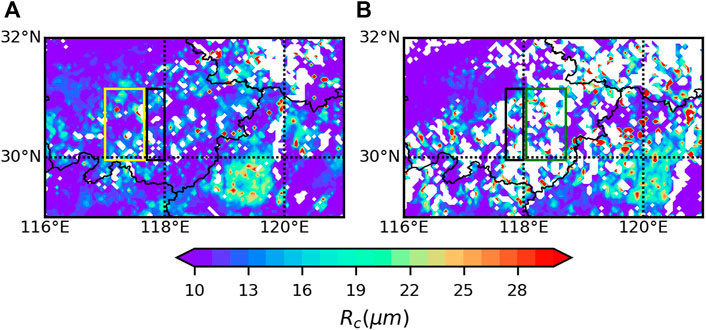
FIGURE 11. Cloud droplet effective radius (Rc) before and after seeding detected by Himawari-8 satellite at (A)15:00 LT and (B)16:00 LT. The black box refer s to seeding area, the yellow box is upstream area without seeding influence, and the green box is downstream area influenced by seeding.
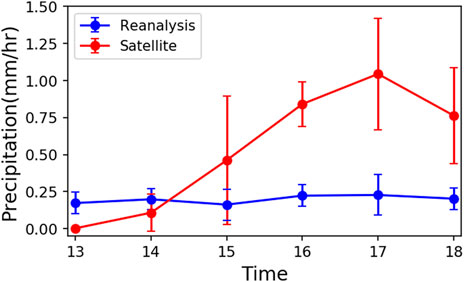
FIGURE 12. Comparison of spatial average precipitaion over 1-h air-moving influence area between reanalysis and satellite data.
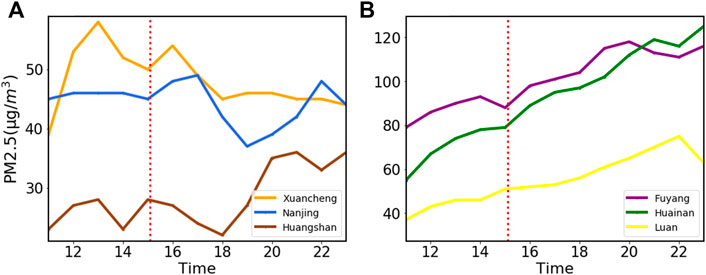
FIGURE 13. Time series of PM2.5 in different cities in areas (A) with and (B) without artificial seeding influence. The red dotted line is seeding start time.
4 Conclusion
Aircraft observations and an artificial precipitation experiment were conducted over the upstream regions of Shanghai on 1 November 2020 during the Third China International Import Expo. This fieldwork provided a valuable opportunity to study the vertical characteristics of aerosols and clouds and how they were impacted by cloud seeding. Aerosols, CCN, and cloud droplets exhibited vertical stratification, with most aerosols constrained within the boundary layer. Note that aerosol size, chemical composition, mixing state, and ambient humidity all play important roles in CCN activation. During the observation, CCN decreased continuously with altitude until 2200 m and began to increase significantly at a higher altitude due to aerosol aging during long-distance air mass transportation. Nc and Dc were close related to hygroscopic particles, which are sensitive to relative humidity changes. The artificial precipitation operation led to evident changes in cloud microphysical properties. The Wegener–Bergeron–Findeisen mechanism within clouds after artificial precipitation experiment caused the transformation of supercooled liquid water freezing into ice droplets manifesting as the decrease of Nc and the increase of Dc and big cloud droplets, and cloud seeding of man-made aerosols caused precipitation enhancement. The artificial precipitation experiment played a positive role in the removal of atmospheric pollutants due to wet scavenging to hamper their potential harm to the air quality in downstream regions. The result here was that PM2.5 was below 50 μg m−3 in the downstream areas after cloud seeding. Although such results can be expected, how to identify and quantify cloud seeding conditions, accurately evaluate the effects of artificial precipitation, and estimate the role of background natural aerosols warrant further investigation.
Data availability statement
The original contributions presented in the study are included in the article/supplementary material, further inquiries can be directed to the corresponding authors.
Author contributions
YY and TC conceived the idea and designed the study. QH, YG, XUZ, RZ, XIZ, WW, and HL processed and analyzed the datasets, and YY and QZ performed the relevant statistical analysis. YY wrote the first draft of the manuscript. All authors contributed to manuscript revision, read, and approved the submitted version.
Funding
This research was supported by the National Natural Science Foundation of China (42175179, 41775129) and the Natural Science Foundation of Shanghai (22ZR1404000).
Acknowledgments
We thank reviewers for their helpful suggestions.
Conflict of interest
The authors declare that the research was conducted in the absence of any commercial or financial relationships that could be construed as a potential conflict of interest.
Publisher’s note
All claims expressed in this article are solely those of the authors and do not necessarily represent those of their affiliated organizations, or those of the publisher, the editors and the reviewers. Any product that may be evaluated in this article, or claim that may be made by its manufacturer, is not guaranteed or endorsed by the publisher.
References
Adachi, K., Oshima, N., Ohata, S., Yoshida, A., Moteki, N., and Koike, M. (2021). Compositions and mixing states of aerosol particles by aircraft observations in the Arctic springtime. Atmos. Chem. Phys. 21 (5), 3607–3626. doi:10.5194/acp-21-3607-2021
Albrecht, B. A. (1989). Aerosols, cloud microphysics, and fractional cloudiness. Science 245 (4923), 1227–1230. doi:10.1126/science.245.4923.1227
Allen, G., Coe, H., Clarke, A., Bretherton, C., Wood, R., Abel, S. J., et al. (2011). South East Pacific atmospheric composition and variability sampled along 20° S during VOCALS-REx. Atmos. Chem. Phys. 11 (11), 5237–5262. doi:10.5194/acp-11-5237-2011
Altaratz, O., Koren, I., Remer, L. A., and Hirsch, E. (2014). Review: Cloud invigoration by aerosols-Coupling between microphysics and dynamics. Atmos. Res. 140, 38–60. doi:10.1016/j.atmosres.2014.01.009
Andreae, M. O., and Rosenfeld, D. (2008). Aerosol-cloud-precipitation interactions. Part 1. The nature and sources of cloud-active aerosols. Earth-Science Rev. 89 (1-2), 13–41. doi:10.1016/j.earscirev.2008.03.001
Bates, T. S., Huebert, B. J., Gras, J. L., Griffiths, F. B., and Durkee, P. A. (1998). International global atmospheric chemistry (IGAC) project's first aerosol characterization experiment (ACE 1): Overview. J. Geophys. Res. 103 (D13), 16297–16318. doi:10.1029/97jd03741
Bauer, S. E., and Menon, S. (2012). Aerosol direct, indirect, semidirect, and surface albedo effects from sector contributions based on the IPCC AR5 emissions for preindustrial and present-day conditions. J. Geophys. Res. 117. doi:10.1029/2011jd016816
Bera, S., Prabha, T. V., and Grabowski, W. W. (2016). Observations of monsoon convective cloud microphysics over India and role of entrainment-mixing. J. Geophys. Res. Atmos. 121, 9767–9788. doi:10.1002/2016JD025133
Berg, L. K., Berkowitz, C. M., Barnard, J. C., Senum, G., and Springston, S. R. (2011). Observations of the first aerosol indirect effect in shallow cumuli. Geophys. Res. Lett. 38, L03809. doi:10.1029/2010GL046047
Bergeron, T. (1935). On the physics of clouds and precipitation. Proces Verbaux de l’Association de Météorologie, International Union of Geodesy and Geophysics, 156–178.
Braga, R. C., Rosenfeld, D., Weigel, R., Jurkat, T., Andreae, M. O., Wendisch, M., et al. (2017). Further evidence for CCN aerosol concentrations determining the height of warm rain and ice initiation in convective clouds over the Amazon basin. Atmos. Chem. Phys. 17, 14433–14456. doi:10.5194/acp-17-14433-2017
Buchard, V., Randles, C. A., da Silva, A. M., Darmenov, A., Colarco, P. R., Govindaraju, R., et al. (2017). The MERRA-2 aerosol reanalysis, 1980 Onward. Part II: Evaluation and case studies. J. Clim. 30 (17), 6851–6872. doi:10.1175/jcli-d-16-0613.1
Chen, Q., Koren, I., Altaratz, O., Heiblum, R. H., Dagan, G., and Pinto, L. (2017). How do changes in warm-phase microphysics affect deep convective clouds? Atmos. Chem. Phys. 17 (15), 9585–9598. doi:10.5194/acp-17-9585-2017
Dong, X. B., Zhao, C. F., Huang, Z. C., Mai, R., Lv, F., Xue, X. W., et al. (2021). Increase of precipitation by cloud seeding observed from a case study in November 2020 over Shijiazhuang, China. Atmos. Res. 262, 105766. doi:10.1016/j.atmosres.2021.105766
Dong, X. B., Zhao, C. F., Yang, Y., Wang, Y., Sun, Y., and Fan, R. (2020). Distinct change of supercooled liquid cloud properties by aerosols from an aircraft-based seeding experiment. Earth Space Sci. 7 (8), 1196. doi:10.1029/2020ea001196
Earle, M. E., Liu, P. S. K., Strapp, J. W., Zelenyuk, A., Imre, D., McFarquhar, G. M., et al. (2011). Factors influencing the microphysics and radiative properties of liquid-dominated Arctic clouds: Insight from observations of aerosol and clouds during ISDAC. J. Geophys. Res. 116, D00T09. doi:10.1029/2011jd015887
Farmer, D. K., Cappa, C. D., and Kreidenweis, S. M. (2015). Atmospheric processes and their controlling influence on cloud condensation nuclei activity. Chem. Rev. 115 (10), 4199–4217. doi:10.1021/cr5006292
Findeisen, W. (1938). Kolloid-meteorologische Vorgange bei Neiderschlags-bildung. Meteorol. Z. 55, 121–133.
French, J. R., Friedrich, K., Tessendorf, S. A., Rauber, R. M., Geerts, B., Rasmussen, R. M., et al. (2018). Precipitation formation from orographic cloud seeding. Proc. Natl. Acad. Sci. U. S. A. 115 (6), 1168–1173. doi:10.1073/pnas.1716995115
Freud, E., Rosenfeld, D., and Kulkarni, J. R. (2011). Resolving both entrainment-mixing and number of activated CCN in deep convective clouds. Atmos. Chem. Phys. 11 (24), 12887–12900. doi:10.5194/acp-11-12887-2011
Gobbi, G. P., Barnaba, F., and Ammannato, L. (2004). The vertical distribution of aerosols, Saharan dust and cirrus clouds in Rome (Italy) in the year 2001. Atmos. Chem. Phys. 4, 351–359. doi:10.5194/acp-4-351-2004
Grandey, B. S., and Stier, P. (2010). A critical look at spatial scale choices in satellite-based aerosol indirect effect studies. Atmos. Chem. Phys. 10 (23), 11459–11470. doi:10.5194/acp-10-11459-2010
Gultepe, I., and Isaac, G. A. (2004). Aircraft observations of cloud droplet number concentration: Implications for climate studies. Q. J. R. Meteorol. Soc. 130 (602), 2377–2390. doi:10.1256/qj.03.120
Gultepe, I., Isaac, G. A., Leaitch, W. R., and Banic, C. M. (1996). Parameterizations of marine stratus microphysics based on in situ observations: Implications for GCMs. J. Clim. 9 (2), 345–357. doi:10.1175/1520-0442(1996)009<0345:pomsmb>2.0.co;2
Guo, L. C., Zhang, Y. H., Lin, H. L., Zeng, W. L., Liu, T., Xiao, J. P., et al. (2016). The washout effects of rainfall on atmospheric particulate pollution in two Chinese cities. Environ. Pollut. 215, 195–202. doi:10.1016/j.envpol.2016.05.003
Guo, X. L., and Zheng, G. G. (2010). Atmospheric physics and weather modification (in Chinese). Beijing: China Meteorological Press, 526–527.
Hao, J., Yin, Y., Kuang, X., Chen, J. H., Yuan, L., Xiao, H., et al. (2017). Aircraft measurements of the aerosol spatial distribution and relation with clouds over eastern China. Aerosol Air Qual. Res. 17 (12), 3230–3243. doi:10.4209/aaqr.2016.12.0576
He, Q. S., Zhou, G. Q., Geng, F. H., Gao, W., and Yu, W. (2016). Spatial distribution of aerosol hygroscopicity and its effect on PM2.5 retrieval in East China. Atmos. Res. 170, 161–167. doi:10.1016/j.atmosres.2015.11.011
Hu, D., Liu, D. T., Zhao, D. L., Yu, C. J., Liu, Q., Tian, P., et al. (2020). Closure investigation on cloud condensation nuclei ability of processed anthropogenic aerosols. J. Geophys. Res. Atmos. 125, e2020JD032680. doi:10.1029/2020JD032680
Hudson, J. G., and Noble, S. (2014a). CCN and vertical velocity influences on droplet concentrations and supersaturations in clean and polluted stratus clouds. J. Atmos. Sci. 71 (1), 312–331. doi:10.1175/jas-d-13-086.1
Hudson, J. G., and Noble, S. (2014b). Low-altitude summer/winter microphysics, dynamics, and CCN spectra of northeastern Caribbean small cumuli, and comparisons with stratus. J. Geophys. Res. Atmos. 119 (9), 5445–5463. doi:10.1002/2013jd021442
Huebert, B. J., Bates, T., Russell, P. B., Shi, G., Kim, Y. J., Kawamura, K., et al. (2003). An overview of ACE-Asia: Strategies for quantifying the relationships between Asian aerosols and their climatic impacts. J. Geophys. Res. 108 (D23), 8633. doi:10.1029/2003JD003550
Intergovernmental Panel on Climate Change (IPCC) (2022). Climate change 2022: The physical scientific basis. New York: Cambridge University Press.
Ishizaka, Y., and Adhikari, M. (2003). Composition of cloud condensation nuclei. J. Geophys. Res. 108 (D4), 4138. doi:10.1029/2002JD002085
Jimenez, J. L., Canagaratna, M. R., Donahue, N. M., Prevot, A. S. H., Zhang, Q., Kroll, J. H., et al. (2009). Evolution of organic aerosols in the atmosphere. Science 326 (5959), 1525–1529. doi:10.1126/science.1180353
Jones, A., Roberts, D. L., and Slingo, A. (1994). A climate model study of indirect radiative forcing by anthropogenic sulphate aerosols. Nature. 370 (6489), 450–453. doi:10.1038/370450a0
Kanji, Z. A., Ladino, L. A., Wex, H. K., Boose, Y., Burkert-Kohn, M., Cziczo, D. J., et al. (2017). Overview of ice nucleating particles. Meteorol. Monogr. 58, 11–33. doi:10.1175/AMSMONOGRAPHS-D-16-0006.1
Kenneth, Y. (1996). Weather modification—a theoretician's viewpoint. Bull. Am. Meteorol. Soc. 77 (11), 2701–2710. doi:10.1175/1520-0477(1996)077<2701:wmatv>2.0.co;2
Kleinman, L. I., Daum, P. H., Lee, Y. N., Lewis, E. R., Sedlacek, A. J., Senum, G. I., et al. (2012). Aerosol concentration and size distribution measured below, in, and above cloud from the DOE G-1 during VOCALS-REx. Atmos. Chem. Phys. 12 (1), 207–223. doi:10.5194/acp-12-207-2012
Kohn, M., Lohmann, U., Welti, A., and Kanji, Z. A. (2016). Immersion mode ice nucleation measurements with the new Portable Immersion Mode Cooling chAmber (PIMCA). J. Geophys. Res. Atmos. 121 (9), 4713–4733. doi:10.1002/2016jd024761
Landman, W. (2010). Climate change 2007: The physical science basis. South Afr. Geogr. J. 92 (1), 86–87. doi:10.1080/03736245.2010.480842
Lerach, D. G., and Cotton, W. R. (2018). Simulating southwestern U.S. desert dust influences on supercell thunderstorms. Atmos. Res. 204, 78–93. doi:10.1016/j.atmosres.2017.12.005
Li, J. J., Wang, G. H., Wu, C., Cao, C., Ren, Y. Q., Wang, J. Y., et al. (2018). Characterization of isoprene-derived secondary organic aerosols at a rural site in North China Plain with implications for anthropogenic pollution effects. Sci. Rep. 8 (1), 535. doi:10.1038/s41598-017-18983-7
Li, J. X., Yin, Y., Li, P. R., Li, Z. Q., Li, R. J., Cribb, M., et al. (2015). Aircraft measurements of the vertical distribution and activation property of aerosol particles over the Loess Plateau in China. Atmos. Res. 155, 73–86. doi:10.1016/j.atmosres.2014.12.004
Li, W. J., and Shao, L. Y. (2009). Transmission electron microscopy study of aerosol particles from the Brown hazes in northern China. J. Geophys. Res. 114, D09302. doi:10.1029/2008jd011285
Liu, Y. G., and Daum, P. H. (2002). Indirect warming effect from dispersion forcing. Nature 419 (6907), 580–581. doi:10.1038/419580a
Lopez, M. L., and Avila, E. E. (2013). Measurements of natural deposition ice nuclei in Cordoba, Argentina. Atmos. Chem. Phys. 13 (6), 3111–3119. doi:10.5194/acp-13-3111-2013
Lu, C. S., Niu, S. J., Liu, Y. G., and Vogelmann, A. M. (2013). Empirical relationship between entrainment rate and microphysics in cumulus clouds. Geophys. Res. Lett. 40 (10), 2333–2338. doi:10.1002/grl.50445
Lu, T., Guo, X. L., Zhang, T. H., and Guo, L. J. (2019). The scavenging process and physical removing mechanism of pollutant aerosols by different precipitation intensities. J. Appl. Meteorological Sci. 30 (3), 279–291. doi:10.11898/1001-7313.20190303
Ma, J. Z., Chen, Y., Wang, W., Yan, P., Liu, H. J., Yang, S. Y., et al. (2010). Strong air pollution causes widespread haze-clouds over China. J. Geophys. Res. 115, D18204. doi:10.1029/2009jd013065
Marcolli, C., Nagare, B., Welti, A., and Lohmann, U. (2016). Ice nucleation efficiency of AgI: Review and new insights. Atmos. Chem. Phys. 16 (14), 8915–8937. doi:10.5194/acp-16-8915-2016
McFiggans, G., Artaxo, P., Baltensperger, U., Coe, H., Facchini, M. C., Feingold, G., et al. (2006). The effect of physical and chemical aerosol properties on warm cloud droplet activation. Atmos. Chem. Phys. 6, 2593–2649. doi:10.5194/acp-6-2593-2006
Miao, L. Z., Liu, C. L., Yang, X., Kwan, M. P., and Zhang, K. (2022). Spatiotemporal heterogeneity analysis of air quality in the Yangtze River Delta, China. Sustain. Cities Soc. 78, 103603. doi:10.1016/j.scs.2021.103603
Pandithurai, G., Dipu, S., Prabha, T. V., Maheskumar, R. S., Kulkarni, J. R., and Goswami, B. N. (2012). Aerosol effect on droplet spectral dispersion in warm continental cumuli. J. Geophys. Res. 117, D16202. doi:10.1029/2011JD016532
Quan, J. N., Liu, Q., Li, X., Gao, Y., Jia, X. C., Sheng, J. J., et al. (2015). Effect of heterogeneous aqueous reactions on the secondary formation of inorganic aerosols during haze events. Atmos. Environ. 122, 306–312. doi:10.1016/j.atmosenv.2015.09.068
Raes, F., Bates, T., McGovern, F., and Van Liedekerke, M. (2000). The 2nd aerosol characterization experiment (ACE-2): General overview and main results. Tellus B 52 (2), 111–125. doi:10.1034/j.1600-0889.2000.00124.x
Randles, C. A., da Silva, A. M., Buchard, V., Colarco, P. R., Darmenov, A., Govindaraju, R., et al. (2017). The MERRA-2 aerosol reanalysis, 1980 onward. Part I: System description and data assimilation evaluation. J. Clim. 30 (17), 6823–6850. doi:10.1175/jcli-d-16-0609.1
Rangno, A. L., and Hobbs, P. V. (2005). Microstructures and precipitation development in cumulus and small cumulonimbus clouds over the warm pool of the tropical Pacific Ocean. Q. J. R. Meteorol. Soc. 131 (606), 639–673. doi:10.1256/qj.04.13
Redemann, J., Wood, R., Zuidema, P., Doherty, S. J., Luna, B., LeBlanc, S. E., et al. (2021). An overview of the ORACLES (ObseRvations of aerosols above CLouds and their intEractionS) project: Aerosol-cloud-radiation interactions in the Southeast Atlantic basin. Atmos. Chem. Phys. 21 (3), 1507–1563. doi:10.5194/acp-21-1507-2021
Ren, C., and Mackenzie, A. R. (2005). Cirrus parametrization and the role of ice nuclei. Q. J. R. Meteorol. Soc. 131 (608), 1585–1605. doi:10.1256/qj.04.126
Rosenfeld, D., and Bell, T. L. (2011). Why do tornados and hailstorms rest on weekends? J. Geophys. Res. 116 (D20), D20211. doi:10.1029/2011JD016214
Rosenfeld, D., Wang, H., and Rasch, P. J. (2012). The roles of cloud drop effective radius and LWP in determining rain properties in marine stratocumulus. Geophys. Res. Lett. 39, L13801. doi:10.1029/2012GL052028
Rosenfeld, D., Zhu, Y., Wang, M., Zheng, Y., Goren, T., and Yu, S. (2019). Aerosol-driven droplet concentrations dominate coverage and water of oceanic low-level clouds. Science 364 (6446), eaav0566. doi:10.1126/science.aav0566
Schnitzhofer, R., Norman, M., Wisthaler, A., Vergeiner, J., Harnisch, F., Gohm, A., et al. (2009). A multimethodological approach to study the spatial distribution of air pollution in an Alpine valley during wintertime. Atmos. Chem. Phys. 9 (10), 3385–3396. doi:10.5194/acp-9-3385-2009
Sheng, J. J., Zhao, D. L., Wang, F., Du, Y. M., Tian, P., Xiao, W., et al. (2022). Microphysical structure and vertical evolution of continental cumulus clouds from analysis of aircraft measurements in Northern China. Atmos. Res. 277, 106305. doi:10.1016/j.atmosres.2022.106305
Singh, H. B., Brune, W. H., Crawford, J. H., Flocke, F., and Jacob, D. J. (2009). Chemistry and transport of pollution over the gulf of Mexico and the pacific: Spring 2006 INTEX-B campaign overview and first results. Atmos. Chem. Phys. 9 (7), 2301–2318. doi:10.5194/acp-9-2301-2009
Singh, H. B., Brune, W. H., Crawford, J. H., Jacob, D. J., and Russell, P. B. (2006). Overview of the summer 2004 intercontinental chemical transport experiment - North America (INTEX-A). J. Geophys. Res. 111 (D24), D24S01. doi:10.1029/2006jd007905
Sun, Y. W., Dong, X. B., Li, B. D., Duan, Y., Hu, X. F., Yang, Y., et al. (2019). The physical properties and seeding potential analysis of a low trough cold front cloud system at mountain Taihang based on aircraft observations. Plateau Meteorol. 38 (5), 971–982. doi:10.7522/j.issn.1000-0534.2018.00112
Sun, Y. W., Yin, Y., Sun, X., Liu, W., Han, Y., and Yan, X. S. (2017). Observation and study of macro and micro response in cold cloud catalysis. Plateau Meteorol. 36 (5), 1290–1303. doi:10.7522/j.issn.1000-0534.2016.00113
Swietlicki, E., Hansson, H. C., Hämeri, K., Svenningsson, B., Massling, A., McFiggans, G., et al. (2008). Hygroscopic properties of submicrometer atmospheric aerosol particles measured with H-tdma instruments in various environments—A review. Tellus B Chem. Phys. Meteorology 60 (3), 432–469. doi:10.1111/j.1600-0889.2008.00350.x
Tang, M. J., Whitehead, J., Davidson, N. M., Pope, F. D., Alfarra, M. R., McFiggans, G., et al. (2015). Cloud condensation nucleation activities of calcium carbonate and its atmospheric ageing products. Phys. Chem. Chem. Phys. 17 (48), 32194–32203. doi:10.1039/c5cp03795f
Tessendorf, A. A., French, J. R., Friedrich, K., Geerts, B., Rauber, R. M., Rasmussen, R. M., et al. (2019). A transformational approach to winter orographic weather modification research the SNOWIE Project. Bull. Am. Meteorol. Soc. 100 (1), 71–92. doi:10.1175/bams-d-17-0152.1
Twomey, S. (1977). The influence of pollution on the shortwave albedo of clouds. J. Atmos. Sci. 34 (7), 1149–1152. doi:10.1175/1520-0469(1977)034<1149:tiopot>2.0.co;2
Wang, Y., Niu, S. J., Lu, C. S., Liu, Y. G., Chen, J. Y., and Yang, W. X. (2019). An observational study on cloud spectral width in North China. Atmosphere 10 (3), 109. doi:10.3390/atmos10030109
Whitby, K. T. (1978). The physical characteristics of sulfur aerosols. Atmos. Environ. 12 (1-3), 135–159. doi:10.1016/0004-6981(78)90196-8
Yang, J. M., Li, J. X., Li, P. R., Sun, G. D., Cai, Z. X., Yang, X., et al. (2020a). Spatial distribution and impacts of aerosols on clouds under meiyu frontal weather background over central China based on aircraft observations. J. Geophys. Res. Atmos. 125 (15), 31915. doi:10.1029/2019jd031915
Yang, Y., Zhao, C. F., Dong, X. B., Fan, G. C., Zhou, Y. Q., Wang, Y., et al. (2019). Toward understanding the process-level impacts of aerosols on microphysical properties of shallow cumulus cloud using aircraft observations. Atmos. Res. 221, 27–33. doi:10.1016/j.atmosres.2019.01.027
Yang, Y., Zhou, Y., and Cai, Z. (2020b). A case study of aircraft observation of aerosol vertical distribution and activation characteristics. Meteorol. Mon. 46 (9), 1199–1209. doi:10.7519/j.issn.1000-0526.2020.09.007
Yu, C. J., Liu, D. T., Hu, K., Tian, P., Wu, Y. Z., Zhao, D. L., et al. (2022). Aerodynamic size-resolved composition and cloud condensation nuclei properties of aerosols in a Beijing suburban region. Atmos. Chem. Phys. 22 (7), 4375–4391. doi:10.5194/acp-22-4375-2022
Yuan, T. L., Li, Z. Q., Zhang, R. Y., and Fan, J. W. (2008). Increase of cloud droplet size with aerosol optical depth: An observation and modeling study. J. Geophys. Res. 113 (D4), D04201. doi:10.1029/2007JD008632
Yue, Z. G., Rosenfeld, D., Liu, G. H., Dai, J., Yu, X., Zhu, Y. N., et al. (2019). Automated mapping of convective clouds (AMCC) thermodynamical, microphysical, and CCN properties from SNPP/VIIRS satellite data. J. Appl. Meteorol. Climatol. 58 (4), 887–902. doi:10.1175/jamc-d-18-0144.1
Zhang, F., Wang, Y. Y., Peng, J. F., Ren, J. Y., Collins, D., Zhang, R. Y., et al. (2017). Uncertainty in predicting CCN activity of aged and primary aerosols. J. Geophys. Res. Atmos. 122, 723–736. doi:10.1002/2017JD027058
Zhang, Q., Meng, J., Quan, J., Gao, Y., Zhao, D., Chen, P., et al. (2012). Impact of aerosol composition on cloud condensation nuclei activity. Atmos. Chem. Phys. 12 (8), 3783–3790. doi:10.5194/acp-12-3783-2012
Zhang, Q., Quan, J. N., Tie, X. X., Huang, M. Y., and Ma, X. C. (2011). Impact of aerosol particles on cloud formation: Aircraft measurements in China. Atmos. Environ. 45 (3), 665–672. doi:10.1016/j.atmosenv.2010.10.025
Zhang, Q., Quan, J. N., Tie, X. X., Li, X., Liu, Q., Gao, Y., et al. (2015). Effects of meteorology and secondary particle formation on visibility during heavy haze events in Beijing, China. Sci. Total Environ. 502, 578–584. doi:10.1016/j.scitotenv.2014.09.079
Zhao, C. F., Chen, Y. Y., Li, J. M., Letu, H. S., Su, Y. F., Chen, T. M., et al. (2019). Fifteen-year statistical analysis of cloud characteristics over China using terra and aqua moderate resolution imaging spectroradiometer observations. Int. J. Climatol. 39 (5), 2612–2629. doi:10.1002/joc.5975
Zhao, C. F., Qiu, Y. M., Dong, X. B., Wang, Z. E., Peng, Y. R., Li, B. D., et al. (2018). Negative Aerosol-Cloud re Relationship From Aircraft Observations Over Hebei, China. Earth Space Sci. 5 (1), 19–29. doi:10.1002/2017ea000346
Keywords: aerosol, CCN, cloud microphysical properties, hygroscopicity, artificial precipitation
Citation: Yu Y, Zhu Q, He Q, Gao Y, Zhou X, Zhang R, Zhang X, Li H, Wang W and Cheng T (2022) Variations of aerosol and cloud vertical characteristics based on aircraft measurements in upstream of Shanghai during the 2020 China international import expo. Front. Environ. Sci. 10:1098611. doi: 10.3389/fenvs.2022.1098611
Received: 15 November 2022; Accepted: 28 November 2022;
Published: 07 December 2022.
Edited by:
Honglei Wang, Nanjing University of Information Science and Technology, ChinaReviewed by:
Xingna Yu, Nanjing University of Information Science and Technology, ChinaZhenxing Shen, Xi’an Jiaotong University, China
Copyright © 2022 Yu, Zhu, He, Gao, Zhou, Zhang, Zhang, Li, Wang and Cheng. This is an open-access article distributed under the terms of the Creative Commons Attribution License (CC BY). The use, distribution or reproduction in other forums is permitted, provided the original author(s) and the copyright owner(s) are credited and that the original publication in this journal is cited, in accordance with accepted academic practice. No use, distribution or reproduction is permitted which does not comply with these terms.
*Correspondence: Hongyu Li, aHlsaUBjbWEuZ292LmNu; Tiantao Cheng, dHRjaGVuZ0BmdWRhbi5lZHUuY24=