 Xin Ma1
 Fuli Guo
 Wenbin Wang
- 1School Management and Economics, North China University of Water Resources and Electric Power, Zhengzhou, China
- 2Resource System Optimization and Decision Research Center, North China University of Water Resources and Electric Power, Zhengzhou, China
Based on the dissipative structure theory, the temporal and spatial evolution process of China’s carbon emission structure during the period of 2005–2020 is evaluated by using information entropy. The spatial correlation of information entropy of China’s carbon emission structure is measured by social network analysis , and the spatial correlation characteristics and influencing factors of information entropy of China’s carbon emission structure are discussed. The results show that the following: 1) The spatial network structure has stability and multiple overlapping additives, and the number of spatial relationships increases from 180 in 2005 to 231 in 2020. 2) According to the results of cluster sector model analysis, each province belongs to four different functional sectors respectively. The first is the “net benefit sector”, which is composed of economically developed regions such as Beijing, Shanghai, and Tianjin. The second is the “broker sector”, which includes provinces with strong economic growth vitality, such as Zhejiang, Fujian, and Guangdong. Regarding the third sector, it is the “two-way spillover sector”, which is composed of Henan, Hubei, and other fast-growing provinces in the central region. The next is the “net spillover sector”, which is composed of central and western provinces with rich resources but backward economy, such as Xinjiang, Inner Mongolia, and Shanxi. 3) The empirical results of the QAP model show that geographical adjacency, urban population, energy consumption, and R and D investment have an impact on the spatial correlation of information entropy of China’s carbon emission structure. Moreover, strengthening the spatial network correlation can promote the improvement of the carbon emission structure and be helpful to realize carbon neutrality and low-carbon sustainable development.
Introduction
How to reduce carbon emissions, adapt to climate change and achieve carbon neutrality have arrived at a consensus in the world. In 2020, China’s carbon emissions were 9.894 Gt and it has become the largest emitter. The Chinese government announced that it would realize the carbon peak in 2030 while achieving carbon neutrality before 2060. However, the fossil fuel accounts for nearly 80% of energy consumption, and China still face severe challenges in carbon emission reduction. Under the joint action of resource endowment, economic level, technological capability, energy structure urbanization process, and other factors, China’s carbon emission shows a significant spatial imbalance (Zhang et al., 2021). The energy consumption of provinces does not exist independently and manifests a certain spatial correlation (Wei et al., 2018). Therefore, in order to achieve their own carbon emission reduction targets, these provinces should not only consider their own energy structure and energy consumption but also take the characteristics of related provinces into account (Ye et al., 2019). The factor flow and geographical distance also cause the spatial spillover effect of carbon emissions among provinces (Du et al., 2017). With the implementation of projects aimed at promoting the cross regional transmission of energy, such as the west-east natural gas transmission project and north-south coal transportation project, the spatial correlation of energy consumption and carbon emission have become more common and extensive, which has not just exhibited the “close neighbor” relationship in the simple sense of geography, and it gradually presents the complex network structure of multithreading. In this context, regarding the most important contribution of this study, the information entropy is introduced to describe the structural characteristics of China’s carbon emission. At the same time, the temporal and spatial evolution trend of the overall network structure is discussed. Moreover, the status and role of each province in the spatial network are defined, and the spatial network plays an important role in the formulation of carbon peak and carbon neutralization policy.
The article is organized as follows: Section 3 presents a review of the literature. In Section 4, the model and data sources are described, which includes the calculation of the information entropy of the carbon emission structure, the model of spatial network, the characteristic indicators of spatial network, and the QAP model. This is followed by the empirical research and findings section, which depicts the general characteristics of the information entropy of the carbon emission structure. Section 6 includes three aspects: First, the overall network characteristics and evolution trend are revealed, then network centrality is analyzed, and the functions of different sectors are also discussed through the spatial clustering sector model. Section 7 analyzes the influencing factors of the spatial correlation of the information entropy of the carbon emission structure by using the QAP model. Finally, in the conclusion, we reflect on how our findings might help to advance research on the carbon emission reduction, while policy suggestions are also put forward.
Literature Review
The Chinese government decomposes the national carbon emission reduction target into provincial targets (Gu and Wang, 2018). How to scientifically and quantitatively analyze the change of carbon emission structure is the prerequisite for the rational and balanced allocation of carbon emission reduction tasks. A simple decomposition model decomposes the energy consumption of China into its quantity and structure. Possible trajectories of carbon emissions in China to the year 2050 depend on three scenario settings with differing total energy consumption and composition. Carbon emissions will not peak in the business-as-usual scenario, but carbon emissions will peak at 10.69 Gt in 2030 in the planned energy structure scenario. In the low-carbon energy structure scenario, the peak will occur in 2025 at a value of 10.37 Gt. Not only do slower energy consumption growth rates and the low carbon energy structure enable this peaking to occur earlier in time but also lower the peaking level. China’s fossil energy consumption will also peak in 2030 and 2025 (Xu et al., 2020). According to the IPCC inventory guide, and on the basis of extended stochastic environmental impact assessment model (STIRPAT), the carbon emissions of China from 1971 to 2014 are investigated. The carbon emissions of coal, gasoline, diesel, and electrical power consumption account for the majority of total carbon emissions, and the estimated elastic coefficients reveal that the nuclear energy has affected the carbon emission in China (Zhang et al., 2019). The logarithmic mean divisia index (LMDI) decoupling method is utilized to decompose the changes of China’s carbon emissions and carbon emission intensity during the period of 1996–2010 from the perspectives of energy sources and industrial structure respectively. The decrease of energy intensity and the cleaning of final energy consumption structure played significant roles in curbing carbon emissions (Zhang and Da, 2015). Moreover, with the increasingly close industrial association and economic cooperation among provinces, there is an interactive effect in the change of carbon emission structure in different provinces (Chen et al., 2017). The heterogeneity of the economic development level and the preferential strength of external policies promote the transfer of energy-consuming industries from the developed eastern region to the underdeveloped central and western regions. This process is accompanied by the transfer of energy demand and the change of energy consumption structure, and the output of carbon-intensive products in the province where the industry is transferred will significantly increase (Cheng et al., 2018). Consequently, the potential amount of inter-provincial carbon emission transformation has been increased and shows different regional and cyclical characteristics (Li et al., 2018). Furthermore, the closer trade links between provinces also lead to the transformation of a large number of carbon emissions (Wang et al., 2019).
The carbon emission structure is affected by many factors. While the influence of spatial and geographical correlation is considered, the evolution path of carbon emission is simulated and retrieved by using Chinese urban remote sensing data from 1992 to 2013, and the result shows that energy consumption is the key factors for the increase and spread of carbon emissions (Wang et al., 2018). There is a significant spatial correlation between energy consumption and carbon emissions (Yu et al., 2019). In addition, carbon emissions are spatially dependent and the spatial weight matrix strengthened the existence of environmental kuznets curve (EKC) (Presno et al., 2018). Regarding carbon emissions, the acceleration of urbanization is another important factor that should be considered (Jiang et al., 2019), not only the rapid increase of urban population but also a larger concentration of land use and economic activities (Zhang and Zhang, 2018). The growing energy consumption in commercial building operations has slowed the pace of carbon reduction in the building sector, which has hindered China’s movement towards peaking emissions by 2030 and carbon neutrality by mid-century (Li et al., 2022). Building is the key issue of carbon neutralization transition, and a timely analysis for carbon emission reduction in buildings is also an effective global response to the crisis of climate change (Xiang et al., 2022a). The major driving forces of carbon emissions from commercial buildings in China were found to be the population size and energy intensity of carbon emissions, and their elastic coefficients were 0.6346 and 0.2487, respectively (Xiang et al., 2022b). Commercial buildings have the largest decarbonization potential using current strategies and technologies (Zhang et al., 2022). Furthermore, according to the result of bibliometric analysis in the literature, more attention should be paid to the energy consumption and carbon emissions (ECCE) in the rural residential buildings in the future (Sun et al., 2022). However, technological innovation can either increase carbon emissions through scale effect or reduce carbon emissions through the technology effect. Therefore, the comprehensive environmental effect of technological innovation is uncertain in the industrial field of China (Ma et al., 2019). For instance, the technological innovation of the carbon emission reduction effect generated by technological innovation could not offset the growth effect brought by its promotion of economic development. Although technological innovation can improve the utilization efficiency of energy and reduce the carbon emission of unit product, the reduction of production cost will stimulate the growth of output level in turn, which will lead to the further improvement of energy consumption and carbon emission (Cheng et al., 2016). It should be noted that the direct technology spillover and indirect technology spillover have different effects on carbon emissions (Jiao et al., 2018).
Reviewing the existing literature, although some achievements have been made in related research, there are still two issues that need to be resolved: First, the measurement of existing research on carbon emission changes focuses on the intensity of carbon emission, which cannot reflect the number of energy types that cause carbon emission, the evenness of carbon emission distribution of each type of energy, and the state of carbon emission structural balance. Second, most of the research methods are based on spatial econometric analysis, ignoring the dynamic role between provinces, which is prone to fall into the “adjacency” limitation of spatial metrology and the lack of global vision.
Correspondingly, this study is dedicated to narrowing these gaps by making advances as follows: First, it is not only a beneficial supplement to the existing literature but also a scientific reference for the effective linkage, enhanced cooperation, and coordinated development of China’s carbon emission reduction among provinces. It is helpful to promote the reconstruction of the industrial chain between provinces and improve the level of green and high-quality development. Second, expand the existing research paradigms. Carbon emission is essentially an indirect reflection of economic activity. By introducing the theory of information entropy, which is derived from the concept of entropy in thermodynamics, it can effectively reflect the systematic evolution of energy consumption in each province and the temporal and spatial differentiation of the carbon emission structure. In the spatial structure, each province acts in the form of correlation or non-correlation, and provincial carbon emission, as the undesired output of economic activities, also has the characteristics of network correlation, so by using the network analysis method for the investigation of temporal and spatial condition and effect factors of information entropy of provincial carbon emission structure has natural rationality and better feasibility. Third, overcome the “multicollinearity” problem prone to econometric methods; the QAP model is constructed for correlation analysis and regression analysis, and explore the effect mechanism of energy consumption intensity, urban population proportion, and R&D input intensity on the balance of the provincial carbon emission structure.
Model and Data Sources
Data Sources and Processing
The sample period is from 2005 to 2020, and the subjects are 30 provincial administrative regions in China. Since there are no data for Tibet, Taiwan, Hong Kong, and Macao, these regions are not considered. The data are collected from the China Energy Statistical Yearbook, the China Statistical Yearbook, and the website of the National Bureau of Statistics. The real GDP data are reduced according to 2005 = 100 in order to eliminate the impact of price factors on the real GDP.
Calculation of Information Entropy of Carbon Emission Structure
The IPCC method is adopted to calculate the consumption of the eight major fossil energy categories such as crude oil, kerosene, gasoline, coke, diesel, natural gas, fuel oil, and coal, and the carbon emissions of China are calculated as follows:
The provinces, energy categories, and years can be represented by i, j, and t, respectively. The conversion coefficient of the j energy is δj, the consumption of the
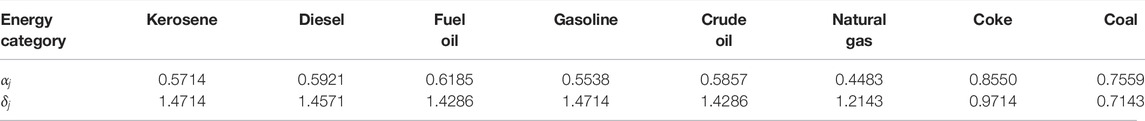
TABLE 1. Energy conversion coefficient and carbon emission coefficient.
Ti,t is the information entropy of the carbon emission structure,
The information entropy of the carbon emission structure reflects the uniformity of energy consumption and the balance of the energy consumption structure. If the information entropy of the carbon emission structure is larger, the proportion of carbon emission generated by single energy in the whole carbon emission system is lower. The carbon emission generated by different types of energies tends to be balanced, the carbon emission system is evolving towards a virtuous cycle, and the balance of the carbon emission structure is enhanced.
Model of Spatial Network
The information entropy of the carbon emission structure of different provinces has some links, which constitute a spatial association network. Geographers and social scientists have introduced the theory of gravity into the study of economic geography early, which has become an important cornerstone of the research on economic geography. This study improves the gravity model and constructs the spatial network model of the information entropy of China’s carbon emission structure (Lu and Sun, 2017),
i and l represent provinces i and l, respectively, Ψil is the gravity between the provinces i and l, Ti indicates the information entropy of the carbon emission structure of province i, μi expresses the year-end population of province i, Gi represents the real GDP of province i, gi signifies the real per capita GDP of province i, and Dil means the distance between provinces
Characteristic indicators of spatial network
Characteristics of overall network
The network formed by all members of a group is called the overall network, and the characteristics of the overall network can be understood from network density, network correlation degree, network hierarchy degree, network efficiency, and other indicators.
The closeness of the spatial network can be reflected by the network density. If the network density is large, it means that the members are more closely connected. Assuming that the total number of members in the spatial network is N and the actual number of relations is M, so the theoretical maximum relation number is N(N-1), and the network density I can be calculated by the following equation:
The robustness and vulnerability of the spatial network can be showed by the network correlation degree. If the total number of members in the space network is N, and the number of unreachable node pairs in the network is V, therefore the network correlation degree E is calculated as follows:
The hierarchical structure of each member and the extent to which the members are asymmetrically reachable can be signified by the network hierarchy degree. While the number of symmetrically reachable node pairs in the network is Z, the network hierarchy degree H is described as the following equation:
The connection efficiency and redundant relations among members in the spatial network are reflected by the network efficiency, and it is inversely proportional to the stability of network. If the number of redundant wires is S, then the network efficiency F is calculated by the following equation:
Characteristics of Node
The position of each node in the network is narrated through three indicators such as degree centrality, intermediate centrality, and closeness centrality, wherein the degree centrality characterizes the degree of node’s central position in the network and the connection degree with other nodes. If the total number of nodes in the spatial network is N, and the number of nodes directly related with other nodes in the network is n, the degree centrality is explained as follows:
The intermediate centrality is used to measure the control ability of a node to other nodes in the network. Assuming that the total number of nodes in the spatial network is N, the number of shortcuts between node j and node k is ξrk, the number of shortcuts through node m between node r and node k is ξrk(m), and r < k, the intermediate centrality is described as follows:
The closeness centrality is used to survive the extent to which a node in the spatial network is non-controlled by other nodes. Presuming that the total number of nodes in the spatial network is N, β is the shortcut distance between two nodes
Spatial Cluster Sector Model
Through the spatial cluster sector model analysis, the complex network can be simplified into sectors, and the correlation degree of information entropy of the carbon emission structure can be investigated from an overall perspective. The internal structure state of each sector is presented. Moreover, the role and responsibility of each sector in the spatial network can also be analyzed. Generally, the spatial network is divided into four parts: net benefit sector, net spillover sector, broker sector, and two-way spillover sector, and the characteristics and attributions of the four sectors are different. 1) Net benefit sector: The nodes in this sector receive more relationships from nodes in other sectors but have less relations from themselves. 2) Net spillover sector: The nodes in this sector send more relations to nodes in other sectors while receiving fewer relations themselves. 3) Broker sector: The nodes in this sector receive and send the relation to the nodes in other sectors at the same time, but those nodes have less internal connection. This sector acts as a “bridge” in the network. 4) Two-way spillover sector: The nodes in the sector send more relations to the nodes outside the sector, while those nodes have more mutual relations but receive fewer external connections. Furthermore, this sector has a spillover effect on both inside and outside the sector.
QAP Model of Spatial Network
The QAP model based on relatively independent explanatory variables, which is a non-parametric method and more robust than parametric method, this is a better way to solve the problem of “multicollinearity” in regression analysis. The QAP model includes correlation analysis and regression analysis, and the correlation analysis is to compare the elements in two matrices on the basis of permutation matrix, while the regression analysis is to discuss the regression relationship between a matrix and multiple matrices. The QAP model is expressed as follows:
R is similar to the explained variable of the ordinary regression model, which may reflex the spatial network correlation matrix of research object. Xq (q = 1,2, … ,n) resembles to the explanatory variables, and it is the influencing factor matrix that affects the spatial network relation.
General Characteristics of Information Entropy of Carbon Emission Structure
The temporal and spatial variation of the information entropy of the carbon emission structure in China for main year is exhibited in Figure 1. Due to the effect of the type of energy consumption and the level of energy consumption during the period of 2005–2020 as well as the conduction effect, the information entropy of the carbon emission structure in each province shows obvious fluctuation on the national scale, although the fluctuation is small in most provinces, but in some provinces is severe.
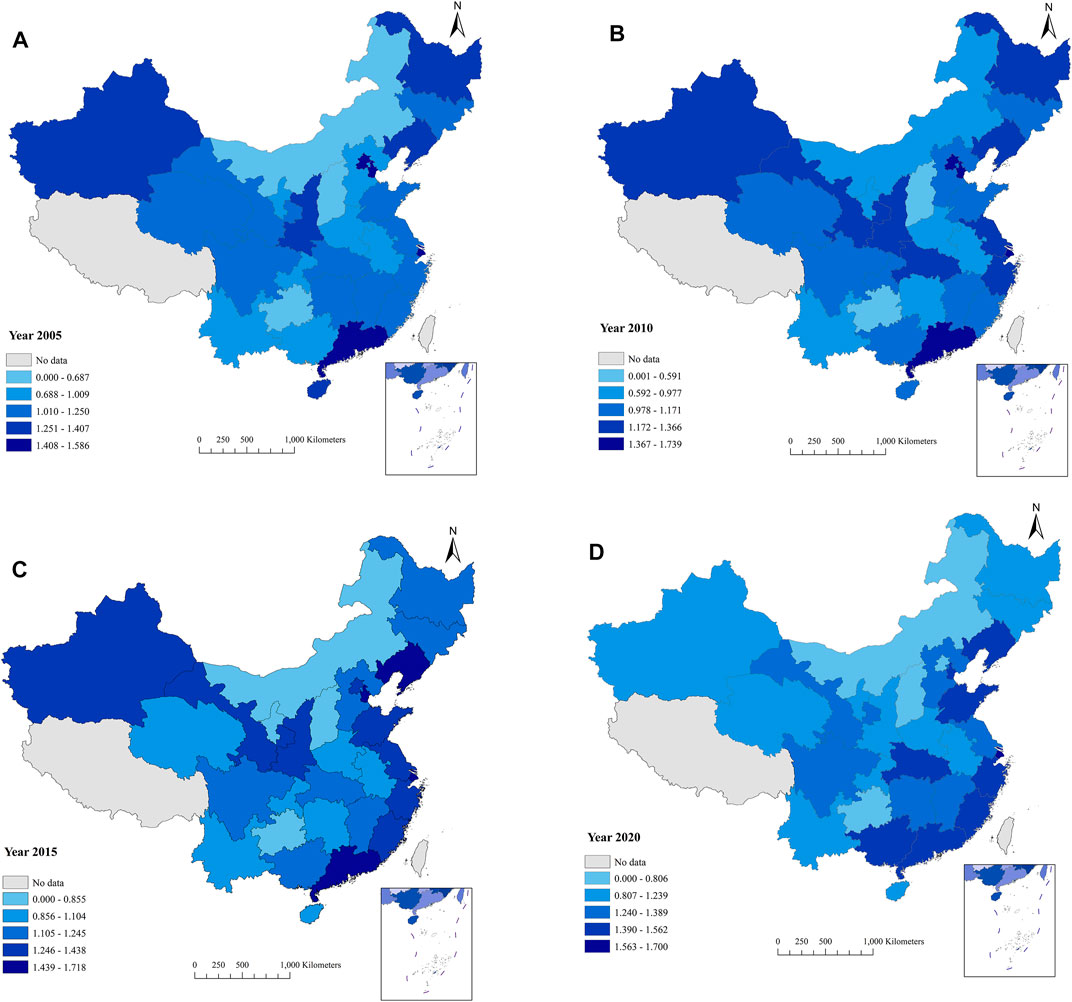
FIGURE 1. Spatial and temporal variation of the information entropy of the carbon emission structure in China for main years from 2005 to 2020. (A) 2005, (B) 2010, (C) 2015, and (D) 2020.
For example, the information entropy of the carbon emission structure in Beijing is declined significantly and may be expounded as follows: With the completion of Shaanxi–Beijing transmission system of Petro China and the coal-to-gas pipeline project of Datang, the annual consumption of natural gas in Beijing is up to 20 billion cubic meters, and the peak daily supplies can reach 190 million cubic meters. Natural gas has accounted for one third of Beijing’s energy structure, and it has become the largest energy consumption variety of Beijing. However, Beijing’s energy consumption is still dominated by fossil fuels, and it relies too much on natural gas, which weakens the balance of the carbon emission structure. Regarding Guangxi and Yunnan, the information entropy of the carbon emission structure is rising sharply. These regions are rich in hydropower resources; for this reason, the development effort in recent years is increasing, and some large hydropower projects such as the Longtan hydropower station and Pingban hydropower station have been completed in Guangxi; the total installed capacity has over 12 million kilowatts. Moreover, the Xiluodu hydropower station is the third largest station in the world; this station, the Dachaoshan hydropower station, and the Lagaluo hydropower station have also been completed and put into operation in Yunnan, and the total installed capacity has been 62 million kilowatts. As a renewable and clean energy with low operating cost, the hydropower is gradually increased in the energy consumption structure of Guangxi and Yunnan so that the energy consumption structure dominated by coal and other fossil fuels with high carbon emissions has been changed more reasonable, the growth rate of carbon emission has been restrained effectively, and the balance of the carbon emission structure has also been improved significantly. Take the data of 2020 as an example (Figure 1D.), the information entropy of the carbon emission structure in Liaoning, Zhejiang, Shanghai, Shandong, Guangdong, and Fujian is higher than other provinces, which indicates that the proportion of single energy is relatively low in the energy consumption structure of these provinces, the type of energy consumption is various, and the overall structure of energy consumption is more reasonable. In other words, the equilibrium of the carbon emission structure in the carbon emission system is stronger than other provinces.
Analysis on Spatial Network Characteristics of Information Entropy of Carbon Emission Structure
Overall Network Characteristics and Evolution Trend
The spatial correlation of the information entropy of the carbon emission structure in China is determined by the modified gravity model, and the spatial matrix is constructed accordingly. Figure 2 describes the spatial network diagram of the information entropy of the carbon emission structure in China for main years from 2005 to 2020, and it can be discovered that the network forms in these years are stable.
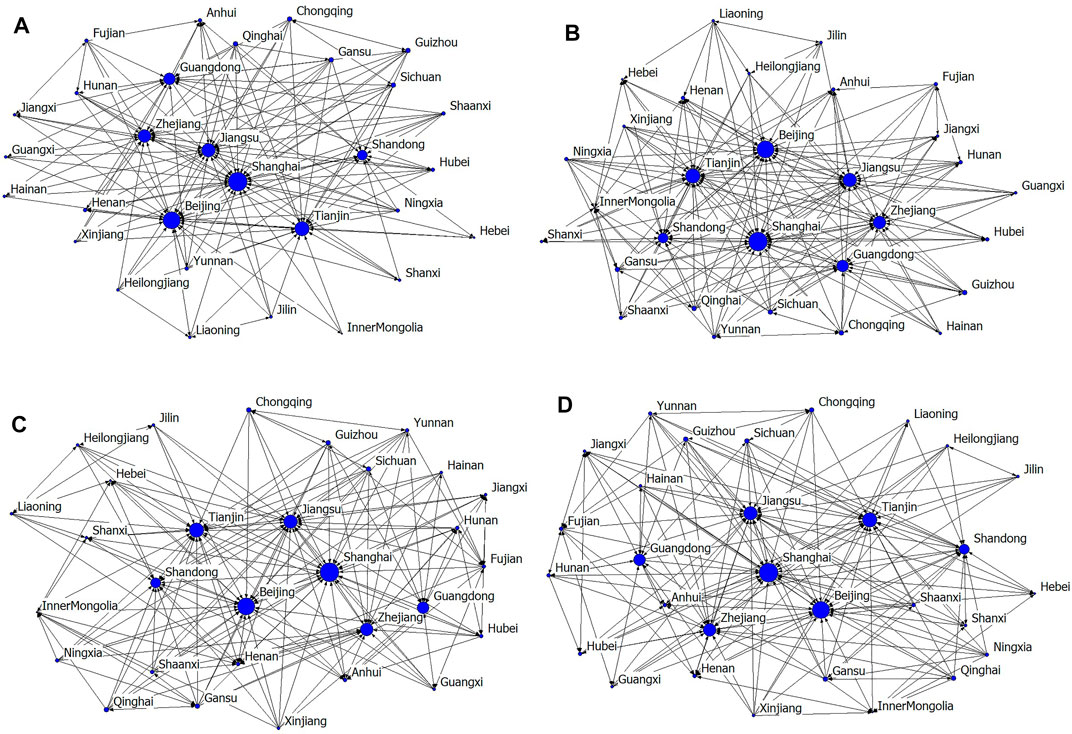
FIGURE 2. Spatial network diagram of the information entropy of the carbon emission structure in China for main years from 2005 to 2020. (A) 2005, (B) 2010, (C) 2015, and (D) 2020.
Network Correlation Degree and Network Density
In the network of the information entropy of the carbon emission structure, the number of network correlation generally displays a fluctuating upward trend during the sample period, it increased from 180 in 2005 to 223 in 2012, after that gradually decreased to 206 in 2016, and then showed an upward state again. The number of network relationships in 2020 is 231, and the average number of network relationships is 209. The network density also shows a fluctuating trend in the sample period (Figure 3.), rising from 0.207 in 2005 to 0.256 in 2012; henceforth, first down and then up, the network density in 2020 is 0.272. The increase of network density indicates that the spatial correlation of the information entropy of the carbon emission structure is getting closer. It may be explained as follows: First, it is related to China’s policy of trans-regional resource allocation after 2005, such as the construction of large-scale trans-regional energy transmission projects including the West-East Natural Gas Transmission Project, the North-South Coal Transportation Project, the West-East Power Transmission Project, etc. Second, it is associated with the construction of large energy bases. Specifically, the China’s Strategic Action Plan for Energy Development (2014–2020) defines the energy development plans of clean and efficient development of coal power, the transformation of coal use mode, and the increase of the proportion of centralized and efficient coal power generation. In addition, 100-million-ton-class coal bases are built in 14 areas including Shendong, Northern Shaanxi, Huanglong, Ningdong, Western Shandong, Huainan and Huaibei, Northern Shanxi, Central Shanxi, eastern Shanxi, Yunnan and Guizhou, Central Hebei, Henan, Eastern Inner Mongolia, and Xinjiang; some large-scale 10 million-kilowatt-class coal power bases are built with the most advanced energy-saving, water-saving and environmentally friendly power generation technology in Xilingol, Ordos, Northern Shanxi, Central Shanxi, Eastern Shanxi, Northern Shaanxi, Hami, Zhundong, and Ningdong. At the same time, the hydropower cascade development of river basin is increased, resources is optimized and 13 major hydropower bases, including Jinsha river basin, Yalong river basin, and Dadu river basin, are built to increase the proportion of clean energy such as hydropower in overall energy consumption. The cross-regional allocation of energy and the construction of large energy bases enhance energy mobility, improve the energy consumption structure of all provinces, and ultimately affect the equilibrium of the carbon emission structure. Although the number of correlation reached a maximum of 231 in 2020, but it is far from the maximum possible spatial correlation number of 870, which indicates that the spatial correlation of the information entropy of the carbon emission structure still has a great margin for improvement.
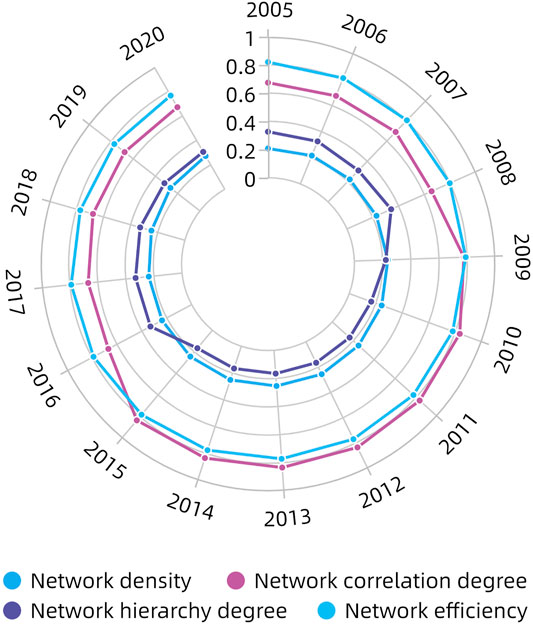
FIGURE 3. Evolution trend of the overall network characteristics of the information entropy of the carbon emission structure in China from 2005 to 2020.
Analyze on Network Correlation
Network correlation is analyzed from three indicators, i.e., network correlation degree, network hierarchy degree, and network efficiency. Generally, the network correlation degree of the information entropy of the carbon emission structure rises to a certain extent, then decreases, and finally becomes stable (Figure 3). From 2008 to 2010, the network hierarchy degree dropped significantly, which indicates that the mutual effect among provinces in the network was gradually strengthened. From 2010 to 2015, the network hierarchy degree rose sharply, which demonstrates that the network structure was relatively stable. From 2015 to 2020, the network hierarchy degree rose significantly, which shows that the dominant position of provinces themselves in the network was gradually strengthened and the mutual effect was gradually weakened (Figure 3). Although the network efficiency shows a slow upward trend from 2012 to 2017, but the overall trend was downward during the sample period (Figure 3), it shows that the connections between nodes in the network are generally increasing. The correlation between the information entropy of the carbon emission structure in each province was strengthened, and the stability of the network was gradually improved.
Analyze on Network Centrality
Centrality is an indicator to measure the status and role of nodes in the spatial network. The calculation results are shown in Figure 4. Due to the constraints of the length of the article, only the results of 2020 are reported. The average degree centrality is 37.561, Shanghai, Beijing, Tianjin, Guangdong, Zhejiang, and another four provinces are higher than the average, mostly located in the Bohai Rim, Yangtze River Delta, and Pearl River Delta regions. Because the sum of in-degree and out-degree in these regions accounts for the majority of the total, which evinces that the spatial correlation of the information entropy of the carbon emission structure is concentrated in these provinces. By analyzing in-degree and out-degree, the average of in-degree in 2020 is 8.033, and the average of out-degree in 2020 is 7.833. Both the in-degree and out-degree of Shanghai, Guangdong, and Shandong are higher than the average, which indicates that these provinces are in the center of the spatial network; at the same time, these regions are spillover and acceptable to other provinces.
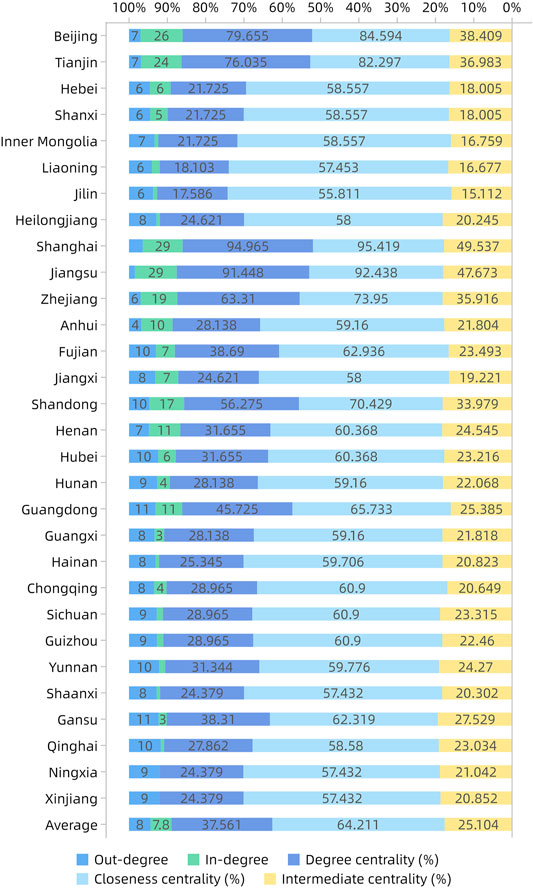
FIGURE 4. Centrality of the spatial network of the information entropy of the carbon emission structure in China (2020).
The average of closeness centrality is 64.211; in addition, the closeness centralities of Beijing, Tianjin, Shanghai, Jiangsu, Zhejiang, Fujian, Shandong, and Guangdong are larger than the average. In addition, these provinces are at the center of the spatial network and relatively developed in China’s foreign trade, science and technology economy. Maybe expounded as follows: On the one hand, marginal provinces are rich in energy and they can deliver energy to the east provinces with relatively poor energy, and these marginal provinces are manifested as emitting spatial correlation in the spatial network of the information entropy of the carbon emission structure. On the other hand, the seven provinces in the central position of the spatial network have taken advantage of their economic and technological advantages to promote the implementation of this process. Therefore, the spatial network of the information entropy of the carbon emission structure gradually takes on a center-edge structure.
The average of the intermediate centrality is 25.104, and eight provinces such as Beijing, Tianjin, and Zhejiang exceed the average level; most are developed areas. It indicates that these provinces control other provinces in the spatial network, that is, they can affect the balance of the carbon emission structure of other provinces. The greater the intermediate centrality, the stronger the impact on other nodes, which means that the role of the intermediate centrality is related to the economic level.
Spatial Clustering-Sector Model Analysis
Based on the CONOR analysis method, the largest segmentation depth selected is 2, and the convergence standard is 0.2. There are 231 correlations in the spatial network in 2020, which includes 27 correlations within the sectors and 204 correlations outside the sectors. According to the spatial correlation and spillover relationship, it can be divided into four sectors. Sector one includes Beijing, Tianjin, Shanghai, Jiangsu, and Shandong, it is “net benefit sector”. Sector two is the “broker sector”, which includes provinces with strong economic growth vitality, such as Zhejiang, Fujian, and Guangdong. Regarding Sector 3, it is the “two-way spillover sector”, which is composed of Henan, Hubei, Hunan, and other fast-growing provinces in the central region. Sector four is the “net spillover sector”, which is composed of central and western provinces with rich resources but backward economy, such as Xinjiang, Inner Mongolia, and Shanxi.
In Figure 5, the network density of the overall network is 0.272 in 2020. If the network density between the two sectors is greater than that of the overall network, the value is 1, which indicates that the sector accepts the emitted relation of another sector. If the network density between the two sectors is lower than that of the overall network, the value is 0, which means that the sector sends a relationship to another, wherein the emission relationship is embodied in the transmission of energy between the sectors. According to these rules, an image matrix can be obtained. The spatial network density matrix and image matrix reflect the spillover effects between the sectors. Moreover, it displays the transmission mechanism of spatial entropy between provinces as a result of energy flows.
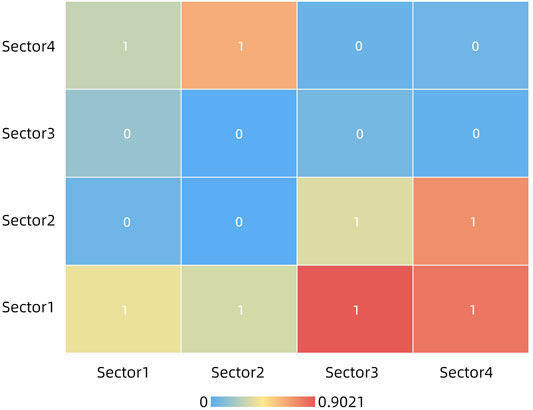
FIGURE 5. Density matrix and image matrix of the spatial network of the information entropy of the carbon emission structure in China (2020)
Analysis on the Influencing Factors of Spatial Correlation of Information Entropy of Carbon Emission Structure
In order to overcome the shortage of “multicollinearity” in econometrics, the QAP model is used to carry out correlation analysis and regression analysis. The heterogeneity of carbon emission in different provinces can be indirectly described by indicators such as the urbanization level, quantity of energy consumption, and technological innovation capacity (Wang et al., 2019). Therefore, the theoretical assumptions are as follows: The sample period is 2005–2020, the spatial correlation R of the information entropy of the carbon emission structure is mainly affected by four factors, i.e., the spatial adjacency relationship matrix D is determined by the geographical location; if the two regions are connected, the adjacent value is 1, otherwise, it is 0. Although the weightless matrix adopted in the present study is an easy way to explore the spatial correlation of the information entropy of the carbon emission structure, the weighted matrix has wider applicability and deserves further study in the future. E is the energy consumption difference matrix, P is the urban population difference matrix, and H is the R&D input difference matrix,
Test on QAP Correlation
The correlation analysis is tested by using the UCINET software, in which the result is calculated by a random substitution of 10,000 times (Table 2). The correlation coefficient reflects the linear correlation between the explained variable R and the explanatory variables D, E, P, and H. If the absolute value of the correlation coefficient is larger, it means that the explained variable get more influence from an explanatory variable, and the correlation coefficient is the average of correlation coefficients calculated by 10,000 random permutations. Furthermore, the maximum and minimum correlation coefficients of 10,000 random permutations are also exhibited in Table 2.
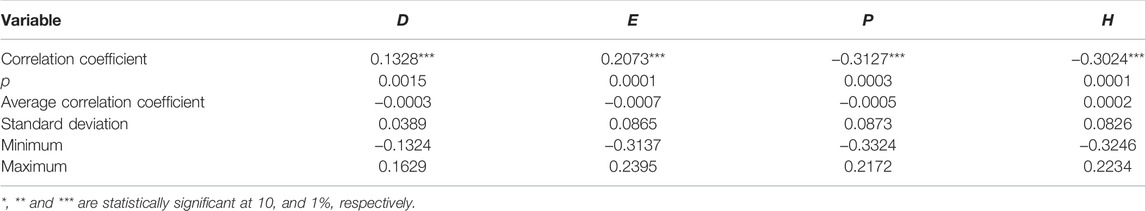
TABLE 2. Test results of the QAP correlation of the spatial matrix of the information entropy of the carbon emission structure.
The correlation coefficients are all significant at the level of 1% (Table 2). However, the correlation coefficients of P and H are negative, which shows that the urban population difference and R&D investment difference have a negative impact on R. The correlation coefficients of D and E R are positive, which indicates that the geographic adjacency relationship and the difference in energy consumption have a positive impact on R.
Furthermore, the explanatory variables are also tested through the QAP model (Table 3), the correlation coefficients between P, E, and H are significant at the level of 1%, and it indicates that there is a “multicollinearity” problem among these explanatory variables. Therefore, the QAP model can be used for regression analysis.
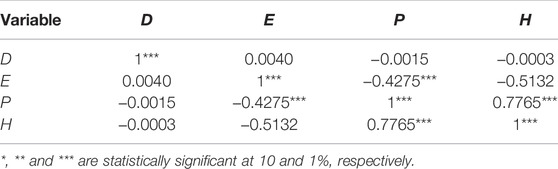
TABLE 3. Test results of QAP correlation between influencing factors.
Analyze the Results of QAP Regression
The results of the QAP regression analysis of influencing factors through 10,000 random permutations (Table 4). The regression coefficient of D is significant at the level of 1%, and it shows that the spatial correlation of the information entropy of the carbon emission structure is affected by spatial adjacency. The value of the regression coefficient is positive, which reflects that the greater the difference of geographical location between regions, the larger the degree of influence, and the stronger the spatial correlation and spillover between provinces. The regression coefficients of P and H are significant at the level of 5%, and it means that the spatial correlation is affected by the difference of urban population and R and D investment, and the value of the regression coefficient is negative, which indicates that the more similar the proportion of urban population and R and D investment intensity between these regions, and it has more influence. The regression coefficient of E is significant at the level of 10%, indicating that the spatial correlation of the information entropy of the emission structure is also affected by the difference of energy consumption to a certain extent.
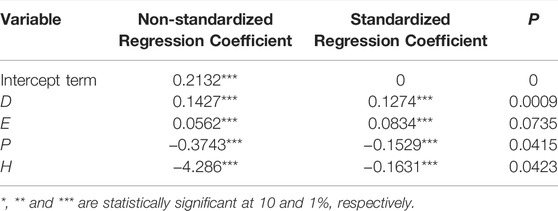
TABLE 4. Results of the QAP regression analysis of influencing factors.
Conclusion
This paper investigates the change of China’s carbon emission structure during the period of 2005–2020. Moreover, an extended discussion is held between results from different perspectives. For empirical estimations, we employed the information entropy, SNA and QAP techniques. The key findings of this study reveal that the overall spatial network is relatively stable, and it shows that there is no fundamental change in China’s overall energy consumption varieties and the carbon emission structure. However, Shanghai, Beijing, Jiangsu, and other economically developed regions have larger degree centrality, which confirms that the improvement of the carbon emission structure in these regions contributes to improve the rationality of the overall carbon emission structure. Furthermore, the result of spatial clustering-sector model analysis also promulgates that there are different spatial spillover effects within and between sectors. The empirical results of QAP regression analysis display that geographical adjacency, urban population, energy consumption, and R&D investment are important factors that need to be paid attention in order to improve China’s carbon emission structure.
Several policy recommendations have been proposed for policymaker, particularly for China to adjust the carbon emission structure and realize carbon neutralization. 1) It is necessary to consider the resource endowment and industrial development level of each province to formulate differentiated policies of carbon emission reduction, at the same time to decompose emission reduction tasks scientifically and rationally, narrow the economic gap between regions, and promote balanced development. 2) The characteristics of provinces in the spatial network should be noticed while optimizing the carbon emission structure, and carry out the spatial classified management of energy consumption. Moreover, actively encourage technologically and economically developed regions to transfer new technologies for energy conservation and emission reduction to backward regions. 3) Strengthen the energy transfer among the sectors, while promote the interprovincial connections within the sector, and build energy delivery channels, in order to improve the closeness degree of spatial network. Furthermore, encourage the provinces with advantages in clean energy, such as hydropower and wind power, to export energy actively, so as to reduce excessive reliance on fossil fuels for energy consumption, and rationalize the carbon emission structure by improving the energy consumption structure. 4) Accelerates the construction of urbanization and increases the proportion of urban population in central and western provinces. Moreover, increase R&D investment in backward regions and narrow the differences between regions. It is also important to encourage the regions to seek technological innovation and industrial structure upgrading through various policy tools and limit the development of the industries with high energy consumption and heavy pollution.
Data Availability Statement
The original contributions presented in the study are included in the article/Supplementary Material, further inquiries can be directed to the corresponding author.
Author Contributions
Conceptualization, XM and YG; methodology, XM; software, YG; validation, XM, YG, and WW; formal analysis, XM and YG; resources, YG; data curation, YG; writing—original draft preparation, XM and YG; writing—review and editing, XM and FG; supervision, XM; funding acquisition, FG. All authors have read and agreed to the published version of the manuscript.
Funding
This research was partially funded by the Zhengzhou science and technology collaborative innovation special project.
Conflict of Interest
The authors declare that the research was conducted in the absence of any commercial or financial relationships that could be construed as a potential conflict of interest.
Publisher’s Note
All claims expressed in this article are solely those of the authors and do not necessarily represent those of their affiliated organizations, or those of the publisher, the editors, and the reviewers. Any product that may be evaluated in this article, or claim that may be made by its manufacturer, is not guaranteed or endorsed by the publisher.
References
Chen, W., Wu, F., Geng, W., and Yu, G. (2017). Carbon Emissions in China's Industrial Sectors. Resour. Conservation Recycling 117, 264–273. doi:10.1016/j.resconrec.2016.10.008
Cheng, S. X., Liu, J. P., and Gong, Z. J. (2016). Measurement of Economic Growth Effect of Energy Conservation and Emission Reduction in China’s Industrial Sector and Analysis of Influencing Factors. World Econ. 39, 166–192.
Cheng, Z., Li, L., and Liu, J. (2018). Industrial Structure, Technical Progress and Carbon Intensity in China's Provinces. Renew. Sustain. Energ. Rev. 81, 2935–2946. doi:10.1016/j.rser.2017.06.103
Du, K., Lin, B., and Xie, C. (2017). Exploring Change in China's Carbon Intensity: A Decomposition Approach. Sustainability 9, 296–314. doi:10.3390/su9020296
Gu, G., and Wang, Z. (2018). China's Carbon Emissions Abatement under Industrial Restructuring by Investment Restriction. Struct. Change Econ. Dyn. 47, 133–144. doi:10.1016/j.strueco.2018.08.007
Jiang, K., You, D., Merrill, R., and Li, Z. (2019). Implementation of a Multi-Agent Environmental Regulation Strategy under Chinese Fiscal Decentralization: an Evolutionary Game Theoretical Approach. J. Clean. Prod. 214, 902–915. doi:10.1016/j.jclepro.2018.12.252
Jiao, J., Jiang, G., and Yang, R. (2018). Impact of R&D Technology Spillovers on Carbon Emissions between China's Regions. Struct. Change Econ. Dyn. 47, 35–45. doi:10.1016/j.strueco.2018.07.002
Li, J., Yang, L., and Long, H. (2018). Climatic Impacts on Energy Consumption: Intensive and Extensive Margins. Energ. Econ. 71, 332–343. doi:10.1016/j.eneco.2018.03.010
Li, K., Ma, M., Xiang, X., Feng, W., Ma, Z., Cai, W., et al. (2022). Carbon Reduction in Commercial Building Operations: a Provincial Retrospection in china. Appl. Energ. 306, 118098. doi:10.1016/j.apenergy.2021.118098
Lu, M. M., and Sun, T. (2017). Analysis of Spatial Correlation and Driving Factors of Haze Pollution in China-based on Social Network Analysis Method. Res. Macro. Qual. 4, 67–76.
Ma, X., Xue, T. T., Waqas, A., and Wang, J. D. (2019). Study on Impact of Regional Innovation on Carbon Pressure Level under Environmental Regulation. J. Manage. 16, 85–95.
Presno, M. J., Landajo, M., and Fernández González, P. (2018). Stochastic Convergence in Per Capita CO 2 Emissions. An Approach from Nonlinear Stationarity Analysis. Energ. Econ. 70, 563–581. doi:10.1016/j.eneco.2015.10.001
Sun, Z., Ma, Z., Ma, M., Cai, W., Xiang, X., Zhang, S., et al. (2022). Carbon Peak and Carbon Neutrality in the Building Sector: a Bibliometric Review. Buildings 12, 128. doi:10.3390/buildings12020128
Wang, S. J., Su, Y. X., and Zhao, Y. B. (2018). Regional Inequality, Spatial Overflow Effects and Influencing Factors of China’s City-Level Energy-Related Carbon Emissions. J. Geogr. 73, 414–428.
Wang, W. B., and Ma, X. (2020). Science and Technology Investment, Networks Characteristics and Ecological Efficiency - A Case Study of Central Plains Urban Agglomerations. Technol. Econ. 39, 109–118.
Wang, Y., Duan, F., Ma, X., and He, L. (2019). Carbon Emissions Efficiency in China: Key Facts from Regional and Industrial Sector. J. Clean. Prod. 206, 850–869. doi:10.1016/j.jclepro.2018.09.185
Wang, Z., Li, Y., Cai, H., Yang, Y., and Wang, B. (2019). Regional Difference and Drivers in China's Carbon Emissions Embodied in Internal Trade. Energ. Econ. 83, 217–228. doi:10.1016/j.eneco.2019.06.023
Wei, Y.-M., Chen, H., Chyong, C. K., Kang, J.-N., Liao, H., and Tang, B.-J. (2018). Economic Dispatch Savings in the Coal-Fired Power Sector: an Empirical Study of China. Energ. Econ. 74, 330–342. doi:10.1016/j.eneco.2018.06.017
Wu, C. F., Xiong, J. H., and Wu, W. C. (2015). Calculation and Effect Factor Analysis of Transport Carbon Emission in Gansu Province Based on STIRPAT Model. J.Glaciol. Geocryol. 37, 826–834. doi:10.7522/j.issn.1000-0240.2015.0092
Xiang, X., Ma, X., Ma, Z., Ma, M., and Cai, W. (2022a). Python-LMDI: a Tool for index Decomposition Analysis of Building Carbon Emissions. Buildings 12 (1), 83. doi:10.3390/buildings12010083
Xiang, X., Ma, X., Ma, Z., and Ma, M. (2022b). Operational Carbon Change in Commercial Buildings under the Carbon Neutral Goal: A LASSO-WOA Approach. Buildings 12, 54. doi:10.3390/buildings12010054
Xu, G., Schwarz, P., and Yang, H. (20202020). Adjusting Energy Consumption Structure to Achieve China's CO2 Emissions Peak. Renew. Sustain. Energ. Rev. 122, 109737. doi:10.1016/j.rser.2020.109737
Ye, F., Fang, X., Li, L., Li, Y., and Chang, C.-T. (2019). Allocation of Carbon Dioxide Emission Quotas Based on the Energy-Economy-Environment Perspective: Evidence from Guangdong Province. Sci. Total Environ. 669, 657–667. doi:10.1016/j.scitotenv.2019.03.058
Yu, A., Lin, X., Zhang, Y., Jiang, X., and Peng, L. (2019). Analysis of Driving Factors and Allocation of Carbon Emission Allowance in China. Sci. Total Environ. 673, 74–82. doi:10.1016/j.scitotenv.2019.04.047
Zhang, S., Ma, M., Li, K., Ma, Z., Feng, W., and Cai, W. (2022). Historical Carbon Abatement in the Commercial Building Operation: China versus the Us. Energ. Econ. 105, 105712. doi:10.1016/j.eneco.2021.105712
Zhang, X., Geng, Y., Tong, Y. W., Kua, H. W., Dong, H., and Pan, H. (2021). Trends and Driving Forces of Low-Carbon Energy Technology Innovation in china's Industrial Sectors from 1998 to 2017: from a Regional Perspective. Front. Energ. 15 (2), 473–486. doi:10.1007/s11708-021-0738-z
Zhang, Y.-J., and Da, Y.-B. (2015). The Decomposition of Energy-Related Carbon Emission and its Decoupling with Economic Growth in china. Renew. Sustain. Energ. Rev. 41, 1255–1266. doi:10.1016/j.rser.2014.09.021
Zhang, Y., Zhang, Q., and Pan, B. (2019). Impact of Affluence and Fossil Energy on china Carbon Emissions Using Stirpat Model. Environ. Sci. Pollut. Res. 26 (18), 18814–18824. doi:10.1007/s11356-019-04950-4
Keywords: carbon emission structure, information entropy, spatial network correlation, QAP model, social network analysis
Citation: Ma X, Guo F, Wang W and Gao Y (2022) Research on Spatial Network Correlation and Influencing Factors of Information Entropy of Carbon Emission Structure in China. Front. Environ. Sci. 10:871332. doi: 10.3389/fenvs.2022.871332
Received: 08 February 2022; Accepted: 28 March 2022;
Published: 10 May 2022.
Edited by:
Tieyu Wang, Shantou University, ChinaCopyright © 2022 Ma, Guo, Wang and Gao. This is an open-access article distributed under the terms of the Creative Commons Attribution License (CC BY). The use, distribution or reproduction in other forums is permitted, provided the original author(s) and the copyright owner(s) are credited and that the original publication in this journal is cited, in accordance with accepted academic practice. No use, distribution or reproduction is permitted which does not comply with these terms.
*Correspondence: Fuli Guo, Z3VvZnVsaUBuY3d1LmVkdS5jbg==