 Dexin Liu
 Wanlong Li
 Jianbiao Peng3
 Qingxia Ma
- 1College of Geography and Environmental Science, Henan University, Kaifeng, China
- 2Key Laboratory of Geospatial Technology for Middle and Lower Yellow River Regions, Henan University, Ministry of Education, Kaifeng, China
- 3School of Environment, Henan Normal University, Xinxiang, China
- 4Henan Key Laboratory of Integrated Air Pollution Control and Ecological Security, Kaifeng, China
Air pollution has a negative impact on the ecological environment as well as on the health of people. Setting off fireworks and firecrackers lead to a significant deterioration in air quality in a short period of time. The firework prohibition policy of 2016 in Zhengzhou City provides an opportunity to investigate the effect of banning fireworks on air quality during the Spring Festival. The Air Quality Index and the concentrations of PM2.5, PM10, SO2, NO2, CO and O3 during the Spring Festival between 2014 and 2019 in Zhengzhou City were analyzed. The results show that: There were small fluctuations in precipitation, air pressure, wind speed, temperature and relative humidity during the Spring Festival from 2014 to 2019. The air quality index in the Spring Festival in 2016 was significantly lower than that in 2014 and 2015, and the air quality in 2018 and 2019 showed greater improvements. The sudden increases in pollutants concentrations has been weakened, showing an obvious “peak-shaving” effect during the traditional heavy pollution period, New Year’s Eve to the first day of the first lunar month. In 2014 and 2015 years, the concentrations of PM2.5 and PM10 reached their peaks at 1:00 a.m. on the first day of the new year, and fluctuated in the ranges of 259–271 μg/m³ and 380–384 μg/m³, respectively. The concentrations of PM2.5 and PM10 were 44 and 100 μg/m³, respectively in 2016, 40 and 80 μg/m³ in 2018 during the same period. In addition, the ban implemented has the most obvious impact on PM2.5 and PM10. Compared with the Spring Festival in 2014, the concentrations of PM2.5 and PM10 increased by 19.15 and 18.64% in 2015, decreased by 18.38% and 15.90% in 2016, and decreased by 16.83% and 26.05% in 2018. Therefore, banning fireworks and firecrackers will help to improve the air quality during the Spring Festival in Zhengzhou City to a certain extent.
1 Introduction
Due to a rapid increase in heating, traffic, industrial emissions and the stable synoptic conditions especially during the cold winter, air pollution has become a major environmental problem that get special attention from the general public (Sahu and Sahu, 2019; Xu et al., 2020). Air pollution not only cause adverse effects on the development of regional economies (Zhou et al., 2019; Xu et al., 2020), but also has a negative impact on the ecological environment and health (Doherty et al., 2017; Hanaoka and Masui, 2019). Studies found that high concentrations of air pollutants may cause cardiovascular disease, chronic obstructive pulmonary disease, respiratory disease and chronic kidney disease (Shakerkhatibi et al., 2015; Todorović et al., 2019; Lin et al., 2020), resulting in a large number of deaths every year throughout the world (Sharma et al., 2019). With the rapid development of economy, severe air pollution engulfed in the winter in China (Zhou et al., 2019); Many studies proposed that coal combustion, industrial emissions, transportation and dust are the main sources of air pollutants in China (Ye et al., 2016; Ge et al., 2018; Wang et al., 2021; Wang et al., 2022); Chinese Spring Festival is an important holiday when a large number of people return to their hometowns causing many factories shut-down, and the traffic volume decreases significantly in megacities. However, setting off fireworks and firecrackers is a great tradition during this festival, which lead to a significant deterioration in air quality but crucially in a short period of time (Saha et al., 2014; Zhao et al., 2014; Lai and Brimblecombe, 2017; Wang et al., 2019; Kumar et al., 2016; Zhang et al., 2017; Greven et al., 2019; Zhang et al., 2020).
The main components of firecrackers are black powder, including potassium nitrate, sulfur powder, charcoal powder, and some of them contain potassium chlorate. When making fireworks, inorganic salt and magnesium powder are added (Wang et al., 2007; Zhang et al., 2017). Therefore, setting off large numbers of fireworks and firecrackers will inevitably cause the concentration of gas pollutants, particulate pollutants, and toxic substances to rise rapidly in a short period of time, resulting in adverse effect on the health and safety of people (Ji et al., 2018; Greven et al., 2019; Zhang et al., 2020). Setting off fireworks and firecrackers is a traditional custom that has been part of celebrating the Spring Festival in China for more than 1000 years (Kumar et al., 2016; Ye et al., 2016; Zhang et al., 2017). Haze still formed in megacities during the Spring Festival, although most enterprises shut down or half shut down, and traffic activities sharply reduce, resulting in a significant reduction in local pollution sources and emissions. The haze pollution could be attributed to intermittent and centralized fireworks and firecrackers during the Spring Festival, due to the chemicals making up their construction (Wang et al., 2019; Zhang et al., 2020).
Setting off fireworks and firecrackers was prohibited in Zhengzhou in 2016 during the spring festival. This inaugural prohibition policy applied to the five districts of Zhongyuan, Erqi, Jinshui, Guancheng and Huiji; as well to the four development zones of Zhengzhou Airport Economy Zone, Zhengdong New District, Zhengzhou Economic and Technological Development Zone and Zhengzhou National High&New Technology Industries Development Zone. In 2018, the policy was in effect strengthened through expansion if its scope to include the heavily built-up areas of wider Zhengzhou to include Xinzheng City, Xinmi City, Dengfeng City, Xingyang City, Zhongmu County and Shangjie District. The implementation of the policy which effectively closed down one specific source of air pollution during the Spring Festival, therefore, provided a unique opportunity in Zhengzhou to investigate the impact of fireworks on atmospheric environmental quality and comment on the efficacy of such policies on improving environmental air quality in general.
Scholars have researched into the impact of fireworks on atmospheric environmental quality. Saha et al. (2014) found that over an urban metropolis in India, an increase in air pollutant concentration, from large amounts of fireworks set off there during the Deepawali Festival, is related to the climate and environmental change patterns in the region. Among these pollutants, the increase in Particle Pollutant concentrations was significance (Kumar et al., 2016). In central London, the total concentration of PM2.5 at night is higher than average daytime values, exceeding national ambient air quality standards (NAAQS), and the risk of PM2.5-PTEs at night during fireworks activities is higher than that during daytime (Hamad et al., 2015). Case crossover studies have shown a positive correlation between fireworks and mortality, as well as PM10, during the Dutch New Year celebrations (Greven et al., 2019). Many studies reported the relationship between fireworks and air pollution in Beijing (Wang et al., 2007), Tianjin (Xie et al., 2019), Nanning (Li et al., 2017), Lanzhou (Zhao et al., 2014)and Chengdu (Zhang et al., 2016; Wu et al., 2018)in China. The research usually involves on-line monitoring during combustion (Zhang et al., 2016; Wu et al., 2018), air pollution status determinations in different periods of the Spring Festival (Zhang et al., 2016), and the impact of fireworks combustion on air pollutants (Jing et al., 2014; Zhao et al., 2014; Zhang et al., 2017).
Obviously, the above research mainly focuses on the impact of fireworks on the overall atmospheric environmental quality of cities in the absence of no-burn or firework prohibition policies, and there are relatively few comparative studies before and after the implementation of such policies. Moreover, the time spans of existing studies are also relatively short, often within a year, and therefore, long-term sequence comparative studies are lacking. The firework prohibition policy was implemented in 2016 and expanded and strengthened in 2018 Based on the air quality monitoring data in Zhengzhou City from 2014 to 2019, We study the effects of banning fireworks and firecrackers on the air quality index and air pollutants such as PM2.5, PM10, NO2, SO2, O3, CO during the Spring Festival to provide a scientific basis for the prohibition of setting off fireworks and firecrackers during the Chinese Spring Festival in other areas of the country.
2 Study Area
Zhengzhou City (112°42′E to 114°14′E, 34°16′N to 34°58′N) is located in the eastern part of the Qinling Mountains, in the transition zone between the second and third levels of the national geographic steps. Its altitude is generally high in the southwest whilst low in the northeast and experiences a temperate continental monsoon climate with poor rainfall and low wind speed. In winter, static wind and inversions are easily formed, which is well recognized as being detrimental to the movement and diffusion of air-based pollutants (Guo et al., 2019).
Zhengzhou is densely populated as a result of the city’s rapid expansion which has also brought about increasing levels of air pollution. According to statistics, by the end of 2017, Zhengzhou had a permanent population of 9.88 million, with an annual GDP of 919.377 billion yuan, hosting some 133 industrial enterprises consuming in excess of 10,000 tons of standard coal annually, accounting for 17.7% of the province’s total consumption, of which its industrial energy consumption has been dominated by coal for a significant amount of time (Wang and Xia, 2018). At the same time, Zhengzhou is not only the main city of the Central Plains urban agglomeration, but also the important transportation hub of “2 + 26 cities” in Beijing, Tianjin, Hebei and its surrounding areas (Guo et al., 2019).
As already alluded to in the introduction, Zhengzhou has a long history of culture in which fireworks and firecrackers have been used for thousands of years in traditional customs associated with events such as the spring festival. This use of fireworks in a significant coal burning area which is meteorologically predisposed to retain air pollution are the main reasons for this study’s interest in choosing Zhengzhou as the study area (Figure 1).
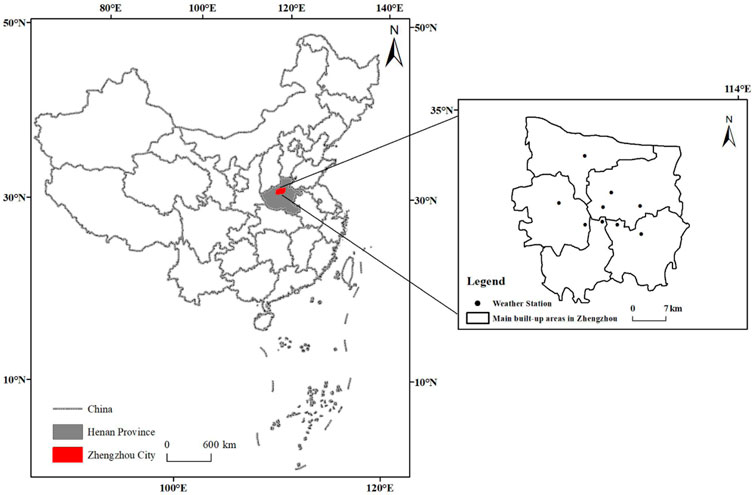
FIGURE 1. Distribution map of meteorological observation stations in zhengzhou city.
3 Materials and Methods
The air quality index and pollutant quality concentration data (including AQI, PM2.5, PM10, NO2, SO2, O3, CO) are crucial to the analysis in this study, and are sourced from the state control station of Zhengzhou Environmental Protection Bureau for the period 2014 to 2019. The pollutant quality concentration and meteorological factor data are from http://www.tianqihoubao.com/ and https://www.aqistudy.cn/historydata/ in 2020. In these data sets, for dates where there are missing or partially missing data, the data average for the month in which the date occurred are used in replacement.
According to the ambient air quality standard GB3095-2012 (20160101) (Xie et al., 2019), the following definitions are used: “daily average” refers to the arithmetic mean of 24-h average concentration of a natural day; “quarterly average” refers to the arithmetic mean of daily average concentration in a calendar quarter; and “annual average” refers to the arithmetic mean of daily average concentration in a calendar year. Referencing the lunar calendar, Spring comprises the months March, April and May (92 days); summer comprises June, July and August (92 days); autumn comprises September, October and November (91 days); and winter comprises December as well as January and February of the following year (90 days for no leap year and 91 days for leap year).
According to the revised National Ambient Air Quality Standard (NAAQS-2012) issued by China’s Ministry of Environmental Protection (now known as the Ministry of Ecology and Environment) (Ye et al., 2016; Zhou et al., 2019), AQI is a dimensionless index used to quantitatively describe air quality. As shown in Table 1, AQI is divided into six grades, depending on its value range, where each grade has an associated severity categorization and description. The larger the value range is, means a higher grade which implies the air pollution is more serious and of greater harm to human health. It is, therefore, suitable for characterizing the short-term air quality status and change trend of the city.
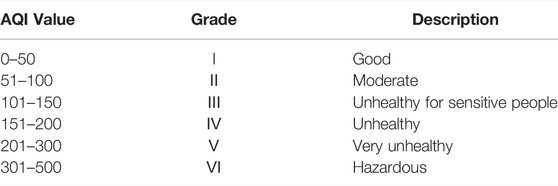
TABLE 1. AQI values, grade, and description.
4 Results
4.1 Air Quality Characteristics of Zhengzhou During the Spring Festival
The air quality index data for Zhengzhou City during the Spring Festival (from the 27th December to the 6th January) from 2014 to 2019 were used to establish the change trend in AQI average during the Spring Festivals as shown in Figure 2. The change trend of the AQI in Zhengzhou City during the Spring Festival shows a double peak trend of first rising and then falling, while the AQI in winter shows a double valley trend of first falling and then rising. The lowest AQI during a Spring Festival occurs in 2019 and can be classified as Grade III, that is “Moderate”; the second lowest occurred in 2018 (AQI = 141); whilst the highest occurred in 2017 (AQI = 197) and can be categorized as grade IV; the second highest in 2015 (AQI = 194), also a Grade IV but is higher than the average annual AQI. This is mainly because Zhengzhou started to implement its firework prohibition policy in 2016, but in 2017 there was a significant increase in the AQI, a reflection of inadequacies in the policy. However, in 2018, with the further expansion of the scope of the policy, the AQI decreased, and decreased further in 2019, the lowest it has been in recent history. This policy change is also the main reason for the opposite trend between AQI during the Spring Festival and AQI in winter.
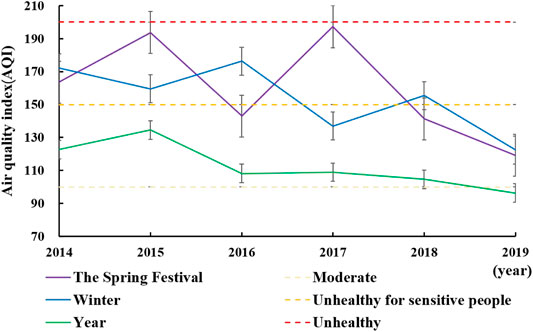
FIGURE 2. AQI change trend of Zhengzhou during Spring Festival from 2014 to 2019.
2016 is the first year of Zhengzhou’s policy implementation prohibiting fireworks, and it is also a turning point for the improvement of its air quality as evidenced in the decrease of 26.17% in the AQI during the Spring Festival in 2016 compared with the same period in 2015, as well as being significantly lower than the average value in winter. Hence, the banning of setting off fireworks and firecrackers during the Spring Festival had a great impact on the atmospheric environment quality. The AQI reached 197 during the Spring Festival in 2017, which is significantly higher than the winter average and close to being categorized as in the Unhealthy grade. This mainly resulted from the realization in 2017 of limitations in the prohibition policy that provided exemptions for certain districts and the problem was further compounded through significant levels of firework theft and their subsequent illegal setting off.
The AQI in 2018 decreased by 28.43% compared with the same period in 2017, moving from the Unhealthy for sensitive people grade to the Moderate grade. This is because the prohibition policy was strengthened in 2018 through expansion of its jurisdiction from the original five districts and four development zones to include the built-up areas surrounding the wider city. The AQI index further decreased significantly during the Spring Festival of 2019, reaching its lowest level (AQI = 119) in recent years.
The distribution of the air quality grades for Zhengzhou during the Spring Festivals from 2014 to 2019 are shown in Table 2. The air quality levels from the 27th December to the 1st January from 2014 to 2015 are all between III-VI. After the implementation of Zhengzhou’s firework prohibition policy in 2016, the air quality has significantly improved, ranking at level II for four consecutive days. With the relaxation of the prohibition policy in 2017, the air quality level from the 27th December to the 1st January remains high, and only after the 3rd January does it reduce. With the strengthening of the prohibition policy during the Spring Festival, Zhengzhou’s air quality from the 27th of December to the 1st January in 2018, significantly improved compared with 2017. Finally, the air quality obviously improved from the 27th December 2019 to the 1st January, while the air quality from the third day to the 6th January is eminently an improvement from that of previous years, a result that is attributed to the further strengthening of the prohibition policy, and corresponds to the results of annual AQI mean changes during the Spring Festival in Zhengzhou. The results indicated that the prohibition of fireworks and firecrackers plays an important role in improving the air quality of Zhengzhou during the Spring Festival, especially from the 27th December to the 1st January.
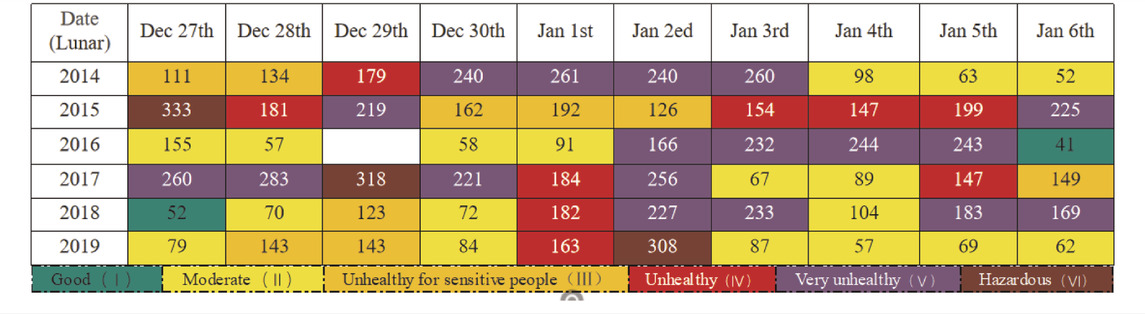
TABLE 2. Distribution of air quality grades during the Spring Festival of Zhengzhou from 2014 to 2019.
4.2 Daily Variation Characteristics of Pollutant Concentrations
The combustion of fireworks and firecrackers has an effect on the airborne concentrations of gas pollutants, particulate pollutants, heavy metals and toxic substances. The daily variations of pollutant concentrations were stduied in Zhengzhou during Spring Festival over three periods: firstly, from 2014 to 2015 which is before the implementation of the initial firework prohibition policy in 2016; secondly, from 2016 to 2017 during the initial implementation of the policy; and thirdly, from 2018 to 2019 after the implementation of the strengthened prohibition policy in 2018.
4.2.1 Variation Characteristics of Pollutant Concentrations Before the Prohibition Policy (2014–2015)
As shown in Figure 3, the average concentrations of PM2.5 and PM10 increased during the Spring Festivals from 2014 to 2015. In 2014, the average concentration of PM2.5 and PM10 were 126.18 and 178.97 μg/m³, respectively; whilst in 2015, they were 150.34 and 212.33 μg/m³, respectively; both exceeding the national secondary atmospheric standard. Secondly, as shown in Figure 4, from a local point of view, the PM2.5 concentration reached a peak on the 1st January in 2014 at 210.75 μg/m³, and peaked again on the 3rd January at 210.38 μg/m³; whilst the PM10 concentration peaked on the 2nd January at 381.30 μg/m³. In 2015, the first peaks of PM2.5 (283.17 μg/m³) and PM10 (333.63 μg/m³) occurred on the 27th of December, whereas the second peak of PM2.5 (174.67 μg/m³) occurred on the 6th January, and the second peak of PM10 (257.21 μg/m³) occurred on the 5th January.
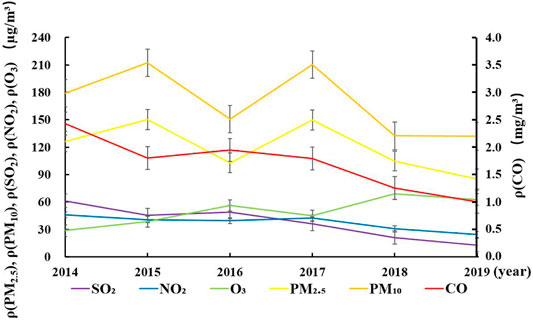
FIGURE 3. Annual change trend of average concentration of main pollutants in Zhengzhou during the Spring Festival from 2014 to 2019.
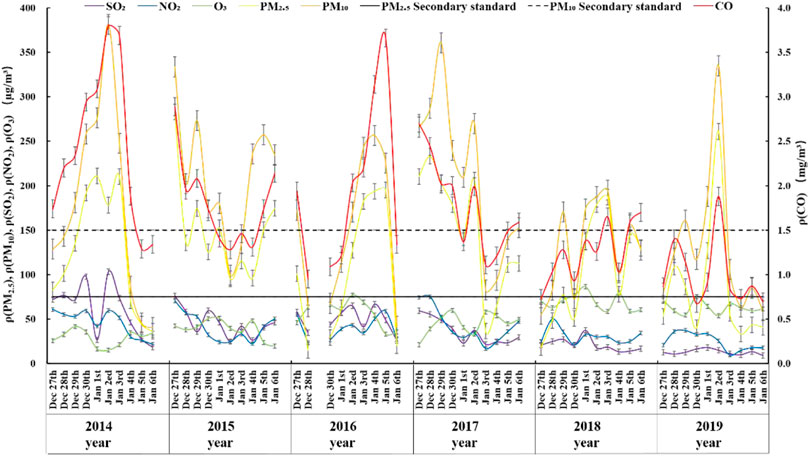
FIGURE 4. Daily trend of average concentration of main pollutants in Zhengzhou during the Spring Festival from 2014 to 2019.
The average concentrations of SO2 and NO2 decreased during the Spring Festival from 2014 to 2015. In 2014, the average concentration of SO2 and NO2 were 61.36 and 45.96 μg/m³, respectively; whilst in 2015, they were 45.55 and 40.85 μg/m³, respectively. Secondly, from a local point of view, the concentrations of SO2 and NO2 in 2014 reached their respective first troughs of 26.71 and 42.21 μg/m³ on the 1st January, and troughed again on the 6th January at 18.38 and 21.63 μg/m³, respectively. In 2015, the troughs for SO2 occurred on the 2nd January, whilst that of NO2 was still on the 1st January.
Before the prohibition policy came into effect, the average concentration of CO decreased during the Spring Festivals of 2014 and 2015, whilst that of O3 increased. The average concentrations in 2014 and 2015 of CO are 2.43 mg/m³, 1.80 mg/m³ and of O3 are 28.75 and 38.90 μg/m³, respectively. The CO concentration first increased slowly, reaching a peak of 3.69 mg/m³ on the 3rd January in 2014, then decreased rapidly to its lowest value on the 6th January. CO concentrations showed a general downward trend, which troughed on the 2nd January in 2015 at 1.28 mg/m³ and again on the 4th January at 1.31 mg/m³. In 2014, the O3 concentration peaked on the 29th December and on the 1st January, and in 2015, it peaked mainly on the 1st and 4th January. The high concentrations of pollutants mainly occur on the 1st and 2nd January, and also on the 5th and 6th January, which also confirms that New Year’s Eve, the 1st and 5th January (commonly known as the fifth day break) are the peak periods for setting off fireworks during the Spring Festival (Pang et al., 2020).
4.2.2 Variation Characteristics of Pollutant Concentrations During the Initial Prohibition Period (2016–2017)
As shown in Figure 3 the average concentrations of PM2.5 and PM10 showed an upward trend from 2016 to 2017. In 2016, the average concentration of PM2.5 and PM10 were 102.98 and 150.52 μg/m³, respectively, and in 2017, they were 149.88 and 210.20 μg/m³, respectively. Compared with 2015, the average concentrations of PM2.5 and PM10 decreased by 31.50% and 29.11%, respectively. As shown in Figure 4, the average concentrations of PM2.5 and PM10 in 2016 (the first year of prohibition policy) troughed at 14.67, 63.79 μg/m³, respectively on 28 December and troughed again on the 6th January. The first trough in 2017 is on the 1st January, and the second trough occurred on the 3rd January.
The average concentrations of SO2 and NO2 during the Spring Festival before the prohibition policy came into effect in 2016 and 2017 show a slight upward trend. In 2016, the average concentrations of SO2 and NO2 were 49.08, 39.70 μg/m³, respectively, and in 2017, they were 36.22 and 42.61 μg/m³, respectively. The trend of SO2 and NO2 changes in 2016 are similar, troughing on the 28th December, and on the 3rd and 6th January. In 2017, the trend of SO2 and NO2 is similar, troughing on the 1st and the 3rd January.
The average concentrations of CO decreased during the Spring Festival from 2016 to 2017, while O3 increased. The average concentrations of CO in 2016 and 2017 are 1.95 and 1.79 mg/m³, respectively, whilst the average concentrations of O3 are 56.22 and 45.02 μg/m³, respectively. In 2016 (the first year of the prohibition policy), the CO concentrations troughed at0.95 mg/m³ on the 28th December and at 1.34 mg/m³ on the 6th January, whilst in 2017, the CO concentrations troughed at 1.37 mg/m³ and 1.11 mg/m³ on the 1st and 3rd January. In 2016, the O3 concentrations peaked on the 2nd January at 76.92 μg/m³, and in 2017, it peaked on Spring Festival’s Eve at 59.75 μg/m³ and on the 3rd January at 57.67 μg/m³.
4.2.3 Variation Characteristics of Pollutant Concentrations After Expansion of the Prohibition Policy (2018–2019)
As shown in Figure 3, after the implementation of the expanded prohibition policy, the average concentrations of PM2.5 and PM10 in Zhengzhou during the Spring Festival showed a slight downward trend. In 2018, the average concentrations of PM2.5 and PM10 were 104.94 and 132.34 μg/m³, respectively, and in 2019, they were 85.01 and 131.88 μg/m³, respectively. As shown in Figure 4, from a local point of view, in 2018 (scope of prohibition policy expanded) the first peaks of PM2.5 and PM10 occurred on the 29 December at 77.04 and 170.67 μg/m³, respectively; whilst the second peak occurred on the 3rd January at 187.29 and 195.08 μg/m³, respectively. However, in 2019, PM2.5 and PM10 concentrations reach their respective peaks of 260.96 and 334.83 μg/m³ after the 2nd January, and they decrease rapidly, from the 3rd to the 6th January when they become lower than the national secondary atmospheric standard.
The average concentrations of SO2 and NO2 during the Spring Festivals of 2018 and 2019 show a slight downward trend. The average concentrations of SO2 and NO2 in 2018 are 21.13 and 30.65 μg/m³, respectively, and in 2019 are 12.90 and 24.53 μg/m³, respectively. The trend of SO2 and NO2 changes is similar. In 2018, SO2 peaked on the 29th December, the first day of January and then again on the sixth day of January; whilst NO2 peaked on the 28th December, the first and sixth days of January. In 2019, SO2 peaked on the first and fifth days of January, and NO2 peaked on the 29th December and 5th January.
The average concentrations of CO and O3 during the Spring Festivals from 2018 to 2019 show a slight downward trend. The average concentrations of CO in 2018 and 2019 are 1.26 mg/m³ and 1.00 mg/m³, respectively; whilst the average concentrations of O3 in 2018 and 2019 are 69.10 and 62.83 μg/m³, respectively. In 2018, the CO concentration reached its first trough of 0.93 mg/m³ on New Year’s Eve, its second trough of 1.03 mg/m³ on the 4th January, whereas in 2019, it reached its first trough of 0.68 mg/m³ on Spring Festival’s Eve, and its second trough of 0.70 mg/m³ on the 6th January. In 2018, O3 concentrations reached troughs of 58.58, 60.67 μg/m³ on the 3rd and 6th January. Whereas, in 2019, it reached troughs of 54.33 μg/m³ on the 29th December and 2nd January.
4.3 Impact of the Prohibition Policy on Hourly Variation Characteristics
The hourly variations in the average concentrations of the major pollutants in Zhengzhou from New Year’s Eve to the 1st January in 2014 and 2015 are shown in Figures 5A,B, respectively. The concentrations of PM2.5 and PM10 on New Year’s Eve in 2014 are initially at relatively low levels but from 03:00–09:00 their respective concentrations exceed 200 μg/m³ and 300 μg/m³, and between 0:00–01:00 on the 1st January, they reached their respective peaks of 259 and 384 μg/m³. Between 02:00–05:00, the concentrations of PM2.5 and PM10 began to decline. However, at 06:00 the concentration of PM10 was still above 240 μg/m³ but by 18:00 it peaked again at 340 μg/m³. An hour later at 19:00, PM2.5 peaked again at 269 μg/m³.
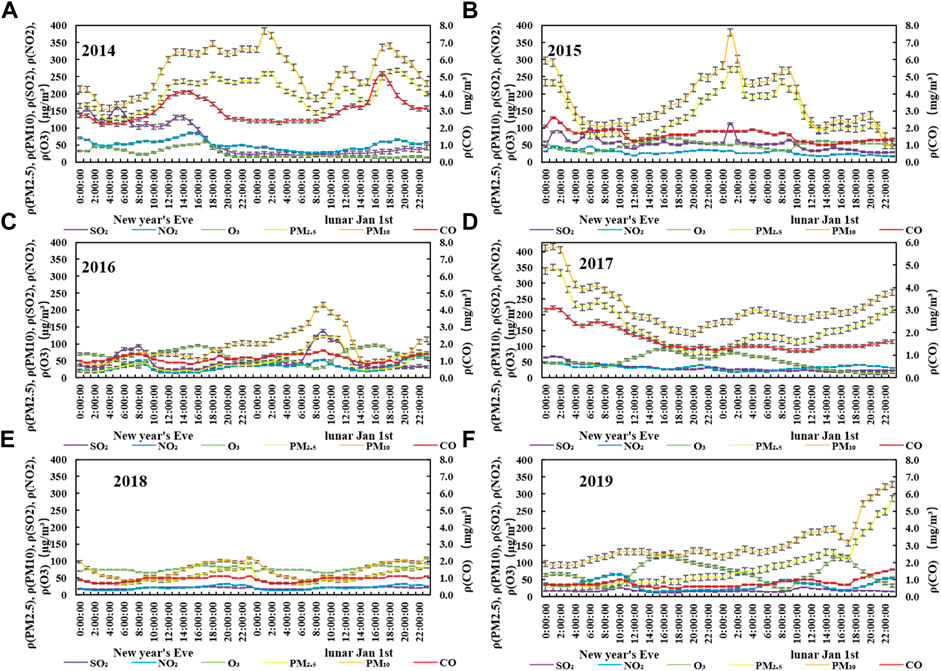
FIGURE 5. Hourly variation of the average concentration of main pollutants from New Year’s Eve to the 1st January in 2014–2019.
In 2015, between 05:00–17:00 on New Year’s Eve, the concentrations of PM2.5 and PM10 were at low levels. Compared with the same period of the Spring Festival in 2014, the rising speed of pollutant concentrations are slightly delayed, and the time to reach their peaks lagged slightly. The PM2.5 concentration exceeded 200 μg/m³ at 23:00 on New Year’s Eve but at 01:00 on the 1st January it peaked at 271 μg/m³. At the same time, the PM10 concentration also peaked at 380 μg/m³, exceeding 300 μg/m³ for the first time. After 01:00 the PM2.5 and PM10 concentrations rapidly decreased until about 12:00 when their concentrations remained at relatively low levels. In addition, in 2014 and 2015, the timings of the PM2.5 and PM10 concentration peaks are in good agreement with the traditional peak period for setting off fireworks, and the response results are obvious.
The firework prohibition policy was implemented for the first time, on the 1st January 2016 in Zhengzhou City as well as in five districts, four development zones and built-up districts of counties (cities) in the wider Zhengzhou region. In 2016, the air quality of New Year’s Eve was in the two grades of excellent and good. As can be seen in Figure 5C, the concentrations of PM2.5, PM10, SO2, NO2 and CO peaked at 09:00 on the 1st January with respective concentrations of 122, 216, 138, and 52 μg/m³ and 1.6 mg/m3; these peaks are significantly delayed compared with the peak timings of pollutants in 2014–2015 prior to the implementation of the prohibition policy covering the Spring Festival, The results are consistent in that, after the implementation of the policy the peak value of pollutants decreased (Zhang et al., 2020). The concentration of O3 peaked at 14:00–18:00 on the 1st January, while other pollutants troughed at this time, an observation that is mainly attributed to a series of photochemical reactions involving oxygen, nitrogen oxides and volatile organic compounds in the air under the action of natural light. Compared with the same period in 2014, the respective pollutant concentration decreased by 52.90%, 43.75%, 11.54%, 38.82%, 69.23% and 53.45%; and compared with the same period in 2015, the respective pollutant concentrations decreased by 54.98%, 43.16%, 22.12%, 10.64%, 38.46% and 65.71%. This essentially shows the net effect of the prohibition policy during the Spring Festival in Zhengzhou, the concentration of various pollutants has decreased significantly, and the air quality has been improved significantly.
The change characteristics of pollutants concentrations in 2017 are quite different from those in 2014–2016 (Figure 5D). On New Year’s Eve, from 00:00–03:00, the concentration of each pollutant is at a high level. On New Year’s Eve, from 03:00–12:00 and on the 1st January, from 17:00–23:00, the concentration of each pollutant is still at a high level, while from 13:00 to 16:00 on the 1st January, the concentration of each pollutant became relatively low; From 23:00 on New Year’s Eve to 02:00 on the 1st January, fireworks were set off intensively, but the concentration of pollutants in 2017 was not high. This shows that the policy has played a role in restraining the traditional high concentration stage of pollutants in 2017. It may also be that some residents illegally set off fireworks and firecrackers but deliberately avoided do so in the peak period.
On New Year’s Eve and the 1st January in 2018, as can be seen in Figure 5E, the concentrations of pollutants were generally low. PM2.5 and PM10 took the lead in reaching respective troughs of 32 and 41 μg/m³ at 06:00 on New Year’s Eve, both of which exceeded the national level II standard. After that, the concentrations gradually increased, reaching respective peaks of 93 and 109 μg/m³ at 23:00. Compared with the same period in 2014 (before the prohibition policy), their respective concentrations decreased by 61.09% and 67.07%. After that, they only reached troughs at 06:00 on the 1st January, and then began to rise slowly, reaching respective peaks of 93 μg/m³and 109 μg/m³ at 23:00, which is a respective decrease of 124 μg/m³ and 162 μg/m³ compared with the same period in 2017, showing a very large reduction ratio.
Concentrations of PM2.5 and PM10 on New Year’s Eve 2019 are relatively low and do not exceed the national secondary air quality standard (Figure 5F). However, with the arrival of the 1st January, the concentrations of pollutants gradually increased, and the increasing range became larger and larger. The first peaks appeared between 14:00–15:00 on the 1st January, whilst the second peaks for PM2.5 and PM10 of 287 μg/m³and 328 μg/m³, respectively occurred at 23:00, and are 54.70% and 39.63% higher than their respective first peaks. In addition, the changes of other gas pollutants concentrations are not obvious.
5 Discussion
In order to further explore the relationship between the release of fireworks and the concentration of various pollutants, the average concentration of various pollutants during the Spring Festival from 2015 to 2019 was compared with that of 2014 and found in Figure 6, the implementation of the ban on combustion has the most significant impact on PM2.5 and PM10 (Lorenzo et al., 2021; ten Brink et al., 2019; Tian et al., 2014). In 2015, the concentrations of PM2.5 and PM10 were increased by 19.15 and 18.64%, respectively, compared with 2014. In 2016, the first year of the ban on combustion, the concentrations of PM2.5 and PM10 decreased by 18.38% and 15.90%, respectively, compared with 2014. Compared with 2014, the increase in 2017 was 18.78% and 17.45%, respectively, which was caused by the decline in the implementation of the ban on combustion policy and the intensity of the ban. In 2018, with the further expansion of the scope of the ban and the strengthening of the ban, the concentrations of PM2.5 and PM10 gradually decreased from 2018 to 2019, and dropped to the lowest in 2019, decreasing by 32.63% and 26.31%, respectively. The implementation of the non-combustion policy has little effect on the reduction of SO2, NO2 and CO concentrations, that is, fireworks and firecrackers are not the main cause of their pollution during the Spring Festival, but are determined by the types of pollutants produced by the discharge. With the implementation of the combustion ban policy, the pollutant concentration from 2015 to 2019 showed a downward trend year by year, from 61.36, 45.96, and 2.43 mg/m³ in 2014–2019, reaching a minimum value of 12.90, 24.53 and 1.00, respectively. When the combustion ban policy was initially implemented in 2016 and further strengthened in 2018, there was no significant trend change in SO2, NO2 and CO concentrations. The implementation of the ban on combustion has no effect on the change of O3 concentration. From 2015 to 2019, the O3 concentration increased significantly compared with 2014.
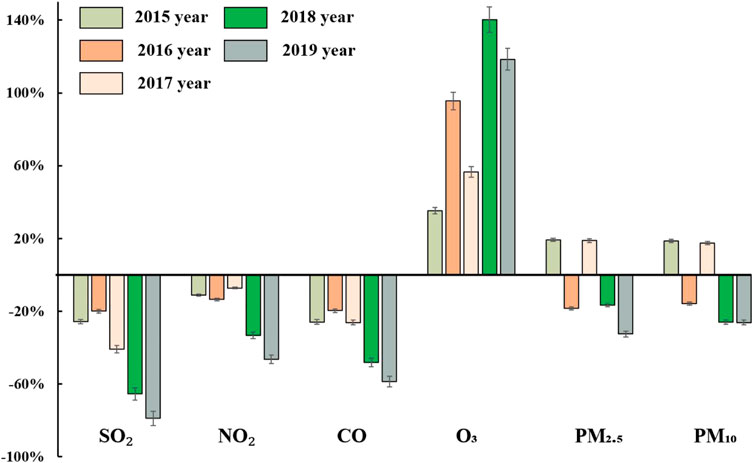
FIGURE 6. average concentration changes of these pollutants from 2015 to 2019 compared to those during Spring Festival periods 2014.
In order to further analyze the phenomenon of the sudden increase of pollutant concentrations during the Spring Festival, the meteorological element data during the Spring Festival from 2014 to 2019 were used to analyze the fluctuation trend. In Figure 7, the inter-annual variation of precipitation and air pressure during the Spring Festival from 2014 to 2019 was not obvious. Only a small amount of precipitation occurred on The New Year’s Eve in 2016 and on the 28th and 29th of the first month of 2019, and the air pressure was mainly fluctuation at 995–1022 Pa. Among them, the air pressure only fluctuated between 998 and 1002 Pa from 2017 to 2018, with the smallest variation. The wind speed, relative humidity and temperature are slightly larger than those of precipitation and air pressure. The wind speed is similar from 2014 to 2017, and the annual average wind speed fluctuates between 1.7 and 2.1 m/s during the Spring Festival. The wind speed is similar from 2018 to 2019, and the average wind speed varies between 2.8 and 2.9 m/s during the Spring Festival. The overall relative humidity changed slightly. The relative humidity was the lowest at 27% during the Spring Festival in 2018. The average relative humidity during the Spring Festival from 2016 to 2017 was similar, at 75% and 81%, respectively. The relative humidity in 2014, 2015 and 2019 was relatively concentrated, respectively. 50%, 43%, 46%. The changes in temperature and wind speed are roughly similar. The temperatures in 2018 and 2019 are similar and higher than those in other years. The average temperature during the Spring Festival is 1.9 and 1.6°C, respectively, and the temperature fluctuates from −0.6 to 1.4°C from 2014 to 2017.
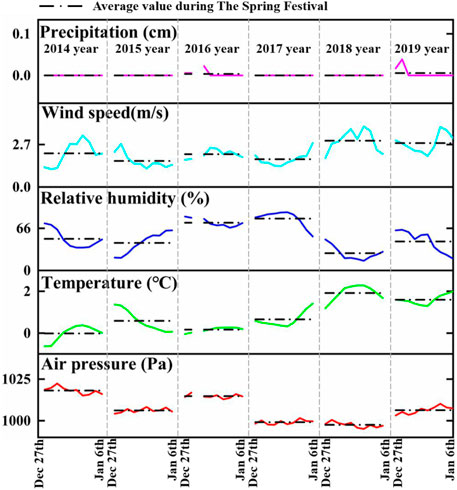
FIGURE 7. Various meteorological elements change trend of Zhengzhou during Spring Festival half month from 2014 to 2019.
6 Conclusion
Based on air pollution data from 2014 to 2019, this study analyzed the characteristics of concentration changes of various air pollutants during the Spring Festival in Zhengzhou City for six consecutive years, to investigate the impact of the fireworks and firecracker prohibition policy, that came into effect in 2016, on the air environmental quality. The conclusions of the study are as follows:
Banning fireworks and firecrackers significantly improved Zhengzhou’s air quality. There were small fluctuations in precipitation, air pressure, wind speed, temperature and relative humidity during the Spring Festival from 2014 to 2019. The AQI (143) of the Spring Festival in Zhengzhou in 2016 (the first year of the ban) was significantly better than that in 2014 (164) and 2015 (194). With the further implementation of the embargo policy, the air quality in 2018 and 2019 showed obvious improvements, decreasing to 141 and 119, respectively. The turning point for air quality improvement came in 2016, which coincided with the initial implementation of the policy. At the same time, the ban has effectively slowed down the sudden increase in pollutant concentrations from New Year’s Eve to the first day of the first lunar month during the traditional heavy pollution period, showing an obvious “peak shaving” effect. In 2014, the concentrations of PM2.5 and PM10 reached their first peaks at 1:00 a.m. on the first day of the new year, at 259 and 384 g/m³, respectively. In 2015, the peaks were also reached at 1:00 on the first day of the first lunar month, at 271 and 380 g/m³, respectively. During the same period, the PM2.5 and PM10 concentrations were 44 and 100 μg/m³, respectively in 2016, and 40 and 80 μg/m³ in 2018. In addition, the implementation of the ban on combustion has the most obvious impact on PM2.5 and PM10. During the Spring Festival of 2015, which was not banned from burning, compared with 2014, the concentrations of PM2.5 and PM10 increased by 19.15% and 18.64%, respectively. In 2016, they decreased by 18.38% and 15.90%, respectively, compared with 2014. In 2018, the concentrations of PM2.5 and PM10 decreased by 16.83% and 26.05%, respectively, compared with 2014.
Data Availability Statement
The raw data supporting the conclusion of this article will be made available by the authors, without undue reservation.
Author Contributions
DL: data curation, methodology, software, formal analysis, and writing–original draft. WL: methodology, investigation, and data curation. JP: resources. QM: writing–review and editing and supervision.
Funding
This work was funded by National Natural Science Foundation of China (42105071), China Postdoctoral Science Foundation (2019M652520) and Program for Innovative Talents of Zhongyuan Postdoctoral.
Conflict of Interest
The authors declare that the research was conducted in the absence of any commercial or financial relationships that could be construed as a potential conflict of interest.
Publisher’s Note
All claims expressed in this article are solely those of the authors and do not necessarily represent those of their affiliated organizations, or those of the publisher, the editors and the reviewers. Any product that may be evaluated in this article, or claim that may be made by its manufacturer, is not guaranteed or endorsed by the publisher.
Acknowledgments
We are grateful to Dr John Turnbull for helping to improve the manuscript with comments on a draft of the paper.
References
Doherty, R. M., Heal, M. R., and O’Connor, F. M. (2017). Climate Change Impacts on Human Health over Europe through its Effect on Air Quality. Environ. Health 16, 118. doi:10.1186/s12940-017-0325-2
Ge, B., Wang, Z., Lin, W., Xu, X., Li, J., Ji, D., et al. (2018). Air Pollution over the North China Plain and its Implication of Regional Transport: A New Sight from the Observed Evidences. Environ. Pollut. 234, 29–38. doi:10.1016/j.envpol.2017.10.084
Greven, F. E., Vonk, J. M., Fischer, P., Duijm, F., Vink, N. M., and Brunekreef, B. (2019). Air Pollution during New Year's Fireworks and Daily Mortality in the Netherlands. Sci. Rep. 9, 5735. doi:10.1038/s41598-019-42080-6
Guo, M. M., Jiang, N., Wang, S. B., Duan, S. G., and Zhang, R. Q. (2019). Analysis of Air Pollution Characteristics and Meteorological Conditions in Zhengzhou from 2014 to 2017. Huan Jing Ke Xue 40, 3856–3867. doi:10.13227/j.hjkx.201901118
Hamad, S., Green, D., and Heo, J. (2015). Evaluation of Health Risk Associated with Fireworks Activity at Central London. Air Qual. Atmos. Health 9, 735–741. doi:10.1007/s11869-015-0384-x
Hanaoka, T., and Masui, T. (2019). Exploring Effective Short-Lived Climate Pollutant Mitigation Scenarios by Considering Synergies and Trade-Offs of Combinations of Air Pollutant Measures and Low Carbon Measures towards the Level of the 2 °C Target in Asia. Environ. Pollut. 261, 113650. doi:10.1016/j.envpol.2019.113650
Jing, H., Li, Y.-F., Zhao, J., Li, B., Sun, J., Chen, R., et al. (2014). Wide-range Particle Characterization and Elemental Concentration in Beijing Aerosol during the 2013 Spring Festival. Environ. Pollut. 192, 204–211. doi:10.1016/j.envpol.2014.06.003
Ji, D. Y., Cui, Y., Li, D. W., He, J., Wang, L. L., Zhang, H. L., et al. (2018). Characterization and source identification of fine particulate matter in urban Beijing during the 2015 Spring Festival. Sci. Total Environ. 628-629, 430–440. doi:10.1016/j.scitotenv.2018.01.304
Kumar, M., Singh, R. K., Murari, V., Singh, A. K., Singh, R. S., and Banerjee, T. (2016). Fireworks Induced Particle Pollution: A Spatio-Temporal Analysis. Atmos. Res. 180, 78–91. doi:10.1016/j.atmosres.2016.05.014
Lai, Y., and Brimblecombe, P. (2017). Regulatory Effects on Particulate Pollution in the Early Hours of Chinese New Year, 2015. Environ. Monit. Assess. 189, 467. doi:10.1007/s10661-017-6167-0
Li, J., Xu, T., Lu, X., Chen, H., Nizkorodov, S. A., Chen, J., et al. (2017). Online Single Particle Measurement of Fireworks Pollution during Chinese New Year in Nanning. J. Environ. Sci. 53, 184–195. doi:10.1016/j.jes.2016.04.021
Lin, S. Y., Ju, S. W., Lin, C. L., Hsu, W. H., Lin, C. C., Ting, I. W., et al. (2020). Air Pollutants and Subsequent Risk of Chronic Kidney Disease and End-Stage Renal Disease: A Population-Based Cohort Study. Environ. Pollut. 261, 114154–154. doi:10.1016/j.envpol.2020.114154
Lorenzo, G. R., Bañaga, P. A., Cambaliza, M. O., Cruz, M. T., Azadiaghdam, M., Arellano, A., et al. (2021). Measurement Report: Firework Impacts on Air Quality in Metro Manila, Philippines, during the 2019 New Year Revelry. Atmos. Chem. Phys. 21, 6155–6173. doi:10.5194/acp-21-6155-2021
Pang, N., Gao, J., Zhao, P., Wang, Y., Xu, Z., and Chai, F. (2020). Impact of fireworks control on air quality in four Northern Chinese cities during the Spring Festival. Atmos. Environ. 117958. doi:10.1016/j.atmosenv.2020.117958
Saha, U., Talukdar, S., Jana, S., and Maitra, A. (2014). Effects of Air Pollution on Meteorological Parameters during Deepawali Festival over an Indian Urban metropolis. Atmos. Environ. 98, 530–539. doi:10.1016/j.atmosenv.2014.09.032
Sahu, C., and Sahu, S. K. (2019). Ambient Air Quality and Air Pollution index of Sambalpur: a Major Town in Eastern India. Int. J. Environ. Sci. Technol. 16, 8217–8228. doi:10.1007/s13762-019-02383-7
Shakerkhatibi, M., Dianat, I., Asghari Jafarabadi, M., Azak, R., and Kousha, A. (2015). Air Pollution and Hospital Admissions for Cardiorespiratory Diseases in Iran: Artificial Neural Network versus Conditional Logistic Regression. Int. J. Environ. Sci. Technol. 12, 3433–3442. doi:10.1007/s13762-015-0884-0
Sharma, R., Kumar, R., Sharma, D. K., Son, L. H., Priyadarshini, I., Pham, B. T., et al. (2019). Inferring Air Pollution from Air Quality index by Different Geographical Areas: Case Study in India. Air Qual. Atmos. Health 12, 1347–1357. doi:10.1007/s11869-019-00749-x
ten Brink, H., Otjes, R., and Weijers, E. (2019). Extreme Levels and Chemistry of PM from the Consumer Fireworks in the Netherlands. Atmos. Environ. 212, 36–40. doi:10.1016/j.atmosenv.2019.04.046
Tian, Y. Z., Wang, J., Peng, X., Shi, G. L., and Feng, Y. C. (2014). Estimation of the Direct and Indirect Impacts of Fireworks on the Physicochemical Characteristics of Atmospheric PM10 and PM2.5. Atmos. Chem. Phys. 14, 9469–9479. doi:10.5194/acp-14-9469-2014
Todorović, M. N., Radenković, M. B., Rajšić, S. F., and Ignjatović, L. M. (2019). Evaluation of Mortality Attributed to Air Pollution in the Three Most Populated Cities in Serbia. Int. J. Environ. Sci. Tech. 16, 7059–7070. doi:10.1007/s13762-019-02384-6
Wang, Y., Zhuang, G., Xu, C., and An, Z. (2007). The Air Pollution Caused by the Burning of Fireworks during the Lantern Festival in Beijing. Atmos. Environ. 41, 417–431. doi:10.1016/j.atmosenv.2006.07.043
Wang, S. Y., and Xia, C. Y. (2018). Henan Statistical yearbook[M], 978-7-5037-8537-5. Beijing: China Statistics Press, 7–8.
Wang, S. S., Yu, R. L., Shen, H. Z., Wang, S., Hu, Q. C., Cui, J. Y., et al. (2019). Chemical characteristics, sources, and formation mechanisms of PM2.5 before and during the Spring Festival in a coastal city in Southeast China. Environ. Pollut. 251, 442–452. doi:10.1016/j.envpol.2019.04.050
Wang, Y., Liu, C., Wang, Q., Qin, Q., Ren, H., and Cao, J. (2021). Impacts of Natural and Socioeconomic Factors on PM2.5 from 2014 to 2017. J. Environ. Manage. 284, 112071. doi:10.1016/j.jenvman.2021.112071
Wang, Y., Wu, R., Liu, L., Yuan, Y., Liu, C., Hang Ho, S. S., et al. (2022). Differential Health and Economic Impacts from the COVID-19 Lockdown between the Developed and Developing Countries: Perspective on Air Pollution. Environ. Pollut. 293, 118544. doi:10.1016/j.envpol.2021.118544
Wu, K., Duan, M., Liu, H., Zhou, Z., Deng, Y., Song, D., et al. (2018). Characterizing the Composition and Evolution of Firework-Related Components in Air Aerosols during the Spring Festival. Environ. Geochem. Health 40, 2761–2771. doi:10.1007/s10653-018-0141-9
Xie, Z., Li, Y., Qin, Y., and Zheng, Z. (2019). Optimal Allocation of Control Targets for PM2.5 Pollution in China's Beijing-Tianjin-Hebei Regions. Pol. J. Environ. Stud. 28, 3941–3949. doi:10.15244/pjoes/97358
Xu, Y., Liu, H., and Duan, Z. (2020). A Novel Hybrid Model for Multi-step Daily AQI Forecasting Driven by Air Pollution Big Data. Air Qual. Atmos. Health 13, 197–207. doi:10.1007/s11869-020-00795-w
Ye, C., Chen, R., and Chen, M. (2016). The Impacts of Chinese Nian Culture on Air Pollution. J. Clean. Prod. 112, 1740–1745. doi:10.1016/j.jclepro.2015.04.113
Zhang, X. C., Shen, H. F., Li, T. W., and Zhang, L. P. (2020). The Effects of Fireworks Discharge on Atmospheric PM2.5 Concentration in the Chinese Lunar New Year. Int. J. Environ. Res. Public Health 17(24). doi:10.3390/ijerph17249333
Zhang, X., Shen, H., and Li, T. (2016). “Effect Characteristics of Chinese New Year Fireworks/firecrackers on PM 2.5 Concentration at Large Space and Time Scales,” in Proceeding of the 2016 4thInternational Workshop on Earth Observation and RemoteSensing Applications, Guangzhou, July 2016 (IEEE), 179–182.
Zhang, J., Yang, L., Chen, J., Mellouki, A., Jiang, P., Gao, Y., et al. (2017). Influence of Fireworks Displays on the Chemical Characteristics of PM2.5 in Rural and Suburban Areas in Central and East China. Sci. Total Environ. 578, 476–484. doi:10.1016/j.scitotenv.2016.10.212
Zhao, S., Yu, Y., Yin, D., Liu, N., and He, J. (2014). Ambient Particulate Pollution during Chinese Spring Festival in Urban Lanzhou, Northwestern China. Atmos. Pollut. Res. 5, 335–343. doi:10.5094/apr.2014.039
Keywords: Chinese spring festival, fireworks, air quality, China, pollutants
Citation: Liu D, Li W, Peng J and Ma Q (2022) The Effect of Banning Fireworks on Air Quality in a Heavily Polluted City in Northern China During Chinese Spring Festival. Front. Environ. Sci. 10:872226. doi: 10.3389/fenvs.2022.872226
Received: 09 February 2022; Accepted: 07 March 2022;
Published: 27 April 2022.
Edited by:
Qiyuan Wang, Institute of Earth Environment (CAS), ChinaReviewed by:
Yichen Wang, Northwestern Polytechnical University, ChinaZhisheng Yao, Institute of Atmospheric Physics (CAS), China
Copyright © 2022 Liu, Li, Peng and Ma. This is an open-access article distributed under the terms of the Creative Commons Attribution License (CC BY). The use, distribution or reproduction in other forums is permitted, provided the original author(s) and the copyright owner(s) are credited and that the original publication in this journal is cited, in accordance with accepted academic practice. No use, distribution or reproduction is permitted which does not comply with these terms.
*Correspondence: Qingxia Ma, bXF4QGhlbnUuZWR1LmNu