 Xiaoyu Sun
 Yawen He2*
 Zhenshan Xue
- 1National Marine Environmental Forecasting Center, Beijing, China
- 2Ocean and Spatial Information College, China University of Petroleum, Qingdao, China
- 3Aerospace Information Research Institute, Chinese Academy of Sciences, Beijing, China
- 4Northeast Institute of Geography and Agroecology, Chinese Academy of Sciences, Changchun, China
Obtaining field sea ice data is crucial for the validation and improvement of satellite data and numerical models. During the 36th Chinese National Antarctic Research Expedition, seven field observations covering the whole area were conducted in Nella Fjord, and large amounts of in situ sea ice and snow thickness data were acquired. Then, the influences of snow cover, topography, and air temperature on the sea ice growth rate were examined. Based on the relationship between the sea ice growth rate and air temperature, an empirical model of sea ice thickness was developed. The results show that sea ice started to freeze in early March, and the peak growth rate was reached in mid-June, with a mean growth rate of 0.62 cm/d. Between mid-June and mid-October, the mean growth rate was 0.36–0.4 cm/d; between mid-October and mid-November, the mean growth rate decreased to 0.15 cm/d. After mid-November, ice growth stopped, and the ice thickness decreased. The growth rate and thickness of sea ice near the shore were generally greater than those closer to the center of the fjord, with differences of 0.25 cm/d in mean growth rate and 7.16 cm in mean thickness. Because of the large exchanges of heat between the atmosphere and the ocean, the sea ice thickness increased rapidly during the early stage of freeze-up. When the air temperature was between -12 and −15°C, the ice growth rate was between 0.36 and 0.4 cm/d. However, when the ice thickness reached 0.5 m, the sea ice growth rate became less sensitive to air temperature. In addition, we found that the proposed model has high simulation accuracy for the growth rate of sea ice. Based on the model, we estimated that the growth rates become zero at an air temperature of approximately −4°C. Our study highlights the inverse relationship between the sea ice growth rate and the snow thickness and the fact that the sea ice thickness is mainly affected by air temperature.
Introduction
As the largest cold source on Earth, the Antarctic holds approximately 91% of the global ice mass (i.e., ∼57 m of sea-level equivalent) and plays a key role in the global climate system (Massom and Stammerjohn, 2010; Dirscherl et al., 2020). The amount of solar energy absorbed by the underlying surface varies substantially according to the surface type. For example, the albedo of seawater is low and is generally less than 0.1, the albedo of sea ice usually exceeds 0.5, and the albedo of pure snow exceeds 0.85 (Massom et al., 2001). As changes in the underlying surface will result in a large variation in albedo, thereby leading to a change in the absorption of solar radiation, the presence of sea ice and snow has a significant effect on air–sea heat exchange (Cavalieri and Parkinson, 2008). Due to their high sensitivity to even small-scale meteorological changes, sea ice and snow in Antarctica are regarded as important indicators of global climate change (Vaughan et al., 2013).
In contrast to the remarkable shrinkage of sea ice in the Arctic (Comiso, 2012; Comiso and Hall, 2014), sea ice around the Antarctic exhibits more complex characteristics of changes. According to the National Snow and Ice Data Center’s Sea Ice Index and some reports released by the National Oceanic and Atmospheric Administration (NOAA) and National Aeronautics and Space Administration (NASA), from the start of the satellite record in November 1978 to March 2021, the minimum sea ice extent has decreased 13.1% per decade since 1979 (Scott, 2020), and from 1979 to 2012, Antarctic sea ice exhibited a slight increase but showed strong year-to-year variability (Cavalieri et al., 2003; Cavalieri and Parkinson, 2008). From 2016, a dramatic decline in sea ice around Antarctica started to occur, and the sea ice extent rapidly decreased to record low levels (Scott, 2021). In order to achieve the variation law of Antarctic sea ice, it is an important prerequisite to study the influencing factors and mechanism of sea ice.
Antarctica is hard to reach, and the climate is harsh. Many sea ice studies have made use of satellite remote sensing data and numerical simulations to explore ice thickness and extent in Antarctica. To date, the sea ice thickness product retrieved from satellite data has large errors (Kurtz and Markus, 2012) and is unsuitable for current research needs. In a sense, obtaining field sea ice data, regardless of the difficulty and cost of field operations, is crucial for the validation and improvement of satellite data and numerical models (Zhao Jiechen et al., 2017; Hao Guanghua and Zhao, 2019).
Since the establishment of Zhongshan Station in 1999, Chinese researchers have been conducting multidisciplinary sea ice observations in Prydz Bay. Substantial amounts of data have been acquired and have effectively improved our understanding of the region. Thermistor chain buoys were used to investigate sea ice and snow thicknesses in Nella Fjord, as this method can provide more accurate datasets to support ice discharge and mass balance calculations (Lei Ruibo and Qin, 2009; Zhao Jiechen et al., 2017). Floating GPS was adopted to measure snow depth and freeboard height in Nella Fjord; according to the relationship between freeboard, snow depth and sea-ice thickness, sea ice thickness will be greatly underestimated by the negative single-point freeboard under the assumption of hydrostatic equilibrium (Zhang et al., 2020). Simultaneous growth of first-year ice and ablation of second-year ice was observed in the fast ice zone near Zhongshan Station, and the different evolutions were explained by the difference in the conductive heat flux between the first-year ice and second-year ice (Zhao et al., 2017).
On 20 November 2019, two research expedition vessels, Xuelong and Xuelong 2, simultaneously arrived at Zhongshan Station, marking the official opening of the 36th Chinese Antarctic Research Expedition at the station. During this expedition, the National Marine Environmental Forecasting Center focused on sea ice and meteorological observations and obtained a large quantity of valuable research data. Especially during the overwintering period, complete field observation data of sea ice interannual growth and dissipation were obtained.
In this paper, the factors influencing the interannual sea ice growth rate in Nella Fjord and its spatial characteristics are analyzed using multipoint, long-term field-measured ice and snow thickness data and meteorological data in Nella Fjord. An empirical model of sea ice thickness based on the relationship between the sea ice growth rate and air temperature was developed. This study can not only provide methods and data references for the study of the behavior of Antarctic sea ice generation and dissipation but also provide a technical reference for the sea ice forecast service of the Chinese National Antarctic Research Expedition.
Study Area
Nella Fjord is located inside Prydz Bay in East Antarctica (69.37° S–69.39° S, 76.32° E–76.38° E; Figure 1). It is surrounded by hilly landforms and comprises four small fjords formed by glacier retreat. To the east is the Xiehe Peninsula, where Zhongshan Station and Progress Station are located; to the west is the Broknes Peninsula. According to the statistics of historical meteorological observation data since the establishment of Zhongshan Station, the annual average temperature in this area is −9.97°C, the historical daily minimum temperature is -45.7°C, and the daily maximum temperature is 9.8°C. The eastward katabatic wind prevails in this area, and the maximum recorded wind speed is 50.3 m/s. Because of its proximity to the pole and the Indian Ocean, Nella Fjord is under the influence of both the low-pressure system over the Indian Ocean and the high-pressure system over the pole throughout the year and is subject to rapid temperature changes. The air temperature is often above −10°C even in the coldest part of the winter. Due to weak hydrodynamic conditions, Nella Fjord is dominated by level ice, and a small number of icebergs can be found in the fjord year-round.
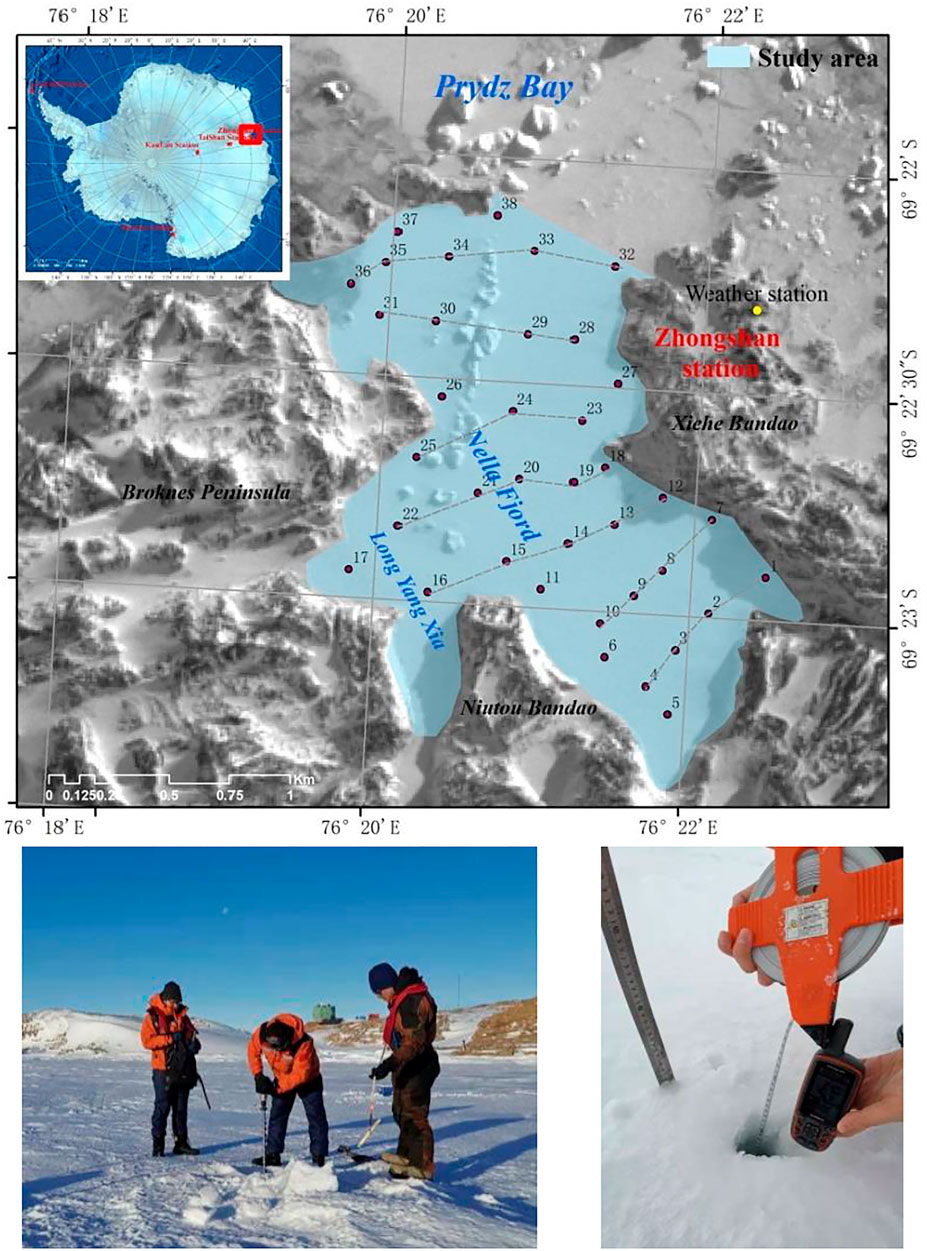
FIGURE 1. Study area and field observation process.
Methods
In situ Data Collection
Seven sections, including 38 observation points, were arranged in Neila Fjord, basically covering all areas of the fjord. Thirty-one of the 38 observation points were located along these transects. They are points 1–4 (transect 1), points 7–10 (transect 2), points 12–17 (transect 3), points 18–22 (transect 4), points 23–25 (transect 5), points 28–31 (transect 6), and points 32–36 (transect 7). Points 5, 6, 11, 26, 27, 37 and 38 are scattered observation points. The spatial distribution of observation points is shown in Figure 1.
Vertical profiles of sea ice were obtained by special electric drill equipment for sea ice measurements, and the sea ice thickness was measured with a special ice ruler. The snow thickness was measured with a standard steel ruler.
Nella Fjord usually starts to freeze in early March, and more stable fast ice forms along the coast in mid-April each year. Usually, in early May, the sea ice in the whole fjord is sufficiently thick for field operations. In 2020, seven ice and snow thickness measurement campaigns were conducted in Nella Fjord. The starting dates of each observation were May 5, June 16, July 26, August 29, October 9, November 14, and December 6. The average time interval between each observation was 36 days, and the measurement of all 38 points required 1–3 days to complete each time. During each observation, the sea ice thickness and snow depth were measured at the 38 observation locations. A total of 798 measurements were obtained from 7 measurement campaigns. The minimum and maximum recorded ice thicknesses were 21.5 and 178 cm, respectively. In addition, the sea ice and snow thicknesses were measured regularly between April 15 and December 27 at a location near point 32, where 38 measurements of ice and snow thicknesses were obtained and used to validate the change trend of sea ice thickness and for model verification.
The meteorological data used in this study were provided by the Zhongshan weather station, which is a part of the Antarctic Basic Synoptic Network (ABSN) and Antarctic Basic Climatological Network (ABCN) of the World Meteorological Organization (WMO) and the Global Climate Observing System (GCOS) Surface Network (GSN). Its elevation is 14.9 m above sea level. Meteorological observations began here in 1989. The observation instruments, methods, and instrument accuracy of surface meteorological observations all conform to the specifications of the China Meteorological Administration. Air temperature, humidity, wind direction, wind speed, and air pressure are recorded by automatic weather stations, whereas cloud cover, cloud shape, visibility, and weather phenomena are recorded by station personnel (Shen Hui, 2017). In the present study, we mainly used mean daily air temperature data from 2016 to 2020.
Data Analysis
A spatial analysis, statistical analysis, regression analysis and trend analysis were used to extract the spatial and temporal distribution characteristics of the sea ice growth rate in Nella Fjord in 2020, and the factors influencing sea ice growth were analyzed (Figure 2). The details are as follows.
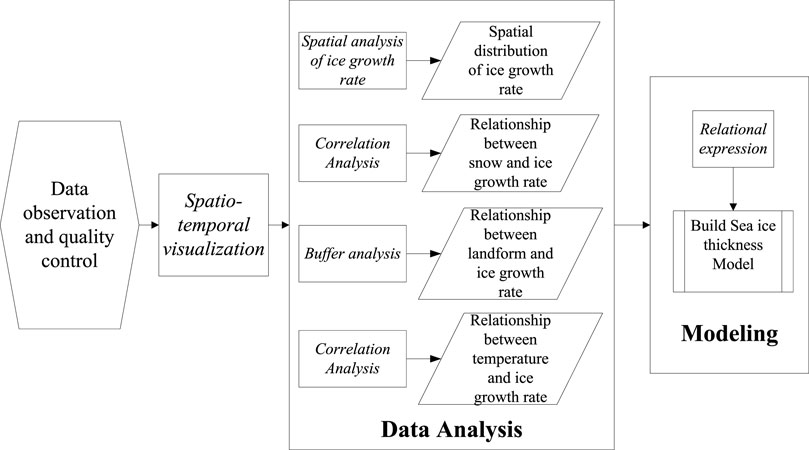
FIGURE 2. Technical route.
A spatial analysis and temporal trend analysis were used to characterize the spatial and temporal distributions of the sea ice thickness and growth rate in Nella Bay and to obtain the spatial and temporal distribution characteristics of the sea ice growth rate.
The relationship between the sea ice growth rate and snow thickness was analyzed using a trend analysis.
The spatiotemporal characteristics of sea ice accretion rates were further analyzed using buffer analysis methods, and the spatial variability of sea ice growth rates in different buffer zones was obtained.
A regression analysis of the relationship between the sea ice growth rate and air temperature was conducted using a trend analysis.
A model of the sea ice growth rate based on temperature variables is constructed, and the validity of the model was tested by comparing it with in situ observation data.
Results
Spatiotemporal Distribution of Sea Ice Thickness and Growth Rate
Figure 3 shows that the sea ice growth process in 2020 could be divided into 4 stages in terms of the sea ice growth rate. Freeze-up began in early March; the stage of rapid ice growth occurred between early March and mid-June. The stage of stable growth occurred between mid-June and mid-October. Mid-October to mid-November was the stage of deceleration of sea ice growth. After mid-November, the sea ice entered a negative growth stage. The first observation in this study started on May 5, and the average rate of sea ice thickness growth between May 5 and June 16 was the fastest of all observation periods, reaching 0.62 cm/d. The average sea ice thickness growth rate between June 16 and October 9 remained between 0.36 cm/d and 0.4 cm/d. From October 9 to November 14, the average growth rate of sea ice thickness slowed significantly to 0.15 cm/d. From mid-November to early December, the growth rate of sea ice thickness became negative, and the average growth rate in this stage was -0.08 cm/d.
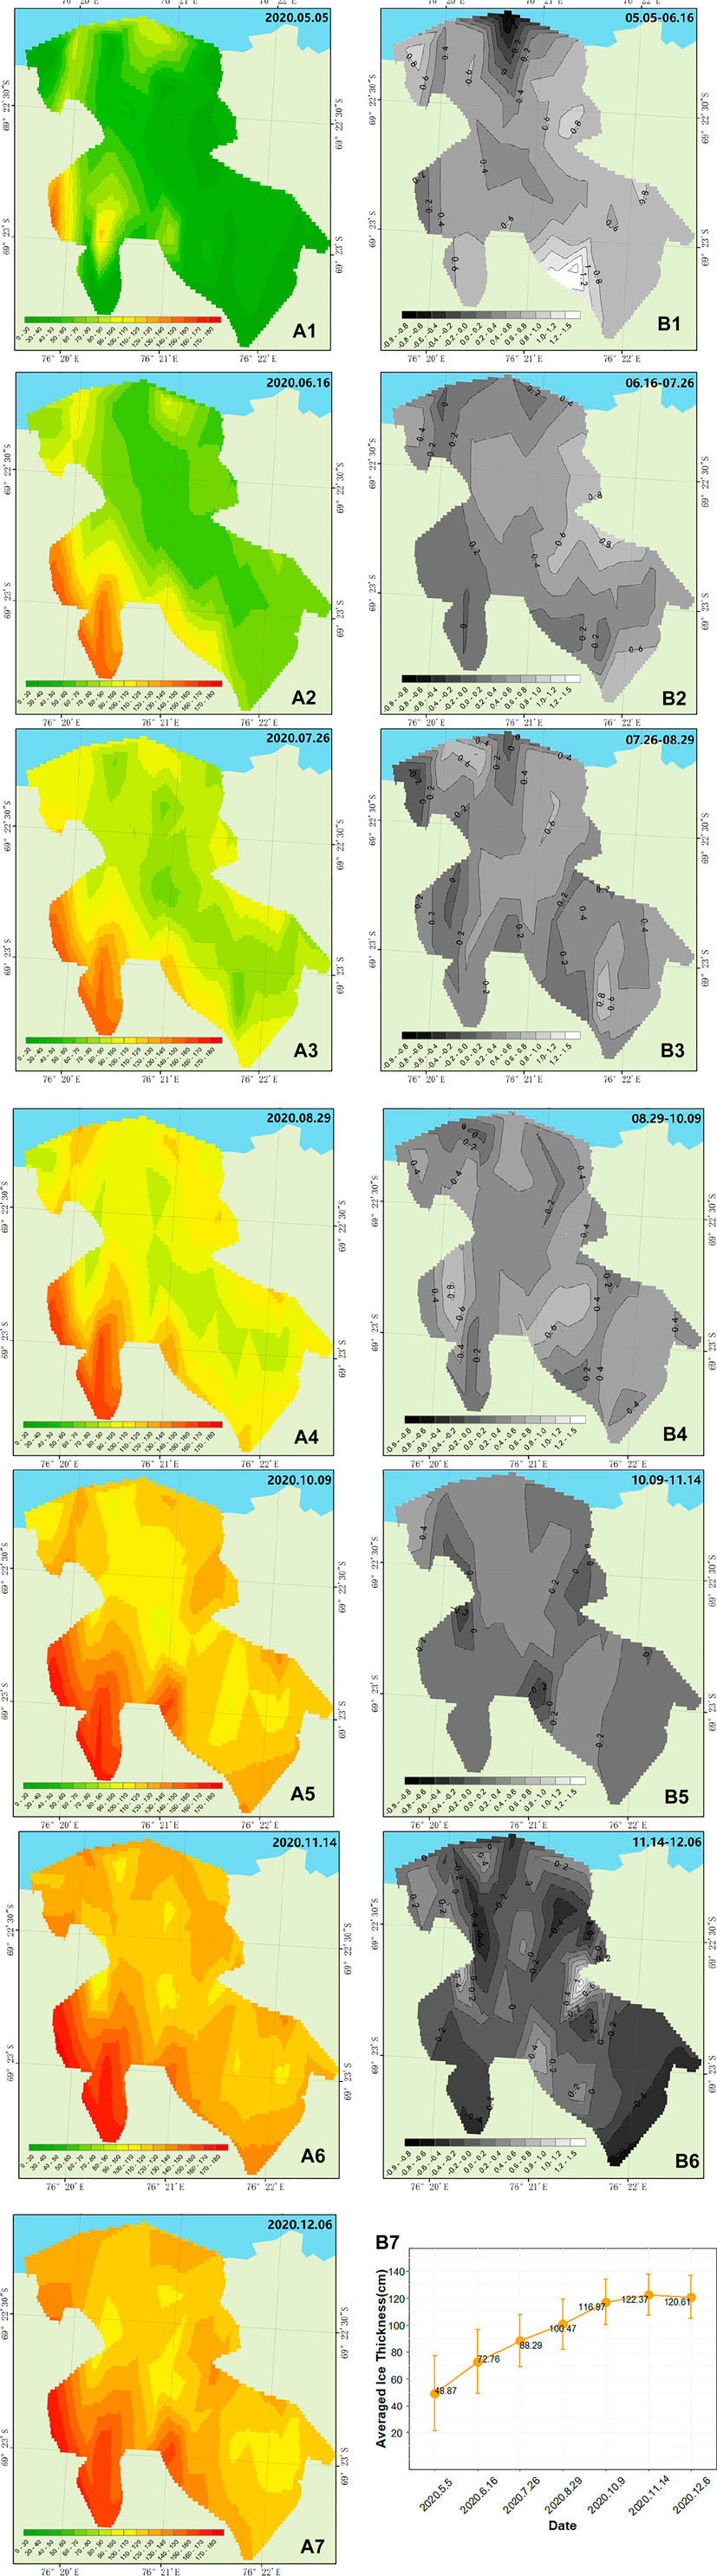
FIGURE 3. The spatiotemporal changes in ice thickness (cm). (Panels (A1-A7): Spatial distribution of sea ice thickness on May 5, June 16, July 26, August 29, October 9, November 14 and December 6; Panels (B1-B6): Spatial distribution of sea ice thickness growth rate from May 5 to June 16, from June 16 to July 26, from July 26 to August 29, from August 29 to October 9, from October 9 to November 14 and from November 14 to December 6; Panel (B7): Average sea ice thickness in the 7 periods).
The regularity of the spatial distribution of sea ice thickness at the beginning of the rapid growth period is not obvious because a certain amount of multiyear ice exists in Nella Fjord during summer when the sea ice has not completely melted. In the late stage of the rapid growth period and the early stage of the stable growth period, the growth rate of sea ice in the coastal area is significantly faster than that in the central area of the fjord. As shown in Figure 3, the fastest growth rate of sea ice in the coastal areas of the Xiehe Peninsula and Niutou Peninsula reached more than 0.8 cm/d during this period, while the growth rate of sea ice in the far-shore areas was only approximately 0.4 cm/d. Overall, the sea ice near shore was substantially thicker than the ice that was closer to the center of the fjord. In the middle and late stages of the stable growth period, the spatial regularity of the sea ice growth rate was not high, and it was relatively consistent overall. Entering the deceleration growth period, the growth rate of sea ice in Neila Bay slowed significantly. The growth rate of sea ice in most regions remained approximately 0.2 cm/d, and the growth rate in very few regions exceeded 0.4 cm/d. Negative growth rates were found near the shore of the Xiehe Peninsula, Niutou Peninsula, and Broknes Peninsula. In mid-November, the sea ice thickness reached its peak, and the maximum average sea ice thickness was 122.37 cm. After mid-November, ice thickness decreased in most areas, although low growth rates were maintained in a few areas. After mid-December, conducting field operations on the sea ice was no longer possible because of ice melting. Nonetheless, visual observations indicated that the melting rate of sea ice gradually accelerated.
Factors Influencing the Sea Ice Growth Rate
Snow Cover
The generation and elimination of sea ice is mainly influenced by thermal factors, and the snow on the surface of sea ice has a strong insulation effect on the heat exchange between the sea ice and the atmosphere. Therefore, snow has an indirect effect on the generation and elimination of sea ice. The trends in the mean growth rate of sea ice and mean snow thickness are shown in Figure 4. Before October 9, frequent and large fluctuations in the daytime temperature were observed; however, on the monthly scale, the mean air temperature remained relatively stable and was between −12 and −15°C. A negative correlation was found between the rate of sea ice growth and the snow thickness (Lei et al., 2010). From May to June, the snow thickness increased, and the growth rate of the sea ice thickness decreased. From June to August, the snow thickness decreased, and the growth rate of the sea ice thickness increased. From August to October, the snow thickness increased again, and the growth rate of sea ice decreased again. After early October, the average daily temperature increased significantly, and the growth rate of sea ice gradually decreased to negative growth. Snow has an obvious isolation effect on the heat exchange between sea ice and the atmosphere. Under the condition of relatively constant temperature, the greater the snow thickness is, the slower the rate of change in sea ice thickness (Lei et al., 2010). However, snow is not the main factor controlling the sea ice change rate; it can only slow the change rate of sea ice thickness. Temperature not only determines the change rate of sea ice thickness but also controls the generation and elimination of sea ice.
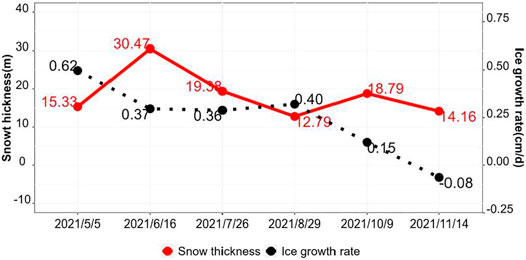
FIGURE 4. Relationship between snow thickness and sea ice growth rate. (Red solid line: snow thickness on May 5, June 16, July 26, August 29, October 9 and November 14; black dotted line: sea ice thickness growth rate from May 5 to June 16, from June 16 to July 26, from July 26 to August 29, from August 29 to October 9, from October 9 to November 14 and from November 14 to December 6)
Topography
Topography also has an indirect influence on the generation and elimination of sea ice. In near-shore areas, the fjord is relatively shallow, and the water temperature responds rapidly to changes in air temperature. In contrast, far from the shore where the fjord is deep, the water temperature responds slowly to changes in air temperature. A buffer zone analysis was conducted for the sea ice thickness and sea ice growth rate data. As shown in Figure 5, the buffer interval is set to 200 m to distinguish the shallow water zone near the shore (in blue in Figure 5) and the deep water zone far from the shore (in gray in Figure 5). Figure 5A shows the time series of the mean sea ice thickness during the seven excursions for the two zones. In early May, the ice thicknesses in the two zones were comparable. At all other times, the ice thickness in the shallow water zone was larger than that in the deep water zone by an average of 7.16 cm. Between mid-June and early October, the difference between the mean ice thicknesses of the two zones remained >9 cm; the maximum difference was 11.36 cm on July 26. After October, the sea ice growth decelerated, and the difference in sea ice thickness between the two regions gradually decreased. In early December, the average difference in sea ice thickness between the two regions was 6.6 cm.
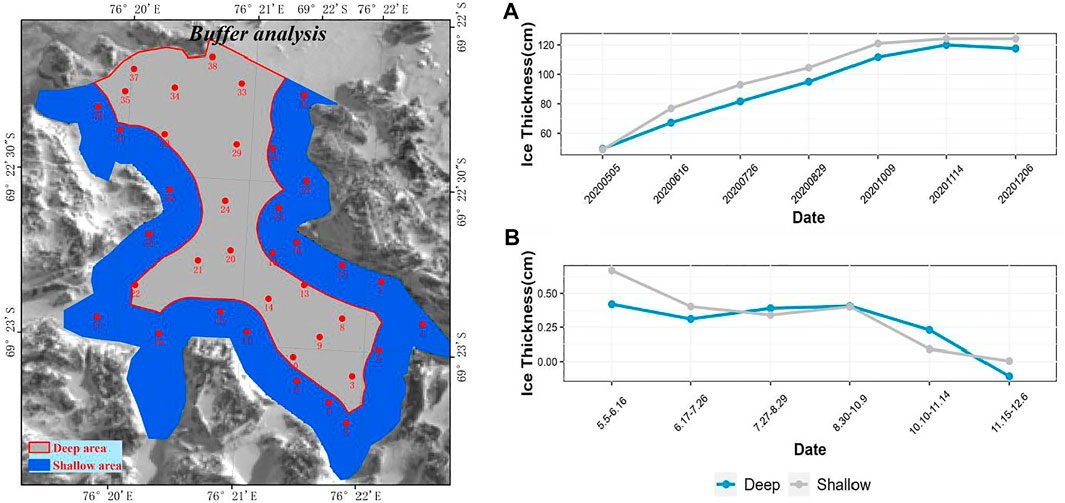
FIGURE 5. Buffer analysis. [(A): Sea ice thickness in deep water and shallow water areas in 7 periods; (B): Sea ice growth rate in deep water and shallow water areas in 7 periods].
Figure 5B shows the time series curves of the sea ice thickness change rate for the six observation periods. The highest growth rate was found between early May and mid-June; the mean growth rate in the shallow water zone (0.67 cm/d) was higher than that in the deep water zone (0.42 cm/d) by 0.25 cm/d. Between mid-June and early October, the mean growth rates in the two zones were comparable. After entering the deceleration period of sea ice growth, the mean growth rate decreased rapidly in both zones; the decrease in the shallow water zone was larger than that in the deep water zone. However, during the latter part of the deceleration period, the growth rate of sea ice thickness in the deep water zone showed an accelerated downward trend and entered a negative growth period before the coastal shallow water zone.
Air Temperature
Snow and bathymetry only weakly affect the exchange processes between the ocean and the atmosphere, and the most direct factor driving the growth rate of sea ice is temperature. When the temperature exceeds the critical condition for sea ice formation, its properties will inevitably change. Figure 6 shows the variation trend line for the sea ice growth rate and corresponding average temperature curve for 38 observed points during the study period. The black solid line represents the overall trend of the sea ice thickness growth rate. The blue dotted line is the trend of mean temperature during the study period. The mean air temperature was relatively stable between early May and October 10. Figure 6 shows that the mean air temperature varied between −12 and −13°C in most periods, except in August, when the lowest mean air temperature of −14.67°C was recorded. In October, the air temperature began to rise markedly; between October 10 and November 14, the mean air temperature was −7.64°C and increased to −1.75°C between November 15 and December 6.
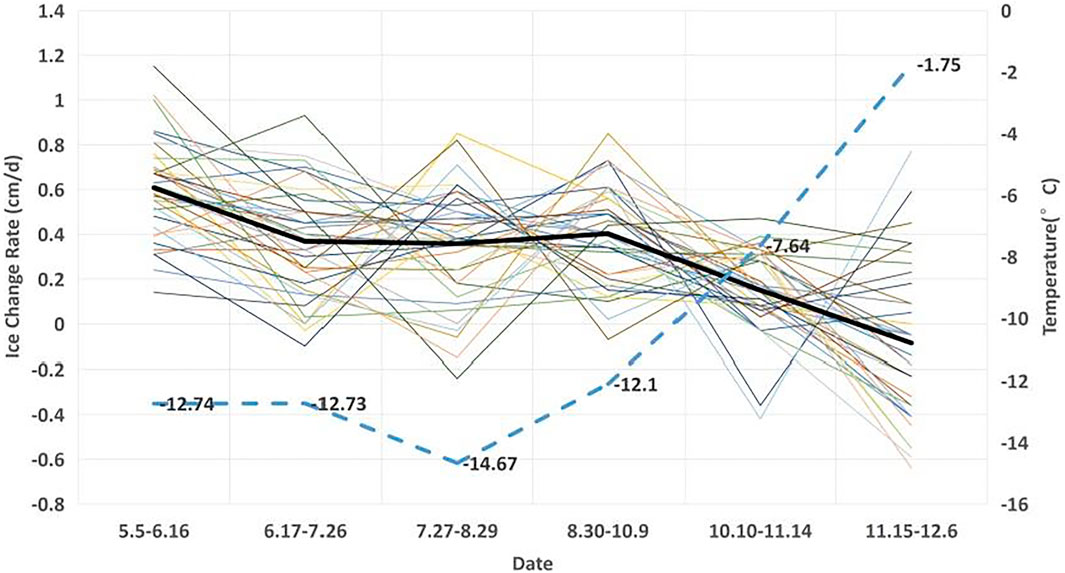
FIGURE 6. Relationship between air temperature and sea ice growth rate. (Black solid line: overall trend of sea ice thickness growth rate; blue dotted line: the trend of mean temperature over the study period; colored dotted line: variation trend line of sea ice growth rate at 38 observation points).
The sea ice growth rates clearly responded to changes in the mean air temperature. During freeze-up, the snow and ice thicknesses were negligible, and sea ice grew rapidly as a consequence of air–sea heat exchange. When the snow and ice covers reached certain thicknesses, the magnitude of the air–sea heat exchange decreased, and the sea ice growth rate decreased correspondingly. According to the observation data, when the ice thickness reached approximately 0.5 m, the sea ice growth rate became less sensitive to air temperature. When the mean temperature was maintained between −12°C and −15°C and the sea ice thickness exceeded 0.5 m, the growth rate of sea ice was maintained at 0.36–0.4 cm/d. Higher mean air temperatures were associated with a decreased ice growth rate. When the mean temperature increased to −1.75°C, the sea ice decreased in thickness. However, the trend lines indicate that growth rates became negative at air temperatures of approximately −4°C. Although the basic relationship between the sea ice growth rate and air temperature can be determined from data with relatively low temporal resolution (approximately monthly), the inflection point is difficult to accurately obtain.
Empirical Model
Regression analysis between the large amount of observed sample data and the temperature data was conducted, and it was found that the change in the sea ice growth rate and temperature basically conformed to a 2nd polynomial relationship. An empirical model of sea ice thickness based on temperature was constructed after several experiments and parameter adjustments:
where
The model was tested and verified to be able to accurately simulate the variation in sea ice thickness with temperature in the study area. Through comparison and verification using the observed sea ice thickness data from 2020 to 2016 (Figure 7), the predicted results exhibit good agreement with the real sea ice thickness change trend. However, due to human errors and other factors, the measured data are relatively discrete, while the model simulation data have a smoother trend. The average absolute deviation between the simulated and measured values in 2020 is only 1.426 cm, and the root mean square error (RMSE) is 2.11 cm. In 2016, the average absolute deviation between the two is 3.661 cm, the RMSE is 6.9 cm, and the overall simulation results are slightly higher than the measured results. Hao compared the in situ data from 2016 with the results from a sea ice growth model based on Stefan’s law and found a minimum mean error of 10 cm (Hao Guanghua and Zhao, 2019), which was larger than that obtained with our model Eqs 1, 2.
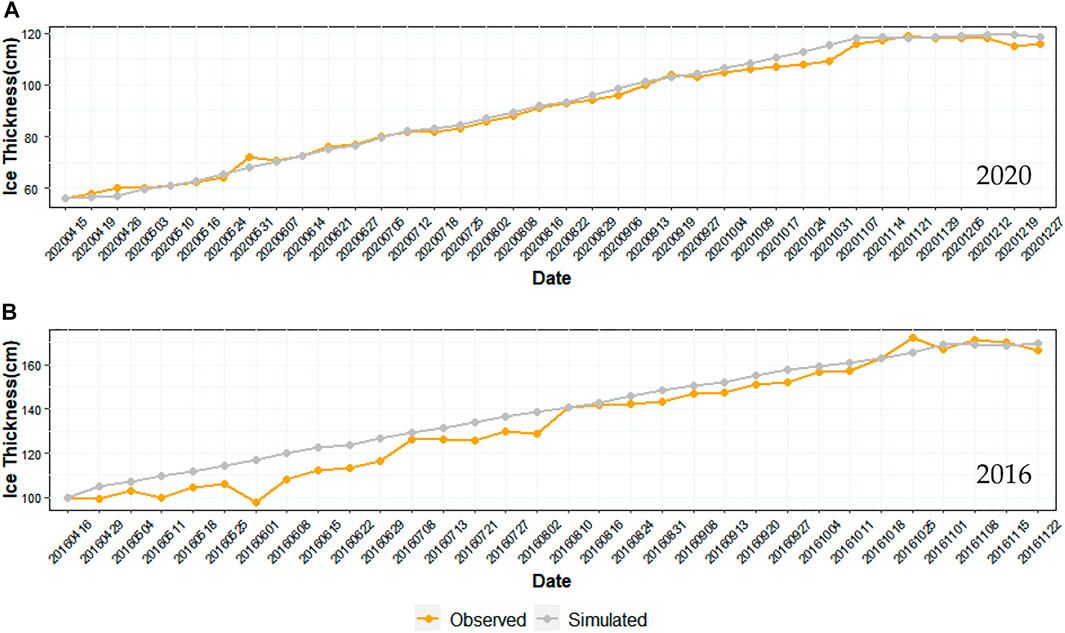
FIGURE 7. Comparison of ice thickness by field observation and model simulation. [(A): Field-observed sea ice thickness and model-simulated sea ice thickness in 2020; (B): Field-observed sea ice thickness and model-simulated sea ice thickness in 2016].
As the model takes the temperature as the only variable and does not consider other influencing factors, such as snow depth and bathymetry, the model has considerable room for improvement. In addition, the applicability of the model in other areas has not been verified, and this will be the key focus of future work.
Conclusion
The temporal characteristics of the sea ice growth rate were extracted from the observed data, according to which the sea ice growth process in 2020 was divided into four stages. The period from the beginning of March, when the sea ice started to freeze, to mid-June was the period of rapid sea ice growth, and the average growth rate of sea ice thickness during this process reached 0.62 cm/d. In the stage of stable growth (from mid-June to mid-October), the mean growth rate was between 0.36 and 0.4 cm/d. The deceleration stage of sea ice growth was from mid-October to mid-November, when the average rate of sea ice growth decreased to 0.15 cm/d. After mid-November, ice growth stopped and entered the negative growth stage.
An inverse relationship was found between the sea ice growth rate and the snow thickness. Snow cover can slow changes in sea ice. Bathymetry also had an indirect effect on the sea ice growth rate. Sea ice in the shallow water zone close to the shore was generally thicker than sea ice in the deep water zone closer to the center of the fjord. The mean ice thickness difference between the shallow water zone and the deep water zone was 7.16 cm. At the end of July, the mean ice thickness difference between the shallow water zone and the deep water zone was 11.36 cm, and it gradually diminished after October. During the rapid growth stage, the mean growth rate in the shallow water zone (0.67 cm/d) was considerably greater than that in the deep water zone (0.42 cm/d). Between mid-June and early October, the mean growth rates in the two zones were comparable. During the deceleration growth stage, the mean growth rates in both zones decreased rapidly.
Temperature was the most direct factor controlling the sea ice growth rate. The changes in mean air temperature were clearly reflected in the ice growth rates. During the early stage of freeze-up, the sea ice thickness increased rapidly because of the large exchanges of heat between the atmosphere and the ocean. When the snow and ice reached certain thicknesses, the magnitude of the air–sea heat exchange decreased, and the sea ice growth rate decreased correspondingly. When the ice thickness reached approximately 0.5 m, the sea ice growth rate became less sensitive to air temperature. When the mean temperature was between −12°C and −15°C and the sea ice thickness exceeded 0.5 m, the growth rate of sea ice was generally 0.36–0.4 cm/d. Higher mean air temperatures were associated with lower ice growth rates. The mean air temperature was −1.75°C during the period of sea ice thickness decrease. However, the trend lines indicate that the growth rate became zero at an air temperature of approximately −4°C.
A 2nd polynomial relationship between the sea ice growth rate and air temperature was established by regression analysis between observation data and air temperature data. After multiple experiments and adjustments of parameters, an empirical model of sea ice thickness based on the relationship between the sea ice growth rate and the air temperature was developed. We validated the model by comparing the model results with long time series of sea ice thickness data from Nella Fjord, which showed that the model results were in good agreement with the in situ data. The RMSE between the mean simulated thickness and the mean thickness measured in 2020 was 2.11 cm, and the RMSE between the mean simulated thickness and mean thickness measured in 2016 was 6.9 cm.
Data Availability Statement
The original contributions presented in the study are included in the article/supplementary material, further inquiries can be directed to the corresponding authors.
Author Contributions
Conceptualization, XS, TL; methodology, XS, YH; software, YG; validation, XS, CL; formal analysis, FZ, ZX; writing—original draft preparation, XS, TL and YH; writing—review and editing, ZX, YG; visualization, CL; funding acquisition, CL, ZX and YH; All authors have read and agreed to the published version of the manuscript.
Funding
This work was supported by the National Key R&D Program of China (No. 2018YFA0605902); the National Natural Science Foundation of China (No. 41976184, 41876212, 41922045, U19A2042 and U20A2083); and Operational and Scientific Research for Polar Regions (2021).
Conflict of Interest
The authors declare that the research was conducted in the absence of any commercial or financial relationships that could be construed as a potential conflict of interest.
Publisher’s Note
All claims expressed in this article are solely those of the authors and do not necessarily represent those of their affiliated organizations, or those of the publisher, the editors and the reviewers. Any product that may be evaluated in this article, or claim that may be made by its manufacturer, is not guaranteed or endorsed by the publisher.
References
Cavalieri, D. J., and Parkinson, C. L. (2008). Antarctic Sea Ice Variability and Trends, 1979–2006. J. Geophys. Res. Oceans 113 (C7). doi:10.1029/2007jc004564
Cavalieri, D. J., Parkinson, C. L., and Vinnikov, K. Y. (2003). 30-Year Satellite Record Reveals Contrasting Arctic and Antarctic Decadal Sea Ice Variability. Geophys. Res. Lett. 30 (18). doi:10.1029/2003gl018031
Comiso, J. C., and Hall, D. K. (2014). Climate Trends in the Arctic as Observed from Space. Wires Clim. Change 5, 389–409. doi:10.1002/wcc.277
Comiso, J. C. (2012). Large Decadal Decline of the Arctic Multiyear Ice Cover. J. Clim. 25 (4), 1176–1193. doi:10.1175/jcli-d-11-00113.1
Dirscherl, M., Dietz, A. J., Dech, S., and Kuenzer, C. (2020). Remote Sensing of Ice Motion in Antarctica - A Review. Remote Sensing Environ. 237, 111595. doi:10.1016/j.rse.2019.111595
Hao Guanghua, Y. Q., and Zhao, J. (2019). Observation and Analysis of Landfast Ice Arounding Zhongshan Station, Antarctic in 2016. Haiyang Xuebao 41 (9), 26–39.
Kurtz, N. T., and Markus, T. (2012). Satellite Observations of Antarctic Sea Ice Thickness and Volume. J. Geophys. Res. Oceans 117 (C8). doi:10.1029/2012jc008141
Lei, R., Li, Z., Dou, Y., and Cheng, Y. (2010). Observations of the Growth and Decay Processes of Fast Ice Around Zhongshan Station in Antarctica. Adv. Water Sci. 21 (No.9805), 708–712.,v.
Lei Ruibo, L. Z., and Qin, J. (2009). Investigation of New Technologies for In-Situ Ice Thickness Observation. Adv. WaterScience 20 (2), 287–292.
Massom, R. A., Eicken, H., Hass, C., Jeffries, M. O., Drinkwater, M. R., Sturm, M., et al. (2001). Snow on Antarctic Sea Ice. Rev. Geophys. 39 (3), 413–445. doi:10.1029/2000rg000085
Massom, R. A., and Stammerjohn, S. E. (2010). Antarctic Sea Ice Change and Variability - Physical and Ecological Implications. Polar Sci. 4 (2), 149–186. doi:10.1016/j.polar.2010.05.001
Scott, M. (2021). Understanding Climate: Antarctic Sea Ice Extent. Available at: https://www.climate.gov/news-features/understanding-climate/understanding-climate-antarctic-sea-ice-extent.
Scott, R. L. (2020). Climate Change: Arctic Sea Ice. Available at: https://www.climate.gov/news-features/understanding-climate/climate-change-minimum-arctic-sea-ice-extent.
Shen Hui, S. Q. Z. (2017). Characteristics of Weather and Sea Ice at the Antarctic Zhongshan Station in 2015. Mar. Forecasts 34 (6), 27–38.
Vaughan, D. G., Comiso, J. C., Allison, I., Carrasco, J., Kaser, G., Kwok, R., et al. (2013). “Observations: Cryosphere,” in Climate Change 2013 – the Physical Science Basis: Working Group I Contribution to the Fifth Assessment Report of the Intergovernmental Panel on Climate Change, C. Intergovernmental Panel on Climate (Cambridge: Cambridge University Press), 317–382.
Zhang, Q., Li, F., Lei, J., Zhang, S., Ding, Z., Chen, W., et al. (2020). Freeboard Height and Snow Depth Observed by Floating GPS on Land-Fast Sea Ice in Nella Fjord, Antarctica. Ann. Glaciol. 61 (82), 227–239. doi:10.1017/aog.2020.41
Zhao, J., Cheng, B., Yang, Q., Vihma, T., and Zhang, L. (2017). Observations and Modelling of First-Year Ice Growth and Simultaneous Second-Year Ice Ablation in the Prydz Bay, East Antarctica. Ann. Glaciol. 58 (75pt1), 59–67. doi:10.1017/aog.2017.33
Keywords: Antarctica, Nella Fjord, sea ice growth rate, spatiotemporal analysis, empirical model
Citation: Sun X, He Y, Lv T, Li C, Gao Y, Zhao F and Xue Z (2022) Spatiotemporal Analysis and Modeling of Sea Ice Growth Rate in Nella Fjord, Antarctica: Based on Observations During the 36th Chinese National Antarctic Research Expedition in 2020. Front. Environ. Sci. 10:875399. doi: 10.3389/fenvs.2022.875399
Received: 14 February 2022; Accepted: 17 March 2022;
Published: 17 May 2022.
Edited by:
Lejiang Yu, Polar Research Institute of China, ChinaCopyright © 2022 Sun, He, Lv, Li, Gao, Zhao and Xue. This is an open-access article distributed under the terms of the Creative Commons Attribution License (CC BY). The use, distribution or reproduction in other forums is permitted, provided the original author(s) and the copyright owner(s) are credited and that the original publication in this journal is cited, in accordance with accepted academic practice. No use, distribution or reproduction is permitted which does not comply with these terms.
*Correspondence: Yawen He, aGV5d0B1cGMuZWR1LmNu; Tingting Lv, bHZ0dEBhaXJjYXMuYWMuY24=