 Xin Ma1,2
 Tonghua Wu1,2*Xiaofan Zhu1Peiqing Lou1,2Dong Wang1,2Saruulzaya Adiya3Dashtseren Avirmed3Battogtokh Dorjgotov3
 Jie Chen1Chengpeng Shang1,2
 Amin Wen1,2Yune La1,2Xianhua Wei1,2
 Ren Li1
- 1Cryosphere Research Station on the Qinghai-Tibet Plateau, State Key Laboratory of Cryospheric Science, Northwest Institute of Eco-Environment and Resources, Chinese Academy of Sciences, Lanzhou, China
- 2University of Chinese Academy of Sciences, Beijing, China
- 3Institute of Geography and Geoecology, Mongolian Academy of Sciences, Ulaanbaatar, Mongolia
The Mongolian Plateau is located in the permafrost transitional zone between high-altitudinal and high-latitudinal permafrost regions in the Northern Hemisphere. Current knowledge of the thermal state and changes in the permafrost on the Mongolian Plateau is limited. This study adopted an improved calculation method of the Mongolian Plateau air freezing and thawing index using the monthly air temperature reanalysis dataset from the Climate Research Unit (CRU). The spatial and temporal variation characteristics from 1901 to 2019 were further assessed by the Mann–Kendall (M–K) test and spatial interpolation methods. The results indicate that the spatial distributions of the freezing and thawing index show clear latitudinal zonality. Over the study period, the air freezing index decreased by 4.1°C·d/yr, and the air thawing index increased by 2.3°C·d/yr. The change point in the air thawing index appeared in 1995 (p < 0.05) based on the M–K method, in contrast to the so-called hiatus in global warming. Our results reveal rapid warming on the Mongolian Plateau, especially in the permafrost region, and are useful for studying permafrost changes on the Mongolian Plateau.
Introduction
Currently, the global climate is warming rapidly, especially in high-latitude and high-altitude regions (Juřička et al., 2020). As an essential component of the cryosphere, permafrost is experiencing significant warming and thawing trends due to climate warming (Vaughan et al., 2014), which are mainly reflected in increasing ground temperature, a thicker active layer, earlier active layer melting time, and later freezing time (Cheng and Wu., 2007; Biskaborn et al., 2019; Cheng et al., 2019; Qi et al., 2021). Permafrost degradation triggers a series of ecological and environmental effects, such as the decomposition of soil organic carbon stored in permafrost and the release of carbon-based greenhouse gases, which can further increase the atmospheric CO2 concentration and accelerate climate warming through positive feedback processes (Knoblauch et al., 2018; Zhang et al., 2020; Adiya et al., 2021). Along with permafrost degradation, extreme drought events show gradually increasing trends, and such events can cause local pasture and forest fires (Ni et al., 2019; Holloway et al., 2020; Li et al., 2020). Permafrost warming causes the melting of ground ice, leading to ground subsidence and related disaster events, such as thermokarst settlement and thaw slumps. These disasters pose a great threat to the local ecological environment, infrastructure, and property safety (Sharkhuu, 2003; Dagvadorj et al., 2009; Yao et al., 2013; Hao et al., 2020; Sjoberg et al., 2020). In addition, permafrost degradation also causes significant impacts on local hydrological processes (Qin et al., 2014; Colombo et al., 2018), vegetation, and ecosystems (Qian, 2013; Guo et al., 2018; Peng et al., 2020a). Therefore, the analysis of long-term permafrost dynamics and the associated influential factors can improve the accuracy of risk assessment and early warning predictions of the effects caused by permafrost degradation.
The variation in air and ground temperatures affects the stability and distribution of permafrost and is therefore important for quantifying the permafrost variation over long time periods (Frauenfeld et al., 2007). Permafrost thermal conditions are usually monitored by borehole data or analyzed by experience and a semiempirical method. The input parameters are numerous and difficult to acquire (Gao et al., 2022). The environmental conditions in regions with the frozen ground are harsh. The distribution of existing boreholes is sparse, and thus, the input parameters for the models are always limited. In contrast, the frost number model requires fewer parameters and constructs more straightforward, and the freezing and thawing index have been widely used in permafrost environment studies (Lv et al., 2008; Wu et al., 2011; Harris et al., 2014; Ran et al., 2015). The freezing and thawing index can be divided into two categories. The first includes the surface freezing and thawing index, which reflect the accumulation of ground surface temperatures below or above 0°C during the freezing or thawing period, respectively. The other includes the air freezing and thawing index, which are specifically based on air temperature. However, the study of the continuous freezing and thawing index at the regional scale is constrained by short time series and the uneven spatial distribution of measured ground surface temperature data. These shortcomings are partly because permafrost is mainly distributed in remote cold regions with complex topography (Wu et al., 2011).
The freezing and thawing index are widely used to reflect climate change and to represent permafrost distribution (Chen et al., 2021; Hu et al., 2021). For example, in the Qinghai-Tibet Plateau and its surroundings, the freezing and thawing index show significant feedback with climate warming, the increase in ground surface temperature accelerates permafrost degradation and affects the ecology, hydrology, and environment of permafrost regions (Jiang et al., 2008; Cao et al., 2015; Jiang et al., 2015; Wu et al., 2018; Liu and Luo, 2019). Although the meteorological station data are of high quality, the sparse and uneven distribution of stations means that observational data are rare and short in length. The application of the variations in large-scale and long-term series is limited. In contrast, reanalysis data have notable advantages, such as long-term series and global scale records, in climate studies. For example, Qin et al. (2021) used five different reanalysis databases (ERA, MERRA2, GLDAS, CFS, and CMFD) to compare and analyze the changes in the freezing and thawing index on the Qinghai-Tibet Plateau from 1981 to 2017. The results showed that the MERRA2 reanalysis data have better applicability on the Qinghai-Tibet Plateau than the other reanalysis databases. As an effective indicator, the air freezing index can reflect the current permafrost status in the central and northeastern regions of the Qinghai-Tibet Plateau. Shi et al. (2019) calculated the spatial and temporal variations in the air freezing and thawing index in the circumpolar region from 1901 to 2019 based on Climate Research Unit (CRU) and National Centers for Environmental Prediction (NCEP) reanalysis data and estimated the change in the area of permafrost. That study showed that overall, the freezing index decreased significantly after 1988 and that the thawing index increased since 2015. In summary, from previous studies, to calculate the freezing and thawing index, the daily temperature is used in regions where meteorological stations are uniform and abundant, and the reanalysis of monthly temperature is an optional dataset for the areas without observation data.
The Mongolian Plateau is located in the transitional zone between high-altitudinal and high-latitudinal permafrost regions in the Northern Hemisphere (Zorigt et al., 2020). Most areas in this region lie on the southern boundary of the continuous permafrost zone and feature unstable thermal conditions. The permafrost in this region is sensitive to climate change (Sharkhuu et al., 2008; Heggem et al., 2006; Munkhjargal et al., 2020). Therefore, this area provides a good opportunity to investigate permafrost degradation influenced by air temperature change (Kynicky et al., 2009; Munkhjargal et al., 2020; Wu et al., 2011). Previous studies have mainly been conducted at a local scale (Wu et al., 2011; Munkhjargal et al., 2020; Dashtseren et al., 2021; Ran et al., 2021) or over a short time period. Temperature data from borehole monitoring are sparse, and the existing studies have mainly focused on the regions with field observations. Therefore, our current knowledge is insufficient to understand the spatial and temporal changes in the permafrost environment at the regional scale.
Compared with the field observational data, the CRU reanalysis data have the advantages of long-term series and comprehensive spatial coverage (Simmons et al., 2004; Zhao and Fu, 2006; Harris et al., 2014). The CRU reanalysis data are based on the integration of multiple meteorological datasets and produce a dataset with complete spatial coverage. This study selected the CRU monthly air temperature dataset with a 0.5 × 0.5 spatial resolution. We checked the quality with meteorological station data and calculated the air freezing and thawing index, and analyzed the variations between spatial and temporal on the Mongolian Plateau from 1901 to 2019.
Study Area and Data
Climate of the Mongolian Plateau
The Mongolian Plateau is located in the interior of Asia. It covers approximately 2.72 × 10⁶ km2, including Mongolia, southern Russia, the northern part of the Inner Mongolia Autonomous Region in China, and parts of the Xinjiang Uygur Autonomous Region (Li et al., 2020) (Figure 1). The elevation of the Mongolian Plateau gradually decreases from northwest to southeast, with an average elevation of 1,580 m above sea level (a.s.l.). The western and northwestern regions are mainly mountainous with elevations between 2000 and 4,000 m; the central and eastern regions are mainly plains and hills, with elevations of approximately 800–1,500 m; and the southern and southeastern regions are the Gobi Desert, with elevations of approximately 1,000 m (Chen et al., 2020).
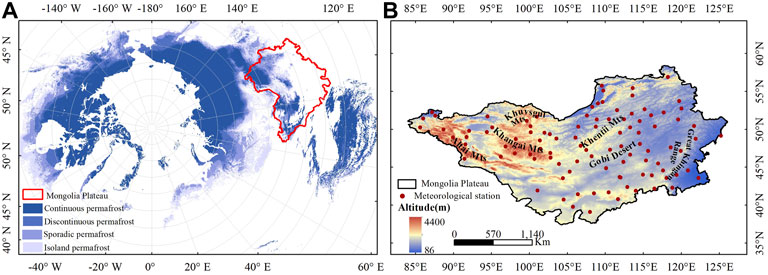
FIGURE 1. The location of the Mongolian Plateau in the permafrost region of the Northern Hemisphere (A) and the distribution of meteorological stations (B). The permafrost distribution data in the Northern Hemisphere (A) are derived from Obu et al. (2019) via the data source https://apgc.awi.de/dataset/pex.
The Mongolian Plateau is located in the center of the Asian high-pressure system, which is one of the origins of cold waves in the winter monsoon climate zone (Chen et al., 2020). The climate type is dominated by arid and semiarid climate characteristics with large intra-annual variability in temperature and precipitation (Zhou et al., 2012). Due to the influence of water vapor from the Arctic Ocean to the north and the Pacific Ocean to the east, precipitation on the Mongolian Plateau decreases spatially from southeast to northwest. The mean annual precipitation is approximately 267 mm, and the Selenge River basin in the north can reach an annual precipitation of 500 mm. The southwestern region has an annual precipitation of only approximately 100 mm (Wang et al., 2008). In addition, evapotranspiration in Mongolia showed a gradual increasing trend from 2001 to 2015. The maximum evapotranspiration values were found in the continuous and discontinuous permafrost regions (Yu, 2017).
The permafrost distribution data in the Northern Hemisphere (Figure 1A) are derived from Obu et al. (2019) via the data source https://apgc.awi.de/dataset/pex.
Reanalysis and Observation Data
The monthly reanalysis data of air temperature were used to analyze the spatiotemporal variations in the freezing and thawing index on the Mongolian Plateau. These data were obtained from the CRU time-series Version 4.05 (CRU TS v4.05) datasets (https://crudata.uea.ac.uk/cru/data/hrg/), and the time series is from 1901 to 2019 with a spatial resolution of 0.5 × 0.5. The CRU dataset combines centennial-scale climate change grid data covering the global scale. The dataset is integrated from several well-known datasets through interpolation and other methods, which are widely used as credible proxy data after comparison (Wen et al., 2006; Chen et al., 2021). In addition, the CRU dataset is continuous in space and time and can reflect long-term trends (Shi et al., 2019). The observational records in most of the meteorological sites are from the post-1980s period, thus limiting the study of early climate and freezing and thawing index changes. The long time series provided by these data can effectively support the research in this study.
The applicability of the CRU data on the Mongolian Plateau was examined and evaluated using observations from 106 meteorological stations in the study area obtained from the National Oceanic and Atmospheric Administration (NOAA https://www.climate.gov/maps-data). Since the time series recorded at the selected meteorological stations were not consistent, we selected temperature data from January 1975 to December 2019 for the quality check of the CRU data.
Methods
Quality Check of the CRU Reanalysis Dataset
For the accuracy assessment of the CRU reanalysis dataset, four indicators, namely, the mean deviation error (MBE), correlation coefficient (R), normalized standard error (NSSE), and root mean square error (RMSE) are used in this study and are calculated as follows (Qin et al., 2021):
Where M is the total number of samples and
Calculation of the Freezing and Thawing Index
The air freezing (thawing) index is the cumulative sum of the air temperatures corresponding to the number of days when the mean air temperature is equal to or below (above) 0°C during the freezing (thawing) period (Eqn. 5). The freezing period is usually defined as July 1 of each year to June 30 of the following year, while the thawing period is defined as January 1 to December 31 of each year (Wu et al., 2011; Luo et al., 2014; Shi et al., 2019).
Where
However, the acquisition of daily air temperatures on the Mongolian Plateau during 1901–2019 is limited by many factors, and thus the CRU TS V4.05 monthly dataset was used to determine the freezing and thawing index in this study, so the equation can be further written as Eqn. 7 (Shi et al., 2019).
Where
M–K Test Method
The M–K method (Mann, 1945; Kendall, 1948) is a nonparametric statistical test that has been widely used in trend analysis of time series (You et al., 2010; Wu et al., 2011). In addition, the algorithm can obtain the year in which the trend changes when the value of intersection points is within the confidence intervals (Shi et al., 2019). In the M–K trend analysis, the statistic S of the test is calculated based on the relationship between the time series
When sample number
In the bilateral trend test, the trend of the time series data can be judged by the statistic
In the M–K mutation test, the statistic is defined under the assumption that the time series are independent as follows:
Where
If the two curves
Results
Reliability Assessment of CRU Air Temperature
Figure 2 shows the annual and monthly fitting results of the meteorological station data and CRU reanalysis data from 1901 to 2019. According to the relevant impacts of different months (Figure 2B), the CRU reanalysis data, compared with meteorological observation data, underestimate the actual air temperature on the Mongolian Plateau, especially in winter (December–February) and spring (March–May). In contrast, the results for both summer and autumn are similar, except for a slight underestimation in July and September. The annual fitting result from 1901 to 2019 (Figure 2A) shows a significant positive correlation, with a Pearson’s correlation coefficient of 0.96 and an explained variance of 0.92, indicating that the CRU dataset is credible for studying air temperature correlation on the Mongolian Plateau.
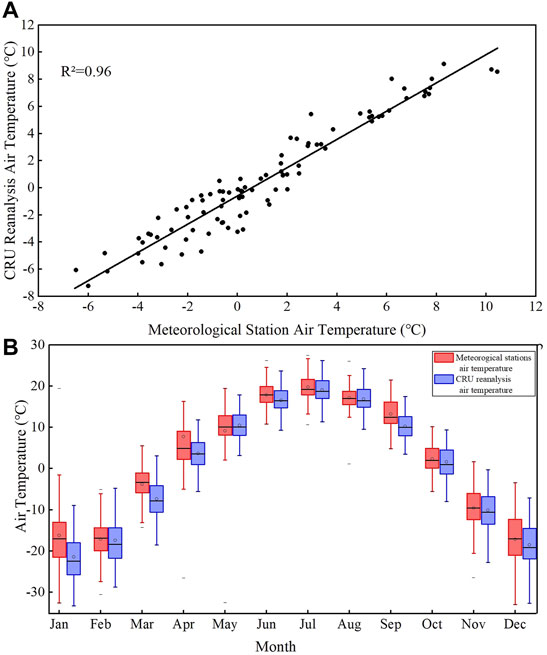
FIGURE 2. Air temperature correlation analysis of the CRU reanalysis data and meteorological observations from 1901 to 2019 (A) and their monthly comparison (B).
The indicators for evaluating the applicability of monthly CRU reanalysis data on the Mongolian Plateau were spatially visualized via ArcMap spatial analysis (Figure 3). The monthly CRU data underestimated the air temperature for 70% of stations, with the mean MBE value being −0.77 and the variation ranging between −7.38 and 2.47. The variation in MBE on the Mongolian Plateau was mostly concentrated between −1 and 0°C. The spatial distribution of the correlation between the CRU data and the meteorological observations at site locations is greater than 0.95 for most sites, with a range of 0.90–0.99. The mean value of NSSE is 0.68, and the value is less than 0.6 for approximately 68% of the sites. The range of RMSE was 0.13–6.78°C, with a mean value of 0.80°C, and approximately 82% of the sites had RMSE values less than 2°C. Based on the statistical results and spatial variations in the four evaluation indices, the R values are high, and the MBE, RMSE, and NSSE values are low. In terms of spatial distribution, most stations show a positive relationship, but a few stations are in the western and northern border areas. Therefore, the CRU reanalysis dataset has good applicability to the Mongolian Plateau region and can be used as a proxy for a long time series for the Mongolian Plateau region.
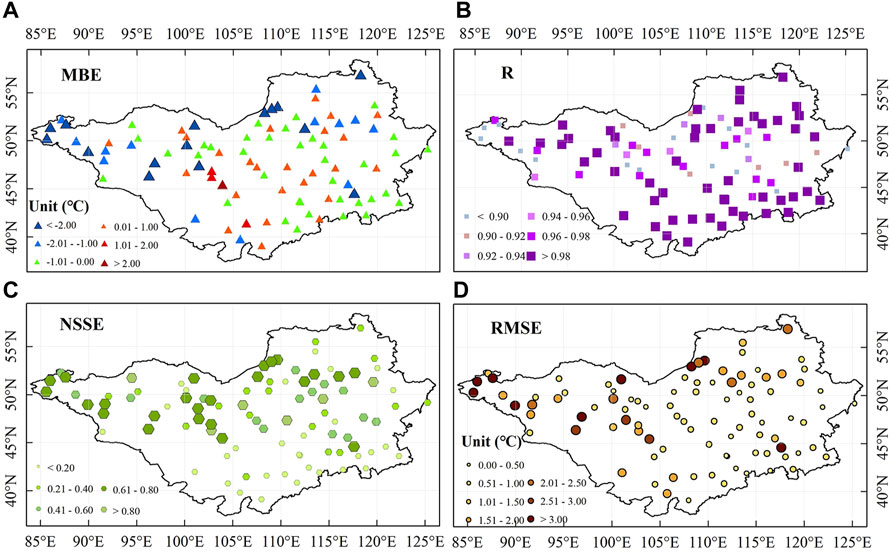
FIGURE 3. Spatial distribution of four error indicators, including MBE (A), R (B), NSSE (C), and RMSE (D).
Spatiotemporal Variations in the Freezing Index
Based on the multivariate statistical relationship (Eqn. 8) between the grid data of the mean freezing index calculated from 1901 to 2019 and the longitude, latitude, and elevation of the corresponding points, it can be seen that the spatial distribution of the freezing index on the Mongolian Plateau is influenced by latitude and altitude. As shown in Figure 4, the spatial distribution of the freezing index on the Mongolian Plateau exhibits a significant latitudinal gradient. It increases with latitude, with an average value ranging from 1,200 to 3,600°C·d. On the Mongolian Plateau, the highest freezing index value occurs in northern regions, with a value of nearly 5,600°C·d, whereas in the southern Gobi Altai and surrounding regions, the values are less than 600°C·d. The spatial distribution of the freezing index also shows altitude differences, and the index decreases faster in high-elevation regions, such as the northeast and northwest on the Mongolian Plateau, than in low-elevation regions.
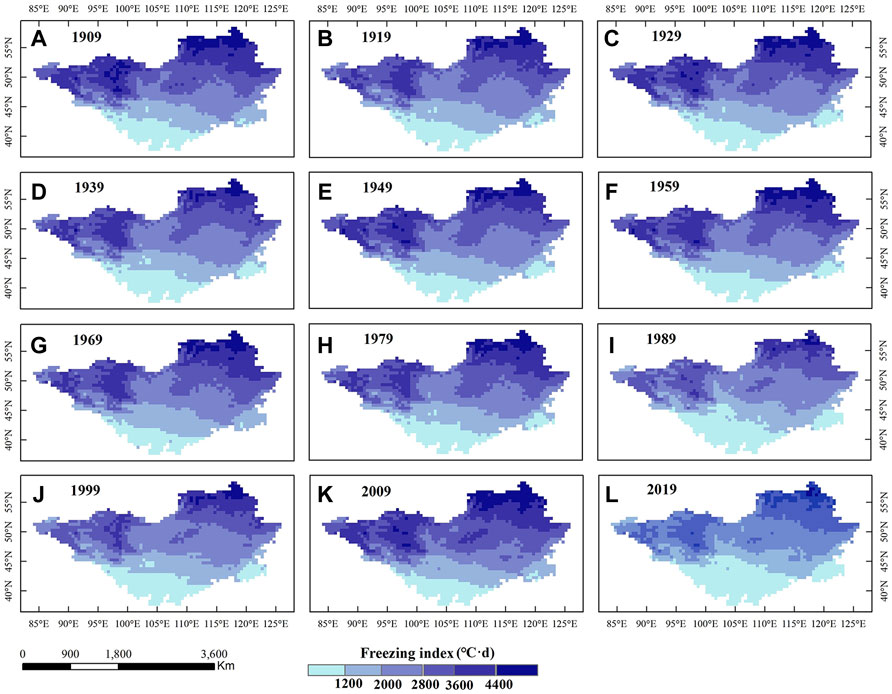
FIGURE 4. Decadal spatial changes in the air freezing index on the Mongolian Plateau from 1901 to 2019. Labels like (A–L) represent the spatial variation of the air freezing index for each decade from 1901 to 2019.
The overall freezing index of the Mongolian Plateau from 1901 to 2019 shows a downward trend of 4.10°C·d/yr. According to long-term changes (Figure 5A), the freezing index shows a decreasing trend and changes at different rates. Various characteristics of the freezing index are shown in Figure 5C. A decreasing trend appeared in 1902–1903, and a brief increasing trend appears in 1905–1924 and 1929–1930. A decreasing trend with a slow rate of 0.08°C·d/yr was observed from 1930 to 2019.
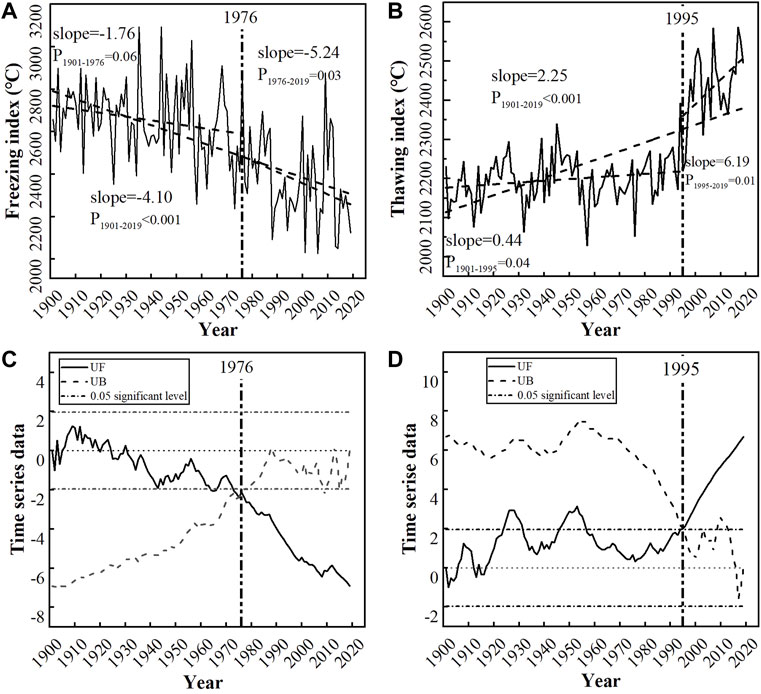
FIGURE 5. Interannual variation in the freezing (A) and thawing (B) index and the change point of the freezing (C) and thawing (D) index from 1901 to 2019 on the Mongolian Plateau.
Spatiotemporal Variations in the Thawing Index
According to the spatial interpolation map of the thawing index (Figure 6) and multivariate relationship (Eqn. 9), we found that latitude is the main factor and that the thawing index increases gradually with decreasing latitude on the Mongolian Plateau. The thawing index in the northern region varies from 450 to 2,658°C·d, with a mean value of 1,596°C·d, while in the southern region, it varies from 2,000 to 4,000°C·d, with a mean value of 3,216°C·d. High values occur in the Gobi Altai region and the northern part of the Inner Mongolia Autonomous Region of China. During the study period, the region with high values exceeding 3,500°C·d gradually expanded to the south and east. The lowest values appeared in the northern part of the Khuvsgul Mountains, Khangai Mountains, and Khentii Mountains in Mongolia, the Greater Khingan Range in China, and the southern part of Russia. The thawing index varies greatly in the western part. In the northern part of the Inner Mongolia Autonomous Region, the high value region gradually expanded to the east over time. The lowest value gradually increased with time, and the thawing index showed an increasing trend, with significant increases in the Khangai and Khentii Mountain regions located in central Mongolia.
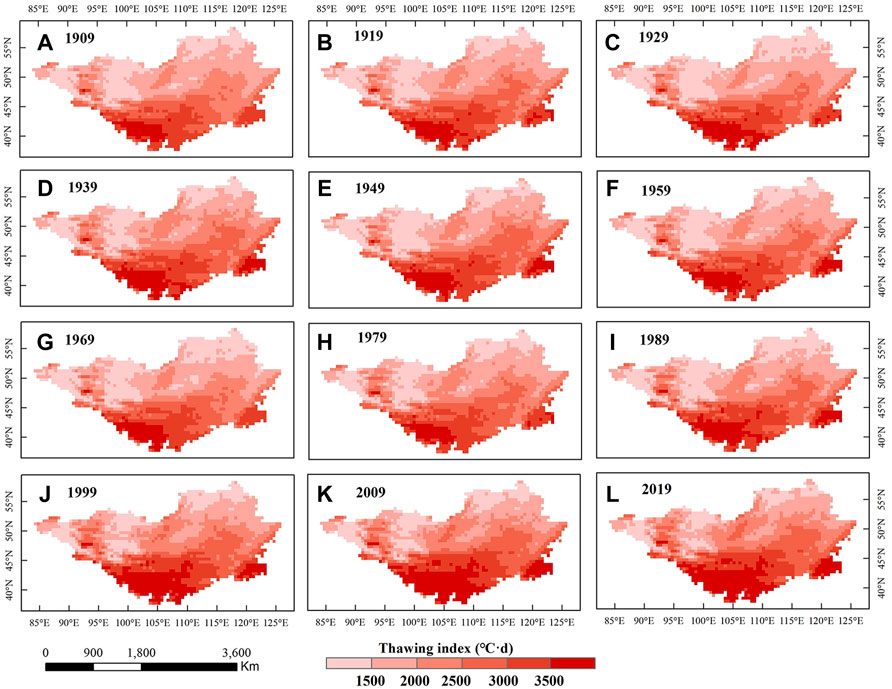
FIGURE 6. Decadal spatial changes in the air thawing index on the Mongolian Plateau from 1901 to 2019. Labels like (A–L) represent the spatial variation of the air thawing index for each decade from 1901 to 2019.
The change in the thawing index on the Mongolian Plateau from 1901 to 2019 is opposite that of the freezing index, with an overall upward trend and a positive slope of 2.25°C·d/yr. According to the M–K mutation test (Figure 5D), the thawing index began to increase abruptly after 1995 (based on the 0.05 and 0.10 significance levels) (Figure 5B). The increasing trend from 1901 to 1995 had a flat slope of 0.44°C·d/yr, whereas the increasing trend from 1995 to 2019 had a significantly steeper slope of 6.19°C·d/yr.
Discussion
Freezing and Thawing Index Variation
The permafrost on the Mongolian Plateau is mainly distributed in the northern regions, especially in the northern alpine regions (Figure 1A). Sen’s slope can reflect the interannual variation in the freezing and thawing index. The slope change in the air freezing index (Figure 7) shows that the largest freezing index occurs in the northern alpine regions, and the permafrost temperature increases rapidly in the Khuvsgul and Khangai Mountain regions (Kynicky et al., 2009; Zhao et al., 2010; Ishikawa et al., 2018; Munkhjargal et al., 2020; Dashtseren et al., 2021).
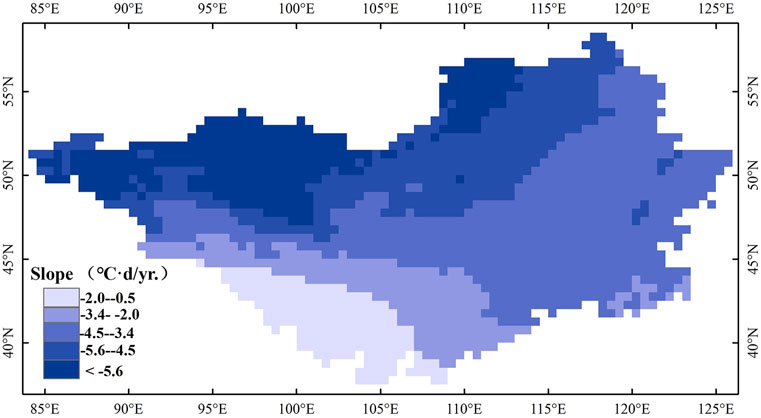
FIGURE 7. Sen’s slope of the freezing index over the Mongolian Plateau from 1901 to 2019.
The climate determines the air thawing index, and most regions on the Mongolian Plateau exhibit trends consistent with global warming (Munkhjargal et al., 2020; Peng et al., 2020b). Although the change rates of regions listed in Table 1 are based on different time periods and data sources, the thawing index values of the regions show increasing trends (Wu et al., 2011; Luo et al., 2014; Wang et al., 2019; Liao et al., 2021). The influence of latitude on the thawing index in this region is smaller than that in the Arctic Circle, which has simple topographic conditions and is more sensitive to climate warming (Johannessen et al., 2016) than the Mongolian Plateau (Shi et al., 2019). The influence of latitude of the thawing index on the Mongolian Plateau is greater than that on the Qinghai-Tibetan Plateau, which has high elevations and complex topographic conditions (Shi et al., 2019).
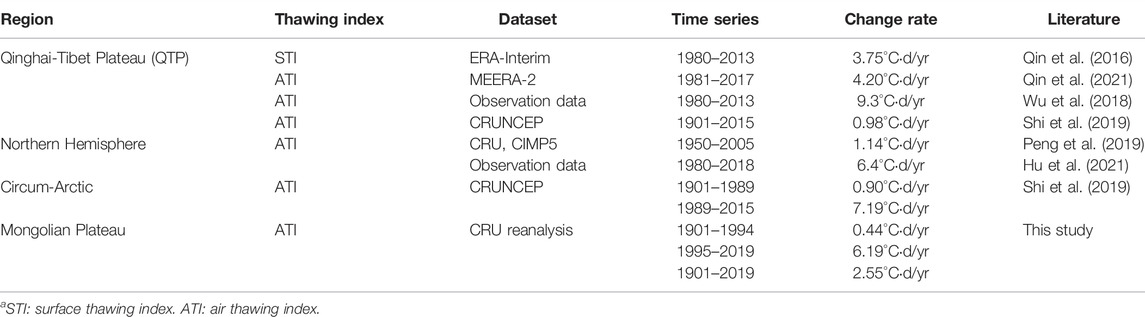
TABLE 1. Result comparison of thawing index variation in different regions.
The spatial variation in the thawing index of the Mongolian Plateau is also affected by both latitude and altitude (Dashtseren et al., 2021), and the change in the thawing index in the low-latitude region is greater than that in the high-latitude region (Figure 8). The factors that may cause variations in the freezing and thawing index are elevation and solar radiation. Air temperature and solar radiation both gradually decrease with increasing elevation. In addition, the content of water vapor in the atmosphere may also be an influencing factor. For example, in the low-latitude regions with low water vapor content and weak solar radiation, the freezing index changes only slightly. The air freezing and thawing index changes reflect climate warming, which may accelerate permafrost degradation (Dashtseren et al., 2021).
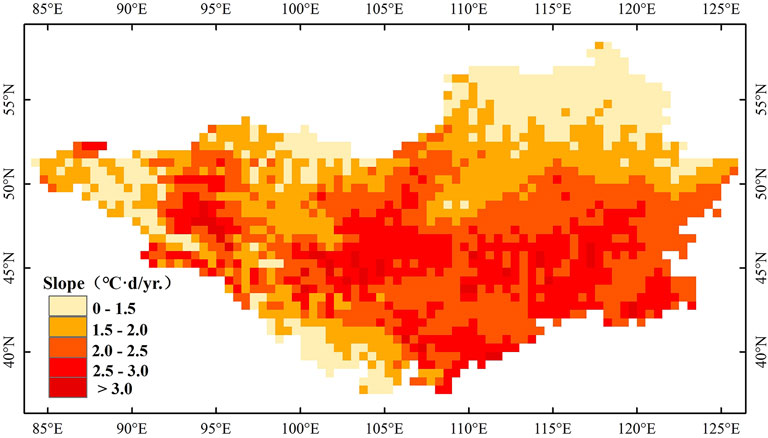
FIGURE 8. Sen’s slope of the thawing index on the Mongolian Plateau from 1901 to 2019.
Uncertainty Analysis
Climate change studies usually require long time series of meteorological data, but the low number and scattered nature of the meteorological stations and boreholes on the Mongolian Plateau make research difficult. Thus, we selected the CRU reanalysis dataset as the data source for analyzing the air freezing and thawing index. However, we found that compared to the observed data, the CRU reanalysis data underestimate the air temperature. This may be caused by the fact that, first, the elevation of a grid cell in the CRU reanalysis is higher than that of the meteorological station. This may result in a difference because of the lapse rate of air temperature (Wang et al., 2018; Shi et al., 2019). Generally, the air temperature decreases with elevation at a rate of 0.65°C/100 m, but there will be differences among regions (Frauenfled et al., 2007; Wang et al., 2018). Second, the CRU reanalysis data are produced by integrating data from meteorological stations worldwide. The original uncertainty is present in the new reanalysis dataset (Harris et al., 2014). Third, the CRU reanalysis dataset still has shortcomings at a spatial resolution of 0.5 × 0.5, as each grid corresponds to actual spatial coverage of approximately 3,000 km2 (Frauenfled et al., 2007; Chen et al., 2021), and the spatial representativeness is low. We checked the CRU quality based on a single station, and the deviations were inevitable.
There are also uncertainties in calculating the air freezing and thawing index (Frauenfeld et al., 2007; Chen et al., 2021). Since the CRU reanalysis data based on calculations in this paper provide monthly mean temperature data, the modification of the calculation formula will further increase the uncertainty of the freezing and thawing index results. Moreover, we use temperature data from January 1975 to December 2019 to perform a quality check of the CRU data using a dependence test due to a lack of comparable data, and thus the CRU reanalysis has uncertainty. The underestimation by the reanalysis data undoubtedly affects the air freezing and thawing index results. The air freezing and thawing index are very important for assessing the permafrost status on the Mongolian Plateau (Wu et al., 2011; Dashtseren et al., 2021; Gao et al., 2022). Therefore, improving data accuracy and reducing the uncertainty of the analysis results are of great importance for studying climate change and the permafrost environment (Frauenfled et al., 2007; Harris et al., 2014; Ran et al., 2015).
Conclusion
Based on CRU reanalysis data, we analyze the spatiotemporal variation in the air freezing and thawing index on the Mongolian Plateau from 1901 to 2019. We assess the reliability of CRU air temperatures with data from 106 meteorological stations on the Mongolian Plateau. The correlation coefficient is 0.96, and the RMSE is approximately 0.80°C. The variation magnitudes of the freezing and thawing index on the Mongolian Plateau from 1901 to 2019 show a reversal in tendencies, and the long-term trends vary from −1.76 to −5.24°C·d/yr and from 0.44 to 6.19°C·d/yr, respectively. Notably, the thawing index experienced rapid increases after 1995. The spatial distributions of the freezing and thawing index are mainly affected by latitude and altitude. With increasing latitude, the freezing index increases from 600°C·d to 5,600°C·d, and the thawing index decreases from 4,500°C·d to 1,000°C·d. The northern alpine regions where permafrost exists show greater changes than the southern desert regions. Future studies are required to improve the spatial and temporal resolution of the air temperature data and their effects on the permafrost environment.
Data Availability Statement
The original contributions presented in the study are included in the article/Supplementary Material, further inquiries can be directed to the corresponding author.
Author Contributions
XM: Conceptualization, Methodology, Software, Investigation, Writing—original draft. TW: Conceptualization, Validation, Formal analysis, Visualization, Writing—review and editing. XZ, PL, DW, SA, DA, BD, JC, CS, AW, YL, XW, and RL: Writing—review and editing.
Funding
This research was funded by the National Natural Science Foundation of China (41961144021 and 3201101546), the National Key Research and Development Program of China (2020YFA0608501), and the West Light Foundation of Chinese Academy of Sciences.
Conflict of Interest
The authors declare that the research was conducted in the absence of any commercial or financial relationships that could be construed as a potential conflict of interest.
Publisher’s Note
All claims expressed in this article are solely those of the authors and do not necessarily represent those of their affiliated organizations, or those of the publisher, the editors and the reviewers. Any product that may be evaluated in this article, or claim that may be made by its manufacturer, is not guaranteed or endorsed by the publisher.
Acknowledgments
We would like to thank the Climatic Research Unit at the University of East Anglia, which provided the CRU dataset.
References
Adiya, S., Dalantai, S., Wu, T., Wu, X., Yamkhin, J., Bao, Y., et al. (2021). Spatial and Temporal Change Patterns of Near-Surface CO2 and CH4 Concentrations in Different Permafrost Regions on the Mongolian Plateau from 2010 to 2017. Sci. Total Environ. 800, 149433. doi:10.1016/j.scitotenv.2021.149433
Biskaborn, B. K., Smith, S. L., Noetzli, J., Matthes, H., Vieira, G., Streletskiy, D. A., et al. (2019). Permafrost Is Warming at a Global Scale. Nat. Commun. 10 (1), 264–311. doi:10.1038/s41467-018-08240-4
Cao, B., Zhang, T., Peng, X., Zheng, L., Mu, C., and Wang, Q. (2015). Spatial Variability of Freezing-Thawing Index over the Heihe River Basin. Adv. Earth Sci. 30 (3), 357–366. doi:10.11867/j.issn.1001-8166.2015.03.0357
Chen, F., Luo, D., Liu, L., Jin, H., and Li, C. (2021). Variations of Air Freezing/thawing Index during 1901—2018 in the Three-River Source Region. J. Glaciol. Geocryol. 43 (2), 417–426. doi:10.7522/j.issn.1000-0240.2021.0015
Chen, J., Huang, W., Zhang, Q., and Feng, S. (2020). Origin of the Spatial Consistency of Summer Precipitation Variability between the Mongolian Plateau and the Mid-latitude East Asian Summer Monsoon Region. Sci. China Earth Sci. 63, 1199–1208. doi:10.1007/s11430-019-9593-2
Chen, R. H., Tabatabaeenejad, A., and Moghaddam, M. (2019). Retrieval of Permafrost Active Layer Properties Using Time-Series P-Band Radar Observations. IEEE Trans. Geosci. Remote Sens. 57 (8), 6037–6054. doi:10.1109/tgrs.2019.2903935
Cheng, G., and Wu, T. (2007). Responses of Permafrost to Climate Change and Their Environmental Significance, Qinghai-Tibet Plateau. J. Geophys. Res. 112, F02S03. doi:10.1029/2006JF000631
Cheng, G., Zhao, L., Li, R., Wu, X., Sheng, Y., Hu, G., et al. (2019). Characteristic, Changes and Impacts of Permafrost on Qinghai-Tibet Plateau. Chin. Sci. Bull. 64, 2783–2795. doi:10.1360/TB-2019-0191
Colombo, N., Salerno, F., Gruber, S., Freppaz, M., Williams, M., Fratianni, S., et al. (2018). Review: Impacts of Permafrost Degradation on Inorganic Chemistry of Surface Fresh Water. Glob. Planet. change 162, 69–83. doi:10.1016/j.gloplacha.2017.11.017
Dagvadorj, D., Natsagdorj, L., Dorjpurev, J., and Namkhainyam, B. (2009). Assessment Report on Climate Change, Mongolia. Mongolia, Ulaanbaatar, Mongolia: Published by Ministry of Environment, Nature and Tourism.
Dashtseren, A., Temuujin, K., Westermann, S., Batbold, A., Amarbayasgalan, Y., and Battogtokh, D. (2021). Spatial and Temporal Variations of Freezing and Thawing Indices from 1960 to 2020 in Mongolia. Front. Earth Sci. 9, 713498. doi:10.3389/feart.2021.713498
Frauenfeld, O. W., Zhang, T., and Mccreight, J. L. (2007). Northern Hemisphere Freezing/thawing Index Variations over the Twentieth Century. Int. J. Climatol. 27 (1), 47–63. doi:10.1002/joc.1372
Gao, H., Sa, C., Meng, F., Luo, M., Wang, M., Zhang, H., et al. (2022). Temporal and Spatial Characteristics of Permafrost on Mongolian Plateau from 2003 to 2019. J. Arid Land Resour. Environ. 26 (03), 99–106. doi:10.13448/j.cnki.jalre.2022.070
Guo, W., Liu, H., Anenkhonov, O. A., Shangguan, H., Sandanov, D. V., Korolyuk, A. Y., et al. (2018). Vegetation Can Strongly Regulate Permafrost Degradation at its Southern Edge through Changing Surface Freeze-Thaw Processes. Agric. For. Meteorology 252, 10–17. doi:10.1016/j.agrformet.2018.01.010
Hao, J., Wu, T., Li, R., Wu, X., Xie, C., Zhu, X., et al. (2020). A Case Study on Earthflow in Yushu, Qinghai Province on the Northeastern Tibetan Plateau: Landslide Features and Cause Analysis. J. Glaciol. Geocryol. 42 (2), 447–456. doi:10.7522/j.issn.1000-0240.2020.0022
Harris, I., Jones, P. D., Osborn, T. J., and Lister, D. H. (2014). Updated High-Resolution Grids of Monthly Climatic Observations - the CRU TS3.10 Dataset. Int. J. Climatol. 34 (3), 623–642. doi:10.1002/joc.3711
Heggem, E. S. F., Etzelmüller, B., Anarmaa, S., Sharkhuu, N., Goulden, C. E., and Nandinsetseg, B. (2006). Spatial Distribution of Ground Surface Temperatures and Active Layer Depths in the Hövsgöl Area, Northern Mongolia. Permafr. Periglac. Process. 17 (4), 357–369. doi:10.1002/ppp.568
Holloway, J. E., Lewkowicz, A. G., Douglas, T. A., Li, X., Turetsky, M. R., Baltzer, J. L., et al. (2020). Impact of Wildfire on Permafrost Landscapes: A Review of Recent Advances and Future Prospects. Permafr. Periglac Process 31 (3), 371–382. doi:10.1002/ppp.2048
Hu, G., Zhao, L., Wu, T., Wu, X., Park, H., Fedorov, A., et al. (2021). Spatiotemporal Variations and Regional Differences in Air Temperature in the Permafrost Regions in the Northern Hemisphere during 1980-2018. Sci. Total Environ. 791, 148358. doi:10.1016/j.scitotenv.2021.148358
Ishikawa, M., Jamvaljav, Y., Dashtseren, A., Sharkhuu, N., Davaa, G., Iijima, Y., et al. (2018). Thermal States, Responsiveness and Degradation of Marginal Permafrost in Mongolia. Permafr. Periglac Process 29 (4), 271–282. doi:10.1002/ppp.1990
Jiang, F.-q., Jilili, A.-w., Wang, S.-p., Hu, R.-j., and Li, X.-l. (2015). Annual Thawing and Freezing Indices Changes in the China Tianshan Mountains. Reg. Environ. Change 15 (2), 227–240. doi:10.1007/s10113-014-0610-3
Jiang, F., Hu, R., and Li, Z. (2008). Variations and Trends of the Freezing and Thawing Index along the Qinghai-Xizang Railway for 1966-2004. J. Geogr. Sci. 18 (1), 3–16. doi:10.1007/s11442-008-0003-y
Johannessen, O. M., Kuzmina, S. I., Bobylev, L. P., and Miles, M. W. (2016). Surface Air Temperature Variability and Trends in the Arctic: New Amplification Assessment and Regionalisation. Tellus A Dyn. Meteorology Oceanogr. 68 (1), 28234. doi:10.3402/tellusa.v68.28234
Juřička, D., Novotná, J., Houška, J., Pařílková, J., Hladký, J., Pecina, V., et al. (2020). Large-scale Permafrost Degradation as a Primary Factor in Larix Sibirica Forest Dieback in the Khentii Massif, Northern Mongolia. J. For. Res. 31 (1), 197–208. doi:10.1007/s11676-018-0866-4
Knoblauch, C., Beer, C., Liebner, S., Grigoriev, M. N., and Pfeiffer, E.-M. (2018). Methane Production as Key to the Greenhouse Gas Budget of Thawing Permafrost. Nat. Clim. Change 8 (4), 309–312. doi:10.1038/s41558-018-0095-z
Kynický, J., Brtnický, M., Vavříček, D., Bartošová, R., and Majigsuren, U. (2009). Permafrost and Climatic Change in Mongolia. Stara Lesna: Sustainable Development and Bioclimate 1.vyd.
Li, C., Sa, C., Liu, G., Wang, M., Meng, F., and Bao, Y. (2020). Spatiotemporal Changes of Snow Cover and its Response to Climate Changes in the Mongolian Plateau from 2000 to 2017. Chin. J. Grassl. 42 (02), 95–104. doi:10.16742/j.zgcdxb.20190300
Liao, Y., Li, Y., Fan, J., Galoie, M., and Motamedi, A. (2021). Spatiotemporal Variations of Freezing and Thawing Indices during the Past Four Decades in Tibet. Front. Ecol. Evol. 675 750961. doi:10.3389/fevo.2021.750961
Liu, L., and Luo, D. (2019). Spatial and Temporal Characteristics of Air/ground Freezing and Thawing Index in the Middle and Lower Reaches of the Yar ⁃lung Zangbo River during 1977 -2017. J. Glaciol. Geocryol. 41 (4), 1–11. doi:10.7522/j.issn.1000-0240.2019.0048
Lü, J. J., Li, X. Z., Hu, Y. M., Wang, X. W., and Sun, J. (2008). Application of Frost Number Model in Northeast China Pepmafrost Regionalization. Ying Yong Sheng Tai Xue Bao 19 (10), 2271–2276. doi:10.13287/j.1001-9332.2008.0373
Luo, D., Jin, H., Jin, R., Yang, X., and Lü, L. (2014). Spatiotemporal Variations of Climate Warming in Northern Northeast China as Indicated by Freezing and Thawing Indices. Quat. Int. 349, 187–195. doi:10.1016/j.quaint.2014.06.064
Mann, H. B. (1945). Nonparametric Tests against Trend. Econometrica 13, 245–259. doi:10.2307/1907187
Munkhjargal, M., Yadamsuren, G., Yamkhin, J., and Menzel, L. (2020). Ground Surface Temperature Variability and Permafrost Distribution over Mountainous Terrain in Northern Mongolia. Arct. Antarct. Alp. Res. 52 (1), 13–26. doi:10.1080/15230430.2019.1704347
Ni, J., Wu, T., Zhao, L., Li, R., and Xie, C. (2019). Carbon Cycle in Arctic Permafrost Regions: Progress and Prospect. J. Glaciol. Geocryol. 41 (4), 845–857. doi:10.7522/j.issn.1000-0240.2019.0402
Obu, J., Westermann, S., Bartsch, A., Berdnikov, N., Christiansen, H. H., Dashtseren, A., et al. (2019). Northern Hemisphere Permafrost Map Based on TTOP Modelling for 2000-2016 at 1 Km2 Scale. Earth-Science Rev. 193, 299–316. doi:10.1016/j.earscirev.2019.04.023
Peng, X., Zhang, T., Frauenfeld, O. W., Du, R., Wei, Q., and Liang, B. (2020b). Soil Freeze Depth Variability across Eurasia during 1850–2100. Clim. Change 158 (3), 531–549. doi:10.1007/s10584-019-02586-4
Peng, X., Zhang, T., Frauenfeld, O. W., Wang, S., Qiao, L., Du, R., et al. (2020a). Northern Hemisphere Greening in Association with Warming Permafrost. J. Geophys. Res. Biogeosciences 125 (1), e2019JG005086. doi:10.1029/2019jg005086
Peng, X., Zhang, T., Liu, Y., and Luo, J. (2019). Past and Projected Freezing/thawing Indices in the Northern Hemisphere. J. Appl. Meteorology Climatol. 58 (3), 495–510. doi:10.1175/jamc-d-18-0266.1
Qi, Y., Li, S., Ran, Y., Wang, H., Wu, J., Lian, X., et al. (2021). Mapping Frozen Ground in the Qilian Mountains in 2004-2019 Using Google Earth Engine Cloud Computing. Remote Sens. 13 (1), 149. doi:10.3390/rs13010149
Qian, L. (2013). A Review of Studies on Permafrost Changes under Global Warming Background. Jilin Meteorol. 2013 (1), 25–28.
Qin, D., Zhou, B., and Xiao, C. (2014). Progress in Studies of Cryospheric Changes and Their Impacts on Climate of China. J. Meteorol. Res. 28 (5), 732–746. doi:10.1007/s13351-014-4029-z
Qin, Y., Wu, T., Li, R., Yu, W., Wang, T., Zhu, X., et al. (2016). Using ERA-Interim Reanalysis Dataset to Assess the Changes of Ground Surface Freezing and Thawing Condition on the Qinghai-Tibet Plateau. Environ. Earth Sci. 75 (9), 826. doi:10.1007/s12665-016-5633-2
Qin, Y., Wu, T., Zhang, P., Liu, W., Xue, S., and Guo, Z. (2021). Spatiotemporal Freeze-Thaw Variations over the Qinghai‐Tibet Plateau 1981-2017 from Reanalysis. Int. J. Climatol. 41 (2), 1438–1454. doi:10.1002/joc.6849
Ran, Y., Li, X., Cheng, G., Nan, Z., Che, J., Sheng, Y., et al. (2021). Mapping the Permafrost Stability on the Tibetan Plateau for 2005-2015. Sci. China Earth Sci. 64, 62–79. doi:10.1007/s11430-020-9685-3
Ran, Y., Li, X., Jin, R., and Guo, J. (2015). Remote Sensing of the Mean Annual Surface Temperature and Surface Frost Number for Mapping Permafrost in China. Arct. Antarct. Alp. Res. 47 (2), 255–265. doi:10.1657/AAAR00C-13-306
Sharkhuu, N. (2003). “Recent Changes in the Permafrost of Mongolia,” in Permafrost: Proceedings of the 8th International Conference on Permafrost, Zurich, Switzerland, July 21–25, 2003 (Ulaanbaatar, Mongolia: Institute of Geography, MAS), Vol. 2, 1029–1034.
Sharkhuu, N., Anarmaa, S., Romanovsky, V. E., Yoshikawa, K., Nelson, F. E., and Shiklomanov, N. I. (2008). “Thermal State of Permafrost in Mongolia,” in Proceedings of the 9th International Conference on Permafrost, Fairbanks, AK, June 29–July 3, 2008, Vol. 2, 1633–1638.
Shi, Y., Niu, F., Lin, Z., and Luo, J. (2019). Freezing/thawing Index Variations over the Circum-Arctic from 1901 to 2015 and the Permafrost Extent. Sci. Total Environ. 660, 1294–1305. doi:10.1016/j.scitotenv.2019.01.121
Simmons, A. J., Jones, P. D., da Costa Bechtold, V., Beljaars, A. C. M., Kållberg, P. W., Saarinen, S., et al. (2004). Comparison of Trends and Low-Frequency Variability in CRU, ERA-40, and NCEP/NCAR Analyses of Surface Air Temperature. J. Geophys. Res. 109 (D24). doi:10.1029/2004JD005306
Sjöberg, Y., Siewert, M. B., Rudy, A. C., Paquette, M., Bouchard, F., Malenfant‐Lepage, J., et al. (2020). Hot Trends and Impact in Permafrost Science. Permafr. Periglac. Process. 31 (4), 461–471. doi:10.1002/ppp.2047
Vaughan, D. G., Comiso, J. C., Allison, I., Carrasco, J., Kaser, G., Kwok, R., et al. (2014). “Observations: Cryosphere,” in Climate Change 2013: The Physical Science Basis. Contribution of Working Group I to the Fifth Assessment Report of the Intergovernmental Panel on Climate Change (Cambridge, United Kingdom and New York, NY: Cambridge University Press).
Wang, L., Zhen, L., Liu, X., Ochirbat, B., and Wang, Q. (2008). Comparative Studies on Climate Changes and Influencing Factors in Central Mongolian Plateau Region. Geogr. Res. 27 (1), 171–180. doi:10.11821/yj2008010019
Wang, R., Zhu, Q., and Ma, H. (2019). Changes in Freezing and Thawing Indices over the Source Region of the Yellow River from 1980 to 2014. J. For. Res. 30 (1), 257–268. doi:10.1007/s11676-017-0589-y
Wang, Y., Wang, L., Li, X., and Chen, D. (2018). Temporal and Spatial Changes in Estimated Near-Surface Air Temperature Lapse Rates on Tibetan Plateau. Int. J. Climatol. 38 (7), 2907–2921. doi:10.1002/joc.5471
Wen, X., Wang, S., Zhu, J., and David, V. (2006). An Overview of China Climate Change over the 20th Century Using UK UEA/CRU High Resolution Grid Data. Chin. Jo urnal Atmo sphe ric Sci. 30 (5), 894–904. doi:10.3878/j.issn.1006-9895.2006.05.18
Wu, T., Qin, Y., Wu, X., Li, R., Zou, D., and Xie, C. (2018). Spatiotemporal Changes of Freezing/thawing Indices and Their Response to Recent Climate Change on the Qinghai–Tibet Plateau from 1980 to 2013. Theor. Appl. Climatol. 132 (3), 1187–1199. doi:10.1007/s00704-017-2157-y
Wu, T., Wang, Q., Zhao, L., Batkhishig, O., and Watanabe, M. (2011). Observed Trends in Surface Freezing/thawing Index over the Period 1987-2005 in Mongolia. Cold Regions Sci. Technol. 69 (1), 105–111. doi:10.1016/j.coldregions.2011.07.003
Yao, T., Qin, D., Shen, Y., Zhao, L., Wang, N., Lu, A., et al. (2013). Cryospheric Changes and Their Impacts on Regional Water Cycle and Ecological Conditions in the Qinghai-Tibetan Plateau. Chin. J. Nat. 35 (3), 179–186. doi:10.3969/j.issn.0253-9608.2013.03.004
You, Q., Kang, S., Pepin, N., Flügel, W.-A., Sanchez-Lorenzo, A., Yan, Y., et al. (2010). Climate Warming and Associated Changes in Atmospheric Circulation in the Eastern and Central Tibetan Plateau from a Homogenized Dataset. Glob. Planet. Change 72 (1-2), 11–24. doi:10.1016/j.gloplacha.2010.04.003
Yu, W. J. (2017). Spatiotemporal Variations of Evapotranspiration Based on Multi-Sources Data in Mongolia. Lanzhou: Northwest Institute of Eco-Environment and Resources, Chinese Academy of Sciences.
Zhang, F., Mu, M., Fan, C., Jia, L., Mu, C., Zhao, L., et al. (2020). Studies of Permafrost Carbon Cycle in the Third Polar and Arctic Regions. J. Glaciol. Geocryol. 42 (1), 170–181. doi:10.7522/jissn.1000-0240.2020.0005
Zhao, L., Wu, Q., Marchenko, S. S., and Sharkhuu, N. (2010). Thermal State of Permafrost and Active Layer in Central Asia during the International Polar Year. Permafr. Periglac. Process. 21 (2), 198–207. doi:10.1002/ppp.688
Zhao, T., and Fu, C. (2006). Comparison of Products from ERA-40, NCEP-2, and CRU with Station Data for Summer Precipitation over China. Adv. Atmos. Sci. 23 (4), 593–604. doi:10.1007/s00376-006-0593-1
Zhou, X., Shi, H., Wang, X., and Meng, F. (2012). Study on the Temporal and Spatial Dynamic Changes of Land Use and Driving Forces Analysis of Mongolia Plateau in Recent 30 Years. Acta Agric. Zhejianggensis 24 (6), 1102–1110.
Keywords: freezing and thawing index, permafrost, CRU, Mongolian plateau, change-point
Citation: Ma X, Wu T, Zhu X, Lou P, Wang D, Adiya S, Avirmed D, Dorjgotov B, Chen J, Shang C, Wen A, La Y, Wei X and Li R (2022) Spatiotemporal Variations in the Air Freezing and Thawing Index Over the Mongolian Plateau From 1901 to 2019. Front. Environ. Sci. 10:875450. doi: 10.3389/fenvs.2022.875450
Received: 14 February 2022; Accepted: 21 April 2022;
Published: 11 May 2022.
Edited by:
Zoe Courville, Cold Regions Research and Engineering Laboratory, United StatesReviewed by:
Rudiger Gens, University of Alaska Fairbanks, United StatesHotaek Park, Japan Agency for Marine-Earth Science and Technology (JAMSTEC), Japan
Copyright © 2022 Ma, Wu, Zhu, Lou, Wang, Adiya, Avirmed, Dorjgotov, Chen, Shang, Wen, La, Wei and Li. This is an open-access article distributed under the terms of the Creative Commons Attribution License (CC BY). The use, distribution or reproduction in other forums is permitted, provided the original author(s) and the copyright owner(s) are credited and that the original publication in this journal is cited, in accordance with accepted academic practice. No use, distribution or reproduction is permitted which does not comply with these terms.
*Correspondence: Tonghua Wu, dGh1YXd1QGx6Yi5hYy5jbg==