 Young-Jae Jeong1,2
 Bo-Seong Seo1,2Nuri Baek1,2Jin-Hyeob Kwak3Sang-Mo Lee4Hyun-Jin Park1,5*
 Woo-Jung Choi1,2,6*
- 1Department of Rural and Bio-systems Engineering, Chonnam National University, Gwangju, South Korea
- 2Education and Research Unit for Climate-Smart Reclaimed-Tideland Agriculture (Brain Korea 21), Chonnam National University, Gwangju, South Korea
- 3Department of Rural Construction Engineering, Jeonbuk National University, Jeonju, South Korea
- 4National Instrumentation Center for Environmental Management, Seoul National University, Seoul, South Korea
- 5Department of Renewable Resources, University of Alberta, Edmonton, AB, Canada
- 6AgriBio Institute of Climate Change Management, Chonnam National University, Gwangju, South Korea
Nitrogen (N) isotope ratios (δ15N) of multiple N species including ammonium (NH4+), nitrate (NO3−), dissolved organic N (DON), and total dissolved N (TDN) can serve as indicators of the sources of wet N deposition. However, methods for sequential analysis of these multiple N species are not well developed. In this study, methods for the determination of δ15N of these multiple N species were proposed through a traditional distillation method for NH4+ and NO3−, direct evaporation for TDN, and an isotope mass balance equation for δ15N-DON. A series of experiments were conducted 1) to find evaporation conditions including pH (<3.5 vs. 5.4) and evaporation methods (oven drying at 60 and 100°C, infra-red chamber, and freeze-drying), 2) to investigate precision and accuracy of distillation for δ15N of NH4+ and NO3−, and 3) to determine δ15N-TDN by direct evaporation and δ15N-DON with mass balance equation. (NH4)2SO4 (‒4.0 ± 0.03‰), KNO3 (‒4.2 ± 0.03‰), and CO(NH2)2 (‒5.4 ± 0.04‰) were used as reference materials for NH4+, NO3−, and DON, respectively. In this study, for the analysis of δ15N of NH4+ and NO3−, the conventional distillation method was tested in an effort to save cost for laboratories equipped with the distillation system. Evaporation using oven at 60°C (but not 100°C), infra-red chamber, or freeze-drier after acidification to < pH 3.5 prevented 14NH3 loss. Analysis of the δ15N-NO3− (‒4.4 ± 0.1‰ to ‒3.9 ± 0.5‰) was reliable for a wide range of N content (0.1–0.5 mg), but analytical errors for δ15N-NH4+ were as high as 2.1‰ when N content was small (e.g., 0.1–0.3 mg N) due to background contamination and potential interference by co-existing DON. Direct evaporation of solution containing NH4+, NO3−, and DON to dryness produced reliable δ15N-TDN with accuracy <0.15‰ and precision <0.21‰. However, the analytical errors of δ15N-DON were highly dependent on the content of co-existing NH4+ as well as DON content. Therefore, the proposed protocol can be applied for rainwater containing a high NH4+ concentration (>2.0 mg N L−1 assuming that 200 ml of sample is used for distillation).
Introduction
Atmospheric nitrogen (N) deposition is an important N source in terrestrial ecosystems (Fowler et al., 2015). During the last four decades, global N deposition in terrestrial ecosystems increased from 87 Tg Nyr−1 in the 1980s to 93 Tg Nyr−1 in the 2010s, and it is expected to increase to 125 Tg N yr−1 by 2050 (Bobbink et al., 2010; Ackerman et al., 2019). Though the contribution of wet and dry deposition to total N deposition varies with countries, wet N deposition such as ammonium (NH4+) and nitrate (NO3−) through rainfall is substantial (Li et al., 2016; Felix et al., 2017). Increased N deposition may impact terrestrial ecosystems through soil acidification and associated changes in soil environment and vegetation compositions (Phoenix et al., 2012). Therefore, to estimate the environmental and ecological impacts of N deposition, it is necessary to distinguish the sources of N and to trace deposited N in ecosystems (Ohte, 2012).
The stable N isotope ratios (δ15N) of NH4+ (e.g., Felix et al., 2017) and NO3− (e.g., Nanus et al., 2018) have extensively been used for source appointment of wet N deposition. For example, the δ15N of NH4+ originated from agricultural sources such as livestock waste and fertilizer is generally lower than those from coal combustion (Felix et al., 2017), and the δ15N of NO3− derived from coal combustion is higher than that from diesel and gasoline combustions (Nanus et al., 2018). Though analytical accuracy slightly differs, many methods are available for the analysis of δ15N of NH4+ and NO3−. For example, the δ15N of NH4+ is often analyzed through distillation (Hauck, 1982), diffusion (Cao et al., 2018), or oxidation to NO3− followed by reduction to N2O (Lachouani et al., 2010). For the analysis of δ15N of NO3−, chemical (Mcllvin and Altabet, 2005) and bacterial (Sigman et al., 2001) reduction of NO3− to N2O followed by gases measurement of δ15N of N2O and distillation after reduction of NO3− to NH4+ by addition of Devarda’s alloy (Hauck, 1982) are frequently used.
Method selection for δ15N measurement of water samples is largely dependent on the resource (apparatus and instruments) availability of laboratories as each method has both advantages and disadvantages. For example, the NH4+ diffusion method is less labor-intensive but requires a long time (several days) for complete NH3 diffusion due to a slow rate of diffusion (Cao et al., 2018). Distillation is quick but labor-intensive and has the potential of cross-contamination between samples (Chen and Dittert, 2008). Reduction of NO3− to N2O is accurate but requires several hours for completion of denitrification (Sigman et al., 2001).
The accuracy of diffusion (Chen and Dittert, 2008; Zhang et al., 2015; Cao et al., 2018), chemical reduction (Mcllvin and Altabet, 2005; Liu et al., 2014), and bacterial reduction (Sigman et al., 2001; Böhlke et al., 2007) methods for measurement of δ15N of NH4+ and NO3− have been extensively tested, and many advanced modifications have been proposed. However, unexpectedly, there are very few studies on the distillation method (Feast and Dennis, 1996) despite distillation systems are still widely used for the determination of N concentration and thus are available in many laboratories (Sáez-Plaza et al., 2013). If the δ15N of NH4+ and NO3− could be measured accurately using the distillation method, it may save cost to install additional equipment for the δ15N analysis in laboratories equipped with the traditional distillation system.
Analytical uncertainties of sample preparation using a distillation method for δ15N measurement typically arise from NH3 volatilization during evaporating NH4+ solution (in H2SO4 matrix) to obtain (NH4)2SO4 salt as preferential losses of 14NH3 result in overestimation of the δ15N (Feast and Dennis, 1996). Typically, NH3 volatilization is affected by pH, and thus acidification (pH < 3–4) of the solution before evaporation is required (Buresh et al., 1982; Hauck, 1982; Feast and Dennis, 1996). Evaporation methods using an oven, an infra-red chamber, or a freeze-drier may also affect the accuracy of δ15N measurement due to the temperature dependency of NH3 volatilization (Emerson et al., 1975; Hales and Drewes, 1979). Despite the critical effects of NH3 volatilization on the accuracy of δ15N, no study has investigated the combined effects of pH adjustment and evaporation methods on δ15N, highlighting the necessity of relevant studies.
Compared to NO3− and NH4+, DON has received less research interest despite that DON is a dominant N form and thus a key component in the global N cycle (Russow et al., 2002; Lee et al., 2012; Nikolenko et al., 2018; Cao et al., 2021). The contribution of DON to total dissolved N (TDN) is also substantial up to >40% (Cornell et al., 2003; Lee et al., 2012). The δ15N of DON can be determined after removing NH4+ and NO3− via ion retardation columns (Bronk and Gilbert, 1991), membrane filters (Feuerstein et al., 1997), and diffusion of NH4+ (and NO3− after reduction of NO3− to NH4+) using MgO and Devarda’s alloy (Slawyk and Raimbault, 1995). However, the direct measurement of the δ15N of DON is often being questioned due to low accuracy (Cao et al., 2021). Alternatively, the δ15N of DON can be obtained indirectly with isotope mass balance equation using the concentrations and δ15N of NH4+, NO3−, and TDN (Liu et al., 2017). The δ15N of TDN is often determined through alkaline-persulfate digestion followed by reduction of NO3− to N2O (Lachouani et al., 2010; Liu et al., 2017). Recently, Cao et al. (2021) has successfully proposed a protocol for the determination of δ15N-DON using an isotope mass balance equation through analyses of δ15N of NH4+, NO3−, and TDN. However, in the proposed procedures, δ15N of each N species is measured independently; diffusion for NH4+, denitrification for NO3−, and persulfate-oxidation followed by denitrification for TDN. Therefore, a simple method to determine δ15N of NH4+, NO3−, and TDN may be of help to determine δ15N of DON; however, the relevant study is not available.
Therefore, the literature indicates that a method for analysis of these multiple N species is not well developed. This study was conducted to establish a procedure for sequential measurement of δ15N of NH4+, NO3−, DON, and TDN in rainwater samples through distillation and evaporation. To achieve the objective, firstly, we investigated the combined effects of acidification and evaporation methods on the δ15N measurement to suggest suitable evaporating conditions of H2SO4 solution containing NH4+ (experiment 1). Secondly, the precision and accuracy of measurement of δ15N of NH4+ and NO3− through sequential distillation were investigated using samples with different N content (0.1–0.5 mg N) (experiment 2). Thirdly, the precision and accuracy of direct evaporation of water samples to determine δ15N of TDN were tested (experiment 3). Finally, by combining the results of experiments 1–3, we suggested a protocol for the simultaneous measurement of δ15N of NH4+, NO3−, DON, and TDN.
Materials and Methods
Reference Materials
All the experiments were conducted using chemical-grade ammonium sulfate ((NH4)2SO4, 7783-20-2, Junsei, Japan), potassium nitrate (KNO3,7757-79-1, Junsei, Japan), and urea (CO(NH)2, 57-13-6, Junsei, Japan) as reference materials for both concentration and δ15N of NH4+, NO3−, and DON, respectively, throughout the experiments. Though nitrite (NO2−) may be also be contained in rainwater, NO2− was not considered as the concentration of NO2− is reported to be as low as < 1% of NO3− (Sa et al., 2022). The δ15N of the compounds were analyzed using a stable isotope ratio mass spectrometer linked to an elemental analyzer (EA-IRMS) (VisION, Isoprime Ltd., Cheadle Hulme, United Kingdom), and reported as
where R is the atom % of 15N/(14N + 15N), and the standard was atmospheric N2 (R = 0.3663%). Accuracy of the measurement by the EA-IRMS tested using IAEA-N1 and N2 (both ammonium sulfate, +0.4‰ and +20.3‰, respectively) was <0.2‰. The δ15N of the reference materials was calibrated against the IAEA-N1 and N2. The mean and standard errors of the δ15N of (NH4)2SO4, KNO3, and CO(NH)2 measured in 10 replicates were ‒4.0 ± 0.03‰, ‒4.2 ± 0.03‰, and ‒5.4 ± 0.04‰, respectively.
Setting pH and Selecting Evaporation Method for Evaporation After Distillation
To set pH and select evaporation method to obtain (NH4)2SO4 salt from distillates for measurement of δ15N using the EA-IRMS, the effects of pH adjustment (pH < 3.5 and 5.4) and evaporation methods (oven at 60°C, oven at 100°C, infra-red chamber, and freeze-drying) were investigated using (NH4)2SO4 as reference material. (NH4)2SO4 solutions with two different concentrations (2 and 4 mg N L−1 for low and high N, respectively) were prepared. Solution (100 ml) of (NH4)2SO4 (0.2 and 0.4 mg N for low and high N contents, respectively) was transferred to a 250-ml beaker, and 10 mg sodium sulfate (Na2SO4) (1 ml of 10 g Na2SO4 L−1 solution) was added to the beaker as a bulking agent to make sure sufficient amount of salt recovered after evaporation. Therefore, the N solutions are comprised of NH4+, Na+, and SO42−, which are the ion compositions of the solutions when the distilled NH4+ is collected in H2SO4 and back-titrated with NaOH (Hauck, 1982). The pH of the solution measured with a pH meter (Orion 3 Star, Thermo Fisher Scientific Inc., United States) was 5.4 ± 0.1. Another set of the N solution was acidified to pH < 3.5 by adding 0.2 ml of 0.1 N H2SO4.
To select evaporation methods, the beakers containing (NH4)2SO4 solution were placed into a drying oven (WOF-155, Daihan Scientific, Korea), a house-made infra-red chamber, and a freeze drier (FD5508, Ilshin, Korea). The infra-red chamber (56 × 58 × 53 m3) was equipped with two infra-red lamps (Dr. Fischer 177.5 mm and 500 W). Each experiment was repeated four times for 2 N concentration levels, pH adjustment, and evaporation methods. The N solution was evaporated to dryness for 48 h. The dried salts were crushed to fine powder using a spatula. Powder containing approximately 0.1 mg N (28N2 beam area: 2.0E-07) was wrapped into a tin capsule and analyzed for δ15N using the EA-IRMS.
To determine the recovery of NH4+ after evaporation, another set of four replicates was processed following the same procedures described above. The dried salts were re-dissolved by adding 50-ml of deionized water, and N content was determined using the indophenol method (Mulvaney, 1996) to calculate the loss of N during evaporation. The overall pattern of temperature change during evaporation was monitored using 1 L of deionized water contained in a 1 L beaker. Tip of temperature sensors (TR-52, T&D Cooperation, Japan) was installed at 3.5 cm above the bottom and 3.5 cm below the water surface, and the temperature was monitored for 10 h. After 10 h, it was not possible to measure temperature at the position due to decreased sample volume.
δ15N Measurement of NH4+ and NO3− Using Distillation
Nitrogen mixture solutions containing NH4+, NO3−, and CO(NH2)2 (0.5, 1, 1.5, 2, and 2.5 mg N for each N species) were prepared by dissolving the reference (NH4)2SO4, KNO3, and CO(NH2)2 in 1 L deionized water. The concentrations of reference N were set to include the range of N concentration of rainfall (<0.1 to >1.0 mg N L−1) reported in the literature (Lee et al., 2012; Zeng et al., 2020; Chen et al., 2022). Distillation was performed following the standard distillation procedures of Mulvaney (1996) with some modifications to distillate a large quantity of samples. Briefly, 200 ml of the solution (containing 0.1, 0.2, 0.3, 0.4, and 0.5 mg N for each N species) was transferred to 500-ml distillation flasks, and the flasks were placed on a heating mantle (GLHMP-F100, Global Lab, Korea). NH4+ was liberated by distillation with addition 0.5 g of carbonate-free MgO (1309-48-4, Junsei, Japan) for 4–5 min to collect 30–40 ml of distillates. Carbonate-free MgO was prepared by heating MgO at 700°C for 2 h and used following the suggestion of Mulvaney (1996). In a preliminary experiment, 4–5 min distillation was sufficient to recover NH4+ (>99%). The liberated NH3 was collected in a 250 ml beaker containing 10 ml of 0.01 N H2SO4. The (NH4)2SO4 solution was titrated to pH 5.4 using 0.01 N NaOH and further acidified to pH < 3.5 by adding approximately 0.2 ml of 0.01 N H2SO4 and dried to salt under the infra-red lamps.
The distillation flasks were cooled down to room temperature, and the distillation apparatus was washed by distilling 30 ml of 90% ethanol for 5 min using another set of distilling flasks. For distillation of NO3−, 50 ml of deionized water was added to the flasks to restore sample volume. To convert NO3− to NH3, 0.3 g of Devarda’s alloy (8049-11-4, Kanto Chemical, Japan) was added and distilled again following the procedure for NH4+. The (NH4)2SO4 solution was acidified to pH < 3.5 following the procedure described above. The acidified solution was dried through evaporation under infra-red lamps as it was found that oven drying at 60°C, freeze-drying, and drying under infra-red lamps were all suitable (see the results). The δ15N of dried powder was analyzed using the EA-IRMS. The experiments were replicated four times.
Determination of δ15N-TDN Using Direct Evaporation and Calculation of δ15N-DON
The same N mixture solutions containing NH4+, NO3−, and CO(NH2)2, which were used for the distillation experiment were prepared. The theoretical values of δ15N-TDN calculated from NH4+, NO3−, and CO(NH2)2 was ‒4.5 ± 0.03‰. An aliquot (200 ml) of the standard samples were transferred to 250-ml beaker, and 10 mg Na2SO4 (1 ml of 10 g Na2SO4 L−1 solution) was added to the beaker as a bulking agent followed by addition of 0.2 ml of 0.1 N H2SO4 to adjust the pH of the solution <3.5. The mixture was dried under infra-red lamps, and the dried powder was analyzed for δ15N of TDN using the EA-IRMS. All experiments were replicated four times.
The δ15N of DON was calculated using the following isotope mass balance equation (Karamanos and Rennie, 1981):
where CDON, CTDN, CNH4, and CNO3 are contents of DON, TDN, NH4+, and NO3−, respectively, and δ15NDON, δ15NTDN, δ15NNH4, and δ15NNO3 are their respective δ15N. The standard deviation (SD) of δ15NDON (SD δDON) was calculated by using the following equation (Cao et al., 2021):
where SDδTDN, SDδNO3, and SDδNH4 are the standard deviations of δ15N of TDN, NO3−, and NH4+, respectively.
Validation of δ15N Analyses Using the Proposed Methods
The methods for the determination of δ15N of NH4+, NO3−, DON, and TDN using distillation and evaporation developed in the present study were validated using reference solutions. The reference solutions were prepared by dissolving the reference (NH4)2SO4, KNO3, and CO(NH2)2 in distilled water at two levels of N concentrations (2 and 3 mg N L−1 for each N species). 200 ml of the solution (containing each 0.4 or 0.6 mg N of NH4+, NO3−, and DON) was distilled for the analysis of the δ15N of NH4+ and NO3−, and another 200 ml of the solution was directly dried for the analysis of δ15N of TDN under infra-red following the procedures described above. All experiments were replicated four times. The δ15N of DON was calculated using the isotope mass balance equation.
Statistical Analyses
All statistical analyses were performed using IBM SPSS Statistics 23 (IBM Corp., Armonk, New York, United States) at a significance level of 0.05. Data were tested for normality of distribution and homogeneity of variance with Shapiro-Wilk test and Levene’s test, respectively. Data transformation was not needed as no heterogeneity was detected and the distribution was normal. In each experiment, the changes in the δ15N among the treatments (e.g., N content, pH adjustment, and evaporating method) were assessed by the analysis of variance (ANOVA). The precision of the δ15N measurement was assessed by calculating the standard deviation for the replicated treatments. The accuracy of the δ15N measurement was evaluated by calculating isotope enrichment, the differences between δ15N obtained from distillation-evaporation methods and that of reference materials determined with the direct combustion method. A t-test was performed to examine the difference in δ15N between distillation-evaporation and direct combustion methods.
Results and Discussion
Evaporation Conditions: pH and Evaporating Method
The temperature of the solutions quickly increased to the maximum temperature within 1 h, and was maintained at the temperature thereafter (Figure 1). The maximum temperatures of the top and bottom sides of the solution were 50.1 and 49.0°C for oven drying at 60°C, 87.0 and 69.3°C for oven drying at 100°C, and 53.0 and 53.2°C for infra-red chamber, respectively. The δ15N of (NH4)2SO4 measured after evaporation was affected by N content and pH of the solutions and evaporation method (Table 1). Though the effects of these three factors on δ15N were complicated as inferred from the significant interactions among the experimental factors, evaporation at pH < 3.5 produced more reliable δ15N than pH 5.4 across the N contents and evaporation methods. Among the evaporation methods, oven at 60°C, infra-red chamber, and freeze drier, but not oven at 100°C resulted in the δ15N comparable to the initial δ15N (‒4.0‰) at pH < 3.5 regardless of N contents. Evaporating the solutions at pH 5.4 resulted in significant errors (1.4–21.8‰) regardless of N contents and evaporation methods including freeze-drying due to N loss as inferred from the low N recoveries (30–89%) (Table 1).
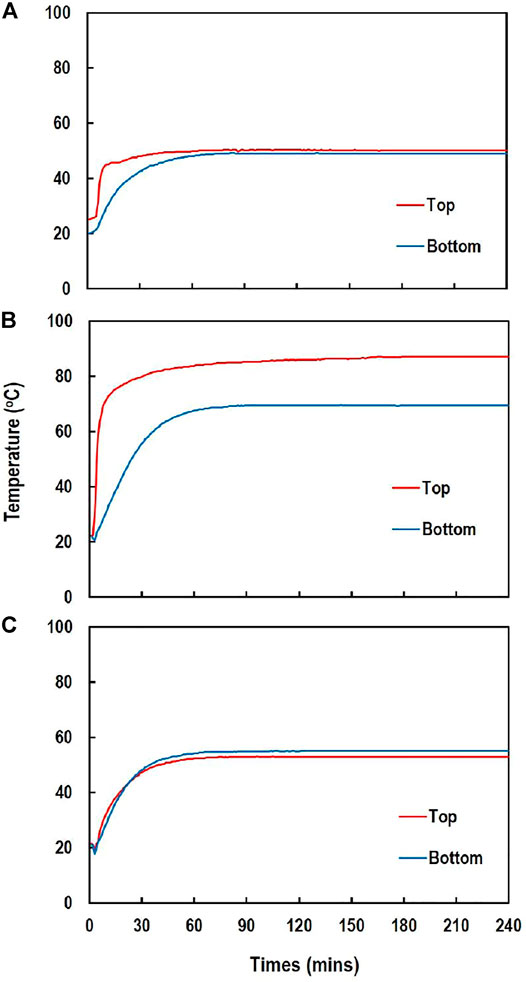
FIGURE 1. Changes in temperature of the (NH4)2SO4 solution during evaporation measured at 3.5 cm below the water surface (top) and 3.5 cm above the bottom (bottom) for 10 h: (A) oven at 60°C (B) oven 100°C, and (C) infra-red chamber.
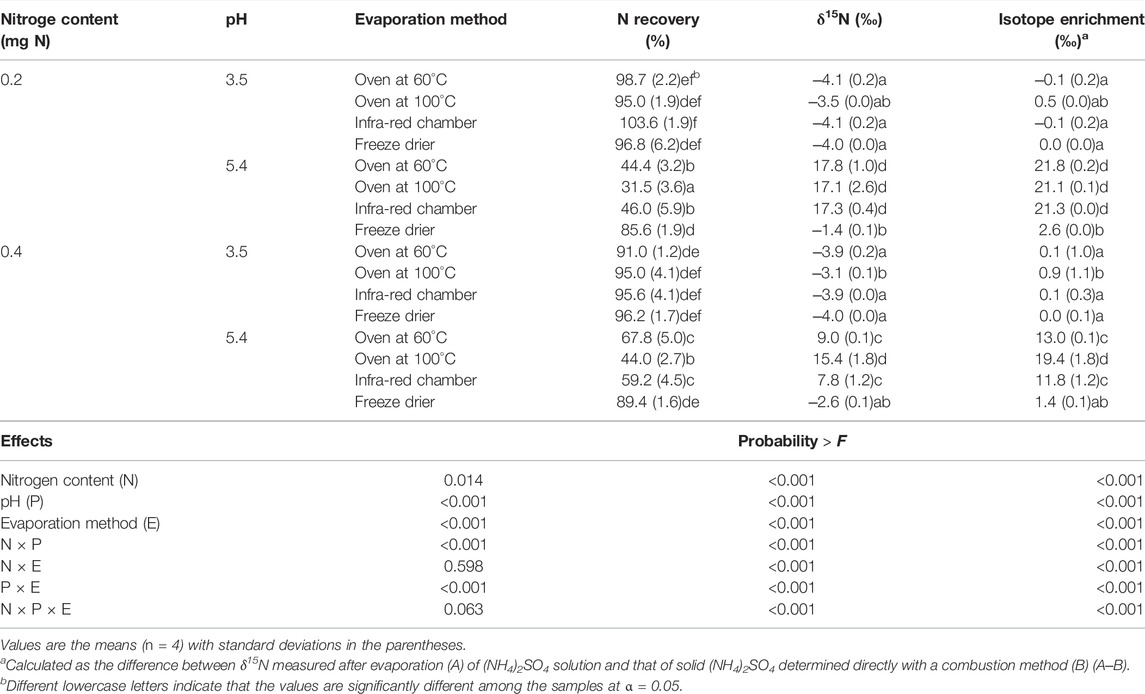
TABLE 1. Effects of N content, pH, and evaporating methods on the N recovery and δ15N of (NH4)2SO4 (‒4.0 ± 0.03‰) solution.
Isotope enrichment during evaporation, which was calculated as the difference between the δ15N measured after evaporation and the initial δ15N of solid (NH4)2SO4 before dissolving and evaporation (Table 1), was negatively correlated with N recovery (Figure 2A). The relationship between N recovery and δ15N followed the Rayleigh isotope enrichment model (Mariotti et al., 1981):
where δ15Ns is δ15N of the remaining substrate (i.e., N in dried salts), δ15Ni is the initial δ15N (‒4.0‰) of the substrate, ε is the isotope enrichment factor (the difference in δ15N between the substrate and its instantaneous product), and f is the fraction of the substrate that is consumed in the reaction (i.e., the fraction of N lost during evaporation). The slope of the regression equation indicated that ε is 23.0‰ and thus isotope fractionation factor is 1.023 (Figure 2B). This value is within the isotope fractionation factors (1.005–1.031) reported for NH3 volatilization (Cejudo and Schiff, 2018).
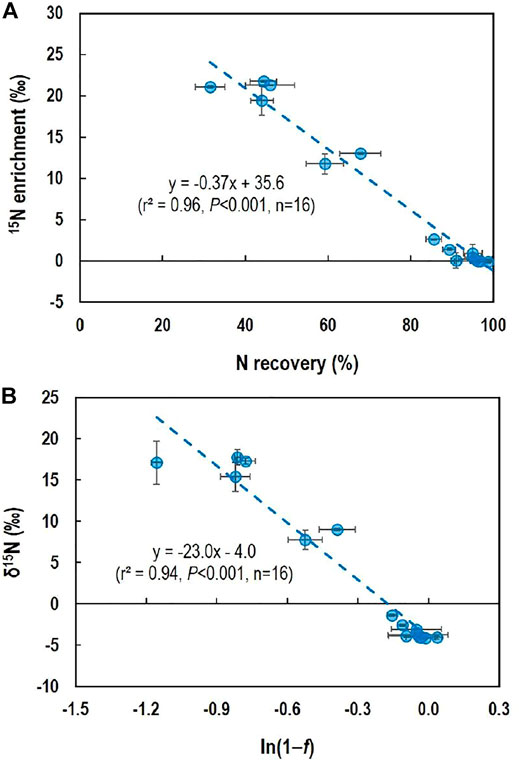
FIGURE 2. Relationship between δ15N-NH4+ and N loss during evaporation of (NH4)2SO4 solution to dryness under different pH and using different evaporation methods: (A) relationship between 15N enrichment (difference in δ15N-NH4+ between direct measurement and measurement with dried salts) and N recovery after evaporation and (B) relationship between the δ15N-NH4+ measured with dried salts and the fraction (1−f) of NH4+ recovered after evaporation for Rayleigh isotope enrichment model. Horizontal and vertical bars are standard deviation of the means (n = 4).
Acidification (pH 3–4) of the distillate solution containing NH4+ is conventionally recommended for evaporation using an oven or infra-red chamber (Buresh et al., 1982; Feast and Dennis, 1996; Lee et al., 2012). Our results provide quantitative data on 15N enrichment of the samples caused by NH3 volatilization. Notably, it was found that acidification did not completely prevent NH3 from volatilization under oven drying at 100°C, resulting in 15N enrichments (0.5–0.9‰). This result is interesting as it is believed that acidulated (NH4)2SO4 solution is stable at high temperature up to 235°C (Hauck, 1982). It is also notable that freeze-drying at pH 5.4 resulted in significant 15N enrichments (1.4–2.6‰), suggesting that freeze-drying does not prevent NH3 from volatilization and thus that acidification is still necessary even when the samples are evaporated using a freeze drier (Stock et al., 2019). Therefore, our results suggest that evaporation using an oven at 100°C should be avoided and that acidification of NH4+ solution is essential regardless of evaporation methods (including freeze-drying).
δ15N of NH4+ and NO3− Determined With Distillation Method
The δ15N-NH4+ measured using the distillation method varied (p = 0.022) with N content (Figure 3A). When N content was ≤0.3 mg, δ15N-NH4+ was underestimated by 1.0–2.1‰ (Figure 3A); meanwhile, when N contents were 0.4 and 0.5 mg, δ15N-NH4+ (‒4.0 ± 0.5‰ for both) was comparable to the reference δ15N. The poor accuracy for low-NH4+ samples could be attributed to the sample size effect on EA-IRMS measurement and/or inevitable background N contamination (Stark and Hart, 1996). However, in the present study, a similar amount of N (ca. 0.1 mg N) was used for the δ15N analysis on EA-IRMS for all the samples, and thus the sample size effect might be negligible. Therefore, background contamination arose from impurities of reagents and unintended trapping of NH3 from laboratory air during evaporation might be more critical (Stark and Hart, 1996; Jensen, 1991; Sakata, 2001). In the present study, air NH3 contamination was not detected in the evaporation experiment (Table 1), and thus the background contamination should be ascribed to impurities in the reagents. The underestimated δ15N-NH4+ together with the positive correlation between N contents and δ15N-NH4+ (Figure 3B) indicates potential contamination by NH4+ impurity of which δ15N is lower than the sample NH4+ (‒4.0‰). The δ15N of background NH4+ contaminants could be estimated using a regression equation between N content and δ15N of NH4+ (Figure 3B). The regression equation indicated that the δ15N of background NH4+ was ‒6.3‰ (y-intercept; i.e., the δ15N value when no sample NH4+ was added). Theoretically, background correction can be made using isotope dilution of a known 15N-enriched standard (Stark and Hart, 1996; Chen and Dittert, 2008; Cao et al., 2018) though this was not possible in the present study. As the magnitude of background contamination may vary with the experimental batch, we suggest that a laboratory-specific minimum N requirement (0.4 mg in the present study) needs to be determined prior to sample analyses for reliable measurement of δ15N of NH4+ using distillation. For samples containing a low NH4+ concentration, therefore, either increasing sample volume or sample concentration is necessary for distillation though this process may require an additional time. However, it is necessary to notice that other method for the determination of the δ15N of NH4+, such as diffusion methods, also takes several days (up to 7 days) for complete diffusion (Cao et al., 2018).
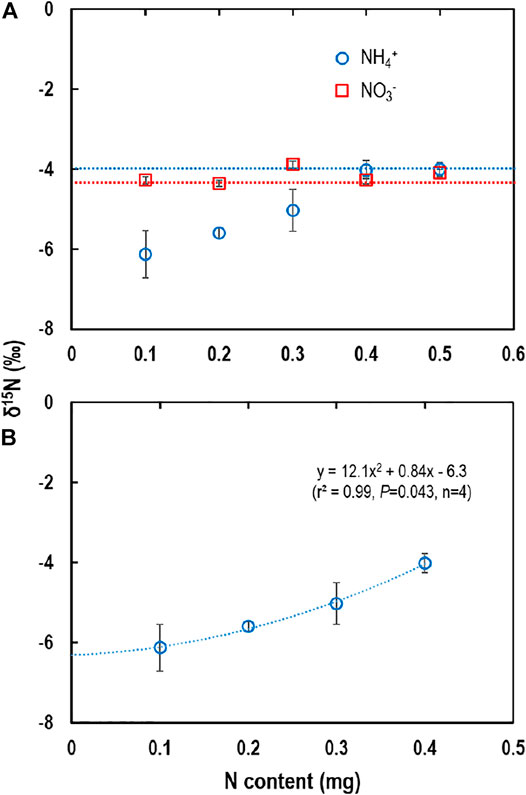
FIGURE 3. δ15N-NH4+ and δ15N-NO3− measured with distillation: (A) δ15N-NH4+ and δ15N- NO3− with increased N content from 0.1 to 0.5 mg N and (B) regression between N content and δ15N of NH4+ for 0.1–0.4 mg N sample (0.5 mg N was not included as accuracy was high enough). Vertical bars are the standard deviation of the means (n = 4). For (A), horizontal broken-lines are the reference δ15N values of NH4+ (blue one) and NO3− (red one) determined directly with EA-IRMS. For (B), the y-intercept of the regression equation indicates that the δ15N of background contamination is ‒6.3‰.
The δ15N-NO3- fluctuated from ‒4.4 ± 0.1‰ to ‒3.9 ± 0.5‰, but the values were not statistically different (p > 0.05) from the reference δ15N across the contents of NO3− (Figure 3A). This result indicates that any trace background NH4+ was removed from the distillation system during the first distillation for sample NH4+ under alkaline conditions using MgO. Therefore, δ15N of NO3− can be measured with a high accuracy using the distillation method across a wide range of N content.
δ15N-Total Dissolved N Determined With Direct Evaporation and δ15N-Dissolved Organic N Calculated Using the Isotope Mass Balance Equation
The δ15N-TDN was consistent across N contents from 0.1 to 0.5 mg N, and the averaged δ15N-TDN (‒4.5 ± 0.1‰) (Figure 4A) was not different (p > 0.05) from the theoretical δ15N-TDN (‒4.5 ± 0.03‰). Some studies have investigated δ15N-TDN using alkaline-persulfate oxidation of TDN to produce NO3− followed by reduction to gases N2O for δ15N measurement (Lachouani et al., 2010; Cao et al., 2021). Our results show that direct evaporation of water samples after acidification is also a feasible and simple method to determine δ15N-TDN. Though a small segment of CO2 contained in water sample may be decomposed to CO (12C18O) to interfere with 30N2 in the IRMS (Russow et al., 2002), acidification of the sample could eliminate the potential interference as CO2 is removed under acidic conditions.
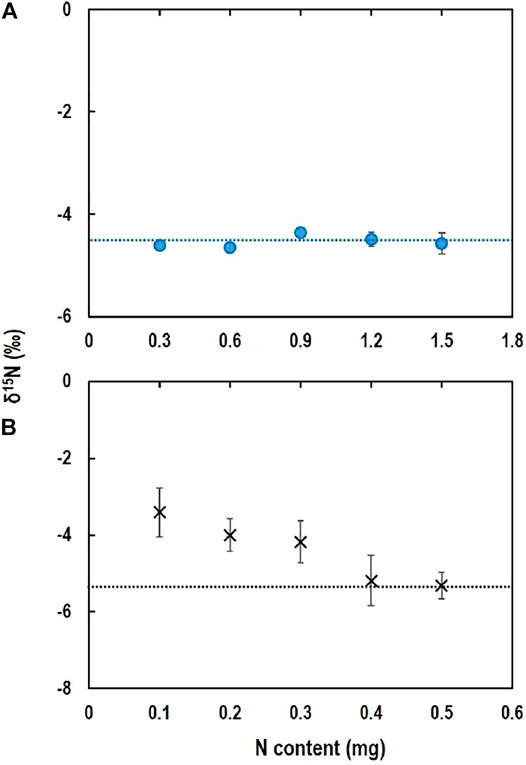
FIGURE 4. δ15N-TDN (A) and δ15N-DON (B) measured with direct evaporation and determined using isotope mass balance equation, respectively. Horizontal broken-lines are the reference δ15N value of TDN (A) and theoretically calculated δ15N of DON (B). Vertical bars are standard deviation of the means (n = 4).
δ15N-DON calculated using the isotope mass balance equation showed a high variability with errors of 1.2–2.0‰ when DON content was 0.1–0.3 mg N, suggesting that the accuracy of δ15N-DON is dependent on the DON content (Figure 4B). Cao et al. (2021) reported that accuracy of indirect determination of δ15N-DON by measuring δ15N-TDN through alkaline-persulfate digestion method depended on DON content as analytical errors for determination of δ15N-DON were as high as 0.7–1.4‰ for samples with a low DON content (<0.2 mg N). It is also obvious that δ15N-DON is dependent on δ15N of other N species used in the isotope mass balance equation (Cao et al., 2021). In the present study, among N species, the variability of δ15N-NH4+ was highest for the samples containing 0.1–0.3 mg N (Figure 3A). Therefore, the accuracy of determination of δ15N-DON with the isotope mass balance equation using δ15N-NH4+ and δ15N-NO3- (distillation) and δ15N-TDN (direct evaporation) is dependent on NH4+ content. Therefore, indirect determination of δ15N-DON might be feasible for water samples with a high NH4+ concentration.
Suggestions of the Procedure for Determination of δ15N of NH4+, NO3−, Dissolved Organic N, and Total Dissolved N of Rainwater Samples
Based on the results of this study, a procedure was suggested for determination of δ15N of multiple N species including NH4+, NO3−, DON, and TDN of rainwater samples using distillation for NH4+ and NO3−, direct evaporation for TDN, and indirect calculation using isotope mass balance equation for DON (Figure 5). Prior to δ15N measurement, it is necessary to determine N concentration of each N species to determine the sample volume to be used for distillation, particularly for NH4+. The N concentrations of samples could be determined with the non-distillation method more accurately with colorimetry (Mulvaney, 1996) and ion chromatography (Mou et al., 1993). Though the concentrations of NH4+ and NO3− could be determined through distillation and acid-base titration, it is known that the precision and accuracy of distillation for the determination of NH4+ and NO3− are not reliable particularly when H2SO4 is used as an absorbent of NH3 instead of boric acid (APHA-AWWA-WEF, 1998). The concentrations of NH4+ and NO3− can be easily determined accurately with colorimetry (Mulvaney, 1996) and ion chromatography (Mou et al., 1993). The concentration of TDN can be easily determined using TN auto-analyzer or alkaline-persulfate oxidation followed by manual or automated determination of NO3− (Ebina et al., 1983). The concentrations of DON can be calculated as difference between TDN and inorganic N (NH4+ + NO3−).
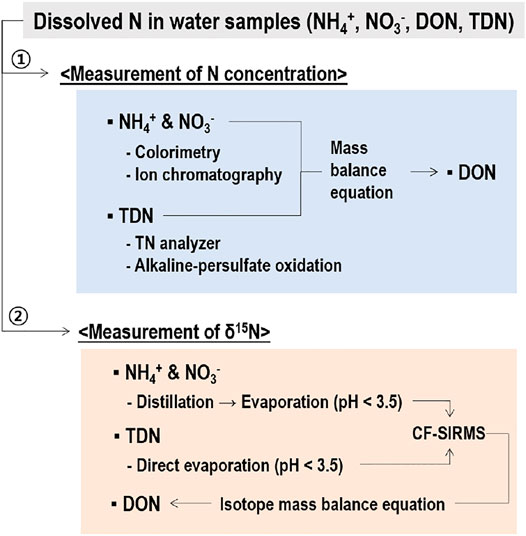
FIGURE 5. A scheme of simultaneous determination of δ15N of NH4+, NO3‒, DON, and TDN using distillation and evaporation. Determination of N concentration prior to δ15N measurement is recommended to decide sample volume for distillation.
The δ15N-NH4+ and δ15N-NO3- could be determined through distillation and evaporation following the procedure described above. For δ15N-NH4+, it is important to make sure that NH4+ content of the samples subject to distillation should be at least 0.4 mg N. However, a minimum requirement of NH4+ for reliable measurement of δ15N may differ with laboratory conditions, and thus it is necessary to determine the minimum NH4+ requirement using a standard NH4+ chemical for each laboratory following the procedure used in the present study. For samples containing a low NH4+ concentration, a larger volume of samples needs to be used for distillation. As the concentrations of NH4+ in rainwater are highly variable depending on the sites and seasons, ranging from <0.1 to >1.0 mg N L−1 (Lee et al., 2012; Zeng et al., 2020; Chen et al., 2022), however, water samples with an extremely low NH4+ may be concentrated to reduce the volume of water sample being added to distillation flasks, which have a confined volume capacity (e.g., 500 ml in the present study). Water samples containing a low N are often concentrated using a freeze-drier (Chen et al., 2022). In this context, our results further suggest that acidification of water samples is essential to prevent 14NH3 loss even under freeze-drying. The δ15N-TDN can be directly determined using salts obtained from evaporation of the acidified samples to dryness. Finally, δ15N-DON is determined with an isotope mass balance equation using N concentration and δ15N of N species.
When the methods were tested using the reference solutions, the measured δ15N was not statistically (p > 0.05) different from the values determined by the direct combustion method using the EA-IRMS (Table 2). However, the δ15N of NH4+ and NO3− were slightly lower than the reference δ15N, while the δ15N of DON was higher than the reference δ15N, probably due to the potential influence of hydrolysable DON (i.e., CO(NH4)2 in the present study) on the δ15N of NH4+ and NO3−. In the present study, pH was raised by using MgO rather than NaOH to minimize the interference of N liberated from DON under alkaline conditions (Mulvaney, 1996; Sakata, 2001). However, such variations in the δ15N of NH4+ and NO3− suggest that CO(NH2)2 used as a DON reference might be partially subject to hydrolysis during distillation. As such interference of DON was not detected in the early experiment, it was suspected that alteration of the δ15N of NH4+ and NO3− by hydrolyzable DON is not systematic but random. In the natural water environment, however, DON compounds present as more complex and recalcitrant compounds associated with lipids, proteins, amino sugars, lignins, and tannins (Lusk and Toor, 2016; Zhang et al., 2021), and thus the interference caused by DON during distillation of natural water samples might be less significant than the experimental conditions in the present study.
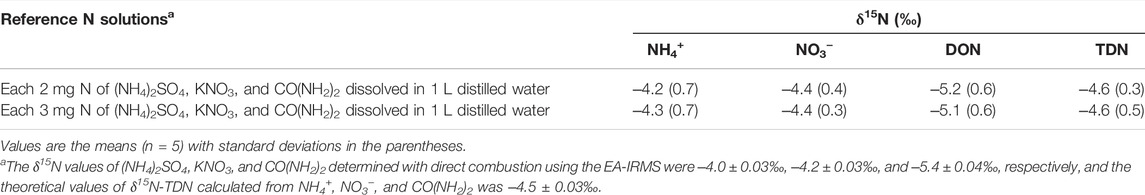
TABLE 2. Results of the analyses of δ15N of reference N solution containing NH4+, NO3−, DON, and TDN using the proposed methods.
Conclusion
In this study, we proposed a protocol for sequential determination of δ15N of NH4+, NO3−, DON, and TDN through the distillation and direct evaporation of rainwater samples. To obtain salt samples for EA-IRMS after distillation, it was found that acidification to pH < 3.5 is essential regardless of evaporation methods including freeze-drying, but evaporation using an oven at 100°C should be avoided. The δ15N-NO3- analyzed with the distillation method was reliable regardless of N content. However, there was uncertainty for δ15N-NH4+ that was affected by sample N content, background contamination, and potential interference by co-existing DON. Despite those, the distillation of >0.4 mg N of NH4+ produced stable and reliable δ15N. For δ15N-TDN, direct evaporation to dryness was proven to be a reliable method. Therefore, the analytical reliability of the determination of δ15N-DON using the isotope mass balance equation largely depends on the accurate measurement of δ15N-NH4+ that was directly affected by the content of NH4+-N in the present study. Therefore, for samples containing a low NH4+ concentration, either increasing sample volume for distillation or using an alternative method such as diffusion is recommended for analysis of δ15N-NH4+. Though the time and cost-effectiveness of the proposed methods were not analyzed in the present study, the proposed protocol can be considered in the laboratories equipped with distillation apparatus for the determination of N of soil, water, and plant samples to save cost of installing additional experimental apparatus for the analysis of the δ15N of multiple N species.
Data Availability Statement
The original contributions presented in the study are included in the article/Supplementary Material, further inquiries can be directed to the corresponding authors.
Author Contributions
Y-JJ, Investigation, Writing-drafts; B-SS, Investigation; NB, Investigation; J-HK, Writing-editing; S-ML, Investigation and Writing-editing; H-JP, Conceptualization and Writing-editing; W-JC, Conceptualization and Writing-editing.
Funding
This work was carried out with the support of the “Cooperative Research Program for Agriculture Science and Technology Development (Project No. PJ015010022020)”, Rural Development Administration, South Korea. Y-JJ received scholarships from the BK21 project (Education and Research Unit for Climate-Smart Reclaimed-Tideland Agriculture) of the Ministry of Education, South Korea.
Conflict of Interest
The authors declare that the research was conducted in the absence of any commercial or financial relationships that could be construed as a potential conflict of interest.
Publisher’s Note
All claims expressed in this article are solely those of the authors and do not necessarily represent those of their affiliated organizations, or those of the publisher, the editors and the reviewers. Any product that may be evaluated in this article, or claim that may be made by its manufacturer, is not guaranteed or endorsed by the publisher.
References
Ackerman, D., Millet, D. B., and Chen, X. (2019). Global Estimates of Inorganic Nitrogen Deposition across Four Decades. Glob. Biogeochem. Cycles 33, 100–107. doi:10.1029/2018GB005990
APHA-AWWA-WEF (1998). Standard Methods for the Examination of Water and Wastewater. 20th ed. Maryland: United Book Press Inc.
Bobbink, R., Hicks, K., Galloway, J., Spranger, T., Alkemade, R., Ashmore, M., et al. (2010). Global Assessment of Nitrogen Deposition Effects on Terrestrial Plant Diversity: a Synthesis. Ecol. Appl. 20, 30–59. doi:10.1890/08-1140.1
Böhlke, J. K., Smith, R. L., and Hannon, J. E. (2007). Isotopic Analysis of N and O in Nitrite and Nitrate by Sequential Selective Bacterial Reduction to N2O. Anal. Chem. 79, 5888–5895. doi:10.1021/ac070176k
Bronk, D., and Glibert, P. (1991). A 15N Tracer Method for the Measurement of Dissolved Organic Nitrogen Release by Phytoplankton. Mar. Ecol. Prog. Ser. 77, 171–182. doi:10.3354/meps077171
Buresh, R., Austin, E., and Craswell, E. (1982). Analytical Methods in15N Research. Fertilizer Res. 3, 37–62. doi:10.1007/BF01063408
Cao, H. T. T., Nakamura, T., Toyama, T., and Nishida, K. (2021). A Protocol for Nitrogen Isotopic Measurement of Dissolved Organic Nitrogen with a Combination of Oxidation-Denitrification and Gas Phase Diffusion Methods. Isotopes Environ. Health Stud. 57 (6), 576–584. doi:10.1080/10256016.2021.1948411
Cao, T. T. H., Nakamura, T., Saiki, M., Ta, T. T., Toyama, T., and Nishida, K. (2018). Effect of Dissolved Organic Nitrogen Contamination on δ15 N-NH4 Determination in Water Samples by Modification of the Diffusion Method with Gas-phase Trapping. Rapid Commun. Mass. Spectrom. 32 (8), 635–638. doi:10.1002/rcm.8091
Cejudo, E., and Schiff, S. L. (2018). Nitrogen Isotope Fractionation Factors (α) Measured and Estimated from the Volatilisation of Ammonia from Water at pH 9.2 and pH 8.5. Isotopes Environ. Health Stud. 54 (6), 642–655. doi:10.1080/10256016.2018.1526792
Chen, R. R., and Dittert, K. (2008). Diffusion Technique for15N and Inorganic N Analysis of Low-N Aqueous Solutions and Kjeldahl Digests. Rapid Commun. Mass. Spectrom. 22 (11), 1727–1734. doi:10.1002/rcm.3525
Chen, Z., Huang, X., Huang, C., Yang, Y., Yang, H., Zhang, J., et al. (2022). High Atmospheric Wet Nitrogen Deposition and Major Sources in Two Cities of Yangtze River Delta: Combustion-Related NH3 and Non-fossil Fuel NOx. Sci. Total Environ. 806, 150502. doi:10.1016/j.scitotenv.2021.150502
Cornell, S. E., Jickells, T. D., Cape, J. N., Rowland, A. P., and Duce, R. A. (2003). Organic Nitrogen Deposition on Land and Coastal Environments: a Review of Methods and Data. Atmos. Environ. 37, 2173–2191. doi:10.1016/S1352-2310(03)00133-X
Ebina, J., Tsutsui, T., and Shirai, T. (1983). Simultaneous Determination of Total Nitrogen and Total Phosphorus in Water Using Peroxodisulfate Oxidation. Water Res. 17 (12), 1721–1726. doi:10.1016/0043-1354(83)90192-6
Emerson, K., Russo, R. C., Lund, R. E., and Thurston, R. V. (1975). Aqueous Ammonia Equilibrium Calculations: Effect of pH and Temperature. J. Fish. Res. Bd. Can. 32, 2379–2383. doi:10.1139/f75-274
Feast, N. A., and Dennis, P. (1996). A Comparison of Methods for Nitrogen Isotope Analysis of Groundwater. Chem. Geol. 129 (1-2), 167–171. doi:10.1016/0009-2541(95)00186-7
Felix, J. D., Elliott, E. M., and Gay, D. A. (2017). Spatial and Temporal Patterns of Nitrogen Isotopic Composition of Ammonia at U.S. Ammonia Monitoring Network Sites. Atmos. Environ. 150, 434–442. doi:10.1016/j.atmosenv.2016.11.039
Feuerstein, T. P., Ostrom, P. H., and Ostrom, N. E. (1997). Isotopic Biogeochemistry of Dissolved Organic Nitrogen: A New Technique and Application. Org. Geochem. 27 (7-8), 363–370. doi:10.1016/S0146-6380(97)00071-5
Fowler, Z. K., Adams, M. B., and Peterjohn, W. T. (2015). Will More Nitrogen Enhance Carbon Storage in Young forest Stands in central Appalachia? For. Ecol. Manag. 337, 144–152. doi:10.1016/j.foreco.2014.10.023
Hales, J. M., and Drewes, D. R. (1979). Solubility of Ammonia in Water at Low Concentrations. Atmos. Environ. 13 (8), 1133–1147. doi:10.1016/0004-6981(79)90037-4
Hauck, R. D. (1982). “Nitrogen-Isotope-Ratio Analysis,” in Methods of Soil Analysis. Part 2: Chemical and Microbiological Properties. Editor A. L. Page (Madison, WI: SSSA and ASA), 735–779. doi:10.2134/agronmonogr9.2.2ed.c36
Jensen, E. S. (1991). Evaluation of Automated Analysis of 15N and Total N in Plant Material and Soil. Plant Soil 133, 83–92. doi:10.1007/BF00011902
Karamanos, R. E., and Rennie, D. A. (1981). The Isotope Composition of Residual Fertilizer Nitrogen in Soil Columns. Soil Sci. Soc. America J. 45, 316–321. doi:10.2136/sssaj1981.03615995004500020018x
Lachouani, P., Frank, A. H., and Wanek, W. (2010). A Suite of Sensitive Chemical Methods to Determine the δ15N of Ammonium, Nitrate and Total Dissolved N in Soil Extracts. Rapid Commun. Mass. Spectrom. 24 (24), 3615–3623. doi:10.1002/rcm.4798
Lee, K.-S., Lee, D.-S., Lim, S.-S., Kwak, J.-H., Jeon, B.-J., Lee, S.-I., et al. (2012). Nitrogen Isotope Ratios of Dissolved Organic Nitrogen in Wet Precipitation in a metropolis Surrounded by Agricultural Areas in Southern Korea. Agric. Ecosyst. Environ. 159, 161–169. doi:10.1016/j.agee.2012.07.010
Li, Y., Schichtel, B. A., Walker, J. T., Schwede, D. B., Chen, X., Lehmann, C. M. B., et al. (2016). Increasing Importance of Deposition of Reduced Nitrogen in the United States. Proc. Natl. Acad. Sci. U.S.A. 113, 5874–5879. doi:10.1073/pnas.1525736113
Liu, D., Fang, Y., Tu, Y., and Pan, Y. (2014). Chemical Method for Nitrogen Isotopic Analysis of Ammonium at Natural Abundance. Anal. Chem. 86, 3787–3792. doi:10.1021/ac403756u
Liu, X.-Y., Xiao, H.-W., Xiao, H.-Y., Song, W., Sun, X.-C., Zheng, X.-D., et al. (2017). Stable Isotope Analyses of Precipitation Nitrogen Sources in Guiyang, Southwestern China. Environ. Pollut. 230, 486–494. doi:10.1016/j.envpol.2017.06.010
Lusk, M. G., and Toor, G. S. (2016). Biodegradability and Molecular Composition of Dissolved Organic Nitrogen in Urban Stormwater Runoff and Outflow Water from a Stormwater Retention Pond. Environ. Sci. Technol. 50, 3391–3398. doi:10.1021/acs.est.5b05714
Mariotti, A., Germon, J. C., Hubert, P., Kaiser, P., Letolle, R., Tardieux, A., et al. (1981). Experimental Determination of Nitrogen Kinetic Isotope Fractionation: Some Principles; Illustration for the Denitrification and Nitrification Processes. Plant Soil 62, 413–430. doi:10.1007/BF02374138
McIlvin, M. R., and Altabet, M. A. (2005). Chemical Conversion of Nitrate and Nitrite to Nitrous Oxide for Nitrogen and Oxygen Isotopic Analysis in Freshwater and Seawater. Anal. Chem. 77, 5589–5595. doi:10.1021/ac050528s
Mou, S., Wang, H., and Sun, Q. (1993). Simultaneous Determination of the Three Main Inorganic Forms of Nitrogen by Ion Chromatography. J. Chromatogr. A. 640 (1-2), 161–165. doi:10.1016/0021-9673(93)80178-B
Mulvaney, R. L. (1996). “Methods of Soil Analysis,” in Methods of Soil Analysis. Part 3: Chemical Methods. Editors D. L. Sparks, A. L. Page, P. A. Helmke, R. H. Loeppert, P. N. Soltanpour, M. A. Tabatabaiet al. (Madison, WI: SSSA and CSA), 1123–1184. doi:10.2136/sssabookser5.3
Nanus, L., Campbell, D. H., Lehmann, C. M. B., and Mast, M. A. (2018). Spatial and Temporal Variation in Sources of Atmospheric Nitrogen Deposition in the Rocky Mountains Using Nitrogen Isotopes. Atmos. Environ. 176, 110–119. doi:10.1016/j.atmosenv.2017.12.023
Nikolenko, O., Jurado, A., Borges, A. V., Knӧller, K., and Brouyére, S. (2018). Isotopic Composition of Nitrogen Species in Groundwater under Agricultural Areas: A Review. Sci. Total Environ. 621, 1415–1432. doi:10.1016/j.scitotenv.2017.10.086
Ohte, N. (2012). Tracing Sources and Pathways of Dissolved Nitrate in forest and River Ecosystems Using High-Resolution Isotopic Techniques: a Review. Ecol. Res. 28, 749–757. doi:10.1007/s11284-012-0939-3
Phoenix, G. K., Emmett, B. A., Britton, A. J., Caporn, S. J. M., Dise, N. B., Helliwell, R., et al. (2012). Impacts of Atmospheric Nitrogen Deposition: Responses of Multiple Plant and Soil Parameters across Contrasting Ecosystems in Long-Term Field Experiments. Glob. Change Biol. 18, 1197–1215. doi:10.1111/j.1365-2486.2011.02590.x
Russow, R., Kupka, H.-J., Götz, A., and Apelt, B. (2002). A New Approach to Determining the Content and15N Abundance of Total Dissolved Nitrogen in Aqueous Samples: TOC Analyser-QMS Coupling. Isotopes Environ. Health Stud. 38 (4), 215–225. doi:10.1080/10256010208033267
Sá, T. S. W., Najjar, M. K., Hammad, A. W. A., Vazquez, E., and Haddad, A. (2022). Assessing Rainwater Quality Treated via a green Roof System. Clean. Techn Environ. Pol. 24 (2), 645–660. doi:10.1007/s10098-021-02144-6
Sáez-Plaza, P., Navas, M. J., Wybraniec, S., Michałowski, T., and Asuero, A. G. (2013). An Overview of the Kjeldahl Method of Nitrogen Determination. Part II. Sample Preparation, Working Scale, Instrumental Finish, and Quality Control. Crit. Rev. Anal. Chem. 43 (4), 224–272. doi:10.1080/10408347.2012.751787
Sakata, M. (2001). A Simple and Rapid Method for .DELTA.15N Determination of Ammonium and Nitrate in Water Samples. Geochem. J. 35 (4), 271–275. doi:10.2343/geochemj.35.271
Sigman, D. M., Casciotti, K. L., Andreani, M., Barford, C., Galanter, M., and Böhlke, J. K. (2001). A Bacterial Method for the Nitrogen Isotopic Analysis of Nitrate in Seawater and Freshwater. Anal. Chem. 73, 4145–4153. doi:10.1021/ac010088e
Slawyk, G., and Raimbault, P. (1995). Simple Procedure for Simultaneous Recovery of Dissolved Inorganic and Organic Nitrogen in 15N-Tracer Experiments and Improving the Isotopic Mass Balance. Mar. Ecol. Prog. Ser. 124, 289–299. doi:10.3354/MEPS124289
Stark, J. M., and Hart, S. C. (1996). Diffusion Technique for Preparing Salt Solutions, Kjeldahl Digests, and Persulfate Digests for Nitrogen-15 Analysis. Soil Sci. Soc. America J. 60 (6), 1846–1855. doi:10.2136/sssaj1996.03615995006000060033x
Stock, P., Hösch, A., and Burghardt, D. (2019). δ 15 N Analysis of Ammonium in Freeze‐dried Natural Groundwater Samples by Precipitation with Sodium Tetraphenylborate. Rapid Commun. Mass. Spectrom. 33 (22), 1730–1738. doi:10.1002/rcm.8526
Zeng, J., Yue, F.-J., Li, S.-L., Wang, Z.-J., Qin, C.-Q., Wu, Q.-X., et al. (2020). Agriculture Driven Nitrogen Wet Deposition in a Karst Catchment in Southwest China. Agric. Ecosyst. Environ. 294, 106883. doi:10.1016/j.agee.2020.106883
Zhang, S., Fang, Y., and Xi, D. (2015). Adaptation of Micro-diffusion Method for the Analysis of15N Natural Abundance of Ammonium in Samples with Small Volume. Rapid Commun. Mass. Spectrom. 29 (14), 1297–1306. doi:10.1002/rcm.7224
Keywords: ammonium, dissolved organic nitrogen, nitrate, nitrogen isotope fractionation, stable nitrogen isotope
Citation: Jeong Y-J, Seo B-S, Baek N, Kwak J-H, Lee S-M, Park H-J and Choi W-J (2022) Methods for the Determination of Stable Isotope Ratios of Multiple Nitrogen Species in Rainwater Using Distillation and Evaporation. Front. Environ. Sci. 10:877055. doi: 10.3389/fenvs.2022.877055
Received: 16 February 2022; Accepted: 01 April 2022;
Published: 17 May 2022.
Edited by:
Junwen Liu, Jinan University, ChinaReviewed by:
Shaoneng He, Earth Observatory of Singapore, SingaporeKei Nishida, University of Yamanashi, Japan
Copyright © 2022 Jeong, Seo, Baek, Kwak, Lee, Park and Choi. This is an open-access article distributed under the terms of the Creative Commons Attribution License (CC BY). The use, distribution or reproduction in other forums is permitted, provided the original author(s) and the copyright owner(s) are credited and that the original publication in this journal is cited, in accordance with accepted academic practice. No use, distribution or reproduction is permitted which does not comply with these terms.
*Correspondence: Hyun-Jin Park, aHBhcmtAdWFsYmVydGEuY2E=; Woo-Jung Choi, d2pjaG9pQGpudS5hYy5rcg==