 Zhaosu Meng
 Huike Sun1
- 1School of Economics, Ocean University of China, Qingdao, China
- 2Institute of Marine Development of Ocean University of China, Qingdao, China
Forecasting energy demand in emerging nations is a critical policy tool utilized by decision makers worldwide. However, as estimated economic and demographic characteristics frequently diverge from realizations, precise forecast results are difficult to get due to the economic system’s intrinsic complexity. This work proposed a machine learning model for estimating energy consumption in China using the support vector regression model (SVR). Additionally, Markov Chain (MC) is employed to forecast and analyze the evolving energy consumption structure. The results demonstrate that SVR model is more accurate (98.4%) than the linear model (Moving Average model), the nonlinear model (Grey model), and past research in predicting energy usage. Under the current rate of energy consumption, China’s total energy consumption will break through six billion in the next 4 years. Furthermore, it is expected that China’s energy consumption structure will be more rational in 2025, with increased non-fossil energy consumption and decreased coal consumption, while natural gas consumption continues to grow at a low rate. It provides scientific basis for the implementation of carbon emission peak action, energy security and energy development plan during the 14th Five-Year Plan period.
1 Introduction
One of the most essential policy instruments utilized by decision makers worldwide is energy consumption predictions. This is especially true in rising energy markets like China. According to the National Bureau of Statistics, in 2021, China’s gross domestic product (GDP) was RMB 114.4 trillion ($17.7 trillion), up around RMB 13 trillion (United States $3 trillion) from 20201. With an economy anticipated to develop at a rate of 6–8% for decades, China’s influence in the global energy market is growing.
Between 1990 and 2020, China’s overall energy output and consumption increased steadily (Figure 1). Energy production has gradually increased from about 1.26 billion tons of ordinary coal to 4.08 billion tons, but it is still unable to satisfy energy demand, and the gap between the two is widening. China’s total energy imports in 2020 is 1.20 billion tons, and this figure will rise further.1 As the biggest energy consumer of the world, China’s underlying demand and supply imbalances will have a significant impact on global energy markets. Long-term estimates are also required to determine the extent to which future trade and investment plans are required to secure China’s energy security. Furthermore, in the General Debate of the 75th Session of the United Nations General Assembly in 2020, China has pledged to peaking carbon emissions by 2030 and reaching carbon neutrality by 2060, while also aiming to double the size of the Chinese economy by 2035. As a result, forecasting energy use in China is crucial.
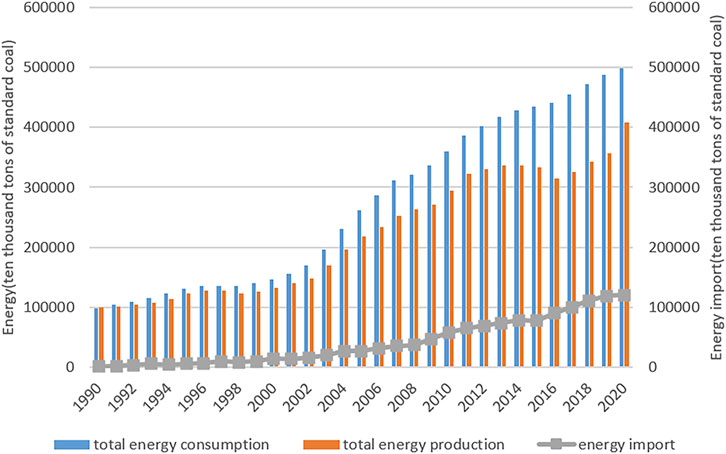
FIGURE 1. Total energy consumption and production in China from 1999 to 2020. Data source: China Statistical Yearbook 2021.
China’s energy use is imbalanced (Figure 2). This is shown by coal’s considerable domestic market share in China, despite its waning dominance in recent years (dropped to 56.8% in 2020)1. Natural gas is also insignificant. As a result of this predicament, the economic cost of environmental damage associated with excessive coal consumption has been substantial. As a result, the energy industry and policymakers are under intense pressure to modify the structure of energy use and shift away from coal and toward cleaner options such as natural gas and hydropower.
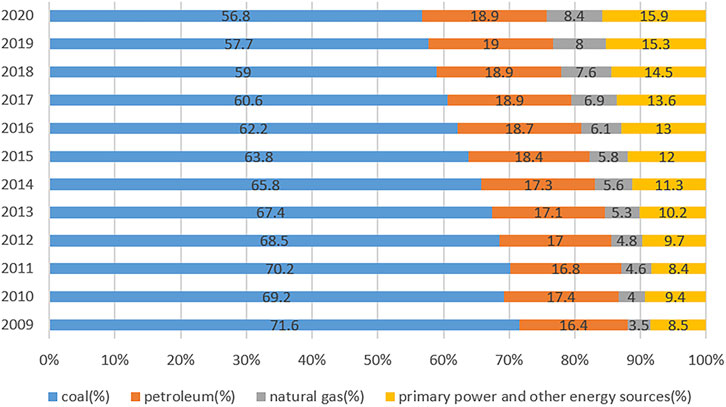
FIGURE 2. Proportion of energy consumption in China from 2009 to 2020. Data source: China Statistical Yearbook 2021.
As illustrated in Figure 3, in 2019, the total urban consumption was 26,665 ten thousand tons of standard coal, 3.89 times that of 1997 (6,845.89 ten thousand tons of standard coal)2. The total energy consumption of rural residents is also growing rapidly, but not as fast as it is in the urban area. Since 2000, the gap between urban and rural enlarged. Therefore, with rapid urbanization, the energy consumption in China shows new characteristics. Demand for coal, oil, natural gas, and other fossil fuels is expanding at a rapid pace, while consumption of coal is declining. However, the energy gap continues to widen.
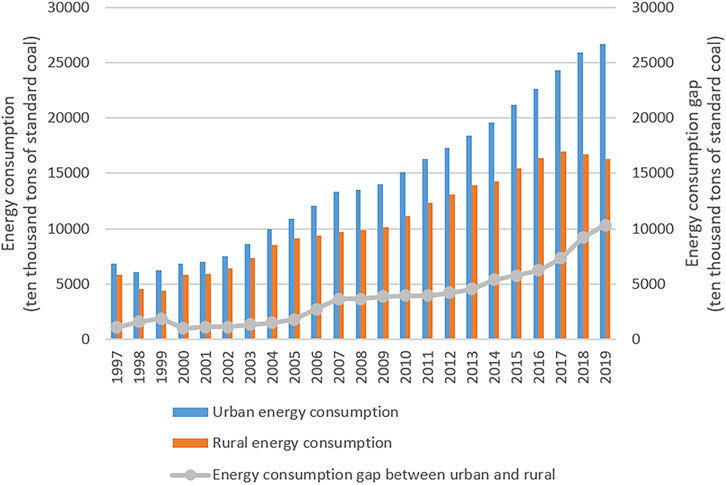
FIGURE 3. Changes in household energy consumption from 1997 to 2019. Data source: China Energy Statistical Yearbook.
While China’s energy conservation and emission reduction policies have had some initial success, the future situation remains unpredictable. Conducting a thorough examination of future energy forecasts will not only aid in comprehending the future energy situation, but also in providing scientific support for overall energy planning and policy creation. To meet rising consumer demand and achieve green and sustainable growth, energy consumption structure should be optimized, with less coal consumption, and more clean energy. And better data interpretation and forecasting techniques are required.
Due to their applicability, machine learning models are being utilized in a wide number of sectors, and their operation is similar to that of a function that best maps input data to output. Using machine learning methods, energy consumption forecasts can be created with high accuracy. As a result, governments can use them to undertake energy-saving efforts. They can be used to forecast future energy usage, such as electricity or natural gas.
The goal of this research is to develop a unique forecasting system that utilizes nonlinear machine learning models to optimize linear time series in order to discover energy consumption patterns. Then, we assess the model prediction findings in conjunction with the actual scenario and offer countermeasures and suggestions in order to fulfill the goal of providing a foundation for policymakers to create policies more effectively. Numerous optimization techniques, including the SVR model, the linear model MA (3), and the nonlinear model GM (1, 1) are examined and compared for usage in the proposed forecasting system. By anticipating primary energy consumption and its structure, it will assist in the process of energy decarbonization, minimize the effects of climate change, and rein in China’s future climate initiative. It is beneficial for policymakers to increase energy efficiency through energy policies and other measures, while reducing greenhouse gas emissions enables the energy structure to be adjusted to achieve co-benefits such as the efficient development of a green and low-carbon economy and climate change adaptation.
The remainder of this study is structured in the following manner. The second section covers the preceding research literature in two areas: variables influencing energy use and energy prediction models. The third section describes the influencing factors on energy consumption that were chosen for this study, as well as the methods, models, variables, and data sources employed in this study. The fourth section assesses SVR model’s validity and prediction accuracy before estimating China’s energy consumption for the time covered by the 14th Five-Year Plan. Then, we use Markov Chain to predict the change of energy structure during the 14th Five-Year Plan period. The fifth section discusses the findings of the investigation, as well as the accompanying countermeasures and recommendations.
2 Literature Review
Studying the relationship between numerous drivers and energy consumption is not only required for model predictions, but it also helps readers understand the mechanisms by which these factors affect energy consumption. Some scholars believe that economic development has a substantial impact on energy consumption intensity (Asafu-Adjaye, 2000; Stern, 2000; Soytas and Sari, 2003; Ang, 2004; Aboagye, 2017; Marques et al., 2019). According to Birol and Keppler (2000), technological advancements will not only reduce energy consumption intensity, but will also boost energy consumption per unit of GDP. Other researchers believe that improved technology can promote a decline in energy intensity (Li and Lin, 2014; Huang et al., 2017). Hunt and Ninomiya (2005) discovered a negative relationship between energy prices and demand. According to Inglesi (2010), there is a long-term link between energy usage, prices, and economic growth. He et al. (2011) believed that the secondary industry was not conducive to improving energy efficiency, while the development of the tertiary industry could effectively encourage the decline of energy consumption intensity. Achour and Belloumi (2016) believe that in addition to economic growth and energy prices, population size also has a positive impact on energy consumption. Some scholars studied from the perspective of industrial structure. Lin and Zhu (2017) conducted additional research and found that industrial structure upgrading is adversely connected with energy consumption intensity. Later, from a micro perspective, some scholars believe that household variables such as family size and education level of family members have a significant impact on energy use (Zou and Luo, 2019).
Machine Learning (ML) is the basic approach to achieve artificial intelligence. In recent years, more scholars have paid attention to ML with its advantages of recognizing trends and patterns from data, not requiring human intervention, constantly optimizing cognition according to data changes, and processing various high-dimensional data. Hao et al. (2021) developed an economic loss analysis system to quantitatively evaluate the losses caused by haze pollution on tourism. Yang et al. (2022) developed an improved electricity price prediction model, which has the advantages of adaptive data preprocessing, etc.
Machine Learning has experienced a transition from shallow learning to deep learning. Rumelhart et al. (1986) proposed the idea of learning representation based on error back propagation, which enabled artificial neural network (ANN) to be trained. Subsequently, Support Vector Machine (SVM), Decision tree (DT) and other models that are easier to obtain global optimal solutions have been widely concerned and applied. With the progress of the data accumulation, the computing power and the improvement to the algorithm, deep and complex training to become possible. At present, both shallow learning model and deep learning model are widely used in various fields. To predict specific problems, it is necessary to select appropriate machine learning algorithms from the perspectives of data category, sample size and model characteristics.
Numerous methods for forecasting energy consumption have been proposed in the literature, such as the energy demand model (EDM), the Autoregressive Integrated Moving Average Model (ARIMA), the particle swarm optimization technique (PSO), the artificial neural network model (ANN), and the grey model (GM). Gori and Takanen (2004) used the modified EDM model to predict the energy consumption of Italian industry, household and service. Ediger and Akar (2007) used the ARIMA and seasonal ARIMA methods to anticipate Turkey’s energy demand from 2005 through 2020. Some scholars forecasted Turkey’s energy consumption using PSO methodologies (Uenler, 2008; Kran et al., 2012; Yakut and Özkan, 2020). Zong and Roper (2009) suggested an ANN model for estimating Korea’s energy demand. Meng et al. (2020) estimate China’s energy intensity using an upgraded DVCGM (1, N) model, and found that the improved DVCGM (1, N) model could reflect the lag effect of government policies. Zhu et al. (2020) developed an adaptive gray-scale weighted model to forecast Jiangsu’s electricity usage. Chen et al. (2021) predicted energy consumption in the Beijing-Tianjin-Hebei region using the FGM (1, 1) model. At the same time, some scholars predict the structure of energy consumption. Xie et al. (2015) forecasted total energy production and consumption using an improved univariate discrete grey forecasting model and suggested a new Markov technique based on a quadratic programming model to predict the structure of energy production and consumption. Ren et al. (2017) used Markov model to predict the energy consumption structure of Beijing.
The benefits and drawbacks of the most commonly used energy forecast methods of the literature is outlined in Table 1. The energy consumption system is a nonlinear system with many influencing factors. Because most traditional prediction approaches lack a learning mechanism, it is difficult to describe the nonlinear relationship in the energy system, resulting in low forecast accuracy. Some new computer forecasting approaches are exceedingly complicated and subjective, jeopardizing the accuracy of energy consumption forecasting. Time series models are problematic due to a paucity of data on China’s energy consumption. PSO model is easy to fall into local optimal solution, so it is difficult to obtain global optimal solution. If an ANN model is used to forecast, the performance of the prediction will be inconsistent due to insufficient sample training and over-learning. The GM model’s prediction is based on exponential prediction. This approach works best with data that grows exponentially, which makes it unsuitable for calculating China’s energy consumption. Therefore, we propose a Support Vector Regression (SVR) model to anticipate China’s energy consumption during the 14th Five-Year Plan period, while the widely used Markov Chain (MC) is used to predict the energy structure.
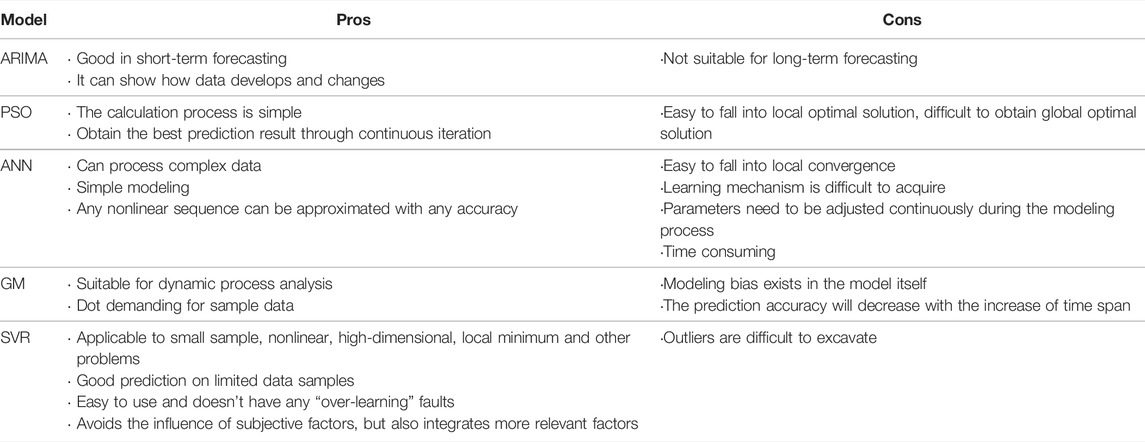
TABLE 1. Comparison of prediction methods.
3 Methodology
3.1 Model
3.1.1 Support Vector Regression
SVMs are supervised machine learning models used to tackle classification and regression problems. SVMs are composed of two components: a kernel and an optimizer method. The kernel converts non-linear data to a high-dimensional space and then linearly separates the data. Optimizer algorithm tackles the optimization problem, which is computationally costly. SVM usually outperforms other machine learning approaches in terms of generalization.
This section describes the data collection and the process of developing a prediction model using many variables. To begin, we identify the elements that influence energy use and preprocess the data. The SVR model is then used to create training and test sets randomly, and the accuracy is compared to that of the GM and MA models. Then, we make predictions using the SVR model. The framework for projecting energy use is displayed in Figure 4.
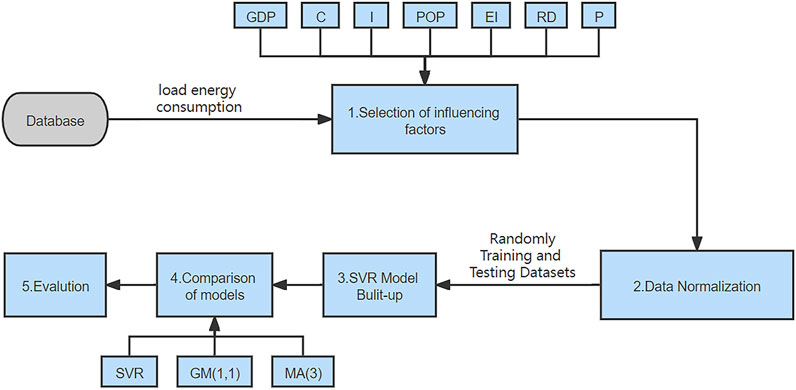
FIGURE 4. Framework of energy consumption forecasting.
Based on the basic idea of support vector machine (SVM) model prediction (Cortes and Vapnik, 1995), input various energy demand influencing factors x1, x2..., xd maps to a higher dimensional eigenspace [φ(x1), φ(x2) ..., φ(xn)]. According to statistical learning theory, the original nonlinear model can be transformed into a linear regression model of feature space, as shown in Eqn 1
Wherein,
Where, Remp(f) is empirical risk,
In order to facilitate the solution, Eqn 3 is often transformed into a duality problem, then the nonlinear function f(x) can be obtained.
Where, ai and ai* are support vector parameters, K (Xt, X) is the inner product. According to Mercer conditions, define kernel function and select radial basis kernel function (RBF)
Substituting Eqn 5 into Eqs 4, 6 can be obtained through equivalent transformation.
Where, aj is the parameter value corresponding to the support vector, xj is the input data vector of training year. xv is the input data vector for predicting years, f(x) is the set of output vectors. According to Eqn. 6, energy demand prediction parameters aj and b are obtained, and the energy demand prediction model is estimated.
3.1.2 Markov Chain
Because the direction in the energy consumption structure is policy-driven and the process is gradual, the Markov Chain hypothesis is used (Niu et al., 2004). That is, in the process of event change, the state at m is determined by the state at m-1, and is not correlated with the state at m-i (i ≥ 2). Conversely, to predict the state at m + i, it is necessary to calculate the state at m+1 from the state at m, repeat the process and get the result.
We propose a time set Xt with n states, at time m, Xm is set as a, Xm+1 is set as b. Then the conditional probability (
and the formula of the transition matrix p can be derived in Eqn (8).
After the transfer matrix p is obtained, the energy consumption structure at m is known as Per (m), then the energy consumption structure at m + i is calculated as follows:
in which, Perc(m), Pero(m), Perg(m), Pere(m) respectively represent the proportions of coal, crude oil, natural gas and clean energy (hydro power, wind power, etc.) in the total primary energy consumption.
Energy consumers and producers may change their option on energy consumption. For example, if some energy customers select natural gas over coal this year, the proportion of coal consumption will fall and the proportion of natural gas will rise. The energy structure change is the calculated transfer probability from coal to natural gas, and the probability of each energy structures transferring to each other constitutes the transition probability matrix. The retention probability pc→c(m) is calculated. The energy structure changes from m to m + 1, and the retention probability is the share at m + 1 divided by the share at m. The detailed calculation formula is shown in 10–12.
Probability of coal switching to oil (Eqn 10):
Probability of coal switching to natural gas (Eqn 11):
Probability of coal turning to water and wind power (Eqn 12):
Where, Peri(m) is the proportion of i energy in the total amount at moment m.
Suppose that the one-step transition probability matrix of China’s primary energy consumption structure from moment m to moment m + 1 is:
3.2 Influencing Factors Preparation
A country’s energy consumption (EC) is a nonlinear complicated system that is influenced by a large number of variables. GDP, energy price, secondary industry’s fraction of added value, energy consumption intensity, technical progress, resident consumption level, and population size are used as dependent variables on energy consumption (Chen and Zhu, 2013; Marques et al., 2019), which can be expressed as:
Where: EC denotes total energy consumption, GDP denotes gross domestic product, p is for energy price, I denotes the proportion of secondary industry, EI represents energy consumption intensity, RD is for technological progress, C represents household consumption level, and POP denotes total population size.
To avoid the impact of price considerations, we recalculate GDP at 1990 prices and determine energy consumption intensity per unit GDP. China’s GDP increased by 9% yearly from 1990 to 2020, rising from 1,887.3 billion yuan to 10,1598.6 billion yuan3. Economic growth results in increased energy consumption, which continues to rise year after year. As a result, economic development is the most important determinant of energy use consumption.
Population has a direct impact on energy consumption. By the end of 2019, China’s overall population exceeded 1.4 billion.3 Despite the fact that China’s annual net increase has decreased below 10 million, showing that the country’s population is stabilizing, China’s energy consumption is enormous. The natural population growth rate will remain at about 4‰, which will continue to drive high demand for energy.4 Additionally, there is a major discrepancy in the levels and ways of energy consumption between urban and rural inhabitants. With China’s urbanization process accelerating, the growth in urban population necessarily results in an increase in overall energy demand.
The secondary industry has always been the largest energy consumption industry in China. The primary industry consumes less energy and the tertiary industry has relatively high energy utilization efficiency. The increment of energy consumption brought by the vigorous development of the tertiary industry is not obvious. As the energy consumption of the secondary industry is much higher than that of the primary and tertiary industries, with the gradual adjustment of China’s industrial structure in the future, especially the adjustment of the proportion of the secondary industry, energy consumption will be affected.
It is shown that the output value of secondary industries has remained dominant during the last few decades (Figure 5). China is aggressively establishing a new green and low-carbon economy, promoting reduced energy consumption in industrial industries, owing to industrial restructuring and upgrading and the strict limits of the “carbon peak and carbon neutrality” targets. China’s economy will enter a new era during the 14th Five-Year Plan period. Under the “Belt and Road Initiative”, industrial transformation and upgrading, the proportion of primary industry will continue to shrink, as will the proportion of secondary industry, while the proportion of tertiary industry will continue to expand, and by 2050, will be the supporting industry of China’s national economic growth. Accordingly, the structure of energy consumption will change as well.

FIGURE 5. China’s industrial structure, 1990–2020. Data source: China Statistical Yearbook 2021.
China’s total energy processing and conversion efficiency is expected to reach 73.3% by 2019.5 We believe that the impact of technical innovation on energy consumption is mostly due to advancements in scientific and technological levels, notably the advancement of energy-saving technology, which increases the rate of energy conservation and decreases energy consumption. Furthermore, technical advancement allows for the new energy adaptation, resulting in a shift in energy consumption structure and, as a result, a shift in China’s energy consumption. Technological progress to promote energy efficiency, energy saving, and emissions reduction significantly promote the role, is the key to achieve energy conservation and emissions reduction. As a result, we choose independent research and development as a metric for China’s technical advancement.
Household consumption has changed dramatically as people’s living standards have improved. People seek enhanced consuming enjoyment, thereby increasing the demand for direct energy consumption, especially for high-quality energy such as electricity, gas fuel and new energy. Urbanization has enhanced people’s living standards. Compared with things in the 1990’s, in 2019, the rural consumption increased by 504%, while urban consumption increased by 793%. The rise in living standards has increased household energy consumption, from 139 kg standard coal in 1990 to 442 kg standard coal in 2019.5 The future will see increased per capita energy consumption due to improved quality of life, increased family automobile ownership, and increased usage of air conditioning and other household equipment.
Energy consumption intensity, or energy intensity for short is first proposed by Patterson et al. (1996). This macro index mainly measures the energy consumption per unit output value and can better reflect the energy utilization efficiency level of a country. Figure 6 illustrates China’s energy intensity from 1990–2000 at 1990 prices. Throughout the last 2 decades, there is a rising energy consumption accompanied by a remarkable drop in energy intensity of use. China’s energy intensity reduced from 5.3 tons of standard coal per 10,000 yuan to 1.88 tons, indicating that China’s energy efficiency is improving.5 By 2020, China’s energy intensity had decreased to half of its levels in 1990. The main causes have been recognized as technical and structural changes. The 14th Five-Year Plan calls for promote high-quality development, improve the implementation of the dual management of energy consumption intensity and total amount and organize the implementation of key energy saving and emission reduction projects, and promote energy efficiency.
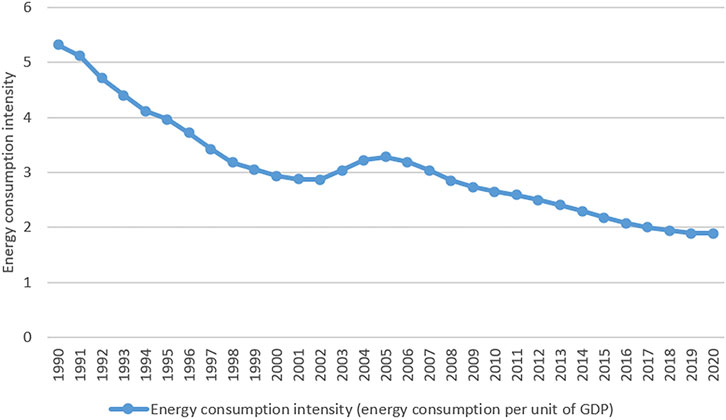
FIGURE 6. change of China’s energy consumption intensity from 1990 to 2020. Data source: China Statistical Yearbook 2021.
Price has a direct factor affecting consumption. We may deduce from supply and demand theory that high prices lead to lower demand and consumption, whereas low prices lead to increased consumption. Similarly, energy costs have an impact on energy use. Other variables, such as energy-saving and emission-reduction programs, automobile purchase limitation rules, and so on, will also affect energy consumption, but these aspects are difficult to measure or lack relevant statistical data, therefore they are not taken into account for the time being. After selecting the influencing factors, we preprocess the data for the SVR model prediction.
3.3 Data Preprocessing
All data in this paper are from China Statistical Yearbook, China Energy Statistical Yearbook and China Science and Technology Statistical Yearbook from 1990 to 2021. The influencing factors introduced above are taken as independent variables of energy consumption. Variable Settings and their meanings are shown in Table 2 below. The indicators of GDP, household consumption level and energy consumption intensity have been converted according to the constant prices in 1990, and energy price p is represented by fuel and power purchasing price index.
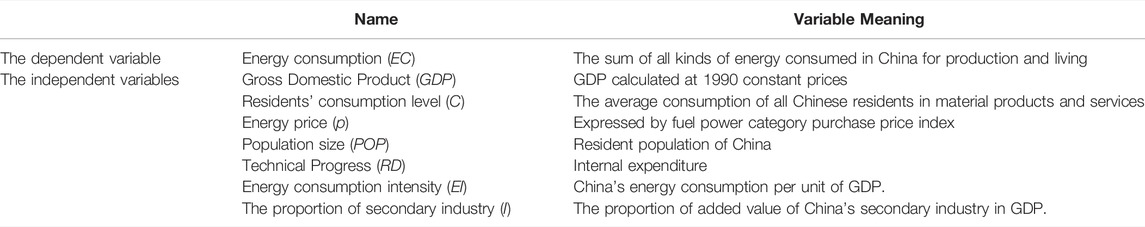
TABLE 2. Variables and their meanings.
Furthermore, the dimensions of the seven input and one output indices examined in this paper’s analysis of energy consumption are inconsistent, and the data varies substantially in magnitude, which might result in significant variations in prediction results. As a result, every index data must be normalized in advance, that is, all index data must be converted to between [0,1] using Eqn 15.
Next, we introduce the data set and how the prediction model is built with several variants and data exploratory analysis. We collect energy consumption data from statistical yearbooks from 1990 to 2020, randomly select 22 years of sample data as a training set and the remaining years data as a test set to evaluate the model’s prediction accuracy, and then forecast China’s energy consumption during the 14th Five-Year Plan period. This study examined the trend in China’s energy use and makes recommendations for China’s future energy development.
4 Empirical Analysis
4.1 Data Training and Accuracy Analysis of Prediction Model
The input to the SVMs model is set to China’s energy consumption influencing factors, while the output is set to energy consumption. Following normalization of the predicted and actual values of the linear fitting, the SVR model chose 22 years of historical data at random as the training sample for modeling and simulation, as shown in Figure 7 (a). This indicates a high accuracy of the model (R2 = 0.999). The model’s validity is validated using the same test set data; Figure 7 (b) shows a nine-year test set showing the connection between raw data and predicted data. As can be observed, the model projected values and the real value are reasonably comparable (R2 = 0.997), implying that it can be used to forecast China’s energy consumption.
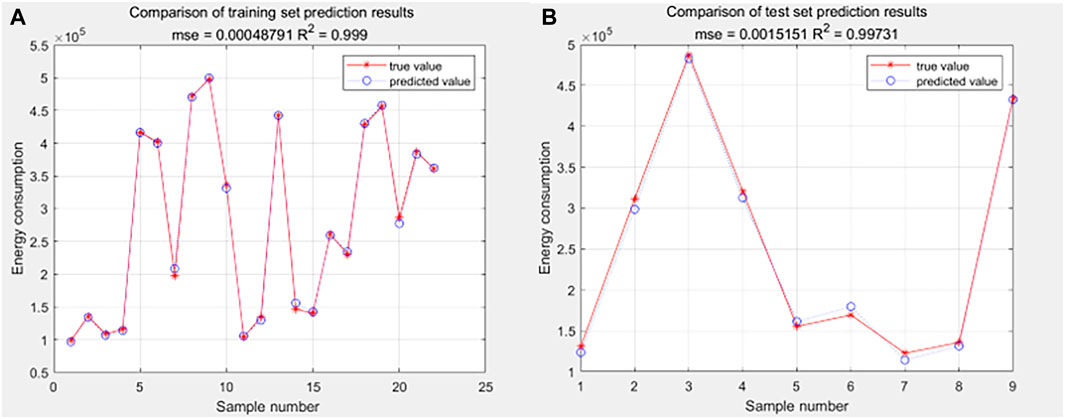
FIGURE 7. Real and predicted values of China’s energy consumption in the training (a) and testing set (b).
Then, we compare actual and predicted values from 2013 through 2020 (Table 3). The prediction results are pretty close to the actual energy consumption figure. The model’s validity is established, and it is demonstrated that the SVR model has an excellent forecasting effect on China’s energy consumption and a high degree of forecasting ability or generalization, making it suitable for predicting China’s future energy consumption changes.
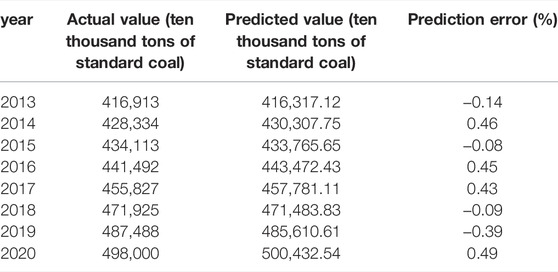
TABLE 3. Prediction results of China’s energy consumption based on SVR model.
Two competing models, namely GM (1, 1) and MA (3) are employed to test the accuracy of the SVR model on energy consumption forecasting. We chose these models for comparison because they are the most commonly used in energy prediction research, have a high level of representativeness, and can be applied to a wide range of situations. Consistent with the steps of the SVR model, the energy consumption data from 1990 to 2012 were used. Then, based on GM (1, 1) model and MA (3) model, the energy consumption of China from 2013 to 2020 is predicted.
Taking into account the predictions from the SVR, GM (1, 1), and MA (3) models, Table 4 and Figure 8 illustrate the accuracy of the fitting value in contrast to the original value. The results reveal that the GM (1, 1) model exhibits a substantial prediction error, the majority of which exceeds 5%. Additionally, while the MA (3) model outperforms the GM (1, 1) model in terms of prediction performance, its prediction accuracy is not as steady as the SVR model, and prediction results vary greatly. In general, the SVR model surpasses the other two commonly used forecasting models when it comes to projecting China’s energy consumption. As a result, the SVR model can be used to anticipate China’s future energy consumption throughout the period covered by the “14th Five-Year Plan”.
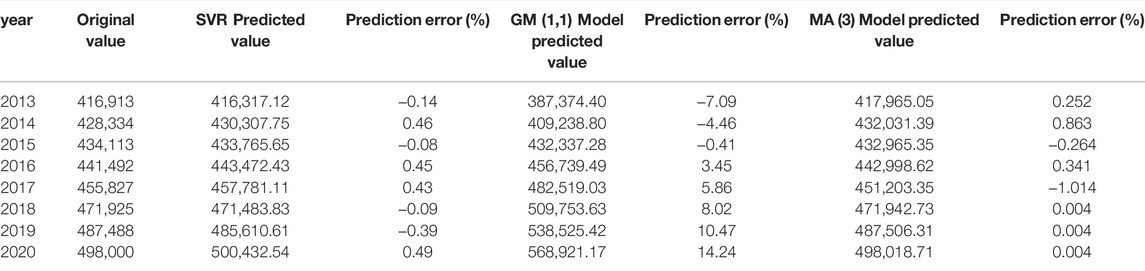
TABLE 4. Simulation of energy consumption in China by SVR, GM (1, 1) and MA (3) model (Unit: ten thousand tons of standard coal).
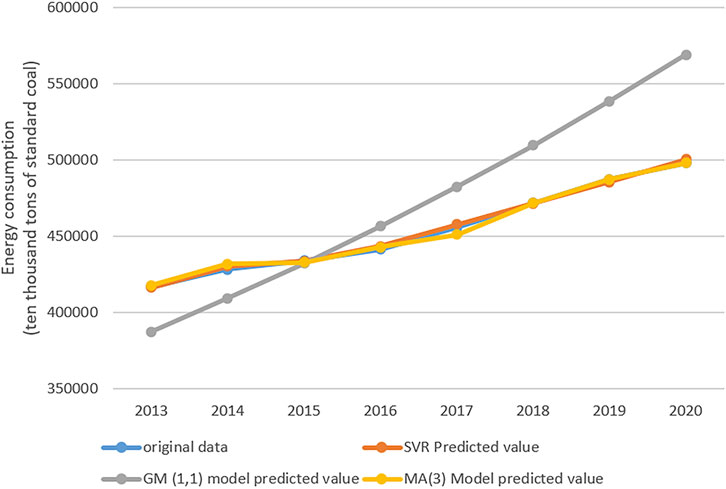
FIGURE 8. Estimated values of energy consumption.
4.2 Predicted Value of Influencing Factors
According to the Chinese government network, the National Bureau of Statistics, the energy bureau of the relevant data, 14th Five-Year energy development planning and the relevant data such as the government statistical bulletin, through the scenario analysis, this article selects the China 2021–2025, the total energy consumption of seven influencing factors of value analysis and estimate (Table 5). The following values of the influencing factors setting are mainly based on the “Outline of the 14th Five-Year Plan (2021–2025) for National Economic and Social Development and Vision 2035”.6
(1) GDP: GDP increased by 6% year on year in 2019 in terms of comparable prices. The GDP for 2019 is 25,783.73 trillion yuan based on 1990 prices. According to the outline of the 14th Five-Year Plan, new economic development progress has been made, growth potential has been fully realized, and average annual GDP growth has been kept within a reasonable range. China’s GDP is expected to grow at an annual rate of around 7% during the 14th Five-Year Plan period. The national economy is predicted to sustain a modest growth range of 6–8% over the 14th Five-Year Plan period, thanks to the expansion of the national economy and the expansion of the macroeconomic base. Then we set the annual GDP growth rate for the 14th Five-Year Plan at 6, 6.5, 7, 7.5, and 8%, respectively.
(2) Proportion of added value of secondary industry (I): In 2019, the tertiary industry contributed 59.4% of added value, and this figure is expected to exceed 60% by 2025. However, as a result of the epidemic’s impact, the service industry has been severely restricted in recent years, with the secondary industry accounting for 36.8% of added value in 2019. The proportion of secondary industry and tertiary industry are expected to wane and wax during the 14th Five-Year Plan period, and the tertiary industry will become the supporting industry of China’s national economic growth by 2050, and the energy consumption structure will also change accordingly. The secondary industry’s added value is expected to fluctuate between 35 and 38% during the “14th Five-Year Plan.” We set the added value of secondary industry at 38, 37, 36, 36, and 36% in 2021–2025, respectively.
(3) Technological progress (RD): Technological progress plays a critical role in promoting energy efficiency, energy conservation, and emissions reduction. Independent research and development (R&D) is frequently viewed as the primary means of a country’s technological progress, research and development expense. The more money we invest in research and development, the more we can foster independent innovation and technical progress, thereby increasing energy efficiency, lowering energy intensity, and lowering energy consumption. Therefore, we select independent research and development to measure China’s technological progress. The 14th Five-Year Plan outlines a major increase in China’s capability for innovation, with overall R&D investment increasing at an annual pace of more than 7% on average. As a result, we project that between 2021 and 2025, China’s internal R&D investment would expand at an average annual rate of 7%.
(4) Household consumption level (C): The standard of life has risen, and people’s well-being has reached a new level. Per capita disposable income has mostly maintained pace with GDP growth, as has consumption. As a result, we anticipate consumption to increase by 6, 6.5, 7, 7.5, and 8% throughout the 14th Five-Year Plan period.
(5) Population size (POP): In 2019, China’s population surpassed 1.4 billion and is projected to reach 1.412 billion by 2020. Given the low level of desire for children, China proposed and pushed the “three-child” policy. However, a number of studies have demonstrated that implementing the “three-child” policy will have little effect on China’s natural population growth rate. The natural population growth rate is not expected to surge, but due to the effect of inertia of the huge population base and growth, the size of the population will expand further. Therefore, if the average annual growth rate from 2010 to 2020 remains at 4% till 2025, China’s population will be 1.418 billion, 1.423 billion, 1.429 billion, 1.435 billion, and 1.441 billion in 2021 and 2025, respectively.
(6) Energy consumption intensity (EI): The 14th Five-Year Plan prioritizes the development of a clean, low-carbon, safe, and efficient energy system, as well as the enhancement of energy security. Increasing the share of non-fossil energy in total energy consumption to around 20% and maintaining a healthy balance of overall energy consumption and energy intensity. The 14th Five-Year Plan also asks for sticking to a new vision of development, ensuring sustainable and sound economic growth while considerably enhancing development’s quality and efficiency, and reducing energy consumption intensity by 13.5% over the last 5 years. Based on a total reduction of 13.5% in energy consumption per unit GDP over the next 5 years, or a 2.7% annual reduction rate, energy consumption per unit GDP in 2021–2025 will be 1.84, 1.79, 1.74, 1.69, and 1.65 tons of standard coal per 10,000 yuan.
(7) Energy prices (P): We anticipate reasonably constant energy prices, with an average annual growth rate of 6% from 2010 to 2020. China’s 2021–2025 gasoline and electricity purchase price index is fixed at 106 in comparison to the corresponding price in 1990.
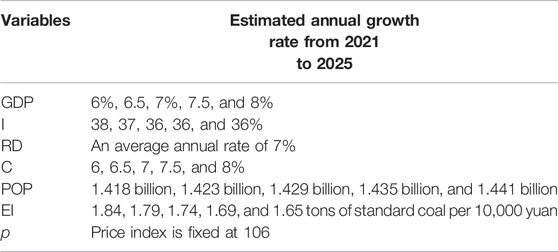
TABLE 5. Indicators for the 14th Five-Year Plan period.
4.3 Energy Consumption and Energy Structure Forecast
We forecast China’s energy usage between 2021 and 2025 using a trained SVR model (Figure 9). The accuracy of the prediction is greater than 98.4%. China’s energy consumption is projected to continue growing at an average annual rate of 7%, surpassing 6 billion tons of standard coal by 2024. As China’s industrialization and urbanization intensify, the country’s energy consumption will continue to grow rapidly, putting policymakers under increased pressure to strike a balance between energy use and economic development.
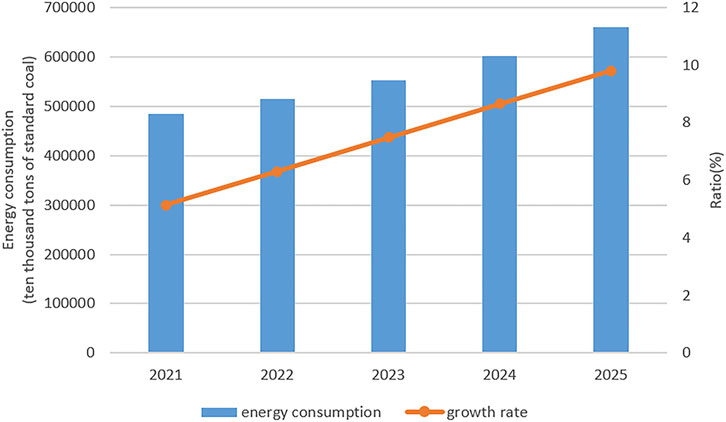
FIGURE 9. Forecast value of China’s energy consumption during the 14th Five-Year Plan period.
In accordance with “Outline of the 14th Five-Year Plan (2021–2025) for National Economic and Social Development and Vision 2035” 7, China’s economic and social development must adopt a green transition aimed at carbon reduction. The expanding energy consumption will exacerbate the imbalance and raise the need for energy imports. Energy technology is still in its infancy at the early stages of new energy development and change. All of these circumstances are likely to jeopardize China’s energy security, which should be taken into account.
China’s energy consumption structure remains irrational at the moment. The share of low-carbon energy sources such as oil, natural gas, and non-fossil energy consumption is significantly lower than the average for industrialized countries. As China’s economic development enters a new normal, improving the energy structure will enable the country to progressively wean itself off coal, improve economic quality, and achieve sustainable economic growth. As a result, we use Markov Chain (MC) to predict the energy consumption structure.
Only the proportion of coal declined between 2012 and 2019, while the proportions of crude oil, natural gas, and clean energy grew. It can be seen that the maintenance rate for crude oil, natural gas, and clean energy is 1, however the drop in coal’s share is decomposed into the other three. In 2020, the proportion of coal and crude oil has reduced, the retention rate of natural gas and clean energy has increased to 1, and the decline in coal and crude oil proportion has been decomposed into an increase in the other two items. The one-step transition matrix for 2012–2020 computed using Eqs 9–11 can be found in Appendix A1. The average transfer matrix for 2012–2020, according to the transfer matrix every 2 years, is as follows:
According to the average transfer matrix, the amount of natural gas and clean energy in China’s primary energy structure has continuously increased (the transfer proportion on the main diagonal is 1), which is compatible with the country’s clean energy policy. The coal-to-oil ratio has decreased. The proportion of coal energy structure declined the most quickly, with the lowest retention rate (97.69%). Petroleum energy is retained at a rate of 99.93%.
Based on the energy consumption structure in 2020, we set the initial state, in which Per (0) = (0.568, 0.189, 0.084, 0.159). The energy consumption proportion in 2021 is anticipated to be the energy consumption proportion matrix in 2020 multiplied by the average state transfer matrix using the average transfer matrix formula. The energy consumption ratio in 2022 is calculated by multiplying the energy consumption ratio in 2020 by the square of the average state transition matrix, and so on. The prediction results of 2021–2025 energy consumption structure are shown in Table 6. The results show that coal consumption has been declining, while natural gas is growing slowly (Wang and Wang, 2019; Zhao and Liu, 2019).
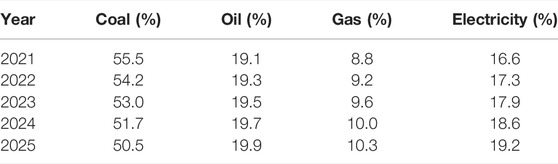
TABLE 6. Forecast of Energy consumption structure.
Our estimation on the structure of energy consumption suggests that coal consumption is decreasing steadily, and by 2025, coal is expected to account for around 50.5% of overall energy consumption. According to the Guiding Opinions on the High-Quality Development of the Coal Industry during the 14th Five-Year Plan, national coal consumption will be managed at around 4.2 billion tons by the end of the “14th Five-Year Plan,” and this binding target will be met.8 Oil consumption is rising year by year and is predicted to account for 19.9% of total energy consumption by 2025, which is in line with the Development Plan of China’s Petroleum and Petrochemical Equipment Manufacturing Industry in the 14th Five-year Plan’s requirements for total oil consumption in my country.9 However, it is worth noticing that, according to The 14th Five-Year Comprehensive Work Plan for Energy Conservation and Emission reduction, natural gas should account for around 15% of China’s energy mix by 2025.10 Compared with our forecast figure of 10.3% in 2025, there is still a gap between natural gas consumption and the target. According to the Comprehensive Work Plan10, non-fossil energy, such as electricity consumption, must account for more than 20% of total energy consumption. The forecast figure for 2025 is 19.2%, which has yet to be achieved, and the target will be met in 2030.
5 Conclusions and Suggestions
This study anticipates China’s overall energy consumption throughout the 14th Five-Year Plan period by proposing a machine learning model and predicts the evolving energy consumption structure. In comparison to commonly used forecasting models, i.e. the GM (1, 1) and MA (3), the SVR model is more accurate in forecasting China’s energy consumption. The overall energy consumption is projected to continue growing at an average pace of 7%, surpassing 6 billion tons of standard coal by 2024. In terms of energy structure, it is expected that China’s energy consumption structure will be more rational in 2025, with increased non-fossil energy consumption and decreased coal consumption, while natural gas consumption continues to grow at a low rate. The growing disparity between energy consumption and production will undermine China’s energy security. We are compelled to make proactive adjustments to our energy strategy and structure. The following policy implications are made based on the findings:
(1) When energy supply expansion is limited, ensuring national security requires scientific regulation of the energy consumption elasticity system. We need to reform our energy consumption structure, speed up industrial restructuring, and recommence our energy conservation efforts. It is very important to increase investment in clean energy, improve the efficiency of conventional energy sources (such as coal), and advocate for energy conservation and emission reduction.
(2) There is more intense competition between provinces and cities, urban and rural areas, and industry and civilians in terms of energy consumption. To avert the deterioration, regional total energy consumption management strategies should be attempted. A relationship between energy consumption and economic performance should be established so that when economic performance exceeds the task, overall regional energy consumption exceeds the regional energy development goal.
(3) In terms of energy consumption, some policies that have worked well, such as lax coal management, clean oil promotion, and electric energy replacement programs, must be maintained. While retaining the proportion of oil, the amount of coal should be gradually reduced and transferred to natural gas and other clean energy sources.
(4) The long-term sustainable development of natural gas should be prioritized. On the supply side, we should enhance the efficiency of existing gas resources and vigorously boost offshore gas and natural gas hydrate development. While total output continues to increase, it is critical to monitor market prices and analyze and establish an acceptable natural gas pricing system to ensure steady growth in natural gas consumption demand.
A few caveats are necessary. Investigating the disparities in energy consumption between urban and rural locations would be an intriguing side study. Additionally, policies aimed at energy conservation and emission reduction have a close connection with energy consumption. These will be studied in greater detail in our subsequent investigation.
Data Availability Statement
The original contributions presented in the study are included in the article/Supplementary Material, further inquiries can be directed to the corresponding author.
Author Contributions
ZM was instrumental in the conceptualization and design of the study. HS was responsible for material preparation, data collecting, and analysis. XW contributed to the literature. HS wrote the initial draft of the manuscript, and all writers provided feedback on prior versions. The final manuscript was read and approved by all writers.
Funding
This research is funded by the National Social Science Foundation of China (NO.19BJY151). The National Social Science Foundation of China provided the necessary financial support for the research.
Conflict of Interest
The authors declare that the research was conducted in the absence of any commercial or financial relationships that could be construed as a potential conflict of interest.
Publisher’s Note
All claims expressed in this article are solely those of the authors and do not necessarily represent those of their affiliated organizations, or those of the publisher, the editors and the reviewers. Any product that may be evaluated in this article, or claim that may be made by its manufacturer, is not guaranteed or endorsed by the publisher.
Acknowledgments
Funding from the National Social Science Foundation of China (NO.19BJY151) is gratefully acknowledged.
Footnotes
1China Statistical Yearbook 2021, http://www.stats.gov.cn/tjsj/ndsj/
2China Statistical Yearbook 2021, http://www.stats.gov.cn/tjsj/ndsj/
3China Statistical Yearbook 2021, http://www.stats.gov.cn/tjsj/ndsj/
4China Statistical Yearbook 2021, http://www.stats.gov.cn/tjsj/ndsj/
5China Statistical Yearbook 2021, http://www.stats.gov.cn/tjsj/ndsj/
6http://www.gov.cn/xinwen/2021-03/13/content_5592681.htm
7http://www.gov.cn/xinwen/2021-03/13/content_5592681.htm
8http://www.coalchina.org.cn/index.php?m=content&c=index&a=show&catid=9&id=129818
9https://m.cpei.org.cn/index.html
10http://www.gov.cn/zhengce/content/2022-01/24/content_5670202.htm
References
Aboagye, S. (2017). The Policy Implications of the Relationship between Energy Consumption, Energy Intensity and Economic Growth in ghana. OPEC Energ. Rev 41 (4), 344–363. doi:10.1111/opec.12114
Achour, H., and Belloumi, M. (2016). Decomposing the Influencing Factors of Energy Consumption in Tunisian Transportation Sector Using the Lmdi Method. Transport Policy 52, 64–71. doi:10.1016/j.tranpol.2016.07.008
Ang, B. W. (2004). Decomposition Analysis for Policymaking in Energy: Which Is the Preferred Method? Energy Policy 32 (9), 1131–1139. doi:10.1016/S0301-4215(03)00076-4
Asafu-Adjaye, J. (2000). The Relationship between Energy Consumption, Energy Prices and Economic Growth: Time Series Evidence from Asian Developing Countries. Energ. Econ. 22 (6), 615–625. doi:10.1016/S0140-9883(00)00050-5
Birol, F., and Keppler, J. H. (2000). Prices, Technology Development and the Rebound Effect. Energy Policy 28 (6/7), 457–469. doi:10.1016/S0301-4215(00)00020-3
Chen, H., Tong, Y., Wu, L., and Engineering, M. (2021). Forecast of Energy Consumption Based on Fgm (1, 1) Model. Math. Probl. Eng. 2021, 1–11. doi:10.1155/2021/6617200
Chen, W., and Zhu, H. (2013). Energy Demand Forecast in China Based on Particle Swarm Optimization Algorithm. China Popul. Resour. Environ. 23 (03), 39–43.
Cortes, C., and Vapnik, V. (1995). Support-Vector Networks. Mach Learn. 20 (3), 273–297. doi:10.1007/bf00994018
Ediger, V. Ş., and Akar, S. (2007). Arima Forecasting of Primary Energy Demand by Fuel in Turkey. Energy Policy 35 (3), 1701–1708. doi:10.1016/j.enpol.2006.05.009
Gori, F., and Takanen, C. (2004). Forecast of Energy Consumption of Industry and Household & Services in italy. Int. J. Heat Technol. 22 (2), 115–121.
Hao, Y., Niu, X., and Wang, J. (2021). Impacts of Haze Pollution on China's Tourism Industry: A System of Economic Loss Analysis. J. Environ. Manage. 295, 113051. doi:10.1016/j.jenvman.2021.113051
He, T., Li, Z., and Lin, H. (2011). On the Relationship between Energy Intensity and Industrial Structure in China. Energ. Proced. 5 (1), 2499–2503. doi:10.1016/j.egypro.2011.03.429
Huang, J., Du, D., and Hao, Y. (2017). The Driving Forces of the Change in China's Energy Intensity: An Empirical Research Using Dea-Malmquist and Spatial Panel Estimations. Econ. Model. 65, 41–50. doi:10.1016/j.econmod.2017.04.027
Hunt, L. C., and Ninomiya, Y. (2005). Primary Energy Demand in Japan: an Empirical Analysis of Long-Term Trends and Future Co2 Emissions. Energy Policy 33 (11), 1409–1424. doi:10.1016/j.enpol.2003.12.019
Inglesi, R. (2010). Aggregate Electricity Demand in South Africa: Conditional Forecasts to 2030. Appl. Energ. 87 (1), 197–204. doi:10.1016/j.apenergy.2009.08.017
Kran, M. S., Zceylan, E., Gündüz, M., and Paksoy, T. (2012). A Novel Hybrid Approach Based on Particle Swarm Optimization and Ant Colony Algorithm to Forecast Energy Demand of Turkey. Energ. Convers. Manage. 53 (1), 75–83. doi:10.1016/j.enconman.2011.08.004
Li, K., and Lin, B. (2014). The Nonlinear Impacts of Industrial Structure on China's Energy Intensity. Energy 69, 258–265. doi:10.1016/j.energy.2014.02.106
Lin, B., and Zhu, J. (2017). Energy and Carbon Intensity in China during the Urbanization and Industrialization Process: A Panel Var Approach. J. Clean. Prod. 168, 780–790. doi:10.1016/j.jclepro.2017.09.013
Marques, A. C., Fuinhas, J. A., and Tomás, C. (2019). Energy Efficiency and Sustainable Growth in Industrial Sectors in european union Countries: A Nonlinear Ardl Approach. J. Clean. Prod. 239, 118045.1–118045.12. doi:10.1016/j.jclepro.2019.118045
Meng, Z., Liu, X., Yin, K., Li, X., and Guo, X. (2020). Forecasting China's Energy Intensity by Using an Improved DVCGM (1, N) Model Considering the Hysteresis Effect. Grey Syst. Theor. Appl. 11 (3), 372–393. doi:10.1108/GS-02-2020-0022
Niu, D., Sun, W., and Zhao, L. (2004). Markov Energy Structure Prediction Model Based on Transfer Matrix Recognition. J. North China Electric Power Univ. (Natural Sci. Edition) (03), 59–61.
Patterson, M. G., Makarov, V. I., and Khmelinskii, I. V. (1996). What Is Energy Efficiency? - Concepts, Indicators and Methodological Issues. Energy Policy 24 (5), 377–390. doi:10.1016/0301-4215(96)00017-1
Ren, J., Xia, J., and Yin, Y. (2017). Prediction of Primary Energy Consumption Based on Improved BP Neural Network and Markov Model: A Case Study of Beijing. Ecol. Economy 33 (11), 6.
Rumelhart, D. E., Hinton, G. E., and Williams., R. J. (1986). Learning Representations by Back-Propagating Errors. Nature 323, 533–536. doi:10.1038/323533a0
Soytas, U., and Sari, R. (2003). Energy Consumption and Gdp: Causality Relationship in G-7 Countries and Emerging Markets. Energ. Econ. 25, 33–37. doi:10.1016/S0140-9883(02)00009-9
Stern, D. I. (2000). A Multivariate Cointegration Analysis of the Role of Energy in the Us Macroeconomy. Energ. Econ. 22 (2), 267–283. doi:10.1016/s0140-9883(99)00028-6
Uenler, A. (2008). Improvement of Energy Demand Forecasts Using Swarm Intelligence: The Case of turkey with Projections to 2025. Energy Policy 36 (6), 1937–1944. doi:10.1016/j.enpol.2008.02.018
Wang, Y., and Wang, Y. (2019). Feasibility and Optimal Pathway of China’s Double Targets for Carbon Reduction—The Perspective of Energy Structure Optimization. China Environ. Sci. 39 (10), 4444–4455. doi:10.19674/j.cnki.issn1000-6923.2019.0518
Xie, N.-M., Yuan, C.-Q., and Yang, Y.-J. (2015). Forecasting China's Energy Demand and Self-Sufficiency Rate by Grey Forecasting Model and Markov Model. Int. J. Electr. Power Energ. Syst. 66, 1–8. doi:10.1016/j.ijepes.2014.10.028
Yakut, E., and Özkan, E. (2020). Modeling of Energy Consumption Forecast with Economic Indicators Using Particle Swarm Optimization and Genetic Algorithm: An Application in Turkey between 1979 and 2050. Alphanumeric J. 8, 59–78. doi:10.17093/alphanumeric.747427
Yang, W., Sun, S., Hao, Y., and Wang, S. (2022). A Novel Machine Learning-Based Electricity price Forecasting Model Based on Optimal Model Selection Strategy. Energy 238, 121989. doi:10.1016/j.energy.2021.121989
Zhao, Z., and Liu, Q. (2019). China’s Energy Strategy Planning Based on Prediction of Energy Consumption, Production and Structure. Resour. Industries 21 (06), 1–8. doi:10.13776/j.cnki.resourcesindustries.20191206.007
Zhu, X., Dang, Y., and Ding, S. (2020). Using a Self-Adaptive Grey Fractional Weighted Model to Forecast Jiangsu's Electricity Consumption in china. Energy 190, 116417. doi:10.1016/j.energy.2019.116417
Zong, W. G., and Roper, W. E. (2009). Energy Demand Estimation of south korea Using Artificial Neural Network. Energy Policy 37 (10), 4049–4054. doi:10.1016/j.enpol.2009.04.049
Zou, B., and Luo, B. (2019). Rural Household Energy Consumption Characteristics and Determinants in China. Energy 182 (1), 814–823. doi:10.1016/j.energy.2019.06.048
Appendix
Appendix A1 The one-step transition matrix for 2012–2020.
Keywords: forecast, energy consumption, machine learning, sustainable development, energy structure
Citation: Meng Z, Sun H and Wang X (2022) Forecasting Energy Consumption Based on SVR and Markov Model: A Case Study of China. Front. Environ. Sci. 10:883711. doi: 10.3389/fenvs.2022.883711
Received: 25 February 2022; Accepted: 21 March 2022;
Published: 06 April 2022.
Edited by:
Wendong Yang, Shandong University of Finance and Economics, ChinaReviewed by:
Kevin Li, University of Windsor, CanadaLifeng Wu, Hebei University of Engineering, China
Copyright © 2022 Meng, Sun and Wang. This is an open-access article distributed under the terms of the Creative Commons Attribution License (CC BY). The use, distribution or reproduction in other forums is permitted, provided the original author(s) and the copyright owner(s) are credited and that the original publication in this journal is cited, in accordance with accepted academic practice. No use, distribution or reproduction is permitted which does not comply with these terms.
*Correspondence: Zhaosu Meng, emhhb3N1Lm1lbmdAb3VjLmVkdS5jbg==