 Xiaojing Cai1,2*
 Ryuta Sakemoto1,3
- 1Faculty of Humanities and Social Sciences, Okayama University, Okayama, Japan
- 2Graduate School of Economics, Kobe University, Kobe, Japan
- 3Keio Economic Observatory, Keio University, Tokyo, Japan
This study investigates whether the El Niño Southern Oscillation (ENSO) affects primary commodity prices over time. We employ a wavelet approach that allows us to disentangle the time and frequency domains and to uncover time-varying nonlinear relationships at different frequency levels. Moreover, we adopt partial wavelet coherence (PWC) and eliminate macroeconomic effects on commodity prices. We observe that ENSO is associated with agricultural, food, and raw material commodity prices at lower frequencies of 32–64 and 64–128 months. These results are stronger from 2000 onward, which are not observed using a conventional wavelet method. Our results suggest a recent strong relationship between ENSO and commodity prices, which has important implications for policymakers regarding climate change risk.
Introduction
In 2018, the National Climate Assessment (NCA) reported that climate change created new risks.1 Global warming, sea level rise, abnormal temperatures, and extreme weather affect human health and economic growth. Recently, climate risk, regarded as an important risk factor, has received attention from financial investors.2 For instance, abnormal temperatures affect economic activities and investors’ decisions. An increase in summer temperature is negatively related to gross state product in the United States (Colacito et al., 2019). Global high abnormal temperatures cause an increase of drought and result in a decrease of stock prices in the food industry (Hong et al., 2019). Retail investors tend to sell shares of carbon-intensive firms during abnormally high temperatures (Choi et al., 2020). Investors who invest in high-carbon-dioxide-emission firms demand compensation for carbon dioxide emission risk (Bolton and Kacperczyk, 2021).3 In contrast, Addoum et al. (2020) find a weak relationship between temperature shocks and establishment sales in the United States, and conclude that temperature shocks are more important in emerging countries.
We focus on the impact of climate risk on real commodity prices. Real commodity prices provide important information to both policymakers and financial investors. Commodity prices are associated with business cycles and their shocks are driving forces for output fluctuations in emerging economies; see Fernández et al. (2017), Fernández et al. (2018). Commodities have been used as investment assets because of their low correlations with stock market returns (Erb and Harvey, 2006; Gorton and Rouwenhorst, 2006; Tang and Xiong, 2012; Buyuksahin and Robe, 2014; Singleton, 2014). Basak and Pavlova (2016) propose a theoretical model in which the financialization of commodities leads to an increase in stock and commodity return correlations. Fernandez-Perez et al. (2017) show that commodity markets entail future investment opportunity state information that is not revealed by dividend yields or term spreads. Real exchange rates in advanced economies are also affected by commodity price shocks (Ayres et al., 2020).
We investigate how the El Niño Southern Oscillation (ENSO)—a type of climate risk—impacts primary commodity prices over time. ENSO is a climate pattern that is associated with changes in the temperatures of waters in the central and eastern tropical Pacific Ocean and influences weather, and rainfall. El Niño and La Niña are extreme phases of this cycle and El Niño is linked to crop production (Handler and Handler, 1983; Iizumi et al., 2014; Hsiang and Meng, 2015). Moreover, ENSO plays an important role in real commodity price fluctuations and influences not only certain geographical areas, but also the world economy. ENSO shocks create droughts in one region and influence commodity supply in the world market, because commodity production is limited to specific regions (Ubilava, 2018). It accounts for approximately 20% of global commodity price fluctuations (Brunner, 2002). Channels of ENSO shocks are complex, and Cashin et al. (2017) construct multicountry models and extract indirect ENSO shocks through third-markets. Moreover, Ubilava (2018) and Nam (2021) provide evidence that ENSO shocks have heterogeneous and nonlinear effects on individual agricultural commodities.
In this study, we employ a wavelet approach and investigate the relationship between commodity prices and ENSO. This approach allows us to disentangle the time and frequency domains and to uncover time-varying relationships at different frequency levels. Ortu et al. (2013) and Dew-Becker and Giglio (2016) highlight the importance of the frequency domain since long-run shocks play a key role in asset prices. It is advantageous for financial time series data that includes different behaviors in short -and long-run intervals. The previous literature investigates stock market risk-return relationships, market integration across international stock markets, and market microstructure at different frequency levels (Gençay et al., 2005; Rua and Nunes, 2009; Hasbrouck, 2018; Sakemoto, 2020).
Some studies propose adopting the frequency domain in portfolio constructions; for instance, In and Kim (2006), Cai et al. (2017), and Conlon et al. (2018). ENSO data have a cyclical component, and deploying stationary-type autoregressive models are difficult, as reported by Campbell and Diebold (2005) and Nam (2021); hence, our wavelet approach is a strong tool for modeling ENSO data. Therefore, the first contribution of this study is that it explores the time-varying nonlinear relationships between real commodity prices and ENSO shocks using the wavelet approach.
Commodity prices are not only driven by ENSO shocks; macroeconomic fundamentals are also important factors in determining prices. In particular, short-term interest rate in the United States is a fundamental factor in determining global commodity prices. Frankel (2008) points out that a high interest rate leads to a decline in commodity storage demand. Furthermore, speculators shift money from commodity markets to the U.S. Treasury bills with changes in interest rates. We need to eliminate the effects generated by short-term changes in interest rates and examine the commodity prices and ENSO shock nexus in the time and frequency domains.
Our second contribution is that we adopt partial wavelet coherence (PWC), which allows us to explore how ENSO shocks impact commodity prices after eliminating interest rate effects. PWC is proposed by Mihanović et al. (2009) and Ng and Chan (2012) and has been widely used in geophysics.4 Both interest rate and ENSO shocks entail time-varying impacts on commodity prices (Ubilava, 2018; Byrne et al., 2020); therefore, PWC is a powerful method of capturing time-varying relationships. More importantly, our approach extends the work of Ubilava (2018), Byrne et al. (2020), and Nam (2021), and captures the frequency-domain relationships.
Our third contribution is that we focus on commodity price co-movement, which is more informative in capturing economic states. Previous studies have revealed that common factors exist across commodity prices (see Pindyck and Rotemberg, 1990; Byrne et al., 2013; West and Wong, 2014). Some studies observe that co-movement is linked to other macroeconomic fundamentals. For instance, Gospodinov and Ng (2013) find that common factors in commodity convenience yields predict inflation. Alquist et al. (2020) uncover that a common shock in primary commodity markets is negatively associated with global economic activities. Focusing on commodity price co-movement is an important difference from Ubilava (2018), who examines individual commodity prices since the information of commodity price co-movement information reveals economic states.5
To preview our results, we find strong correlations between commodity prices and ENSO at lower frequencies and in two periods: from 1968 to 1990, and 2000 onward. Moreover, we adopt the PWC approach and provide evidence that the strong correlations from 1968 to 1990 became weaker, whereas they were stronger from 2000 onward. These are not observed without controlling for the interest rate effects. The strong correlations during the early period were associated with high inflation rates and the active monetary policy by the U.S. Federal Reserve Board (Clarida et al., 2000). Our results also demonstrate that interest rates play an important role in determining commodity prices, as proposed by Frankel (2008); therefore, it is important to control for their effects and to evaluate commodity price fluctuations. The reason for the strong link between ENSO and commodity prices after 2000 stems from the financialization of the commodity market (Tang and Xiong, 2012; Singleton, 2014). Investors consider commodities as one of asset classes and focus on a common risk across assets (Asness et al., 2013; Koijen, et al., 2018). Recently, investors regard climate risk as an important risk factor in the financial market. In particular, carbon intensity receives attention as an important risk factor both in traditional assets (Choi et al., 2020; Bolton and Kacperczyk, 2021; Pedersen et al., 2021) and in new assets (Yang and Hamori, 2021; Yang and Xu, 2021; Yang 2022). The financialization in the commodity market and the growing awareness of the carbon intensity lead to the strong relationship between ENSO and commodity prices after 2000.
The remainder of this article is organized as follows. In Data, the data are briefly described. Methodology describes the methodology of the wavelet coherence and PWC. Empirical results presents our empirical results. Robustness checks contains and examination of the robustness of the results. Finally, we conclude the article in Conclusion.
Data
ENSO
ENSO is a climate cycle of sea surface temperature and air pressure of the overlying atmosphere in the tropical Pacific region. El Niño and La Niña are extreme events in this cycle. During the normal phase, air pressure in Northern Australia and Indonesia is lower than that on the west coast of equatorial South America, which causes trade winds to move from east to west over the Pacific Ocean and draws warm surface water westward. This circulation of winds brings precipitation to Australia and the Western Pacific.
During an El Niño event, the air pressure difference between the west and east weakens, and allows warmer water to move into the central and eastern Pacific Ocean. This leads to warmer sea surface temperatures in the central and eastern tropical Pacific Ocean, to severe droughts in Australia and the western Pacific Ocean, and to heavy precipitation on the west coast of equatorial South America. In contrast, during a La Niña event, trade winds strengthen, and the area of warmer water is constrained to the western Pacific Ocean, which causes an increase in rainfall over northern and western Australia. Figure 1 shows the patterns of temperature and rainfall during El Niño and La Niña events.
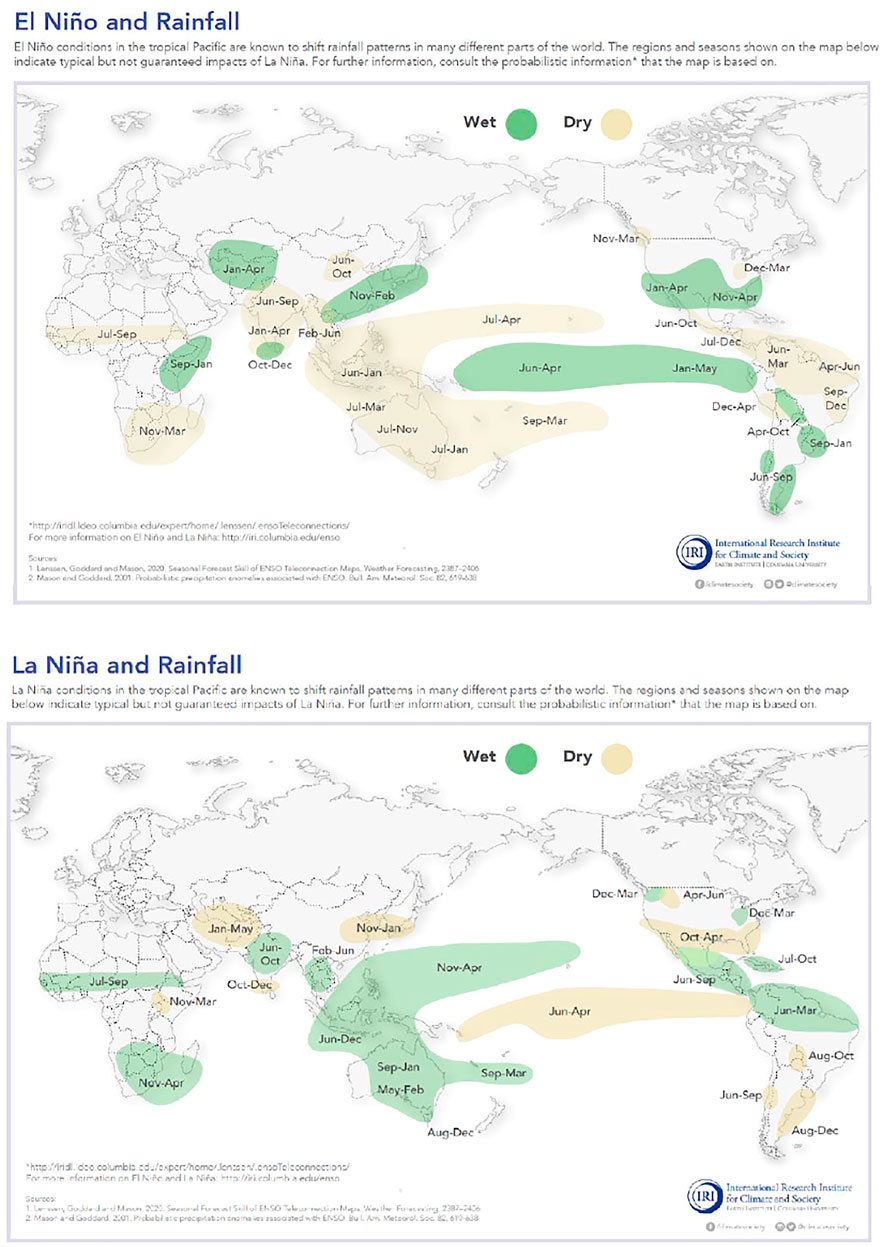
FIGURE 1. EL Niño and La Niña effects. Notes: This figure indicates the weather patterns during El Niño and La Niña events. Source: International Research Institute for Climate and Society at Columbia University, based on Lenssen et al. (2020) and Mason and Goddard (2001).
We follow Brunner (2002) and Cashin et al. (2017), and employ the Southern Oscillation Index (SOI) to capture El Niño intensities. The SOI is calculated using the observed sea level pressure differences between Tahiti and Darwin in Australia. A negative (positive) SOI value indicates that air pressure is below (above) average in Tahiti and above (below) that at Darwin. The negative value of the SOI coincides with abnormal warm (cold) ocean waters across the eastern tropical Pacific and El Niño (La Niña) events. We obtain the SOI data from the National Centers for Environmental Information.6
Commodity Prices and Interest Rates
To examine how climate risk affects commodity prices, we collect a commodity price index for agriculture that is most influenced by climate risk. Moreover, we obtain three agricultural sub-indices: beverages, food, and raw materials. These data are downloaded from the World Bank (pink sheet). Previous studies, such as Byrne et al. (2013), West and Wong (2014), and Alquist et al. (2020), highlight the importance of commodity common factors. Motivated by their findings, our main analysis focuses on commodity indices, rather than on individual commodities. Real commodity prices are associated with the business cycle and inflation (Fernández et al., 2017; Alquist et al., 2020), and following Fernández et al. (2017), we calculate the real commodity price return as
Real commodity prices are negatively associated with real interest rates (Frankel, 2008). In this study, we employ a real interest rate and control for the interest rate effects on commodity prices. Following Frankel (2008) and Byrne et al. (2013), we calculate the real interest rate as
The descriptive statistics for SOI, real commodity price returns, and real interest rates are summarized in Table 1. The results of the Augmented Diceky-Fuller (ADF) test show that all the data series are stationary. The upper part of Figure 2 demonstrates the time-series plot of the SOI. The persistence of negative values below -2 indicates that El Niño events were severe in 1978, 1983, 1992, 1998, 2005, and 2016, whereas the values above two indicate that La Niña events corresponded to 1971, 1974, 1975, 2008, and 2011. In Supplementary Figure SA2, the top and middle rows represent the time-series prices and real returns of the four commodity indices and real interest rates, respectively. Commodity prices have risen from 1970 to 1986 and have also increased since year 2000.
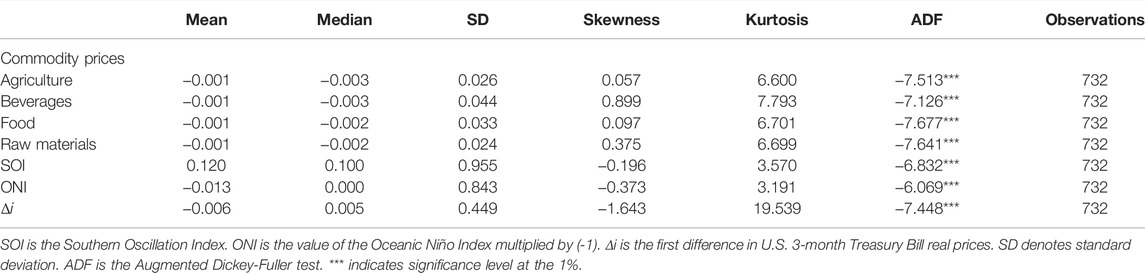
TABLE 1. Descriptive statistics.
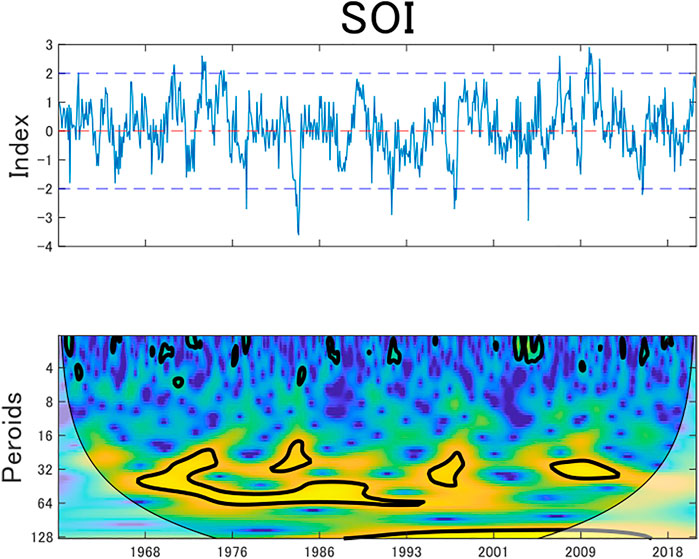
FIGURE 2. SOI figure from top to bottom are the time series of the Southern Oscillation Index at the top and its wavelet power spectrum at the bottom. Notes: The black contour in the wavelet power spectrum shows a 5% significance level estimated from the Monte Carlo simulations. The color code in the wavelet power spectrum shows the degree of local variance, ranging from blue (low variance) to yellow (high variance). The bold line in the wavelet power spectrum shows the edge effects.
Methodology
Wavelet Coherence Analysis
This section describes wavelet coherence analysis that allows us to assess the frequency components of nonlinear relationships without losing time-specific information. We begin by mapping an original series into two directions of frequency and time via a mother wavelet function. Following Torrence and Compo (1998), Torrence and Webster (1999), and Grinsted et al. (2004), a continuous wavelet function of time series
where
The continuous wavelet power is defined as
Given two time series,
where
Partial Wavelet Coherence Analysis
Next, we describe PWC analysis, which is an extension of bivariate wavelet coherence analysis. Mihanović et al. (2009) propose the PWC approach that represents a nonlinear relationship between
Following Mihanović et al. (2009), Ng and Chan (2012), and Hu and Si (2021), a (squared) partial wavelet coherence function is defined as
where
Empirical results
In this section, we first estimate an impact of ENSO shocks on real commodity price returns using a regression model. Then, we use the wavelet coherence method to measure the nonlinear relationships between commodity price returns and ENSO shocks in the time-frequency domains. Finally, we use the PWC and examine how ENSO shocks affect commodity price returns after excluding the effects of interest rates.
Linear Regression Results
We begin with the regression results and regress the commodity returns onto the SOI and the interest rate in three time domains: monthly, quarterly, and annually. Table 2 presents that SOI has a positive impact on commodity returns of agriculture, food, and raw material,11 but the estimates are not statistically significant, which suggests that the SOI effects are nonlinear, as reported by Ubilava (2018) and Nam (2021). Panels A and C of Table 2 show that the real interest rate is an important determinant of agricultural and food returns, which is in line with Frankel (2008) and Byrne et al. (2013). The real interest rate effects are positive, which contrast with the results of the previous literature. We use a change in the interest rate and it causes the positive relationships.12
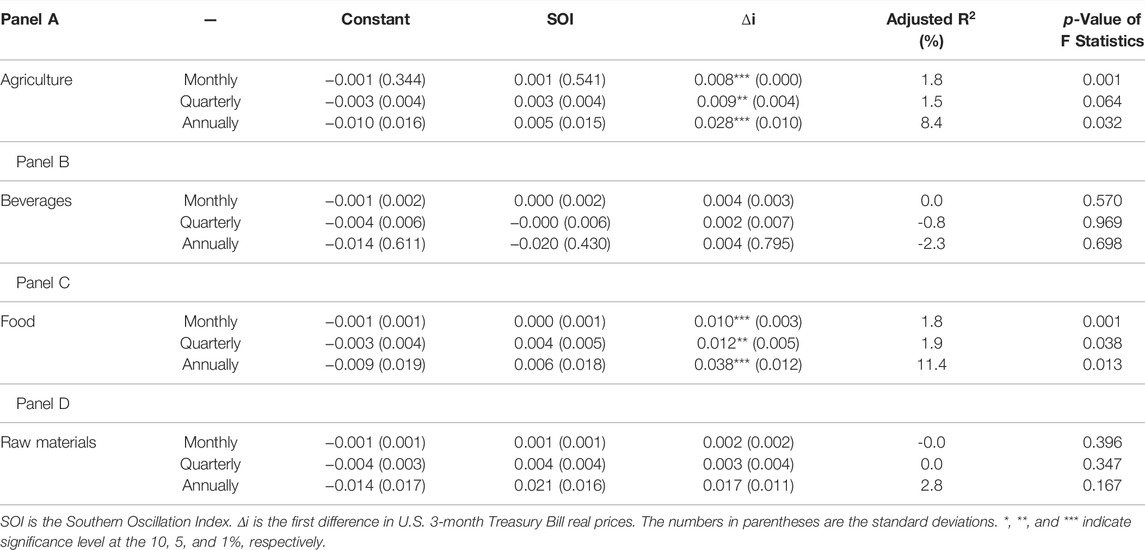
TABLE 2. Estimated results of regression analysis.
Empirical Results Based on Wavelet Coherence
Having found a weak relationship between SOI and commodity returns, we use wavelet analysis to explore nonlinear relationships in the time-frequency space. First, we decompose our data series individually based on Eq. 1 and search for their local variance. According to the length of our data series, they are decomposed into seven levels: level one (1–2 months), level two (2–4 months), level three (4–8 months), level four (8–16 months), level five (16–32 months), level six (32–64 months), and level seven (64–128 months), covering the short-term (less than 1 year), mid-term (1–2 years), and long-term horizons (over 2 years).
The bottom sections of Figure 2; Supplementary Figure SA2 demonstrate the wavelet power spectrum plots of the SOI, four commodity price returns, and the interest rate. From Grinsted et al. (2004), colors ranging from blue to yellow indicate a low or high degree of local variance and the black contour indicates a 5% significance level using the Monte Carlo simulation method. The bold line in the influence cone indicates the area affected by edge effects. The dark contours on the 32- to 64-month scales in the wavelet power spectrum plot of Figure 2 indicate that high local variance of the SOI appeared in the long-term range during the periods 1968–1995 and 2006–2011. The frequency of the ENSO is consistent with the findings reported by Ray and Giese (2012) who observe that the mean frequency distribution of the ENSO is 3.9 years (46.6 months), with the standard deviation of 1.9 years (22.8 months). Bunde et al. (2005) document that there is long-term memory in the climate record that leads to a pronounced clustering of extreme events.
For the commodity markets in Supplementary Figure SA2, we find high volatility periods on the 4 to 8- and 32- to 64-month scales from 1970 to 1986 and on the 8- to 16- month scales from 2008 to 2010. The periods of high volatility in the SOI and commodity markets overlap. We also observe significant high interest rate volatility in the long run period of 1976–1986, which corresponded with the high inflation period in the United States.
Second, we investigate the nonlinear interdependence of commodity price returns and SOI by estimating their wavelet coherence, as shown in Figure 3. Similar to Figure 2; Supplementary Figure SA2, the color codes from blue to yellow show coherence values from zero to one and the black contour lines indicate a 5% significance level using the Monte Carlo simulation method. We note that agricultural, food, and raw material commodity returns had high correlations with the SOI on the 32 to 64- and 64- to 128-month scales for the two periods of 1968–1990 and from 2000 onward. The correlation between beverage price return and SOI was weak. These results confirm the findings of Ubilava (2018) and Nam (2021) that ENSO shocks have heterogeneous and nonlinear effects on agricultural commodities. Whereas they focus only on the effect of climate on individual commodity prices, we employ agricultural price indices, which are much more informative in terms of capturing the economic state (Byrne et al., 2013; West and Wong, 2014; Alquist et al., 2020). In addition, the vector autoregressive (VAR)-type models adopted in previous studies do not assess time and frequency information simultaneously.
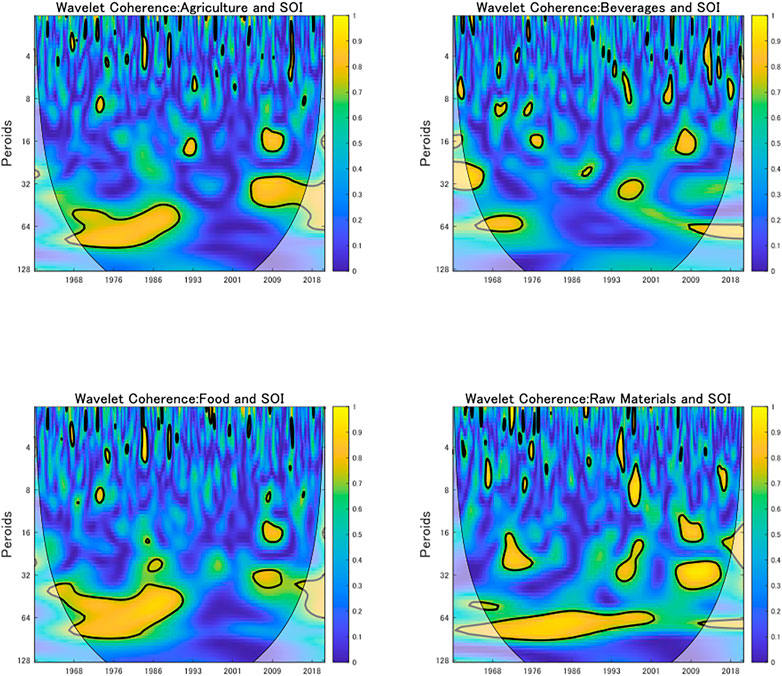
FIGURE 3. Wavelet coherences between commodity prices and SOI. Notes: The black contour shows a 5% significance level estimated from the Monte Carlo simulations. The color code shows the degree of coherence strength, ranging from blue (low coherence) to yellow (high coherence). The bold lines indicate the edge effects.
Empirical Results Based on PWC
Finally, we use PWC to investigate the partial correlations between commodity prices and SOI, since PWC allows us to find wavelet coherence after eliminating the effect of the other variables (Mihanović et al., 2009; Ng and Chan, 2012). Frankel (2008) reports that high interest rates reduce demand for commodity storage, which in turn affects commodity prices. Interest rates are an important determinant for commodity prices and we investigate “pure” relationships between the commodity price returns and the SOI after eliminating the interest rate effects in this section.
Figure 4 presents estimated results using PWC and the color code and black contour lines have the same meaning as those in Figure 3. The results indicate that the strong correlations from 1968 to 1990 estimated in Figure 3 were weaker as shown in Figure 4, suggesting that agricultural, food, and raw material commodity price returns during this period are mainly driven by a change in the interest rate, and not by ENSO shocks. This is related to the high inflation period triggered by oil price shocks and the proactive monetary policy implemented by Paul Volcker (e.g., Clarida et al., 2000). The correlations were stronger from year 2000 onward, controlling for interest rate effects, which implies that climate risk became a greater determinant of commodity prices. These are related to recent global warming that enhances ENSO variability (Cai et al., 2018; Power et al., 2021).13 Ubilava (2017) also investigates ENSO-induced asymmetric price transmissions in the international wheat market and reports that the ENSO indeed affects international wheat prices. Disasters related to extreme weather are linked to agricultural prices in both domestic and international markets (Chatzopoulos et al., 2020) and impact the stock prices of food firms (Hong et al., 2019).
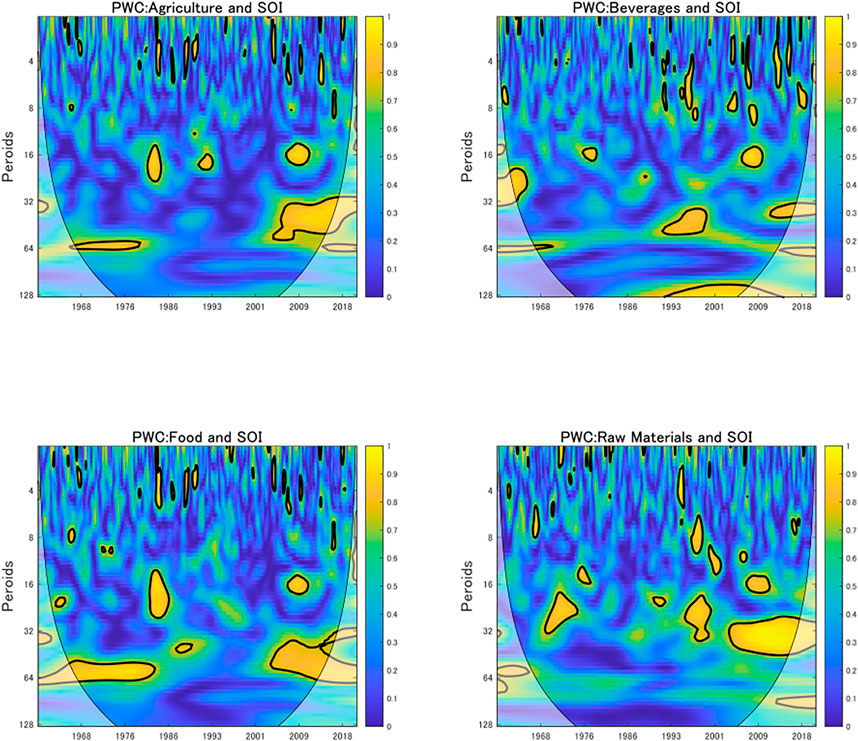
FIGURE 4. Partial wavelet coherences between commodity prices and SOI. Notes: The black contour shows a 5% significance level estimated from the Monte Carlo simulations. The color code shows the degree of partial wavelet coherence strength, ranging from blue (low coherence) to yellow (high coherence). The bold lines indicate the edge effects.
For a more intuitive understanding, we plot the results of a more detailed analysis of time-varying coherence (top) and PWC (bottom) in Figure 5; Supplementary Figure SA3. The vertical axis shows the values of the wavelet coherence and PWC. A coherence value close to one indicates a high correlation and a value close to zero indicates a weak correlation. We find that the results of wavelet coherence and PWC are heterogeneous across different time scales. Specifically, they are more variable in short-term horizons and more stable in long-term horizons. However, the correlations of PWC became weaker than those of wavelet coherence in the mid- and long-term (16- to 32-, 32- to 64-, and 64- to 128-month scales) from 1968 to 1990, and became stronger from year 2000 onward. This implies that ENSO events became severe and climate risk had a greater impact on commodity markets after removing the interest rate effects, which is consistent with Figures 3, 4.
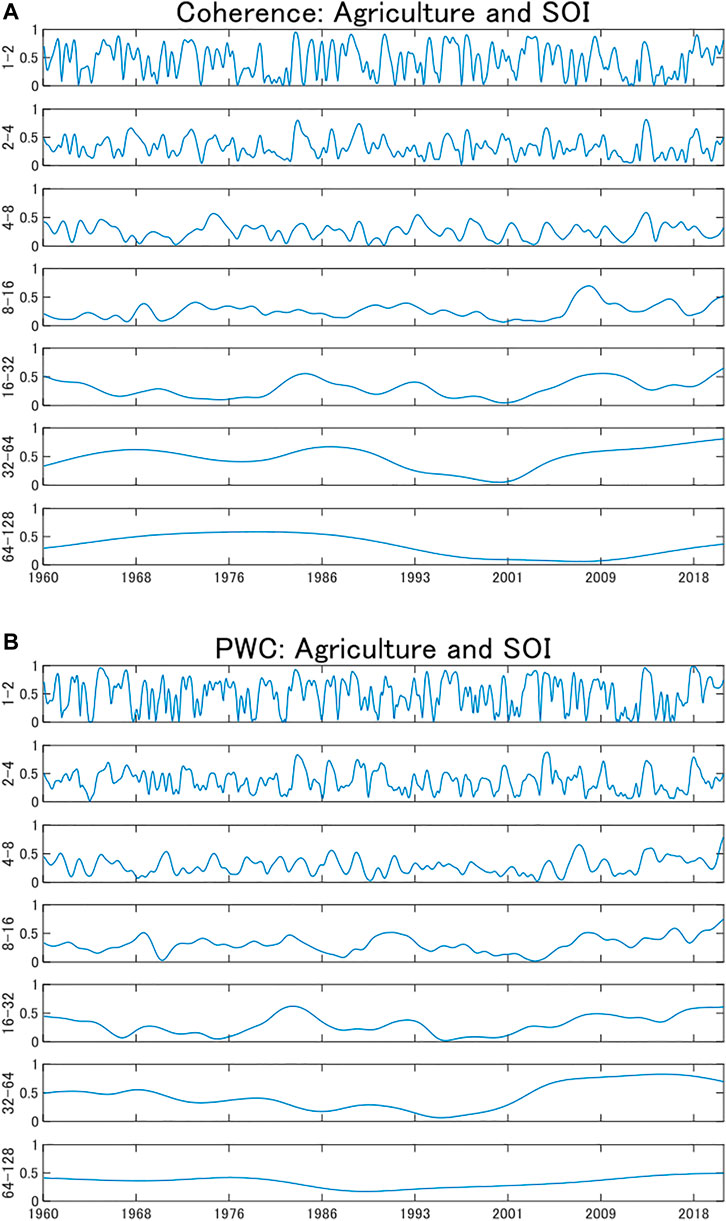
FIGURE 5. Time-varying wavelet coherences (A) and partial wavelet coherences (B) between agriculture and SOI across different frequencies.
Robustness Checks
Ocean Niño Index (ONI)
Having found time- and frequency-specific relationships between commodity prices and the SOI, we investigate whether our results are robust when we adopt a different ENSO measure. We follow Brunner (2002) and Ubilava (2018) and use another monthly series of the ENSO index named the Ocean Niño Index (ONI), which is the rolling index of 3-month average anomalies in the equatorial Pacific sea surface temperature (SST). The value of +0.5 or higher indicates El Niño, whereas the value of −0.5 or lower indicates La Niña.14 Supplementary Figure SA1 shows the time series and wavelet power spectrum of the ONI. We can see that most high variance of the ONI occurs on the 16 to 32- and 32- to 64-month scales.
Commodity Prices and ONI
Next, we investigate the impact of ONI on commodity prices. The results estimated by linear regressions are presented in Supplementary Table SA1, and we find that the estimates of ONI are not significant. We also compare the results of wavelet coherence and PWC, adopting ONI as shown in Supplementary Figures SA4–A6. Similar to the results estimated by the SOI, strong correlations between commodity prices and the ONI were observed on the 32 to 64- and 64- to 128-month scales and during two periods of 1968–1990 and from year 2000 onward. These results are related to previous studies that deploy data on SST anomalies (Brunner, 2002; Ubilava, 2018).
Supplementary Figures SA4–A5 demonstrate that the correlation between the beverage and ONI is weaker than that of the other three pairs. In contrast to the wavelet coherence results, the PWC provides evidence that the medium- and long-term correlations weakened in 1986–1990 and strengthened after 2000 after removing the effects of interest rates, which is consistent with the results when we adopt the SOI.
Conclusion
This study examines how ENSO shocks affect four primary commodity index prices: agriculture, beverages, food, and raw materials. Commodity price co-movement is strongly linked to business cycles and provides important information for policymakers (Byrne et al., 2013; Gospodinov and Ng, 2013; Alquist et al., 2020). ENSO shocks influence commodity prices, but their impacts are nonlinear (Brunner, 2002; Ubilava, 2018; Nam, 2021). Moreover, it is difficult to investigate them using time-series models that assume stationary data series (Campbell and Diebold, 2005; Nam, 2021). Thus, we employ the wavelet coherence analysis approach to measure nonlinear relationships in the time and frequency domains, allowing inclusion of non-stationary data, such as ENSO shocks. More importantly, we apply the PWC approach proposed by Mihanović et al. (2009) and detect a “pure” relationship by removing the effects of the interest rate, which is an important variable in commodity prices (Frankel, 2008).
We find that the correlations between ENSO shocks and commodity price returns, such as agriculture, food, and raw materials, are almost homogenous, while ENSO shocks have a weaker correlation with the return of beverages than with the other commodities. We observe that the high correlations were at lower frequencies (32–64 and 64–128 months) and occurred in two periods, 1968–1990 and from year 2000 onward. Furthermore, comparing the results of wavelet coherence and PWC, we see that the high correlations between 1968 and 1990 became weak and the high correlations from year 2000 onward became strong by eliminating the effects of the interest rate, suggesting a recent strong relationship between commodity prices and ENSO. This indicates that controlling for interest rate effects is substantial for capturing the relationships between commodity prices and ENSO shocks.
Our findings have important implications for policymakers regarding climate change risks. The high correlations occurred at low frequencies, indicating that policies and institutions need to counter the adverse effects of ENSO shocks in the long run. The recent strong correlation between primary commodity prices and climate risk suggests that governments must consider the impacts of climate risk more carefully.
Data Availability Statement
The data that support the findings of this study are available from the corresponding author upon reasonable request.
Author Contributions
XC: methodology, analysis of results, and writing. RS: conceptualization, writing, data collection, and review.
Funding
This work was supported by JSPS KAKENHI Grant Number 19K1373801.
Conflict of Interest
The authors declare that the research was conducted in the absence of any commercial or financial relationships that could be construed as a potential conflict of interest.
Publisher’s Note
All claims expressed in this article are solely those of the authors and do not necessarily represent those of their affiliated organizations, or those of the publisher, the editors and the reviewers. Any product that may be evaluated in this article, or claim that may be made by its manufacturer, is not guaranteed or endorsed by the publisher.
Supplementary Material
The Supplementary Material for this article can be found online at: https://www.frontiersin.org/articles/10.3389/fenvs.2022.893879/full#supplementary-material
Footnotes
1Fourth National Climate Assessment (globalchange.gov).
2Giglio et al. (2021) consider climate risk as disaster risk and construct a model that contains feedback loops between economic growth and climate disaster risk. Similarly, Engle et al. (2020) propose a dynamic hedging strategy for climate risk using textual analysis. Yuan and Yang (2020) explore how market uncertainty influences the carbon market.
3Pedersen et al., 2021 report that low carbon emission firms earn positive alphas.
4Recently, PWC is employed in the economics and finance literature (Aloui, et al., 2018; Wu et al., 2020).
5Some studies investigate ENSO impacts on prices of specific commodities: vegetable oil (Ubilava and Holt, 2013) and coffee (Ubilava, 2012; Bastianin et al., 2018).
6https://www.ncdc.noaa.gov/teleconnections/enso/soi.
7We use the Morlet wavelet function. For more details, see Grinsted et al. (2004).
8See details in Grinsted et al. (2004).
9
10See more details in Hu and Si (2021).
11For example, Bennetton et al. (1998) argue that hot and dry summer droughts increase the frequency and severity of wildfires, which in turn reduce the crop yields and the next wheat exports. Thus, it leads to higher world wheat prices.
12We employ a change in the interest rate due to obtain the stationary series and we observe a negative relationship with the raw data series.
13A rise in temperatures is linked to more frequent and severe disasters, which leads to unstable financial systems (Giuzio et al., 2019; Flori et al., 2021).
14ONI is multiplied by (-1) to ensure consistency with the SOI (a negative value of the SOI indicates El Niño events).
References
Addoum, J. M., Ng, D. T., and Ortiz-Bobea, A. (2020). Temperature Shocks and Establishment Sales. Rev. Financial Stud. 33, 1331–1366. doi:10.1093/rfs/hhz126
Aloui, C., Hkiri, B., Hammoudeh, S., and Shahbaz, M. (2018). A Multiple and Partial Wavelet Analysis of the Oil Price, Inflation, Exchange Rate, and Economic Growth Nexus in Saudi Arabia. Emerging Markets Finance and Trade 54, 935–956. doi:10.1080/1540496x.2017.1423469
Alquist, R., Bhattarai, S., and Coibion, O. (2020). Commodity-Price Comovement and Global Economic Activity. J. Monetary Econ. 112, 41–56. doi:10.1016/j.jmoneco.2019.02.004
Asness, C. S., Moskowitz, T. J., and Pedersen, L. H. (2013). Value and Momentum Everywhere. J. Finance 68, 929–985. doi:10.1111/jofi.12021
Ayres, J., Hevia, C., and Nicolini, J. P. (2020). Real Exchange Rates and Primary Commodity Prices. J. Int. Econ. 122, 103261. doi:10.1016/j.jinteco.2019.103261
Basak, S., and Pavlova, A. (2016). A Model of Financialization of Commodities. J. Finance 71, 1511–1556. doi:10.1111/jofi.12408
Bastianin, A., Lanza, A., and Manera, M. (2018). Economic Impacts of El Niño Southern Oscillation: Evidence from the Colombian Coffee Market. Agric. Econ. 49, 623–633. doi:10.1111/agec.12447
Bennetton, J., Cashin, P., Jones, D., and Soligo, J. (1998). An Economic Evaluation of Bushfire Prevention and Suppression. Aust. J. Agric. Resource Econ. 42 (2), 149–175. doi:10.1111/1467-8489.00042
Bolton, P., and Kacperczyk, M. (2021). Do investors Care about Carbon Risk? J. Financial Econ. 142, 517–549. doi:10.1016/j.jfineco.2021.05.008
Brunner, A. D. (2002). El Niño and World Primary Commodity Prices: Warm Water or Hot Air? Rev. Econ. Stat. 84, 176–183. doi:10.1162/003465302317332008
Bunde, A., Eichner, J. F., Kantelhardt, J. W., and Havlin, S. (2005). Long-Term Memory: A Natural Mechanism for the Clustering of Extreme Events and Anomalous Residual Times in Climate Records. Phys. Rev. Lett. 94, 048701. doi:10.1103/PhysRevLett.94.048701
Buyuksahin, B., and Robe, M. A. (2014). Speculators, Commodities and Cross-Market Linkages. J. Int. Money Finance 42, 38–70. doi:10.1016/j.jimonfin.2013.08.004
Byrne, J. P., Fazio, G., and Fiess, N. (2013). Primary Commodity Prices: Co-Movements, Common Factors and Fundamentals. J. Develop. Econ. 101, 16–26. doi:10.1016/j.jdeveco.2012.09.002
Byrne, J. P., Sakemoto, R., and Xu, B. (2020). Commodity Price Co-Movement: Heterogeneity and the Time-Varying Impact of Fundamentals. Eur. Rev. Agric. Econ. 47, 499–528. doi:10.1093/erae/jbz017
Cai, W., Wang, G., Dewitte, B., Wu, L., Santoso, A., Takahashi, K., et al. (2018). Increased Variability of Eastern Pacific El Niño under Greenhouse Warming. Nature 564, 201–206. doi:10.1038/s41586-018-0776-9
Cai, X. J., Tian, S., Yuan, N., and Hamori, S. (2017). Interdependence between Oil and East Asian Stock Markets: Evidence from Wavelet Coherence Analysis. J. Int. Financial Markets, Institutions Money 48, 206–223. doi:10.1016/j.intfin.2017.02.001
Campbell, S. D., and Diebold, F. X. (2005). Weather Forecasting for Weather Derivatives. J. Am. Stat. Assoc. 100, 6–16. doi:10.1198/016214504000001051
Cashin, P., Mohaddes, K., and Raissi, M. (2017). Fair Weather or Foul? The Macroeconomic Effects of El Niño. J. Int. Econ. 106, 37–54. doi:10.1016/j.jinteco.2017.01.010
Chatzopoulos, T., Pérez Domínguez, I., Zampieri, M., and Toreti, A. (2020). Climate Extremes and Agricultural Commodity Markets: A Global Economic Analysis of Regionally Simulated Events. Weather Clim. Extremes 27, 100193. doi:10.1016/j.wace.2019.100193
Choi, D., Gao, Z., and Jiang, W. (2020). Attention to Global Warming. Rev. Financial Stud. 33, 1112–1145. doi:10.1093/rfs/hhz086
Clarida, R., Gali, J., and Gertler, M. (2000). Monetary Policy Rules and Macroeconomic Stability: Evidence and Some Theory. Q. J. Econ. 115, 147–180. doi:10.1162/003355300554692
Colacito, R., Hoffmann, B., and Phan, T. (2019). Temperature and Growth: A Panel Analysis of the United States. J. Money, Credit Banking 51, 313–368. doi:10.1111/jmcb.12574
Conlon, T., Cotter, J., and Gençay, R. (2018). Long-Run Wavelet-Based Correlation for Financial Time Series. Eur. J. Oper. Res. 271, 676–696. doi:10.1016/j.ejor.2018.05.028
Dew-Becker, I., and Giglio, S. (2016). Asset Pricing in the Frequency Domain: Theory and Empirics. Rev. Financ. Stud. 29, 2029–2068. doi:10.1093/rfs/hhw027
Engle, R. F., Giglio, S., Kelly, B., Lee, H., and Stroebel, J. (2020). Hedging Climate Change News. Rev. Financial Stud. 33, 1184–1216. doi:10.1093/rfs/hhz072
Erb, C. B., and Harvey, C. R. (2006). The Strategic and Tactical Value of Commodity Futures. Financial Analysts J. 62, 69–97. doi:10.2469/faj.v62.n2.4084
Fernández, A., González, A., and Diego, R. (2018). Sharing a Ride on the Commodities Roller Coaster: Common Factors in Business Cycles of Emerging Economies. J. Int. Econ. 111, 99–121. doi:10.1016/j.jinteco.2017.11.008
Fernández, A., Schmitt-Grohé, S., and Uribe, M. (2017). World Shocks, World Prices, and Business Cycles: An Empirical Investigation. J. Int. Econ. 108, S2–S14. doi:10.1016/j.jinteco.2017.01.001
Fernandez-Perez, A., Fuertes, A-M., and Miffre, J. (2017). Commodity Markets, Long-Run Predictability, and Intertemporal Pricing. Rev. Finance 21, 1159–1188. doi:10.1093/rof/rfw034
Flori, A., Pammolli, F., and Spelta, A. (2021). Commodity Prices Co-Movements and Financial Stability: A Multidimensional Visibility Nexus with Climate Conditions. J. Financial Stab. 54, 100876. doi:10.1016/j.jfs.2021.100876
Frankel, J. (2008). “The Effect of Monetary Policy on Real Commodity Prices,” in Asset Prices and Monetary Policy (Chicago: University of Chicago Press), 291–333.
Gençay, R., Selçuk, F., and Whitcher, B. (2005). Multiscale Systematic Risk. J. Int. Money Finance 24, 55–70. doi:10.1016/j.jimonfin.2004.10.003
Giglio, S., Maggiori, M., Rao, K., Stroebel, J., and Weber, A. (2021). Climate Change and Long-Run Discount Rates: Evidence from Real Estate. Rev. Financial Stud. 34, 3527–3571. doi:10.1093/rfs/hhab032
Giuzio, M., Krusec, D., Levels, A., Melo, A. S., Mikkonen, K., and Radulova, P. (2019). Climate Change and Financial Stability.Climate Change and Financial Stability (europa.eu): Financial Stability Review.
Gorton, G., and Rouwenhorst, K. G. (2006). Facts and Fantasies about Commodity Futures. Financial Analysts J. 62, 47–68. doi:10.2469/faj.v62.n2.4083
Gospodinov, N., and Ng, S. (2013). Commodity Prices, Convenience Yields, and Inflation. Rev. Econ. Stat. 95, 206–219. doi:10.1162/rest_a_00242
Grinsted, A., Moore, J. C., and Jevrejeva, S. (2004). Application of the Cross Wavelet Transform and Wavelet Coherence to Geophysical Time Series. Nonlin. Process. Geophys. 11, 561–566. doi:10.5194/npg-11-561-2004
Handler, P., and Handler, E. (1983). Climatic Anomalies in the Tropical Pacific Ocean and Corn Yields in the United States. Science 220, 1155–1156. doi:10.1126/science.220.4602.1155
Hasbrouck, J. (2018). High-Frequency Quoting: Short-Term Volatility in Bids and Offers. J. Financ. Quant. Anal. 53, 613–641. doi:10.1017/s0022109017001053
Hong, H., Li, F. W., and Xu, J. (2019). Climate Risks and Market Efficiency. J. Econom. 208, 265–281. doi:10.1016/j.jeconom.2018.09.015
Hsiang, S. M., and Meng, K. C. (2015). Tropical Economics. Am. Econ. Rev. 105, 257–261. doi:10.1257/aer.p20151030
Hu, W., and Si, B. (2021). Technical Note: Improved Partial Wavelet Coherency for Understanding Scale-Specific and Localized Bivariate Relationships in Geosciences. Hydrol. Earth Syst. Sci. 25, 321–331. doi:10.5194/hess-25-321-2021
Iizumi, T., Luo, J.-J., Challinor, A. J., Sakurai, G., Yokozawa, M., Sakuma, H., et al. (2014). Impacts of El Niño Southern Oscillation on the Global Yields of Major Crops. Nat. Commun. 5, 3712. doi:10.1038/ncomms4712
In, F., and Kim, S. (2006). The Hedge Ratio and the Empirical Relationship between the Stock and Futures Markets: A New Approach Using Wavelet Analysis. J. Bus 79, 799–820. doi:10.1086/499138
Koijen, R. S. J., Moskowitz, T. J., Pedersen, L. H., and Vrugt, E. B. (2018). Carry. J. Financial Econ. 127, 197–225. doi:10.1016/j.jfineco.2017.11.002
Lenssen, N. J. L., Goddard, L., and Mason, S. (2020). Seasonal Forecast Skill of ENSO Teleconnection Maps. Weather Forecast. 35, 2387–2406. doi:10.1175/waf-d-19-0235.1
Mason, S. J., and Goddard, L. (2001). Probabilistic Precipitation Anomalies Associated with ENSO. Bull. Amer. Meteorol. Soc. 82, 619–638. doi:10.1175/1520-0477(2001)082<0619:ppaawe>2.3.co;2
Mihanović, H., Orlić, M., and Pasarić, Z. (2009). Diurnal Thermocline Oscillations Driven by Tidal Flow Around an Island in the Middle Adriatic. J. Mar. Syst. 78, S157–S168. doi:10.1016/j.jmarsys.2009.01.021
Nam, K. (2021). Investigating the Effect of Climate Uncertainty on Global Commodity Markets. Energ. Econ. 96, 105123. doi:10.1016/j.eneco.2021.105123
Ng, E. K. W., and Chan, J. C. L. (2012). Geophysical Applications of Partial Wavelet Coherence and Multiple Wavelet Coherence. J. Atmos. Oceanic Technol. 29, 1845–1853. doi:10.1175/jtech-d-12-00056.1
Ortu, F., Tamoni, A., and Tebaldi, C. (2013). Long-Run Risk and the Persistence of Consumption Shocks. Rev. Financ. Stud. 26, 2876–2915. doi:10.1093/rfs/hht038
Pedersen, L. H., Fitzgibbons, S., and Pomorski, L. (2021). Responsible Investing: The ESG-Efficient Frontier. J. Financial Econ. 142, 572–597. doi:10.1016/j.jfineco.2020.11.001
Pindyck, R. S., and Rotemberg, J. J. (1990). The Excess Co-Movement of Commodity Prices. Econ. J. 100, 1173–1189. doi:10.2307/2233966
Power, S., Lengaigne, M., Capotondi, A., Khodri, M., Vialard, J., Jebri, B., et al. (2021). Decadal Climate Variability in the Tropical Pacific: Characteristics, Causes, Predictability, and Prospects. Science 374, eaay9165. doi:10.1126/science.aay9165
Ray, S., and Giese, B. S. (2012). Historical Changes in El Niño and La Niña Characteristics in an Ocean Reanalysis. J. Geophys. Res. 117, 11077. doi:10.1029/2012jc008031
Rua, A., and Nunes, L. C. (2009). International Comovement of Stock Market Returns: A Wavelet Analysis. J. Empirical Finance 16, 632–639. doi:10.1016/j.jempfin.2009.02.002
Sakemoto, R. (2020). Multi-Scale Inter-Temporal Capital Asset Pricing Model. Int. J. Finance Econ. forthcoming. doi:10.1002/ijfe.2372
Singleton, K. J. (2014). Investor Flows and the 2008 Boom/Bust in Oil Prices. Manage. Sci. 60, 300–318. doi:10.1287/mnsc.2013.1756
Tang, K., and Xiong, W. (2012). Index Investment and the Financialization of Commodities. Financial Analysts J. 68, 54–74. doi:10.2469/faj.v68.n6.5
Torrence, C., and Compo, G. P. (1998). A Practical Guide to Wavelet Analysis. Bull. Am. Meteorol. Soc. 79, 605–618. doi:10.1175/1520-0477(1998)079<0061:apgtwa>2.0.co;2
Torrence, C., and Webster, P. J. (1999). Interdecadal Changes in the ENSO-Monsoon System. J. Clim. 12, 2679–2690. doi:10.1175/1520-0442(1999)012<2679:icitem>2.0.co;2
Ubilava, D. (2012). El Niño, La Niña, and World Coffee price Dynamics. Agric. Econ. 43, 17–26. doi:10.1111/j.1574-0862.2011.00562.x
Ubilava, D., and Holt, M. (2013). El Niño Southern Oscillation and its Effects on World Vegetable Oil Prices: Assessing Asymmetries Using Smooth Transition Models. Aust. J. Agric. Resour. Econ. 57, 273–297. doi:10.1111/j.1467-8489.2012.00616.x
Ubilava, D. (2017). The ENSO Effect and Asymmetries in Wheat price Dynamics. World Develop. 96, 490–502. doi:10.1016/j.worlddev.2017.03.031
Ubilava, D. (2018). The Role of El Niño Southern Oscillation in Commodity Price Movement and Predictability. Am. J. Agric. Econ. 100, 239–263. doi:10.1093/ajae/aax060
West, K. D., and Wong, K.-F. (2014). A Factor Model for Co-Movements of Commodity Prices. J. Int. Money Finance 42, 289–309. doi:10.1016/j.jimonfin.2013.08.016
Wu, K., Zhu, J., Xu, M., and Yang, L. (2020). Can Crude Oil Drive the Co-Movement in the International Stock Market? Evidence from Partial Wavelet Coherence Analysis. North Am. J. Econ. Finance 53, 101194. doi:10.1016/j.najef.2020.101194
Yang, L., and Hamori, S. (2021). The Role of the Carbon Market in Relation to the Cryptocurrency Market: Only Diversification or More. Int. Rev. Financial Anal. 72, 101594. doi:10.1016/j.irfa.2021.101864
Yang, L. (2022). Idiosyncratic Information Spillover and Connectedness Network between the Electricity and Carbon Markets in Europe. J. Commodity Markets 25, 100185. doi:10.1016/j.jcomm.2021.100185
Yang, L., and Xu, H. (2021). Climate Value at Risk and Expected Shortfall for Bitcoin Market. Clim. Risk Manage. 32 (5), 100310. doi:10.1016/j.crm.2021.100310
Keywords: climate risk, commodity prices, partial wavelet coherence, El Niño, ENSO
Citation: Cai X and Sakemoto R (2022) El Niño and Commodity Prices: New Findings From Partial Wavelet Coherence Analysis. Front. Environ. Sci. 10:893879. doi: 10.3389/fenvs.2022.893879
Received: 11 March 2022; Accepted: 01 April 2022;
Published: 16 May 2022.
Edited by:
Xiao-Guang Yue, European University Cyprus, CyprusCopyright © 2022 Cai and Sakemoto. This is an open-access article distributed under the terms of the Creative Commons Attribution License (CC BY). The use, distribution or reproduction in other forums is permitted, provided the original author(s) and the copyright owner(s) are credited and that the original publication in this journal is cited, in accordance with accepted academic practice. No use, distribution or reproduction is permitted which does not comply with these terms.
*Correspondence: Xiaojing Cai, Y2FpY2FpQG9rYXlhbWEtdS5hYy5qcA==