 Irene Marzolff
 Mario Kirchhoff
 Robin Stephan1
 Manuel Seeger
- 1Department of Physical Geography, Goethe University Frankfurt am Main, Frankfurt am Main, Germany
- 2Department of Physical Geography, Trier University, Trier, Germany
- 3Department of Geography, Ibn Zohr University, Agadir, Morocco
Monitoring woody cover by remote sensing is considered a key methodology towards sustainable management of trees in dryland forests. However, while modern very high resolution satellite (VHRS) sensors allow woodland mapping at the individual tree level, the historical perspective is often hindered by lack of appropriate image data. In this first study employing the newly accessible historical HEXAGON KH-9 stereo-panoramic camera images for environmental research, we propose their use for mapping trees in open-canopy conditions. The 2–4 feet resolution panchromatic HEXAGON satellite photographs were taken 1971–1986 within the American reconnaissance programs that are better known to the scientific community for their lower-resolution CORONA images. Our aim is to evaluate the potential of combining historical CORONA and HEXAGON with recent WorldView VHRS imagery for retrospective woodland change mapping on the tree level. We mapped all trees on 30 1-ha test sites in open-canopy argan woodlands in Morocco in the field and from the VHRS imagery for estimating changes of tree density and size between 1967/1972 and 2018. Prior to image interpretation, we used simulations based on unmanned aerial system (UAS) imagery for exemplarily examining the role of illumination, viewing geometry and image resolution on the appearance of trees and their shadows in the historical panchromatic images. We show that understanding these parameters is imperative for correct detection and size-estimation of tree crowns. Our results confirm that tree maps derived solely from VHRS image analysis generally underestimate the number of small trees and trees in clumped-canopy groups. Nevertheless, HEXAGON images compare remarkably well with WorldView images and have much higher tree-mapping potential than CORONA. By classifying the trees in three sizes, we were able to measure tree-cover changes on an ordinal scale. Although we found no clear trend of forest degradation or recovery, our argan forest sites show varying patterns of change, which are further analysed in Part B of our study. We conclude that the HEXAGON stereo-panoramic camera images, of which 670,000 worldwide will soon be available, open exciting opportunities for retrospective monitoring of trees in open-canopy conditions and other woody vegetation patterns back into the 1980s and 1970s.
1 Introduction
Open-canopy woodlands cover around 30 percent of the world’s drylands (FAO, 2019). Trees outside of closed-canopy conditions grow in savannah and dry woodland ecoregions, on rangeland and farmland in silvo-pastoral or agroforestry systems and sparsely scattered as desert woodlands. They contribute significantly to rural livelihoods, carbon storage, dryland biodiversity, watershed protection, desertification control and numerous other ecosystem services (Chidumayo and Gumbo, 2010; Hanan et al., 2021). Dryland forests and woodlands are under increasing anthropogenic pressure such as livestock overgrazing and browsing, coppicing and cutting for fuelwood and charcoal production and conversion into agricultural land or managed forests (Chidumayo and Gumbo, 2010; Gaisberger et al., 2017; FAO, 2019). They are also vulnerable to climate change, as water availability in most drylands is expected to decline further by long-term increases in temperature, changing precipitation patterns and increasing depletion of water resources (Mirzabaev et al., 2019; Hanan et al., 2021).
In the context of global change and the UN’s Sustainable Development Goals, mapping and monitoring the deforestation and degradation of dryland forests is of high importance. And yet, open-canopy woodlands are not well represented in global maps and data products on woody biomass, tree cover and forest change (Bastin et al., 2017; Brandt et al., 2018; Fagan, 2020). The low density and scattered nature of trees and the highly variable contrast with the appearance of intertree areas, which range from bare desert soils to dense crops, make it difficult to detect forests with open canopy structures in 10–30 m-resolution remote sensing imagery. This leads to their exclusion or lack of representation in widely-used datasets such as the Global Forest Change Map by Hansen et al. (2013), the Global Forest Cover Change Map by Sexton et al. (2013) or the Global Palsar Forest Map by Shimada et al. (2014). Mapping forest degradation and quantifying different types of disturbances is even more difficult, since degradation may lead to structural changes on the individual tree level rather than canopy cover changes (Gao et al., 2020).
Several recent studies on dryland forests have therefore resorted to aerial imagery or very high resolution satellite (VHRS) imagery (∼0.5–2 m spatial resolution) from the commercial Quickbird, WorldView and GeoEye satellites that are suitable for mapping open-canopy woodlands on the individual tree level. For example, object-based and segmentation approaches were used for delineating tree crowns from aerial images in deserts (Isaacson et al., 2017; Silver et al., 2019) and from VHRS imagery in savannahs (Axelsson and Hanan, 2017). Moreover, object-based and machine learning approaches were found suitable for mapping different tree species in semi-arid agroforestry parklands (Karlson et al., 2016; Lelong et al., 2020). Brandt et al. (2020) used deep learning to map 1.8 billion trees in a wall-to-wall map of African open-canopy woodlands, and Bastin et al. (2017) mapped trees in 210,000 sample plots across the world’s drylands by visual interpretation of VHRS imagery. Most of these authors found VHRS-based approaches capable of mapping individual trees >2 m diameter/> 3 m2, but prone to errors for smaller trees and clumped canopies, which are usually found to be separable to a limited degree only.
Modern very high resolution sensors (available since ∼ year 2000) together with the foreseeable advancements in canopy-classification algorithms thus have a huge potential for individual tree mapping on regional to global scale and for changing our view of woody-plant ecosystems (Hanan and Anchang, 2020). However, sustainable management of dryland forests and woodlands requires data not only on current canopy cover, but also about their development during and beyond the lifetime of individual trees—particularly so in regions with high anthropogenic impact. Forest degradation is a gradual progress, and individual crown-size changes and patterns of dieback, felling, regeneration or planting over time may give important clues for understanding the state of woodlands today. To this end, analogue remote sensing photos reaching back into the 20th century provide an excellent yet challenging information source for monitoring changes on the tree level.
The highest available spatial resolutions are provided by standard aerial photographs (APs) taken for topographic mapping throughout the world, beginning with World War I and increasingly since the 1950s. During the 20th century Colonial Era, APs were for example acquired over large parts of Africa, mostly by French, British and Belgian military forces or national mapping agencies. Unfortunately, only very few of these are available through digital archives (Fradley, 2021; Nyssen et al., 2021), analogue prints are often not or very difficult to get from today’s responsible authorities, and the original material is greatly threatened by chemical degradation (Michel, 2018). A more globally available alternative are analogue satellite photos of the American cold-war reconnaissance programs (described in more detail in Section 2). Among these, the 6–9 feet resolution CORONA KH-4 images have become valuable for environmental and cultural history research, since they cover much larger extents than APs and may be ordered conveniently through digital archives. The latest addition to these data collections are the 2–4 feet resolution HEXAGON KH-9 images taken from 1971 to 1986, which are in the focus of our study.
Regrettably, the need for manual georeferencing and the complex geometric distortions make the use of historical aerial or satellite photography for regional or large-area studies laborious. Also, the lack of spectral resolution and radiometry calibration of the panchromatic films inhibit automated classification approaches (cf. Fensham et al., 2002). Therefore, visual interpretation of changes in tree counts is the most common method employed in monitoring woodlands on the tree-level (Schlesinger and Gramenopoulos, 1996; Gonzalez et al., 2012; le Polain de Waroux and Lambin, 2012; Usman and Nichol, 2018). The lower size limit for tree detection differs between studies, since the spatial resolution and radiometric quality of historical AP and VHRS images varies considerably. Some authors found black-and-white AP also suitable for tree-crown delineation (and thus calculation of percentage woody cover; Lahav-Ginott et al., 2001; Moustakas et al., 2006), but this is not feasible with the lower-resolution CORONA VHRS images (Dendoncker et al., 2020). Although various studies use CORONA images for mapping forest-ecosystem changes (e.g., Tappan et al., 2004; Frost and Epstein, 2014; Nita et al., 2018), quantification of woody cover change on the tree level is rarely achieved. The most comprehensive work on limitations and potential of tree detection in CORONA images was done by Andersen (2006); (Andersen and Krzywinski, 2007), who is one of the few authors scrutinizing the inhibiting role of shadows for canopy measurements from panchromatic images. She has, however, not investigated how the shadowing problem may be overcome for enabling accurate tree-cover quantification.
In summary, we believe that a gap of historical data for mapping woodland change existed until recently between small-area, higher-resolution APs (suitable for tree size estimation) and large-area, lower-resolution VHRS photographs (suitable for detection of larger trees). This paper addresses the question if the newly accessible historical HEXAGON VHRS images are capable of closing this gap. To this end, we aim to evaluate the potential of combining historical and recent VHRS imagery for mapping woodland change on the tree-level, using the case of open-canopy Argania spinosa forests in South Morocco. Specifically, we aim at:
(i) examining the role of illumination, viewing geometry and image resolution on the appearance of trees in two different types of historical panchromatic VHRS (CORONA and HEXAGON) imagery by using simulations based on unmanned aerial system (UAS) images;
(ii) investigating the recognizability of individual trees in the historical and recent VHRS imagery for tree-density change mapping;
(iii) exploring the feasibility of crown-size classification and thus tree-cover change mapping based on these images.
This paper is part A of our research on tree-cover changes in argan woodlands of South Morocco and results in a tree-changes database for 30 test sites. Part B of our study (Kirchhoff et al., 2022) focusses on utilising this dataset to evaluate deforestation, degradation and recovery processes of the argan forest sites.
2 Availability and Characteristics of HEXAGON vs CORONA VHRS Imagery
Following World War II, the United States initiated a series of satellite reconnaissance programs that operated throughout the period of the Cold War. Between 1959 and 1986, the CORONA, ARGON, LANYARD, GAMBIT and HEXAGON programs encompassed approx. 150 successful missions of a few weeks to few months each. More than 1.5 million photographs were acquired and retrieved from orbit in hundreds of “film buckets” via a re-entry capsule (Wheelon, 1997; McDonald and Widlake, 2012; USGS, 2018a; USGS, 2018b; USGS, 2018c). Classified as top secret for decades, the images have become declassified in several steps in 1995, 2002 and 2011, releasing a breathtaking resource of historical Earth observation data to the civilian community. The ingestion of image records including browse imagery into online accessible digital archives and ordering systems, however, is not yet completed.
Today, there are three main archives providing access to these data: 1) The National Archives and Records Administration (NARA) holds the original film and hard copies of the technical mission-related documents for onsite inspection; 2) the National Reconnaissance Office (NRO) provides online access to scans of technical documents—such as specification sheets, handbooks and mission reports—processed under the Freedom of Information Act (FOIA), and 3) scans of the satellite photographs may be ordered for US$ 30 each through the EarthExplorer portal of the Earth Resources Observation and Science Center of the United States Geological Survey (USGS EROS)1. The CORONA images and lower-resolution mapping-camera HEXAGON images2 have been available from the USGS web portals for about 20 and 10 years, respectively. Online access to the high-resolution panoramic-camera HEXAGON images used in this study has begun only in summer 2020 (R. Longhenry, USGS, pers. comm.), and the ingestion process of over 670,000 images with 2–4 feet resolution is still ongoing at the time of writing.
A variety of different camera systems, usually identified by their satellite codenames KH-1 to KH-9, was used in the CORONA to HEXAGON programs (Perry, 1973a; Perry, 1973b; Oder et al., 1988; Oder et al., 1992; Dashora et al., 2007). They mostly comprised several cameras with different viewing perspectives and focal lengths. The highest ground resolutions (or ground resolved distances GRD), which are suitable for tree-level mapping, were achieved by the stereo-panoramic cameras of the CORONA KH-4a, KH-4b, HEXAGON KH-9 missions and the monoscopic cameras of GAMBIT KH-7 and KH-8 (Table 1). While the GAMBIT missions focussed on small target areas, CORONA and above all HEXAGON covered much larger areas worldwide. The geometry and cross-track scanning operation of the stereo camera systems result in complex variations of geometric distortion (Sohn et al., 2004; Scollar et al., 2016), spatial resolution, radial displacement of relief and high objects, and illumination across each image. Figure 1 and Table 2 summarize important characteristics of the cameras and images used in this study based on information taken from declassified technical documents or reconstructed from our image data.
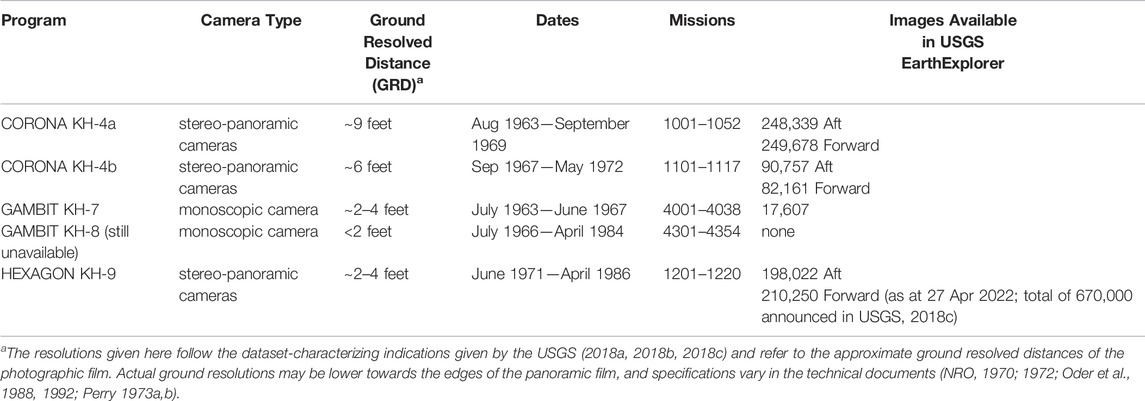
TABLE 1. Overview of very high resolution historical imagery from United States satellite reconnaissance programs featuring resolutions suitable for tree-level mapping (based on Perry, 1973a; McDonald and Widlake 2012; USGS, 2018a; USGS, 2018b; USGS, 2018c and own research). Scans of the analogue photographs are available through the USGS EarthExplorer for US$ 30 each at first-time order, and may be downloaded free of charge for subsequent users.
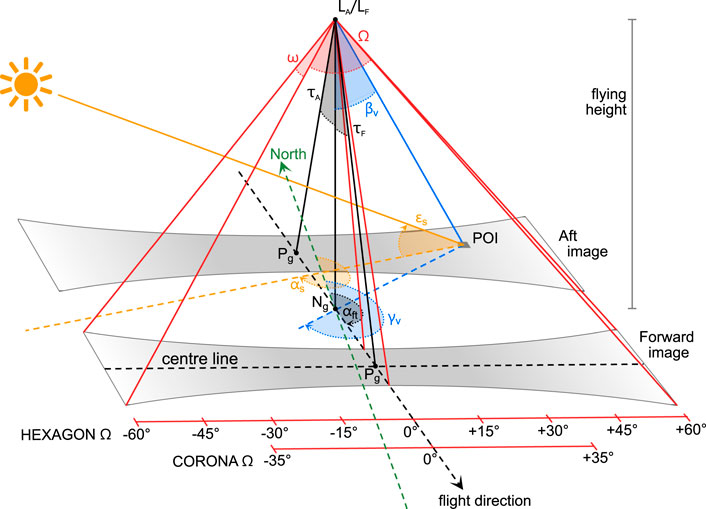
FIGURE 1. Schematic diagram of images taken with the stereo-panoramic cameras of the CORONA and HEXAGON programs, showing exemplary image footprints of the maximum possible 120° HEXAGON scan width. Forward diagram shows image geometry; LA/LF: exposure stations of dual camera system; Ω: across-track camera field of view; ω: along-track camera field of view; τA/τF: camera tilt angle against/towards flight direction; αft: azimuth of flight track towards North; Ng: ground nadir point (vertical projection of L onto the ground); Pg: ground principal point (projection of optical image centre on the ground). Aft diagram shows illumination geometry; POI: given point of interest, αS: sun azimuth; εS: sun elevation; γν: horizontal viewing angle, βν: vertical viewing angle. Note the colour codes for sun angles (orange) and viewing angles (blue), which are used again in arrows of Figures 3–5.
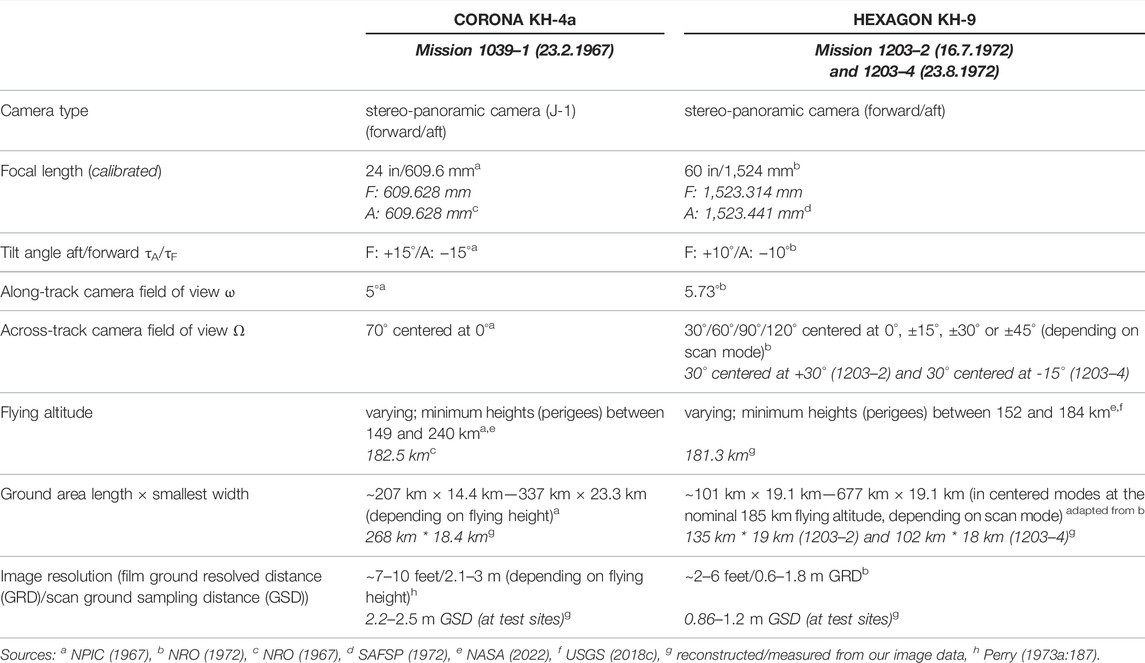
TABLE 2. Characteristics of CORONA KH-4a and HEXAGON KH-9 stereo-panoramic camera systems and images. Italic entries are parameters that are specific to the data in this study and not generally applicable for all KH-4a and KH-9 images.
The CORONA KH-4a (as well as KH-4b) and HEXAGON KH-9 systems each comprise two cameras tilted forward and backward (aft) along the flight track to provide stereo coverage. Each film strip is 5–6° wide and exposed during an across-track scanning motion (similar to opto-mechanical “whiskbroom” satellite scanners such as for LANDSAT 1–7 MSS/TM/ETM or AQUA/TERRA MODIS). While the across-track viewing angle is fixed with the CORONA cameras at 35° to the left and right of the track, it varies for the HEXAGON images. Here, the programmed camera field of view—30°, 60°, 90° or 120°—could be centred at 0°, 15°, 30° or 45° to the left or right of the flight track. This results in large differences of image footprint sizes and shapes for the HEXAGON imagery. Deviating from the simplified schematic diagram in Figure 1, non-centred modes result in asymmetrically curved footprints. The chosen HEXAGON mode as well as 5° scan-angle marks are recorded on the edge of the film frame (NRO, 1972). The scan mode is not (or not yet) part of the metadata reported in the USGS EarthExplorer system; the only possibility to roughly judge the scan width and centre position of an image prior to ordering is to inspect the size and shape of the simplified (trapezoidal) footprint.
The orbital characteristics of the CORONA and HEXAGON missions vary. Most missions used an elliptical near-polar orbit, which could be flexibly adjusted but usually had its perigee (lowest orbit point that resulted in the highest image resolution) over the latitudes of the “Sino-Soviet Bloc” (Oder et al., 1992). The routinely used altitude is 185 km (100 nautical miles; McDonald and Widlake, 2012; Perry, 1973a), but the perigees vary between 149 and 240 km (see orbital details for each mission in NASA, 2022). During each revolution, the cameras were switched on for short periods of time over the target regions. Since the purpose of the imagery was military reconnaissance, the acquisition was preferably timed for low sun angles: Long shadows were desirable as they enable to interpret and calculate shapes and heights of buildings (cf. Hall, 2003; McDonald and Widlake, 2012). The exact UTC times with start and end coordinates including altitudes of the imaging flight tracks were recorded, along with other details of the orbit and cameras, in a flight data book or mission profile report. However, these documents have so far been declassified by NRO FOIA for a few missions only (e.g., NRO, 1967). In the case of our study, we had to reconstruct the acquisition time and flying altitude for the HEXAGON data from the imagery themselves (see Section 4).
3 Study Area
The open-canopy forests formed by the endemic argan tree (Argania spinosa) in South Morocco are well suited for our study on tree-level change mapping based on VHRS imagery, since they are dominated by a single tree species with varying distribution patterns and tree architecture. This slow-growing tree, which may easily reach more than 200 years of age, is well adapted to aridity and drought. Its leaf-flushing and leaf-fall phenology is highly variable depending on water availability and drought and also differs strongly between tree genotypes. While some trees may get completely defoliated during dry periods, others may keep all or part of their leaves even during longer droughts (Zahidi et al., 2013). The argan woodlands are the basis of a traditional agro-silvopastoral system involving rain-fed agriculture, pasturing of goats, sheep and camels, and oil production (Lybbert et al., 2011; Msanda et al., 2021). Due to the high grazing pressure, the trees show various morphological traits and growth forms that are strongly related to browsing intensity (see Kirchhoff et al., 2022). Widespread clearing of the once ubiquitous argan forests has been undertaken in the 12th to 17th century and again in the 20th century (Morton and Voss, 1987; Aït Hssaine, 2002; le Polain de Waroux and Lambin, 2012). The remaining argan woodlands have continued to decline due to firewood extraction, charcoal-making, overgrazing and soil degradation. Numerous studies suggest that tree density and canopy cover have been generally decreasing for the last 200 years. However, with the exception of the study by le Polain de Waroux and Lambin (2012), there is little quantitative and spatially explicit information about these forest-cover dynamics.
We chose three study areas in the Souss Basin in South Morocco (30–31° N, 7–9° W): Taroudant and Ida-Outanane in the southern foothills of the High Atlas and Aït Baha in the northern foothills of the Anti-Atlas (Figure 2). These study areas differ in the geologies of the High Atlas and the Anti-Atlas Mountains and in climate from maritime to more continental due to their varying proximity to the Atlantic Ocean. The annual precipitation rates range from an average 220 mm at Taroudant and 300 mm at Aït Baha to nearly 400 mm at Ida-Outanane with the most chance of rainfall in the late autumn to early spring, but the interannual variability is very high (Kirchhoff et al., 2019). To encompass varying land uses, altitudes, slope positions and tree densities, 30 test sites of 1 ha each were selected in these three study areas. The sites differed in the following characteristics: afforestation or reforestation sites (a); excessively browsed sites leading to cone-shaped growth of trees/bushes (b); recent or former crop cultivation (c); high canopy density due to large crowns or a high number of trees (d); incised by gully erosion (g); sites that were logged in the past with only few trees left (l); typical silvopastoral usage but otherwise nonspecific (n); high rock fragment cover (r); steep slopes >10° (s); terraced (t); sites under grazing exclusion (x). Each test site may have several of these attributes, but we mostly chose neighbouring sites contrasting in one of them; the most salient attribute is recorded as suffix in the test site codes. For more details, see Kirchhoff et al. (2022) and Supplementary Table S1.
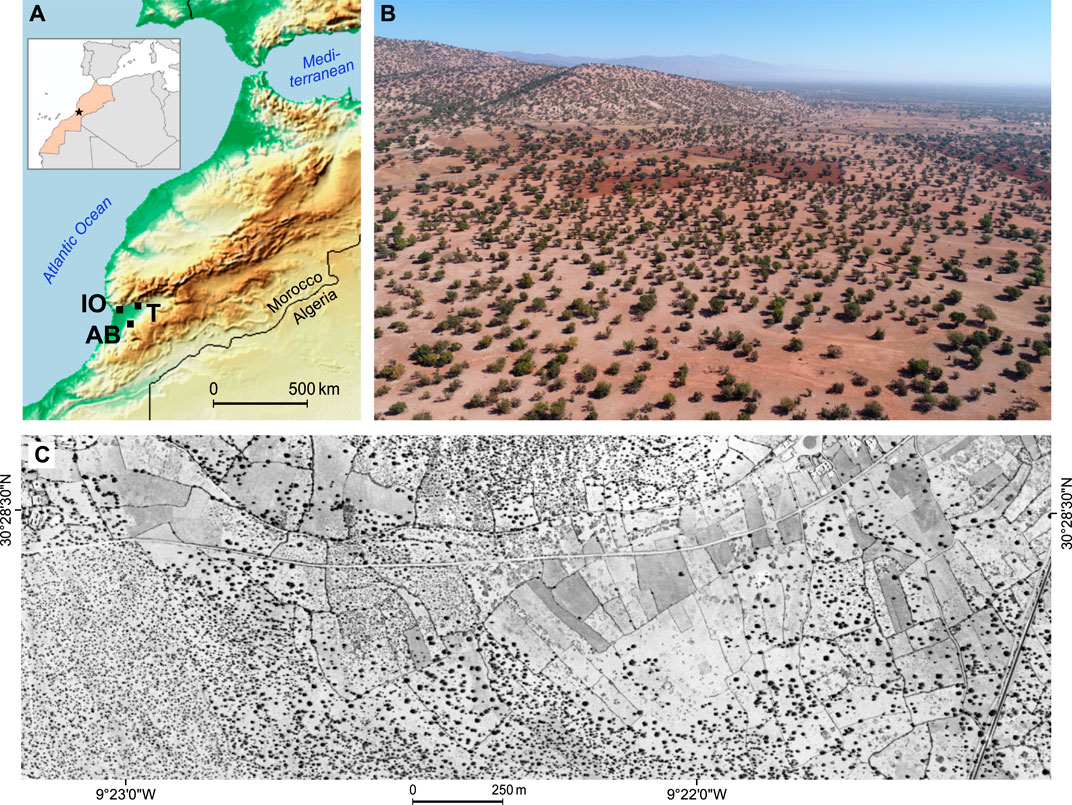
FIGURE 2. (A) The location of the study areas Ida-Outanane (IO), Aït Baha (AB) and Taroudant (T) in the Souss Basin, Morocco. (B) View towards east over argan forests in the foothills of the High Atlas Mountains (Ida-Outanane study area); oblique UAS image of March 2019. Part of the area in the middle distance has been freshly ploughed for cereal cultivation, while the woodlands in the foreground are used as silvopasture. The area is classified as “0% trees” in the 2015 Global Forest Cover Change Map (Sexton et al., 2013). (C) View of the same area in HEXAGON KH-9 stereo-panoramic satellite photograph, 16 July 1972 (subset of image ID D3C1203-200152A016, georeferenced).
4 Image Material and Preprocessing
Since the argan-tree phenology reacts strongly on precipitation and temperature variations, precise timing of satellite imagery for leaves-on conditions is difficult, especially given the low temporal resolution of VHRS imagery. In average years, the highest foliage cover can be expected between March and June (Zahidi et al., 2013). Since no historical precipitation data were available for our study area and only few dates of historical VHRS images, we had to rely on image dates closest to the average humid season to ensure good contrast between tree crowns and intertree areas. The following image data and their derivatives were used in this study (see also Supplementary Table S2):
4.1 CORONA Satellite Images of 1967
Via the USGS EarthExplorer portal, we acquired scans of panchromatic satellite photos taken with the stereo-panoramic KH-4a camera at 23 February 1967 during CORONA mission 1039. The 2.76 inch × 29.8 inch negatives were scanned on demand with 3,600 dpi by USGS EROS in four parts and delivered as non-georeferenced TIF files.
We georectified each image file to the orthorectified WorldView images using ESRI ArcGIS Desktop 10.8 (ESRI Inc., Redlands CA, United States) in a two-step-approach: The entire image was georectified first using 10–15 well-distributed ground control points (e.g., small, well-defined trees, corners of buildings, road junctions). 10–30 additional control points were then placed around and within each of our test sites to increase local accuracy. A piecewise polynomial transformation (spline) was chosen, which is an exact transformation method and results in zero residual error. The quality of the co-registration with the WorldView imagery was assessed visually. It was not possible to achieve a precise matching of each tree crown, since crown and shadow mostly merge into one dark tree spot and because the radial displacement of the crown varies with local viewing angle and tree height (see also Section 5.1). Due to the panoramic film camera geometry, the spatial resolution or ground sampling distance (GSD) of the scanned CORONA images varies at our test sites between 2.2 and 2.5 m from west to east. We reconstructed the positions of the image nadir points from the known camera tilt angles and principal-point positions of the georeferenced images. The flying height and precise time of image acquisition was given in the mission’s flight data book (NRO 1967). We then calculated the viewing angles and illumination angles given in the following sections from the geometrical relationships shown in Figure 1 and using the online SunCalc tool (www.suncalc.org). More information on reconstructing and calculating these parameters is given in Supplementary Workflow S1 and Supplementary Workflow S2.
4.2 HEXAGON Satellite Images of 1972
On-demand scans of panchromatic satellite photos taken with the stereo-panoramic KH-9 camera at 16 July 1972 and 23 August 1972 during HEXAGON mission 1203 were also acquired from USGS EROS. The scanning and georectifying procedures of the images were the same as for the CORONA images. As no flight data book has been declassified for this mission, we determined the time of day by comparing shadow direction of selected high buildings with sun azimuth given for the location in the SunCalc tool. Using the geometrical relationships shown in Figure 1, we reconstructed the flying height from the lengths of the georeferenced image strips and subsequently calculated the positions of the nadir points, viewing angles and illumination angles (see also Supplementary Workflow S1 and Supplementary Workflow S2). The spatial resolution of the HEXAGON images varies at our test sites between 0.8 and 1.1 m from west to east.
4.3 WorldView Satellite Images of 2017/2018
We acquired very high resolution satellite (VHRS) images from the WorldView 2, 3 and (for just one test site) GeoEye satellites from the European Space Agency (ESA) through the Third Party’s Mission scheme. The image dates vary between test sites due to limited availability (July 2017 and March 2018, see Supplementary Table S2), but 2017 results could be updated to 2018 with the help of UAS imagery (see below). In the following, we refer to the whole dataset as “WorldView 2018” for ease of wording. Using ERDAS Imagine 2018 image-processing software, we orthorectified the multispectral (VIS and NIR, 2 m GSD) and panchromatic (0.5 m GSD) bands to UTM Zone 29 using the rational polynomial coefficients (RPC) sensor models and a 12 m-resolution TanDEM-X elevation model. We then pansharpened the lower-resolution multispectral images to 0.5 m resolution using the associated higher-resolution panchromatic band.
4.4 Small-Format Aerial Photography (SFAP) Taken with an Unmanned Aerial System (UAS) in 2018–2020
Within the framework of the ARGAN research project (Kirchhoff et al., 2019), aerial surveys with a quadcopter UAS (DJI Phantom 4 Pro) were repeatedly conducted at all test sites in 2018–2020. We took overlapping RGB images at 50 m flying height following a flight scheme designed to capture full 3D tree shape (Aber et al., 2019:160; Marzolff et al., 2020). Georeferencing was provided by 14 ground control points per test site whose coordinates we measured with an RTK GNSS. A standard Structure-from-Motion (SfM)-photogrammetric processing workflow with Agisoft Metashape 1.6 (Agisoft LLC, St. Petersburg, Russia) was then employed for extracting dense RGB-coloured 3D point clouds (cf. Cunliffe et al., 2021). We classified the 3D point clouds into vegetation points and ground points (with sub-classes tree shadow/no tree shadow) and subsequently computed 3 cm-resolution digital surface models (DSMs) and digital terrain models (DTMs) as well as 1.5 cm-resolution orthophoto mosaics. We used ESRI ArcGIS Desktop 10.8 and CloudCompare 2.12 for creating simulated CORONA and HEXAGON imagery by altering spectral and spatial resolution and viewing angles of the UAS data. Together, these UAS data served for the following purposes:
- All orthophoto mosaics: as ultrahigh-resolution reference dataset for training and verification of argan-tree presence and size during the mapping process based on visual image interpretation of the WorldView imagery
- Selected orthophoto mosaics: for verifying that no significant changes had taken place between summer 2017 and spring 2018 for 9 of 30 test sites, since no WorldView images had been available for the latter date in this area
- Selected orthophoto mosaics degraded to panchromatic 2.2 m or 1.0 m resolution, respectively: for simulating the appearance of variously-sized trees at the poorer spatial and spectral resolutions of CORONA and HEXAGON imagery
- Selected 3D point cloud: for simulating and quantifying the influence of tree shadow on the apparent size of the tree crown in the CORONA and HEXAGON imagery at different viewing angles.
In addition to the image data, we used a database with all trees mapped on our 30 test sites in the field in 2018. This database records the location of each individual argan tree (2,494 in total), its architecture class and single trunk/multi-trunk status (for further details, see Kirchhoff et al., 2022).
5 Evaluation of Historical and Recent VHRS Imagery for Mapping Woodland Change on the Tree-Level
5.1 The Appearance of Trees in Historical CORONA and HEXAGON Images
The characteristics of the CORONA and HEXAGON programs outlined above result in several factors that influence the appearance of a tree in the panchromatic imagery. Size, shape, boundary definability and location of the dark spot representing the tree in the image depends on local GSD, contrast, camera observation angle and date and time of the image. For mapping and monitoring woodlands aiming at quantitative measures of tree density and tree-cover change, a thorough understanding of these factors is essential (cf. Fensham and Fairfax, 2002). To this end, we will in the following discuss their combined effects in exemplary subsets of original CORONA and HEXAGON photographs (Figure 3) and their individual variability with simulations based on UAS imagery (Figures 4, 5).
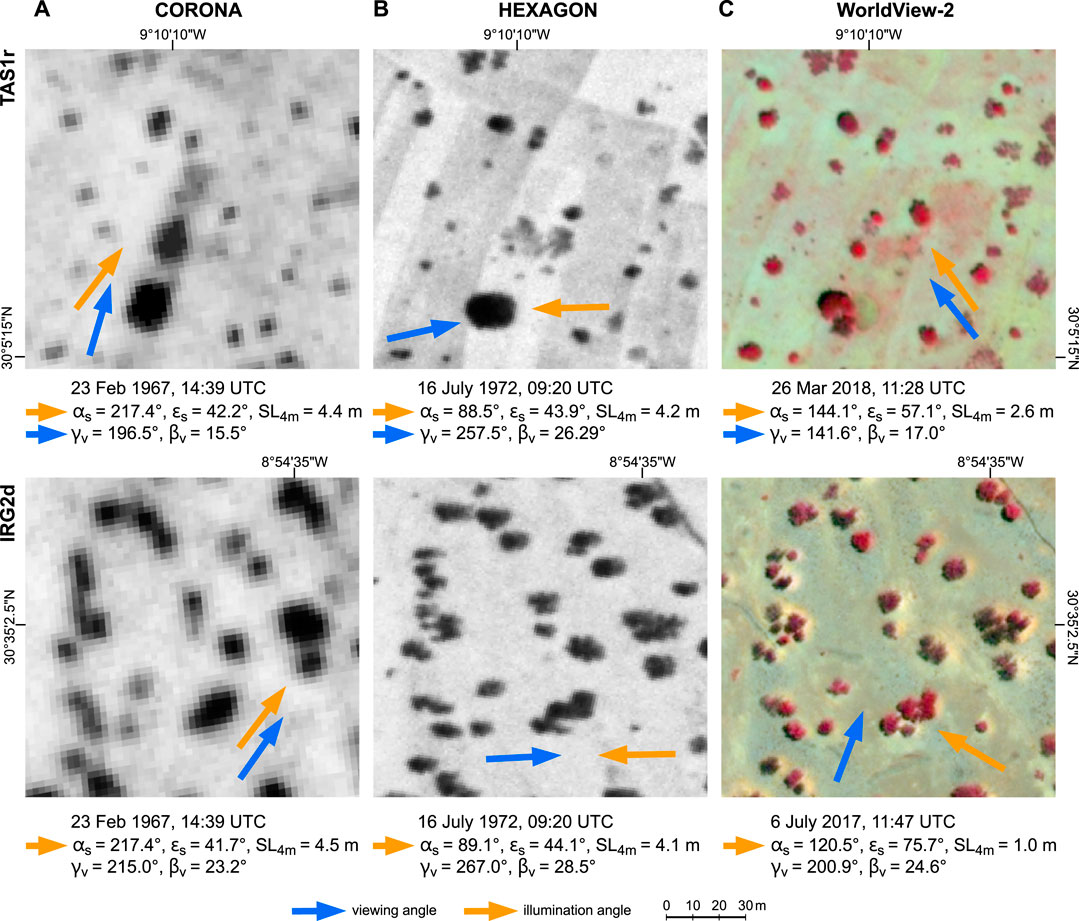
FIGURE 3. Combined effects of varying spatial resolutions, illumination angles (orange arrows) and viewing angles (blue arrows) on the appearance of trees in CORONA (A), HEXAGON (B) and false-colour infrared WorldView-2 (C) imagery of test site TAS1r (top row) and IRG2d (bottom row). αS: sun azimuth; εS: sun elevation; SL4m: shadow length of 4 m high object; γν: horizontal viewing angle of camera; βν: vertical viewing angle of camera. Note the 5-years gap between the two historical image dates and the change of tree cover in the centre of TAS1r.
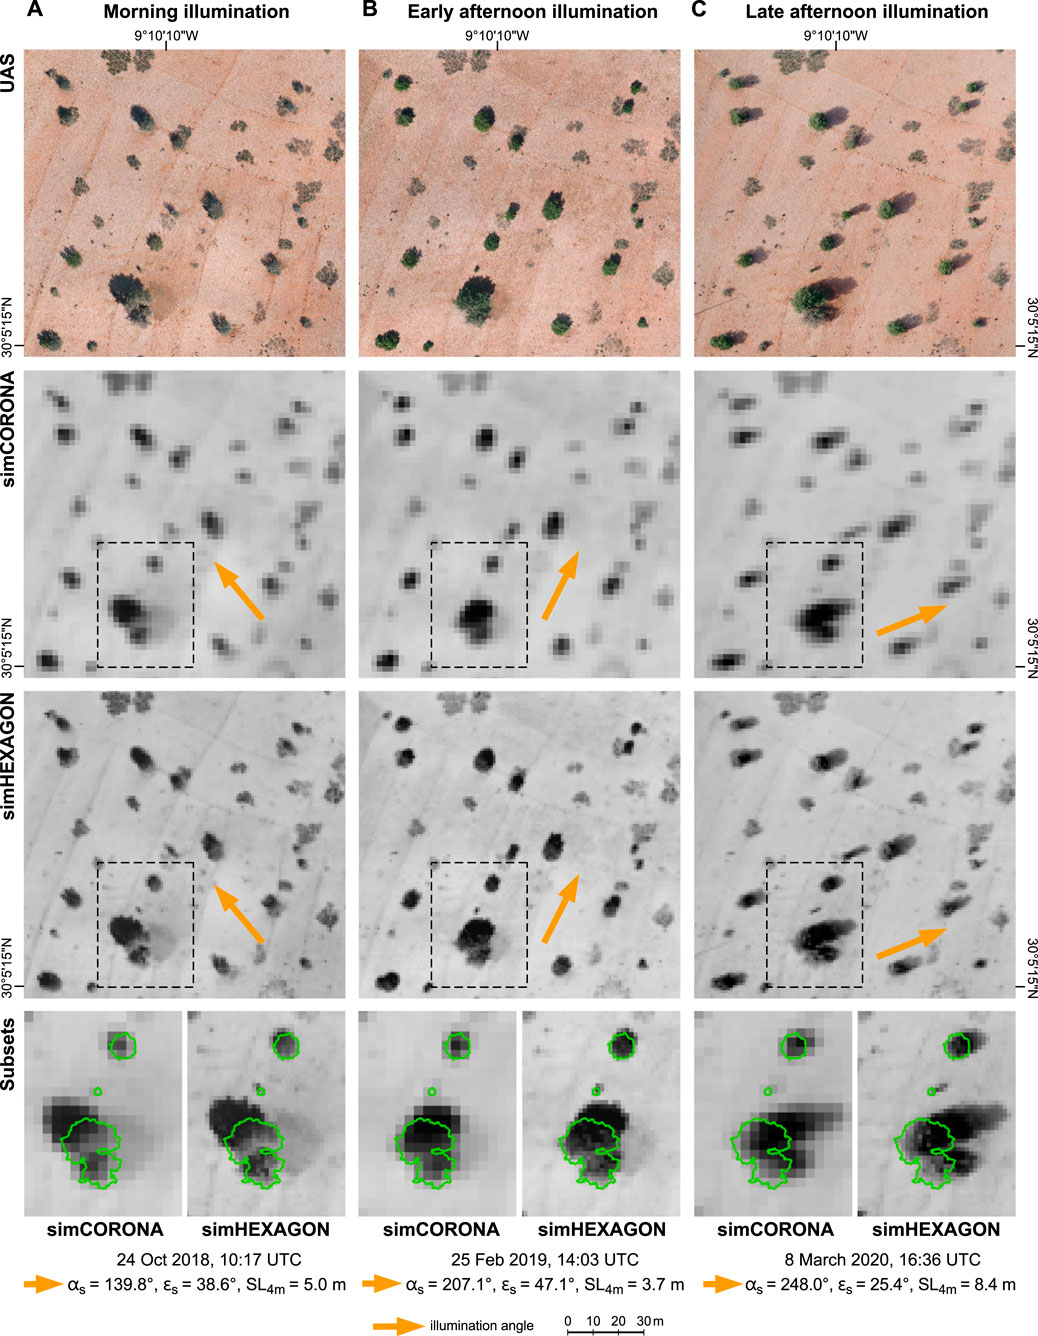
FIGURE 4. Effect of varying sun illuminations (sun azimuth αS shown as orange arrow) on the appearance of individual trees at test site TAS1r. Morning (A), early afternoon (B) and late afternoon illumination (C) are shown in UAS imagery (1.5 cm resolution, top row), simulated CORONA imagery (2.2 m resolution, second row) and simulated HEXAGON imagery (1.0 m resolution, third row). Note that illumination condition B is very similar in date, time and sun angles to the original CORONA image of this site (Figure 3A, top row). Subsets (bottom row) show examples for merging of crown and shadow in the appearance of small, medium and large trees (true crown areas outlined in green). For parameter abbreviations, see Figure 3.
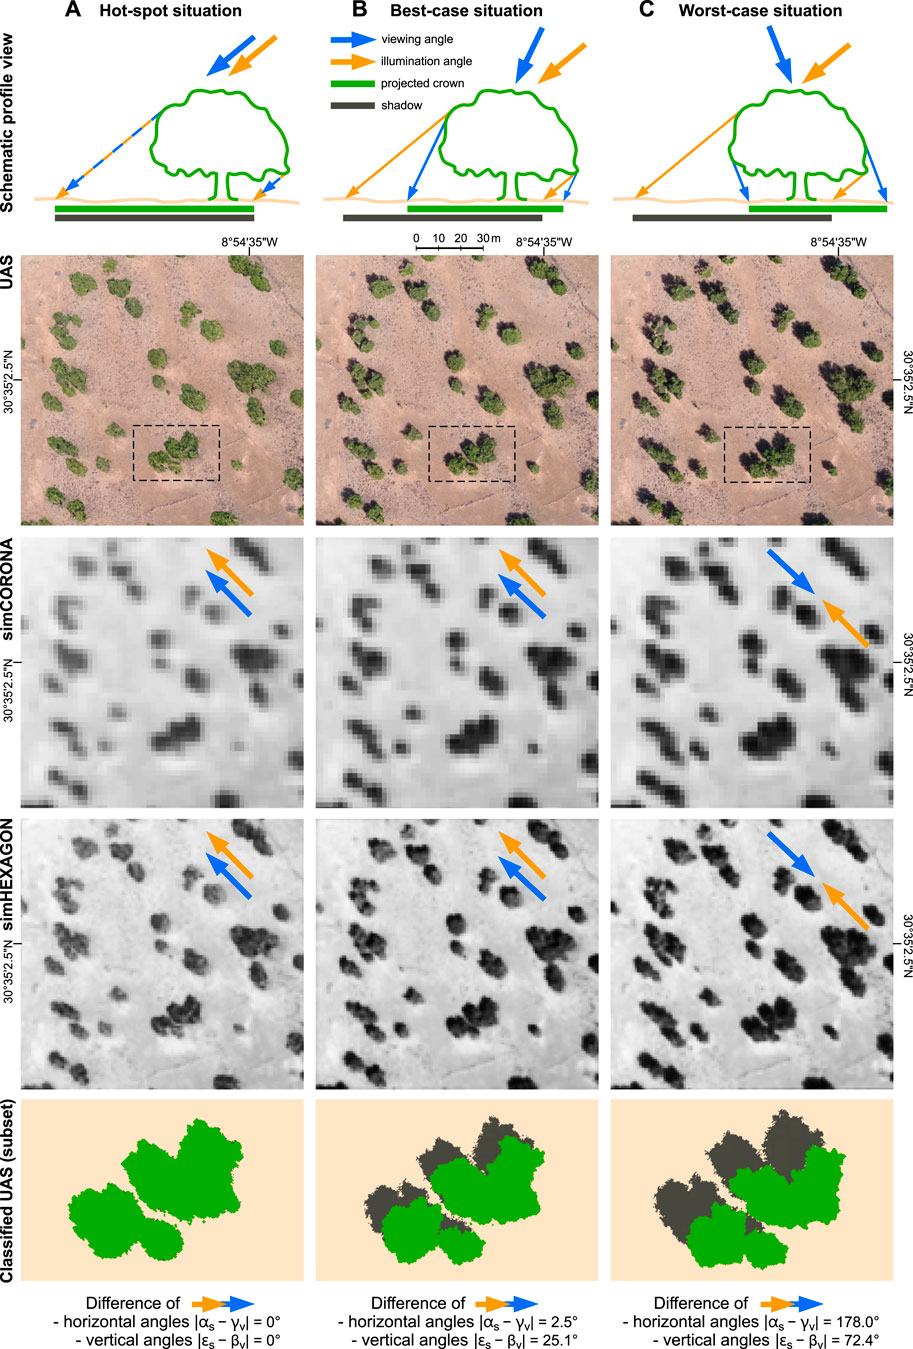
FIGURE 5. Effect of varying viewing directions (blue arrows) relative to sun illumination (orange arrows) on the appearance of individual trees at test site IRG2d, showing theoretical hot-spot situation (A), actual best-case (B) and actual worst-case situation (C) in UAS imagery simulated from 3D point clouds (top row), simulated CORONA imagery (2.2 m resolution, second row) and simulated HEXAGON imagery (1.0 m resolution, third row). Subsets (bottom row) show exemplary tree spots classified into crown and shadow area. Crown/shadow percentages at test site vary from 100%/0% (A) over 70%/30% (B) to 59%/41% (C). For parameter abbreviations, see Figure 3.
For both panoramic cameras, image GSD varies with mission flying height, but also across the image. This is due to the panoramic scanning with fields of view Ω up to 120° (Table 2; Figure 1). Generally speaking, the spatial resolution of the newly available HEXAGON images is at least twice as good than that of the commonly used CORONA images (and similar to the very rare GAMBIT KH-7 images; Table 1). The significance of this difference for tree mapping is clearly evident from Figure 3, where the visibility of small trees, the shape of larger trees and the separability of clumped canopies differs greatly between the two historical image types. Apart from a felled tree and cleared shrubs in the centre of TAS1r (Figure 3 top row), the tree cover remained unchanged between 1967 and 1972. The difference in its appearance in the historical images, however, is not only due to spatial resolution, but also to varying illumination and viewing angles: While sun elevation and shadow lengths are quite similar for both sites and dates, the direction and visibility of the cast shadows vary strongly (see orange and blue arrows in Figure 3). An influence of these angles on shadow visibility is also given for the WorldView images, as these modern-date VHRS sensors can be tilted to support multi-swath and stereo imaging. But other than for the panchromatic images, crown and shadow are easily distinguished in the multispectral images. Note that the largest tree on TAS1r (shown also in bottom-row subsets of Figure 4) has changed its crown form by 2018, as it was split by multi-trunk breakage after 1972.
Figure 4 illustrates the effects of different sun azimuths and elevations on the appearance of today’s woodland at test site TAS1r for simulated spectral and spatial resolutions of CORONA and HEXAGON images. This test site represents the full range of argan-tree sizes present in our study area. In the panchromatic images, the dark spot representing a tree comprises both tree crown and its shadow and thus, lower sun elevations lead to elongated tree spots in the imagery. The sun-facing part of the crown may appear considerably lighter, resulting in a visual displacement of the tree spot. The effect is present in both CORONA and HEXAGON images, but easier recognized in the latter due to the smaller GSD and sharper outlines of the tree spots.
Although shadowing compromises the shape of the tree spot in the panchromatic images, its darkness and elongated shape helps to distinguish between elevated dense crowns of argan trees and the lower and sparser foliage of shrubs such as Launaea arborescens or Ziziphus lotus (present at some of our test sites, e.g. top and right edge of TAS1r). Note how these lighter-coloured spots do not change shape with varying sun azimuths in Figure 4. With the poorer resolution of the CORONA imagery, however, small trees < GSD may result in similar medium-grey pixel values as shrubs with ∼ GSD diameter—especially so for higher sun elevations and shorter shadows.
Most importantly, the HEXAGON resolution allows the identification of much smaller trees, particularly at low sun elevation (see subsets in Figure 4, bottom row). Comparing our simulated images with crown-size measurements from the original UAS data, we found that the identification of trees with diameters <3 m is uncertain in CORONA, but trees ∼1.5 m diameter are still clearly visible in HEXAGON images. We also found that the latter compare quite well with the pansharpened WorldView images (cf. Figure 3C), whose nominal 0.5 m GSD results from merging the panchromatic band with the much lower-resolving multispectral information.
As tree shadow impairs crown-size measurements in the historical VHRS imagery, we also need an understanding of its share in the dark tree spot. The visible area of shadow on the ground is dependent not only on sun elevation, but also on the viewing perspective onto the tree crown. Our simulation in Figure 4 is based on a true orthophoto mosaic (geocorrected with a digital surface model) and hence has an orthographic viewing perspective. This is not the case for the satellite imagery in Figure 3, where trees appear in central perspective. From the geometries shown in Figure 1 and Table 2, we may estimate that the stereo-panoramic KH-4a and KH-9 cameras give local vertical viewing angles (βν) for a given point of interest (POI) ranging from a minimum 12.4° and 7.1° to a maximum 37.5° and 60.2°, respectively. Thus, all objects appear in a more or less oblique perspective and experience radial displacement relative to the nadir point N depending on their height. The direction of the radial displacement depends on the local horizontal viewing angle (γν), which also varies throughout the image (see Figure 1). Where local sun angle and viewing angle coincide, any shadow will be concealed by the object casting it: this phenomenon is known as hot spot or opposition effect (Aber et al., 2019:42). Conversely, when the viewing direction is towards the sun, the amount of visible shadow is maximised.
Figure 5 illustrates this by simulating different viewing directions relative to the sun for test site IRG2d and its appearance in simulated CORONA and HEXAGON images. We chose this test site for three reasons: Here of all 30 sites, the illumination/viewing conditions in our actual CORONA and HEXAGON images (see Figure 3 bottom row) are the most and least favourable, respectively; UAS imagery was taken at a similar shadow length (albeit different sun azimuth) to the historical imagery; and the tree cover has changed little in 50 years. In the theoretical scenario of Figure 5A, the hot-spot situation hides all tree shadow behind the crowns, resulting in a tree spot accurately representing the crown size. This situation is improbable for CORONA and HEXAGON images, as shadow effects were explicitly aimed for in mission planning. Conversely, the theoretical worst-case scenario in terms of shadow visibility would appear if the horizontal viewing direction were opposite the sun and the vertical viewing angle were maximised, i.e., the POI located at the farthest edge of the film strip.
Figure 5B represents the actual best viewing condition for our 30 test sites (corresponding to Figure 3A, bottom row): The difference in horizontal illumination and viewing angles is negligible, but the vertical sun angle is 25.1° lower than the vertical viewing angle. On average, the dark tree spots at our test site contain 30% shadow (see classified subset of tree group in last row of Figure 5). This shadow fraction is maximised to 41% for the actual worst viewing condition at our test sites (Figure 5C, corresponding to Figure 3B, bottom row). Here, the horizontal viewing angle is nearly exactly opposite the sun, and the large difference between vertical angles exposes most of the trees’ shadows.
With increasing difference in viewing and illumination angles, the proportion of leaf shadow within the crown increases and the reflectance of the foliage decreases due to the multi-angular nature of canopy reflectivity (cf. Aber et al., 2019:45). This is well visible in the UAS imagery in Figure 5 (top row), where the tree crowns become darker from left to right, and further exacerbates the difficulty of distinguishing crown from shadow in the panchromatic images. However, we found that in many cases the superior radiometric quality of the HEXAGON data, together with the smaller GSD, retains some intensity difference between crown and shadow both in the simulated images (e.g., Figures 4, 5, third row) and the original images (Figure 3B). For the CORONA images, there is little chance of visually separating crown and shadow.
The combined effects of spatial resolution, illumination and viewing angles illustrated in Figures 4, 5 not only determine if single trees can be identified and measured, but also if clumped canopies can be separated into individual trees. Moderate shadowing and a small GSD—as in the HEXAGON images of Figure 5B, third row—are desirable in this case as they help to model the round shape of the crowns and improve separability. But it is still hardly possible in either the historical or recent VHRS imagery to identify close-growing individuals in tree groups with highly overlapping and merging canopies.
5.2 Mapping Tree Density With Historical and Recent VHRS Imagery
We learned from our simulations of historical VHRS images on the basis of UAS imagery that tree crowns <3 m (CORONA) or <1.5 m (HEXAGON) diameter cannot be reliably identified on the panchromatic images, and that current UAS imagery may help to interpret ambiguous features. To a lesser degree, this also applies to recent multispectral VHRS images from WorldView and similar satellite sensors, where very small trees may not be recognizable. In all types of images, above all CORONA, clumped crowns of tree groups may not be visually separable. Thus, VHRS-based change analyses of open-canopy woodlands on the individual tree level must always be expected to underestimate tree number and density. In order to evaluate the reliability of our data for tree-density change mapping, we created three different datasets of argan-tree maps for our 30 test sites:
Field-based dataset for all dates (FB): Tree locations in 2018 were known a-priori from field mapping. Tree existence at these locations for previous dates was verified by visual interpretation of the CORONA and HEXAGON images, and trees visually identifiable in 1967 or 1972 but lost until 2018 were supplemented.
WorldView-based dataset for all dates (WB): All visually identifiable trees in 2018 were mapped independently from WorldView images, i.e., typical recent VHRS data. Tree verification and supplementing for 1967 or 1972 was done in the same way as for the FB dataset.
HEXAGON-based dataset for 1972 (HB): All visually identifiable trees in 1972 were mapped independently from HEXAGON images, i.e., the currently best available historical VHRS data.
In the retrospective mapping process for the field-based (FB) and WorldView-based (WB) datasets, we classified all trees as already existent in 1967 or 1972 unless they were clearly not recognizable, thus retaining many group trees and some small trees which otherwise might not have been resolvable in the satellite images. The workflow for this mapping process is explained in more detail in the Supplementary Figure S1. We did not create a CORONA-based dataset by independent mapping as we deemed the uncertainty for trees <3 m diameter (common for all sites) and individuals in tree groups (common for some sites) too high.
Figure 6A shows the number of trees mapped in the FB, WB and HB datasets for 2018, 1972 and 1967. Of the 2,494 trees mapped in the field in 2018, we recognized 2,220 trees as already existing in the 1972 HEXAGON images. 272 trees mapped for 1972 were lost until 2018. In the CORONA images of 1967—only 5 years earlier—we could only recognize 1,549 of today’s trees, plus 106 which had been lost since. The number of trees drops drastically in the WB dataset: only 1,506 (60%) of the trees mapped in the field could be identified on the contemporaneous WorldView images. On inspection of the trees missing in the WB dataset, we found that only 11% field-mapped trees (nearly all <3 m diameter) had not been recognized at all on WorldView, and the remaining gap of 29% is due to fewer individuals recognized in tree groups (see also Supplementary Figure S2). Accordingly, retrospective mapping for 1972 and 1967 based on the WB tree locations also yields much lower tree numbers (minus 34%), although the relative changes between the dates are the same as for the FB dataset. The slightly lower number of trees mapped as lost until 2018 in the WB dataset also concerns very small trees or trees in clumped canopies: We had a tendency to pinpoint such trees in the HEXAGON and CORONA images more readily during retrospective mapping in the FB dataset, as the knowledge of today’s tree location trained us to accept even smaller or denser tree spots as individual trees.
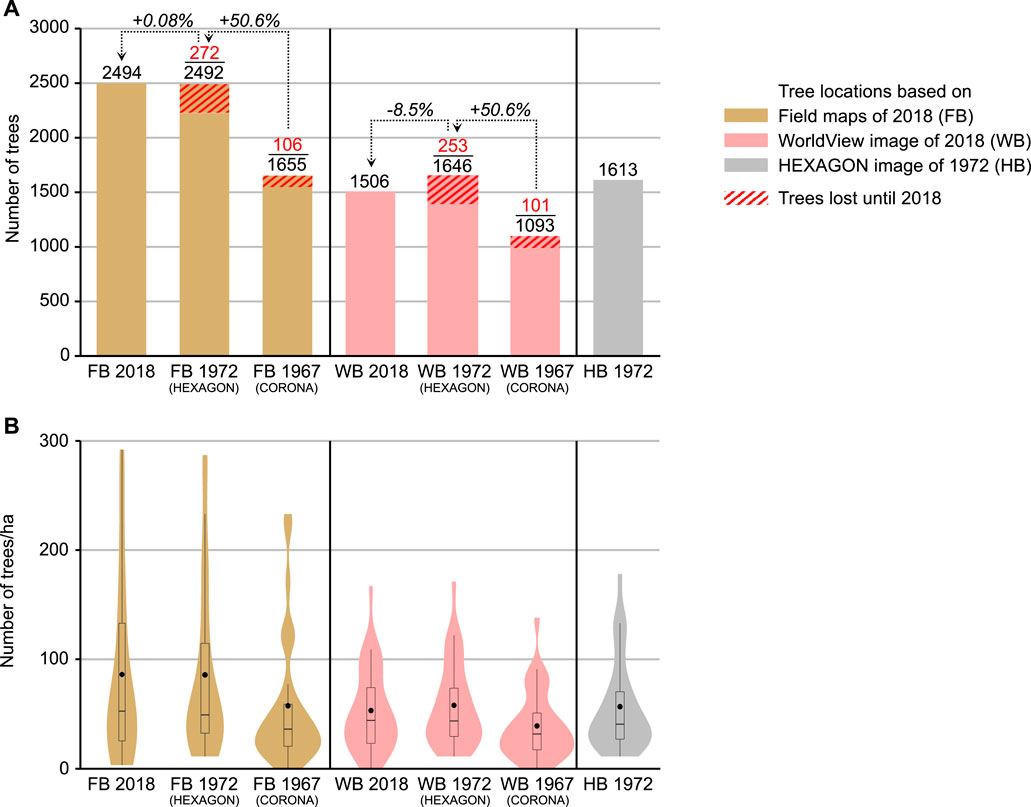
FIGURE 6. Results of argan-tree mapping on the 30 test sites in 2018, 1972 and 1967 according to the field-based (FB), WorldView-based (WB) and HEXAGON-based (HB) datasets. (A) Total numbers and net changes between dates; (B) Distribution of tree densities over the 30 test sites shown as violin plots (boxplot shows median and upper/lower quartiles; black dot shows mean). Note the difference in the shape of the violin plots between FB and WB and the similarity between WB 1972 and HB 1972.
Obviously, the choice of initial mapping base for retrospective monitoring has implications for the accuracy of the tree-density change quantification. While our FB dataset, which cautiously retains small and group trees not mappable from the satellite images, results in a negligible net change (+0.08% or +2 trees) between 1972 and 2018, the WB dataset suggests an 8.5% loss (-140 trees). The apparent 50% increase of tree numbers between 1967 and 1972 recorded in both the FB and WB dataset is clearly not realistic. We found that nearly all of these “new” trees in 1972 are too small (<< 3 m diameter) to be safely identified on CORONA images (cf. small tree crown in Figure 4, last row): They could either have regrown from felled stumps since 1967, or have been very small trees already existing in 1967. Given the slow growth rate of argan trees, it is improbable that a seedling emerged after 1967 would be large enough to be visible in HEXAGON imagery after only 5 years.
The different approaches to tree mapping also show in the distribution of tree densities over our 30 test sites (Figure 6B; for detailed results of each test site see Supplementary Table S3). According to the FB 2018 dataset, the maximum density is 292 trees/ha, but the unimodal distribution is positively skewed: The mean density is 86 trees/ha, and the median (50% threshold) much lower at 52.5 trees/ha. In the WB 2018 dataset, the mean and median densities are 53 and 44 trees/ha, and no test site reaches more than 167 trees/ha. The slightly tri-modal violin-plot shape and boxplot indicate that the FB and WB datasets agree much better for the lower-density test sites, while tree numbers at the denser sites (i.e., with smaller trees and more group trees) are clearly underestimated in the WorldView-based maps. Similar density distributions result from the FB and WB datasets for 1972. In contrast, the distributions for 1967—mapped from CORONA imagery—are even more strongly skewed towards low tree densities. As the retrospective mapping approach retains a high number of field-mapped group-tree locations in the FB dataset, but fails to identify isolated small trees for 1967 due to the poor CORONA resolution, the FB 1967 violin plot has a strongly multi-modal shape caused by 6 test sites where tree groups are particularly common. This effect is less pronounced in the WB dataset, where trees in clumped-canopy groups are generally underrepresented for all dates.
Interestingly, the highest agreements across mapping approaches are given for the HB 1972 compared to the WB 1972 dataset. The total number of trees (Figure 6A) mapped for 1972 from the HEXAGON images, independently of tree locations known a-priori from field mapping or from WorldView images, is nearly identical to the WorldView-based WB 1972 tree count (1,613 vs 1,646). Also, the tree-density distributions (Figure 6B) for HB 1972 compare very well to those for WB 1972, with means of 56.6 or 57.8 and medians of 40.5 or 43.5, respectively (see also Supplementary Figure S3). This indicates that the suitability of HEXAGON images for (manual) tree mapping is indeed similar to that of recent VHRS imagery, in spite of lower spatial and spectral resolutions. For trees >1.5 m diameter, which we found well visible on the recent and historical VHRS images, we may therefore assume quite realistic monitoring results using the WB mapping approach. Typical in our study area, however, is a large proportion of small trees, often in dwarfed growth forms like cone-shaped cushions, that are underrepresented in the WB dataset. Cone-shaped cushions frequently develop after a tree was cut close to the ground for charcoal or firewood, when the multiple new shoots from the stump (Morton and Voss, 1987) cannot regrow into stems due to continuous high browsing pressure (Kirchhoff et al., 2022). Natural regeneration is not or very rarely possible under the high grazing pressure. Dieback over time leads to a lower tree density and a higher percentage of soil without protection from erosion or soil degradation, which in turn leaves less favourable conditions for developing young argan sprouts (le Polain de Waroux and Lambin, 2012).
In light of this situation, it is likely that most of the small trees we missed in the WB dataset for want of conspicuousness have already been there in 1967/1972, possibly as recently cut stumps or as heavily pollarded trees (cf. Andersen, 2006). Our field data on tree architecture (Kirchhoff et al., 2022) confirms that 73% of these trees have growth forms indicating regrowth from felled trees. The FB 1967 and 1972 datasets include those of them that we could recognize in the historical VHRS images since their location was known a priori from field mapping. Consequently, we have used the FB dataset for further analysis of tree crown sizes and cover changes below and in Kirchhoff et al. (2022).
5.3 Monitoring Tree-Crown Size With Historical and Recent VHRS Imagery
The development of tree number and density between 1967/1972 and 2018 shown in Figure 6 indicates little net change of the argan woodlands over the last 50 years. But tree count is clearly too simple an indicator for forest dynamics when trees are at risk of unsustainable use due to high demands on livestock forage, firewood and charcoal. Tree canopy cover—composed of individual tree-crown sizes—is more interesting, because soil conditions under the crown differ significantly from the area between the tree crowns and would thus give an indication about relative differences in e.g., soil water content, soil organic carbon or aggregate stability (Kirchhoff et al., 2019; Kirchhoff et al., 2021).
From our evaluation of the factors influencing the appearance of trees in CORONA and HEXAGON imagery, we concluded that the latter is clearly superior for tree mapping to the former, but both types do not lend themselves to map and measure crown sizes on a continuous scale, as the uncertainties would be too high for allowing reliable interpretations of cover change. However, we decided that the range of tree sizes and changes in the argan forests may be well described by classifying the trees in small (S; < 3 m diameter), medium (M; 3–7 m) and large trees (L; > 7 m). We symbolized each field-mapped tree with a 3 m/7 m double-ring symbol in order to interpret its size class from the images (see Supplementary Figure S1). We classified the FB 2018 dataset first, and then recorded the changes since 1967 and 1972 by retrospective interpretation of the CORONA and HEXAGON images, taking into account the effects of viewing and illumination angles (including radial displacement of taller trees) in the historical VHRS imagery during interpretation. Any trees where change into another size class was not visually certain were given the same size class as 2018.
As a representative example for the resulting maps, Figure 7 shows the test site MAO1n, where the overall tree density and cover change is quite similar to the average of all 30 test sites. Map A displays change since 1967 and clearly reflects the CORONA imagery’s uncertainties discussed above: The HEXAGON-based map B (change since 1972) shows 17 more small trees (7 of them lost by 2018). Although some trees may have propagated from seeds within 5 years, they would still be too small to be visible at HEXAGON resolution given their slow growth rate, so natural regeneration seems unlikely. All “new” trees in 1972 are smaller than the CORONA visibility threshold, and those remaining until today exhibit architectural traits indicating high probability of resprouting from stumps after felling. The same applies for the 10 trees mapped as new between 1972 and 2018 (Figure 7B, green rings), which are mostly multi-stemmed and possess strongly developed basal cushions (cf. Kirchhoff et al., 2022). Altogether, 33 (or 60%) of the 1972 trees at MAO1n have remained in the same size class (yellow circles), 14 are smaller or lost (red and red-crossed circles), 18 are new or larger (green rings and circles). However, positive change only occurs in one-class increments (not present to S, or S to M), but negative change also in two- and three-class increments (M to not present, L to not present). Thus, in spite of the unchanged total number of trees, this site shows considerable ambiguity in change with a slight tendency towards net decrease of woody cover.
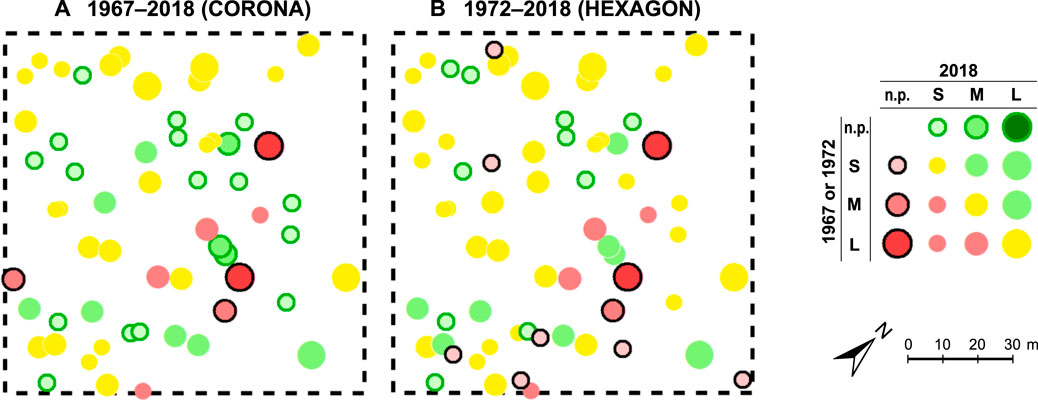
FIGURE 7. Change maps for argan trees at test site MAO1n (A) between 1967 and 2018 and (B) 1972–2018, based on the FB 1967, FB 1972 and FB 2018 datasets (location is 9°07′51″W, 30°04′09″N). Symbol colours indicate size changes since 1967 or 1972 (green: crown-size increase and new trees, yellow: unchanged, red: crown-size decrease and lost trees). Symbol outlines indicate new (green outline) and lost trees (black outline). Symbol sizes vary by tree size in 2018 (for prevailing trees). n. p. = not present, S = < 3 m, M = 3–7 m, L = > 7 m diameter. Note that the differences between (A) and (B) are caused by the poorer resolution of the CORONA imagery rather than actual change of the slow-growing argan trees between 1967 and 2018.
Figure 8 shows results for the monitoring of tree cover 1972–2018 at all 30 test sites. The development on the 30 test sites is highly heterogeneous and ranges from nearly complete deforestation (IRG3l) to considerable recovery (TAS1r). Three test sites (ABH2c, ABH2t, AOU1a) show predominantly forest degradation with high percentages of cleared trees or smaller crown sizes. However, a clear trend of argan forest change at our test sites cannot be observed. Even within the three geographically distinct study areas, the developments between 1972 and 2018 vary substantially. These spatial associations of positive and negative changes within argan-tree populations raise questions about potential patterns of ambivalence and influences of ecological or forest-use related factors, which are given closer attention in Part B of our study (Kirchhoff et al., 2022).
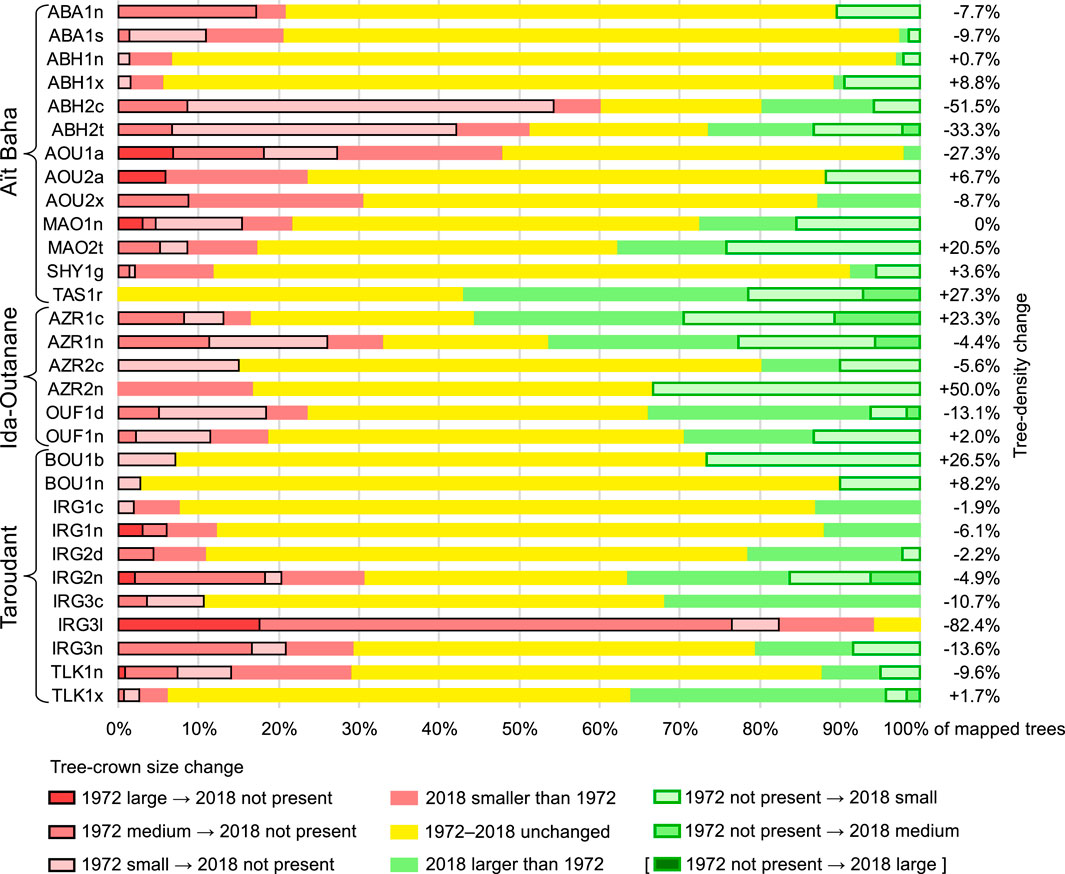
FIGURE 8. Relative contribution of tree-size changes for argan trees between 1972 and 2018 at all 30 test sites, based on the FB 1972 and FB 2018 datasets. The stacked bars show trees lost since 1972 on the left (red shades with black outlines), trees changed and unchanged in size in the middle (red, yellow and green) and new trees until 2018 on the right (green shades with green outlines). Tree-density change for each test site is given as net change of tree count per hectare.
6 Discussion
6.1 Factors Influencing the Appearance of Trees in Historical VHRS Images
The newly accessible historical HEXAGON satellite photographs taken with the KH-9 stereo-panoramic cameras have proven clearly superior to the well-recognized CORONA KH-4 images in our study on tree-level mapping of open-canopy woodlands. This can mainly be attributed to the much higher spatial resolution—in our case, GSDs of approx. 1 m (HEXAGON) vs 2.2 m (CORONA). Since both image types are panchromatic, spatial resolution is the single most determining factor for the identification of individual trees: It influences both the threshold of minimum visible crown size and the separability of trees with clumped canopies.
It should be understood that the GSDs given for our data are not generally transferable to all HEXAGON or CORONA images. Spatial resolution varies between image centre and edge due to the panoramic distortion of the cameras and optical effects but it also varies with flying height between missions, haze, and target reflectance and contrast. Together with the film grain and lens modulation transfer function, which determine film resolution, all of these factors affect the ground resolved distance (GRD) of the photograph (NRO, 1970; NRO, 1972; McDonald and Widlake, 2012). This translates into the ground sampling distance (GSD) of the georeferenced digital image via the scanning process and is thus dependent on scanning resolution. The highest scan resolution offered by the USGS for CORONA and HEXAGON imagery is 7 µm or 3,600 dpi (USGS, 2018a; USGS, 2018c), which by Leachtenauer et al. (1998) was deemed coarser than lossless digitizing (4 µm). From our experience, however, we can agree with other authors who found the 7 µm scans quite sufficient (e.g., Galiatsatos, 2004; Fowler, 2005; Gheyle et al., 2011). The tree crowns in both our CORONA and HEXAGON images already have more or less blurred edges, and we would not expect any improvement of crown definition from higher scanning resolutions.
We have not investigated the role of radiometric image quality and image contrast for identifying and measuring individual trees in the historical VHRS images. In dryland conditions, contrast between trees and intertree areas is generally quite high but varies with seasonal dynamics: Leaf-on situation and bare or sparsely vegetated surroundings (as given for most of the image dates and test sites in our study) provide the best contrast for differentiating tree crowns from intertree areas. Leaf-off conditions, degraded and fractured tree canopies and dense grass or crop cover in the intertree areas reduce the visibility of individual trees and require finer radiometric resolution. Generally, the photographic films used in the HEXAGON (mostly EASTMAN KODAK type 1414) are of higher quality than in the CORONA mission (type 3404 and 3414; NPIC, 1967; Galiatsatos, 2004; McDonald and Widlake, 2012). However, image contrast is a function of film gradation, lens modulation transfer function and reflectance of an object compared to its surroundings, and the quality of the scanned product varies with many more factors including film processing. The discussion of these influences on the appearance of individual trees is beyond the scope of our paper, but useful observations regarding tree mapping from CORONA images and panchromatic APs may be found in Andersen (2006) and Fensham and Fairfax (2002).
Our systematic simulations of the historical panchromatic VHRS imagery based on UAS images have revealed the significant role of local illumination and viewing geometry for the shapes of the tree spots, which comprise both crown and cast shadow. Knowledge and understanding of these parameters is highly important for correctly interpreting the shape and size of the tree crown, and thus for measures of tree density and canopy cover. Long shadows are aimed for in military reconnaissance imagery (Hall, 2003), and the amount of shadowing in our images must be considered quite typical: We found that on average for our test sites, shadow contributes between 30 and 41% to the dark spot representing a tree. Disregarding this aspect in mapping and monitoring of woodland trees would not only lead to an overestimation of canopy size, but also to errors in tree counts (and thus density estimates) and misjudgements of tree-size changes between different images and dates.
While the shadowing effect may be beneficial in detecting trees, it forbids the use of simple image thresholding techniques for tree-crown mapping and canopy cover quantification, i.e., automatic classification methods not modelling and correcting shadow contribution to the tree spot. This point is also strongly emphasized by Andersen (2006) and Fensham and Fairfax (2002), but surprisingly disregarded by some authors mapping individual tree canopies from panchromatic aerial photographs (e.g., Lahav-Ginott et al., 2001; Moustakas et al., 2006) or single-band VHRS images (Shafeian et al., 2021). Tree mapping from multispectral VHRS images, such as our WorldView data, is much less affected by the shadowing problem, as tree crown and shadow are usually easy to tell apart, especially in the near-infrared spectral band. Here, the presence of a contrasting shadow may be exploited by visual (e.g., Bastin et al., 2017) as well as object-oriented and machine-learning mapping approaches (Alsharrah et al., 2016; Brandt et al., 2020) to distinguish between trees and lower-height shrub or grass cover. On the other hand, cast shadow as well as crown self-shadow may be eliminated in multispectral images by using indices such as the NDVI, as ratioing cancels out the darkening factor. The NDVI also helps to distinguish tree crowns from less-vegetated background, and is used by numerous authors for mapping individual trees (Fisher et al., 2017; Isaacson et al., 2017; Lelong et al., 2020). The deep-learning model by Brandt et al. (2020) uses both cast shadow and high NDVI as conditions for tree-crown identification.
Although the above-mentioned methods operating in the spectral domain cannot be used for panchromatic images, the spatial domain may provide a further option in the third dimension: Owing to their height differences, tree crown and cast shadow may be visually separated by stereoscopic viewing, as was demonstrated by Fensham et al. (2002) for both panchromatic and colour AP. Quick tests we made with stereopairs of aft and forward images confirmed that this is also the case for our HEXAGON KH-9 photographs, whose stereo capability was designed for interpreting intelligence targets such as military facilities and industrial buildings (Oder et al., 1992). We tested both Agisoft Metashape (commercial software) and StereoPhoto Maker (freeware; stereo.jpn.org) and found that an assessment of size, height and even structure of the trees is indeed considerably aided by stereoviewing if one is willing to accept the obliquity of the stereomodel and the effort of constantly re-adjusting the stereopair alignment while moving through the model. Stereoviewing is possible in the same way for CORONA images, but lack of crown—shadow contrast and lower spatial resolution largely impede the 3D appearance of trees.
6.2 Mapping Trees With HEXAGON vs Other Very High Resolution Imagery
We have found that by training ourselves with the help of the UAS-simulated examples of tree-spot appearances, we were able to compensate for the shadowing effect with sufficient confidence while performing visual interpretation of different tree-size classes (small, medium and large, as defined in Figure 7). We chose thresholds of 3 and 7 m diameter between these classes as this classification scheme allowed the comparison of CORONA and HEXAGON images and represents typical argan-tree sizes in our study area. The 3 m-threshold (i.e., 7 m2) for small trees also corresponds well to the minimum detectable crown size of 6 m2 for desert trees given by Andersen (2006) for CORONA KH-4a imagery. Schlesinger and Gramenopoulos (1996) and Usman and Nichol (2018) observed a detection threshold of approx. 4 m diameter for trees on CORONA images of western Sudan and northern Nigeria, respectively. On HEXAGON KH-9 imagery, though, we could safely have defined the smallest tree-size class as < 2 m, and more classes with smaller size ranges could have been distinguished. Our UAS-based simulations confirm that trees as small as 1.5 m diameter may well be identified on these images, especially with low sun elevations (see Figure 4). For larger trees and favourable illumination and canopy reflectance conditions, it would also be possible to delineate tree crowns manually from HEXAGON: We found the radiometric quality good enough to differentiate between lighter crown and darker shadow in many cases. This is, however, not the case for the CORONA images, as was already observed by Dendoncker et al. (2020) and Andersen (2006).
As in other studies using historical imagery for tree mapping, the lack of reference data did not allow us to estimate the commission error, i.e. missing trees in our maps for 1967/1972. We therefore chose to evaluate the reliability of tree counts obtained from the historical and recent VHRS imagery by comparing three different mapping approaches: A field-based (FB) and a WorldView-based (WB) dataset of argan-tree maps, where the location of each tree in 2018 was known a priori from the field or WorldView image, respectively, and then checked on and supplemented by the 1967 CORONA and 1972 HEXAGON images; and a HEXAGON-image based (HB) dataset for 1972. CORONA images were found to be much less reliable for identifying trees (particularly small trees) than HEXAGON. However, KH-4a and KH4b imagery do have their value for longer-term woodland monitoring since they reach back 8 more years (see Table 1), thus allowing to capture especially deforestation processes in the 1960s to early 1970s. We would therefore still encourage their use in environments with dynamic forest change, especially of larger trees >3 m diameter, and where HEXAGON coverage is not available.
Compared to the FB dataset, we found tree counts for all dates 34–40% lower in the WB dataset owing, above all, to our inability to visually separate all trees with overlapping crowns growing in clumped-canopy groups: We missed 29% of the field-mapped group trees in the WorldView images. This problem is reported in many studies that quantify tree-density (e.g., Axelsson and Hanan, 2017; Dendoncker et al., 2020). Brandt et al. (2020) reported their dryland tree-mapping model to have missed 3.8% of the reference trees due to inclusion in clumped canopies. Considering that these reference trees were mapped manually from WorldView-type imagery—as in our WB approach—we may conclude that their tree-density measures (though not canopy-cover values) also considerably underestimate the true number of individual trees.
Regarding the changes of argan woodland we found at our 30 test sites in the Souss region of Morocco between 1972 and 2018 (Figure 8), it should be noted that our retrospective mapping method is a very conservative approach, opting for stability in case of doubt: Any trees that did not clearly have another size in 1972 were given the same size class as 2018, i.e. unchanged size (yellow bar sections in Figure 8). Tree-cover change is thus underestimated rather than overestimated. Since small trees >1.5 m diameter could have been missed on the HEXAGON imagery, the number of trees lost until 2018 might have been higher than recorded here. In any case, we could not observe an overall trend to increase or decrease of woody cover in our study areas, but a high degree of unchanged tree sizes and unspecific change patterns. The tree-cover change data resulting from our study described here are further analysed in combination with plant architecture data in the companion paper (Part B of our study) by Kirchhoff et al. (2022), where we show that in spite of comparatively stable tree size and density, the argan forest shows signs of continuing degradation.
6.3 The HEXAGON Heritage: Future Opportunities and Challenges for Dryland Forest Mapping
One of the key findings of our study is the remarkably similar potential of the HEXAGON image for identifying individual trees compared to the WorldView images: The total number and test-site densities of tree for 1972 in the WB and HB datasets (Figures 6A,B) are nearly identical. At least for manual mapping approaches based on human visual interpretation, we would therefore consider HEXAGON images combined with recent VHRS imagery far superior not only to CORONA images, but also to historical aerial photographs (APs). Typical historical APs with image scales 1:30,000–1:50,000 yield image resolutions around or only slightly better than the 1 m GSD of HEXAGON KH-9. But the common 15 cm focal lengths of survey cameras cover only 48–132 km2 at these scales, compared to typical HEXAGON images such as ours with ∼2,500 km2 (or even larger depending on scan angle; see Figure 1 and Table 2). Moreover, the typical survey-camera field of view Ω is approx. 74°. This means that the variability of viewing angles and radial displacement (and their associated effects on tree crown/shadow appearance as described with Figure 5) is very high within each individual AP’s extent, but negligible within the same area in a HEXAGON image, which was taken from 25 to 40 times the flying height.
Obviously, the analogue nature of both HEXAGON and CORONA images, with lack of automatically collected digital metadata and georeferencing, encumbers their use in effective large-area mapping. We chose a manual control-point approach for precisely registering the historical to recent VHRS images at our 30 test sites. A better solution for larger areas—unless the landscape has changed dramatically between dates—would be automatic placement of a large amount of control-points, which is offered by most GIS and remote sensing software packages and was found to work well in our argan woodlands, too. Another option for georeferencing large numbers of images could be crowd-sourcing orthorectification, which has been tested by the open-access CORONA Atlas project but was found to be a challenging task for non-experts (Casana, 2020). More sophisticated approaches for orthorectifying CORONA images or historical AP with the help of DEMs are based on feature-matching or photogrammetric reconstruction of image orientation in space (Nita et al., 2018; Pinto et al., 2019; Zhang et al., 2021). These approaches should generally be transferable to the HEXAGON photographs and will need to be explored and developed further.
As we have shown, an at least approximate knowledge of viewing and illumination angles is imperative for tree mapping from historical VHRS images. Other than for recent VHRS sensors, where acquisition times, sensor tilt angles, field of view, sun azimuth and elevation etc. are recorded in the image metadata, very few metadata are available for the scanned HEXAGON and CORONA images. We could partly retrieve the values for the required parameters (shown in Figure 1) from declassified technical documents, and reconstruct others from the images themselves. We used simplified trigonometric calculations disregarding earth curvature, which was quite sufficient for our purpose (see in Supplementary Workflow S2). Currently, the only available metadata in the USGS EarthExplorer prior to ordering of HEXAGON KH-9 imagery are date, mission number, frame number and orientation (aft/forward) and the simplified (trapezoidal) footprint coordinates. Since illumination and viewing angle are of great importance for assessing the shadowing conditions in an area of interest, the inclusion of acquisition time and scan mode in the HEXAGON metadata would be of great value. The scan mode is recorded on the edge of the film frame (not visible in preview quicklooks) and would need to be read and ingested into the metadatabase by USGS EROS staff for each mission revolution. The time of day is recorded in flight data books or mission profile reports, but these are not (yet) available for HEXAGON missions, and so far no alternative online records exist with this crucial information. A method proposed by Fowler (2011) for modelling acquisition times of CORONA imagery to within 20 s accuracy might also be applicable to HEXAGON missions but was not tested by us, since the reconstruction via shadow direction was sufficient for our purpose.
Automated tree detection and mapping methods for HEXAGON imagery would certainly encourage larger-area studies and wall-to-wall dryland forest mapping beyond the confined extents or plot-sampling strategies that are workable with the manual interpretation and mapping method presented in our study. Considering recent advancements in deep-learning techniques for mapping individual trees in forests, plantations or urban environments, we believe that it would be worth exploring the possibility of training machine-learning classifiers to recognise tree crowns in HEXAGON imagery. By incorporating information on illumination and viewing angles and by sensitising the classifier to fine radiometric differences, estimates of shadow percentages in the tree spot and separation of crown and shadow might become possible. Such approaches could add the historical dimension to the new focus on quantifying woody cover and forest degradation on the individual tree level called for in several recent publications (Brandt et al., 2020; Fagan, 2020; Gao et al., 2020; Hanan and Anchang, 2020) in order to improve long-term monitoring, protection and restoration of trees in arid and semi-arid environments.
In conclusion, we have shown that the newly accessible historical HEXAGON VHRS images have a great potential for mapping individual trees if the factors affecting tree-crown appearance are respected in the evaluation process. The possibility of comparing them with recent VHRS imagery such as WorldView opens exciting opportunities for retrospective monitoring of sparse dryland forests and open-canopy woodlands back into the 1980s and 1970s. Beyond these ecosystems, HEXAGON data could also support other research on plant spatial distribution, from alpine treeline dynamics to periodic woody vegetation patterns such as Sahelian “tiger bush”. Once the ingestion into the USGS EarthExplorer archive and ordering system is completed, the HEXAGON KH-9 dataset will double the availability of VHRS reconnaissance images, hitherto provided by CORONA KH-4a/b and GAMBIT KH-7. We hope that our findings on the superiority of HEXAGON over the already well-recognized CORONA imagery will encourage the scientific community to tap into this invaluable resource of historical Earth observation data for environmental monitoring.
Data Availability Statement
The HEXAGON and CORONA images used in this study are freely available from the USGS EarthExplorer. UAS imagery and derivatives as well as the tree database containing the FB, WB and HB datasets may be obtained from the corresponding author on reasonable request.
Author Contributions
IM, MK, MS, and JR designed the study; AAH provided resources and logistical support; IM, MS, AAH, and JR supervised the research activities; IM, MK, and RS acquired the data; IM, MK, MS, and JR performed the analysis and interpretation; IM and JR acquired funding; IM and MK wrote the original draft. All authors performed review and editing of the final version of the manuscript.
Funding
Funding of this study by the Deutsche Forschungsgemeinschaft (DFG) as part of the ARGAN research project und project no. MA 2549/6-1 and RI 835/24 is gratefully acknowledged. WorldView and GeoEye satellite data were provided by the European Space Agency (ESA) under the Third Party’s Mission scheme, project no. 36256. TanDEM-X elevation data (used in orthorectification) were provided by the German Space Agency (DLR) under project no. DEM_HYDR1131.
Conflict of Interest
The authors declare that the research was conducted in the absence of any commercial or financial relationships that could be construed as a potential conflict of interest.
Publisher’s Note
All claims expressed in this article are solely those of the authors and do not necessarily represent those of their affiliated organizations, or those of the publisher, the editors and the reviewers. Any product that may be evaluated in this article, or claim that may be made by its manufacturer, is not guaranteed or endorsed by the publisher.
Acknowledgments
We thank the responsible local, regional and national Moroccan authorities for supporting our studies and allowing access to their territories. We are also grateful to Abdellatif Hanna and Khalil Hamouch for their considerable help with our fieldwork.
Supplementary Material
The Supplementary Material for this article can be found online at: https://www.frontiersin.org/articles/10.3389/fenvs.2022.896702/full#supplementary-material
Footnotes
1Kirchhoff, M., Marzolff, I., Stephan, R., Seeger, M., Aït Hssaine, A., Ries, J. B. (2022). Monitoring Dryland Trees with Remote Sensing. Part B: Combining Tree Cover and Plant Architecture Data to Assess Degradation and Recovery of Argan Woodlands of South Morocco. Front. Environ. Sci. Under review.
1After first-time order of scans from the USGS, the images become open access for subsequent users. This has encouraged the development of the open-access CORONA Atlas, which collects and disseminates manually georeferenced images of selected areas worldwide, particularly landscapes of archaeological interest. The atlas also employs its own online georeferencing tool sunspot, which allows users to upload and interactively georeference CORONA images for expanding the archive (Casana, 2020).
2Note that so far, published studies referring to HEXAGON images have used this 20–30 feet resolution “mapping” or “terrain camera” only, as higher-res panoramic imagery was not yet accessible (e.g. Dehecq et al. (2020) and HEXAGON-based studies referenced therein).
References
Aber, J. S., Marzolff, I., Ries, J. B., and Aber, S. W. (2019). Small-format Aerial Photography and UAS Imagery: Principles, Techniques and Geoscience Applications. Amsterdam: Elsevier Academic Press.
Aït Hssaine, A. (2002). “Le cadre physique de la Dépression du Souss et la dégradation de l’environment sédimentaire,” in L’espace rural dans le Souss: Heritage et changements: Actes du Colloque organisé le 15 et 16 Mars 1996. Editor M. Bouchelkha, 22–27.
Alsharrah, S. A., Bouabid, R., Bruce, D. A., Somenahalli, S., and Corcoran, P. A. (2016). Use of Shadow for Enhancing Mapping of Perennial Desert Plants from High-Spatial Resolution Multispectral and gh Panchromatic Satellite Imagery. J. Appl. Remote Sens. 10, 036008. doi:10.1117/1.JRS.10.036008
Andersen, G. L., and Krzywinski, K. (2007). Mortality, Recruitment and Change of Desert Tree Populations in a Hyper-Arid Environment. Plos One 2, e208. doi:10.1371/journal.pone.0000208
Andersen, G. L. (2006). How to Detect Desert Trees Using CORONA Images: Discovering Historical Ecological Data. J. Arid Environ. 65, 491–511. doi:10.1016/j.jaridenv.2005.07.010
Axelsson, C. R., and Hanan, N. P. (2017). Patterns in Woody Vegetation Structure across African Savannas. Biogeosciences 14, 3239–3252. doi:10.5194/bg-14-3239-2017
Bastin, J.-F., Berrahmouni, N., Grainger, A., Maniatis, D., Mollicone, D., Moore, R., et al. (2017). The Extent of Forest in Dryland Biomes. Science 356, 635–638. doi:10.1126/science.aam6527
Brandt, M., Rasmussen, K., Hiernaux, P., Herrmann, S., Tucker, C. J., Tong, X., et al. (2018). Reduction of Tree Cover in West African Woodlands and Promotion in Semi-arid Farmlands. Nat. Geosci. 11, 328–333. doi:10.1038/s41561-018-0092-x
Brandt, M., Tucker, C. J., Kariryaa, A., Rasmussen, K., Abel, C., Small, J., et al. (2020). An Unexpectedly Large Count of Trees in the West African Sahara and Sahel. Nature 587, 78–82. doi:10.1038/s41586-020-2824-5
Casana, J. (2020). Global-Scale Archaeological Prospection Using CORONA Satellite Imagery: Automated, Crowd-Sourced, and Expert-Led Approaches. J. Field Archaeol. 45, S89. doi:10.1080/00934690.2020.1713285
Chidumayo, E. N., and Gumbo, D. J. (2010). The Dry Forests and Woodlands of Africa: Managing for Products and Services. London: Earthscan.
Cunliffe, A. M., Anderson, K., Boschetti, F., Brazier, R. E., Graham, H. A., Myers‐Smith, I. H., et al. (2021). Global Application of an Unoccupied Aerial Vehicle Photogrammetry Protocol for Predicting Aboveground Biomass in Non‐forest Ecosystems. Remote Sens. Ecol. Conserv. 8, 57–71. doi:10.1002/rse2.228
Dashora, A., Lohani, B., and Malik, J. N. (2007). A Repository of Earth Resource Information - CORONA Satellite Programme. Curr. Sci. 92, 926–932.
Dehecq, A., Gardner, A. S., Alexandrov, O., McMichael, S., Hugonnet, R., Shean, D., et al. (2020). Automated Processing of Declassified KH-9 Hexagon Satellite Images for Global Elevation Change Analysis since the 1970s. Front. Earth Sci. 8, 566802. doi:10.3389/feart.2020.566802
Dendoncker, M., Brandt, M., Rasmussen, K., Taugourdeau, S., Fensholt, R., Tucker, C. J., et al. (2020). 50 Years of Woody Vegetation Changes in the Ferlo (Senegal) Assessed by High-Resolution Imagery and Field Surveys. Reg. Environ. Change 20, 1–13. doi:10.1007/s10113-020-01724-4
Fagan, M. E. (2020). A Lesson Unlearned? Underestimating Tree Cover in Drylands Biases Global Restoration Maps. Glob. Change Biol. 26, 4679–4690. doi:10.1111/gcb.15187
FAO (Food and Agriculture Organization of the United Nations) (2019). Trees, Forests and Land Use in Drylands: The First Global Assessment, Full Report. Rome: Food and Agriculture Organization of the United Nations.
Fensham, R. J., and Fairfax, R. J. (2002). Aerial Photography for Assessing Vegetation Change: a Review of Applications and the Relevance of Findings for Australian Vegetation History. Aust. J. Bot. 50, 415. doi:10.1071/BT01032
Fensham, R. J., Fairfax, R. J., Holman, J. E., and Whitehead, P. J. (2002). Quantitative Assessment of Vegetation Structural Attributes from Aerial Photography. Int. J. Remote Sens. 23, 2293–2317. doi:10.1080/01431160110106050
Fisher, A., Danaher, T., and Gill, T. (2017). Mapping Trees in High Resolution Imagery across Large Areas Using Locally Variable Thresholds Guided by Medium Resolution Tree Maps. Int. J. Appl. Earth Obs. Geo. 58, 86–96. doi:10.1016/j.jag.2017.02.004
Fowler, M. J. F. (2005). An Evaluation of Scanned CORONA Intelligence Satellite Photography. AARGnews 31, 34–37.
Fowler, M. J. F. (2011). Modelling the Acquisition Times of CORONA Satellite Photographs: Accuracy and Application. Int. J. Remote Sens. 32, 8865–8879. doi:10.1080/01431161.2010.542207
Fradley, M. (2021). British Inter-war Aerial Photogrammetric Mapping in the MENA Region: Archives, Access and Research Potential. Levant 64, 1–11. doi:10.1080/00758914.2021.1992879
Frost, G. V., and Epstein, H. E. (2014). Tall Shrub and Tree Expansion in Siberian Tundra Ecotones since the 1960s. Glob. Change Biol. 20, 1264–1277. doi:10.1111/gcb.12406
Gaisberger, H., Kindt, R., Loo, J., Schmidt, M., Bognounou, F., Da, S. S., et al. (2017). Spatially Explicit Multi-Threat Assessment of Food Tree Species in Burkina Faso: A Fine-Scale Approach. Plos One 12, e0184457. doi:10.1371/journal.pone.0184457
Galiatsatos, N. (2004). Assessment of the CORONA Series of Satellite Imagery for Landscape Archaeology: A Case Study from the Orontes Valley, Syria. PhD Dissertation. Durham: Durham University.
Gao, Y., Skutsch, M., Paneque-Gálvez, J., and Ghilardi, A. (2020). Remote Sensing of Forest Degradation: a Review. Environ. Res. Lett. 15, 103001. doi:10.1088/1748-9326/abaad7
Gheyle, W., Bourgeois, J., Goossens, R., and Jacobsen, K. (2011). Scan Problems in Digital CORONA Satellite Images from USGS Archives. Photogramm. Eng. remote Sens. 77, 1257–1264. doi:10.14358/PERS.77.12.1257
Gonzalez, P., Tucker, C. J., and Sy, H. (2012). Tree Density and Species Decline in the African Sahel Attributable to Climate. J. Arid Environ. 78, 55–64. doi:10.1016/j.jaridenv.2011.11.001
Hanan, N. P., and Anchang, J. Y. (2020). Satellites Could Soon Map Every Tree on Earth. Nature 587, 42–43. doi:10.1038/d41586-020-02830-3
Hanan, N. P., Milne, E., Aynekulu, E., Yu, Q., and Anchang, J. (2021). A Role for Drylands in a Carbon Neutral World? Front. Environ. Sci. 9, 1–10. doi:10.3389/fenvs.2021.786087
Hansen, M. C., Potapov, P. V., Moore, R., Hancher, M., Turubanova, S. A., Tyukavina, A., et al. (2013). High-resolution Global Maps of 21st-Century Forest Cover Change. Science 342, 850–853. doi:10.1126/science.1244693
Isaacson, S., Ephrath, J. E., Rachmilevitch, S., Maman, S., Ginat, H., and Blumberg, D. G. (2017). Long and Short Term Population Dynamics of acacia Trees via Remote Sensing and Spatial Analysis: Case Study in the Southern Negev Desert. Remote Sens. Environ. 198, 95–104. doi:10.1016/j.rse.2017.05.035
Karlson, M., Ostwald, M., Reese, H., Bazié, H. R., and Tankoano, B. (2016). Assessing the Potential of Multi-Seasonal WorldView-2 Imagery for Mapping West African Agroforestry Tree Species. Int. J. Appl. Earth Obs. Geo. 50, 80–88. doi:10.1016/j.jag.2016.03.004
Kirchhoff, M., Engelmann, L., Zimmermann, L. L., Seeger, M., Marzolff, I., Aït Hssaine, A., et al. (2019). Geomorphodynamics in Argan Woodlands, South Morocco. Water 11, 2193. doi:10.3390/w11102193
Kirchhoff, M., Romes, T., Marzolff, I., Seeger, M., Aït Hssaine, A., and Ries, J. B. (2021). Spatial Distribution of Argan Tree Influence on Soil Properties in Southern Morocco. SOIL 7, 511–524. doi:10.5194/soil-7-511-2021
Kirchhoff, M., Marzolff, I., Stephan, R., Seeger, M., Aït Hssaine, A., and Ries, J. B. (2022). Monitoring Dryland Trees with Remote Sensing. Part B: Combining Tree Cover and Plant Architecture Data to Assess Degradation and Recovery of Argan Woodlands of South Morocco. Submitt. Front. Environ. Sci.
Lahav-Ginott, S., Kadmon, R., and Gersani, M. (2001). Evaluating the Viability of Acacia Populations in the Negev Desert: a Remote Sensing Approach. Biol. Conserv. 98, 127–137. doi:10.1016/S0006-3207(00)00147-6
le Polain de Waroux, Y., and Lambin, E. F. (2012). Monitoring Degradation in Arid and Semi-arid Forests and Woodlands: The Case of the Argan Woodlands (Morocco). Appl. Geogr. 32, 777–786. doi:10.1016/j.apgeog.2011.08.005
Leachtenauer, J., Daniel, K., and Vogl, T. (1998). Digitizing Satellite Imagery: Quality and Cost Considerations. Photogrammetric Eng. Remote Sens. 64, 29–34.
Lelong, C. C. D., Tshingomba, U. K., and Soti, V. (2020). Assessing Worldview-3 Multispectral Imaging Abilities to Map the Tree Diversity in Semi-arid Parklands. Int. J. Appl. Earth Obs. Geo. 93, 102211. doi:10.1016/j.jag.2020.102211
Lybbert, T. J., Aboudrare, A., Chaloud, D., Magnan, N., and Nash, M. (2011). Booming Markets for Moroccan Argan Oil Appear to Benefit Some Rural Households while Threatening the Endemic Argan Forest. Proc. Natl. Acad. Sci. U.S.A. 108, 13963–13968. doi:10.1073/pnas.1106382108
Marzolff, I., Stephan, R., Kirchhoff, M., Seeger, M., Aït Hssaine, A., and Ries, J. B. (2020). UAV-based Classification of Tree-Browsing Intensity in Open Woodlands. EGU General Assem. Online, 4–8 May 2020, 1–13. Available at: https://meetingorganizer.copernicus.org/EGU2020/EGU2020-10301.html.
McDonald, R. A., and Widlake, P. (2012). Looking Closer and Looking Broader: Gambit and Hexagon – the Peak of Film-Return Space Reconnaissance after Corona. Natl. Reconnaissance J. Discip. Pract., 39–74.
Michel, N. (2018). Patrimoine: d’anciennes photographies aériennes de l’Afrique menacées de destruction. Jeune Afr. 4, 12. Available at: https://www.jeuneafrique.com/677525/culture/patrimoine-danciennes-photographies-aeriennes-de-lafrique-menacees-de-destruction/(Accessed February 06, 2022).
Mirzabaev, A., Wu, J., Evans, J., García-Oliva, F., Hussein, I., Iqbal, M. H., et al. (2019). “Chapter 3: Desertification,” in Climate Change and Land: An IPCC Special Report on Climate Change, Desertification, Land Degradation, Sustainable Land Management, Food Security, and Greenhouse Gas Fluxes in Terrestrial Ecosystems. Editors P. R. Shukla, J. Skea, E. Calvo Buendia, V. Masson-Delmotte, H. O. Pörtner, and D. C. Roberts.
Morton, J. F., and Voss, G. L. (1987). The Argan Tree (Argania Sideroxylon, Sapotaceae), a Desert Source of Edible Oil. Econ. Bot. 41, 221–233. doi:10.1007/BF02858970
Moustakas, A., Guenther, M., Wiegand, K., Mueller, K. H., Ward, D., Meyer, K. M., et al. (2006). Long‐Term mortality Patterns of the Deep‐Rooted Acacia Erioloba: The Middle Class Shall die! J. Veg. Sci. 17, 473–480. doi:10.1111/j.1654-1103.2006.tb02468.x
Msanda, F., Mayad, E. H., and Furze, J. N. (2021). Floristic Biodiversity, Biogeographical Significance, and Importance of Morocco's Arganeraie Biosphere Reserve. Environ. Sci. Pollut. Res. 28, 64156–64165. doi:10.1007/s11356-020-11936-0
NASA (2022). NASA Space Science Data Coordinated Archive. Available at: https://nssdc.gsfc.nasa.gov/nmc (Accessed February 06, 2022).
Nita, M. D., Munteanu, C., Gutman, G., Abrudan, I. V., and Radeloff, V. C. (2018). Widespread Forest Cutting in the Aftermath of World War II Captured by Broad-Scale Historical Corona Spy Satellite Photography. Remote Sens. Environ. 204, 322–332. doi:10.1016/j.rse.2017.10.021
NPIC (National Photographic Interpretation Center) (1967). The KH-4a Camera System. Available at: https://www.nro.gov/Portals/65/documents/foia/CAL-Records/Cabinet2/DrawerC/2%20C%200061.pdf.
NRO (National Reconnaissance Office) (1967). Corona J Flight Data Book 1039-1. Available at: https://www.nro.gov/Portals/65/documents/foia/CAL-Records/Cabinet5/DrawerA/5%20A%200027.pdf.
NRO (National Reconnaissance Office) (1970). CRYSPER-C Performance Prediction Program. Memorandum for the Record. Available at: https://www.nro.gov/Portals/65/documents/foia/CAL-Records/Cabinet3/DrawerC/3%20C%200008.pdf.
NRO (National Reconnaissance Office) (1972). Hexagon Camera User Guide. Available at: https://www.nro.gov/Portals/65/documents/foia/declass/ForAll/101917/F-2017-00094.pdf.
Nyssen, J., Debever, M., Gebremeskel, G., De Wit, B., Hadgu, K. M., De Vriese, S., et al. (2021). Online Digital Archive of Aerial Photographs (1935–1941) of Ethiopia. Geosci. Data J., 1–34. doi:10.1002/gdj3.115
Oder, F., Fitzpatrick, J. C., and Worthman, P. E. (1988). The Corona Story. National Reconnaissance Office.
Oder, F., Fitzpatrick, J. C., and Worthman, P. E. (1992). The Hexagon Story. National Reconnaissance Office.
Pinto, A. T., Gonçalves, J. A., Beja, P., and Pradinho Honrado, J. (2019). From Archived Historical Aerial Imagery to Informative Orthophotos: A Framework for Retrieving the Past in Long-Term Socioecological Research. Remote Sens. 11, 1388. doi:10.3390/rs11111388
SAFSP (Directorate of Special Projects, Office of the Secretary of the Air Force)(1972). Performance Evaluation Team Mission 1203. Available at: https://www.nro.gov/Portals/65/documents/foia/declass/ForAll/041921/F-2020-00083_C05129988.pdf.
Schlesinger, W. H., and Gramenopoulos, N. (1996). Archival Photographs Show No Climate-Induced Changes in Woody Vegetation in the Sudan, 1943-1994*. Glob. Change Biol. 2, 137–141. doi:10.1111/j.1365-2486.1996.tb00058.x
Scollar, I., Galiatsatos, N., and Mugnier, C. (2016). Mapping from CORONA: Geometric Distortion in KH4 Images. Photogram Engng Rem. Sens. 82, 7–13. doi:10.14358/PERS.83.1.7
Sexton, J. O., Song, X.-P., Feng, M., Noojipady, P., Anand, A., Huang, C., et al. (2013). Global, 30-m Resolution Continuous Fields of Tree Cover: Landsat-Based Rescaling of MODIS Vegetation Continuous Fields with Lidar-Based Estimates of Error. Int. J. Digital Earth 6, 427–448. doi:10.1080/17538947.2013.786146
Shafeian, E., Fassnacht, F. E., and Latifi, H. (2021). Mapping Fractional Woody Cover in an Extensive Semi-arid Woodland Area at Different Spatial Grains with Sentinel-2 and Very High-Resolution Data. Int. J. Appl. Earth Obs. Geo. 105, 102621. doi:10.1016/j.jag.2021.102621
Shimada, M., Itoh, T., Motooka, T., Watanabe, M., Shiraishi, T., Thapa, R., et al. (2014). New Global Forest/non-Forest Maps from ALOS PALSAR Data (2007–2010). Remote Sens. Environ. 155, 13–31. doi:10.1016/j.rse.2014.04.014
Silver, M., Tiwari, A., and Karnieli, A. (2019). Identifying Vegetation in Arid Regions Using Object-Based Image Analysis with RGB-Only Aerial Imagery. Remote Sens. 11, 2308. doi:10.3390/rs11192308
Sohn, H.-G., Kim, G.-H., and Yom, J.-H. (2004). Mathematical Modelling of Historical Reconnaissance CORONA KH-4B Imagery. Photogramm. Rec. 19, 51–66. doi:10.1046/j.0031-868X.2003.00257.x
Tappan, G. G., Sall, M., Wood, E. C., and Cushing, M. (2004). Ecoregions and Land Cover Trends in Senegal. J. Arid Environ. 59, 427–462. doi:10.1016/j.jaridenv.2004.03.018
USGS (2018a). USGS EROS Archive - Declassified Data - Declassified Satellite Imagery – 1. Available at: https://www.usgs.gov/centers/eros/science/usgs-eros-archive-declassified-data-declassified-satellite-imagery-1 (Accessed February 06, 2022).
USGS (2018b). USGS EROS Archive - Declassified Data - Declassified Satellite Imagery – 2. Available at: https://www.usgs.gov/centers/eros/science/usgs-eros-archive-declassified-data-declassified-satellite-imagery-2 (Accessed February 06, 2022).
USGS (2018c). USGS EROS Archive - Declassified Data - Declassified Satellite Imagery – 3. Available at: https://www.usgs.gov/centers/eros/science/usgs-eros-archive-declassified-data-declassified-satellite-imagery-3 (Accessed February 06, 2022).
Usman, M., and Nichol, J. E. (2018). Remarkable Increase in Tree Density and Fuelwood Production in the Croplands of Northern Nigeria. Land Use Policy 78, 410–419. doi:10.1016/j.landusepol.2018.04.046
Wheelon, A. D. (1997). Corona: The First Reconnaissance Satellites. Phys. Today 50, 24–30. doi:10.1063/1.881677
Zahidi, A., Bani-Aameur, F., and El Mousadik, A. (2013). Seasonal Change Effects on Phenology of Argania Spinosa (L.) in the Fields. J. Ecol. Nat. Environ. 5, 189–205. doi:10.5897/JENE2013.0373
Keywords: very high resolution satellite imagery, HEXAGON, CORONA, change mapping, open-canopy woodland, dryland forest, tree density, woody cover
Citation: Marzolff I, Kirchhoff M, Stephan R, Seeger M, Aït Hssaine A and Ries JB (2022) Monitoring Dryland Trees With Remote Sensing. Part A: Beyond CORONA—Historical HEXAGON Satellite Imagery as a New Data Source for Mapping Open-Canopy Woodlands on the Tree Level. Front. Environ. Sci. 10:896702. doi: 10.3389/fenvs.2022.896702
Received: 15 March 2022; Accepted: 10 May 2022;
Published: 07 July 2022.
Edited by:
Niall Patrick Hanan, New Mexico State University, United StatesReviewed by:
Juan Carlos Laso Bayas, International Institute for Applied Systems Analysis (IIASA), AustriaNathan Moore, Michigan State University, United States
Brianna Lind, New Mexico State University, United States
Copyright © 2022 Marzolff, Kirchhoff, Stephan, Seeger, Aït Hssaine and Ries. This is an open-access article distributed under the terms of the Creative Commons Attribution License (CC BY). The use, distribution or reproduction in other forums is permitted, provided the original author(s) and the copyright owner(s) are credited and that the original publication in this journal is cited, in accordance with accepted academic practice. No use, distribution or reproduction is permitted which does not comply with these terms.
*Correspondence: Irene Marzolff, bWFyem9sZmZAZW0udW5pLWZyYW5rZnVydC5kZQ==