 Thomas Plocoste
 Lovely Euphrasie-Clotilde1
- 1Department of Research in Geoscience, KaruSphère SASU, Guadeloupe, France
- 2Université Antilles, LaRGE Laboratoire de Recherche en Géosciences et Energies (EA 4539), Pointe-à-Pitre, France
Due to African dust, the Caribbean area is known to have one of the highest incidences of asthma on the planet. Consequently, it is crucial to dissociate the impact of local sources from large scale sources in this region. The aim of this study was to estimate the PM10 detection threshold for dusty events using a statistical approach and a dynamic approach. To carry out this analysis, PM10 time series from Martinique (MAR), Guadeloupe (GPE) and Puerto-Rico (PR) were used between 2006 and 2016. The statistical analysis highlighted that the distance from the African coast is a key feature for PM10 concentrations distribution with the highest at MAR (26.52 μg/m3) and the lowest at PR (24.42 μg/m3). The probability density function analysis showed that MAR-GPE-PR distributions converge towards a same point between the first and the second maximum probability value at 28 μg/m3. The dynamical analysis with the Complete Ensemble Empirical Mode Decomposition with Adaptive Noise (CEEMDAN) and the Improved CEEMDAN (ICEEMDAN) validated the 28 μg/m3 found with the statistical analysis. The analysis of HYSPLIT back trajectories confirmed this threshold. Thus, our results indicated that 28 μg/m3 is the PM10 detection threshold for African dust in the Caribbean basin. It will therefore be a good indicator allowing the competent authorities to take the appropriate decisions to protect vulnerable populations during dusty events.
1 Introduction
Mineral dust is the most abundant type of aerosol on Earth (Jaenicke, 1988; Ramanathan et al., 2001). The Saharan and the Sahelian desert are the main mineral dust sources (d’Almeida, 1986; Tegen and Schepanski, 2009; Knippertz and Todd, 2012). Since 1967, many studies have demonstrated that large amount of African dust were routinely being transported across the Atlantic to the Caribbean (Delany et al., 1967; Parkin et al., 1967; Huang et al., 2010; Adams et al., 2012; Chin et al., 2014; Kim et al., 2017; Tegen and Schepanski, 2018; Euphrasie-Clotilde et al., 2020; Prospero et al., 2021), to mention a few.
In ecology, mineral dust plays a key role in nutrient cycling, allowing the fertilization of ecosystems in the American continent. The transport of these nutrients helps nourish the Amazon, compensating for the scarcity of nutrients in the soil of the region (Griffin, 2007). For example, soils in the Amazon Basin are deficient in phosphorus, essential to soil fertility (Prospero et al., 2020). The iron found in mineral dust is also essential in the ocean for the growth of phytoplankton, which is the basis of oceanic food chains (Villar-Argaiz et al., 2018). These nutrients reach the surface layer and the marine boundary layer through dry deposition or wet deposition (Rizzolo et al., 2017; López-García et al., 2021). In addition, the dry and hot conditions of dusty air masses alter atmospheric stability, inhibiting the formation and intensification of tropical cyclones (Dunion and Velden, 2004; Braun et al., 2012; Huang et al., 2020). As some of the solar energy does not reach the ocean surface when there is airborne dust, this lowers the temperature and prevents evaporation of water which is essential to the formation of hurricanes and tropical storms (Nowottnick et al., 2018).
Despite all these positive aspects, mineral dust also has harmful effects on health. In the literature, many studies associated it with cardiovascular and respiratory diseases, prematurity, general mortality, and a series of infectious diseases (Comrie, 2005; Griffin, 2007; Chen et al., 2010; Baughman et al., 2011; Tobías et al., 2011; Schweitzer et al., 2018; Dominguez-Rodriguez et al., 2020; Urrutia-Pereira et al., 2021), to cite a few. The populations most susceptible to short-term effects of airborne dust are: 1) the elderly, due to their lower immune capacity (Jiménez et al., 2010); 2) individuals affected by chronic cardiopulmonary diseases (Dominguez-Rodriguez et al., 2020); and (iii)children, whose lungs and airways are not fully developed (Yu et al., 2012). Furthermore, African dust can also carry bacteria, fungi and viruses (Sakhamuri and Cummings, 2019).
Many studies have highlighted the impact of desert dust on Caribbean population. In Trinidad, Gyan et al. (2005) exhibited a relationship between African dust and respiratory stress, increased asthma exacerbations and emergency admissions, and increased daily rates of pediatric hospitalization. In Barbados and Trinidad, Monteil (2008) also observed a significant increase in pediatric admissions 7 days after major dust outbreaks. Cadelis et al. (2014) found the same behavior in Guadeloupe with a relationship between particulate matter from African dust and an increased risk for visits to emergency services in children with asthma. In Grenada, Akpinar-Elci et al. (2015) has shown that mineral dust coupled with seasonal humidity allows the formation of inhalable particles that aggravate asthma among residents. Thus, the Caribbean are known to have some of the highest incidences of asthma on the planet due to dust outbreaks (Urrutia-Pereira et al., 2021). A recent study made by Viel et al. (2020) in Guadeloupe also indicated that Saharan dust seems to influence weight but not length or head circumference at birth. For all the reasons aforementioned, it is therefore crucial to determine the detection threshold for African dust in the Caribbean basin. Mineral dust is a mixture of fine and coarse particles (Does et al., 2016). In this study, the authors focused on particles lower or equal to 10 μm in diameter called PM10 which are present in significant quantities in dust plumes (Petit et al., 2005) and can reach the trachea and the bronchi after inhalation (Urrutia-Pereira et al., 2021).
Previous studies have shown that the daily concentration of PM10 in the Caribbean area frequently exceeds the 50 μg/m3 recommended by the World Health Organization for an average of 24 h during the boreal summer (Martet et al., 2009; Prospero et al., 2014). Recently, Euphrasie-Clotilde et al. (2020) highlighted a dusty threshold of 35 μg/m3 using daily PM10 concentrations and optical measurements, i.e. Aerosols Optical Depth (AOD). However, for daily PM10 concentrations below 35 μg/m3, this study showed that the associated daily AOD data are also characterized by marine aerosols. The aim of this study is therefore to refine this threshold using statistical and dynamic methods with daily PM10 time series from three Caribbean islands: Martinique, Guadeloupe and Puerto-Rico.
In nature, it is well known that physical processes are often non-linear and non-stationary, showing the coexistence of different spatial–temporal scales (Huang et al., 2003; Bai et al., 2016; Plocoste et al., 2019). Many studies have demonstrated the non-linear properties of PM10 time series in the Caribbean area (Plocoste et al., 2017, 2020b, 2021b; Plocoste and Calif, 2021; Plocoste, 2022a; Plocoste, 2022b). This is the reason why multiscale decomposition methods were used to estimate PM10 detection threshold between local sources and large scale sources in a dynamical way. Empirical Mode Decomposition (EMD) is an adaptive time–frequency data analysis proposed by Huang et al. (1998) whose objective is to decompose any time series into a sum of different Intrinsic Mode Functions (IMFs) with a sifting procedure (Huang et al., 1999; Flandrin and Goncalves, 2004; Huang and Schmitt, 2014). However, this technique introduces a serious drawback which is the mode mixing problem (Yeh et al., 2010), i.e. the presence of very similar oscillations in different modes (Cao et al., 2019). To overcome the scale separation problem, the Ensemble EMD (EEMD) is introduced by Wu and Huang (2009). In this approach, randomly generated white noise series are added to the original signal to help the sifting process to avoid mode mixing. Nevertheless, the EEMD method cannot completely eliminate white noise after signal reconstruction (Luukko et al., 2016). To solve this issue, the Complete Ensemble Empirical Mode Decomposition with Adaptive Noise (CEEMDAN) was proposed by Torres et al. (2011). As CEEMDAN modes have some residual noise and the signal information presents some spurious modes in the early stages, Colominas et al. (2014) introduced the Improved CEEMDAN (ICEEMDAN), obtaining components with less noise and more physical meaning. Recently, CEEMDAN and ICEEMDAN approaches have been applied in several fields such as finance (Cao et al., 2019; Wu et al., 2020), entropy (Kuai et al., 2018; Kou et al., 2020), air pollution (Du et al., 2020; Xiao et al., 2021; Plocoste, 2022b) and renewable energy (Zhang et al., 2017; Rezaie-Balf et al., 2019; Gao et al., 2020; Sibtain et al., 2021), to mention a few. Usually, these methods are used for forecasting purposes. To our knowledge, no study has yet used CEEMDAN and ICEEMDAN frameworks to investigate the background atmosphere of an air pollutant.
2 Experimental Data
PM10 data of three Caribbean islands were included in this analysis with respectively Martinique (MAR), Guadeloupe (GPE) and Puerto-Rico (PR) (see Figure 1). MAR and GPE measurements are made by Les Associations Agréées de Surveillance de Qualité de l’air, a national organization that overseas air quality in each of the French administrative regions while PR measurements is carried out by the United States air quality network. For MAR-GPE-PR, PM10 data are respectively released by MadininAir, Gwad’Air and Air Now agencies. It is important to emphasize that each island uses the same sensor and the same measurement protocol. Using the Thermo Scientific Tapered Element Oscillating Microbalance (TEOM) models 1400 ab and 1400-FDMS, PM10 data is continuously sampled and stored as 15 min averages which were used to calculate daily averages concentrations analyzed in this study. For 24 h, the measurement accuracy is ±0.5 μg/m3 (Euphrasie-Clotilde et al., 2020).
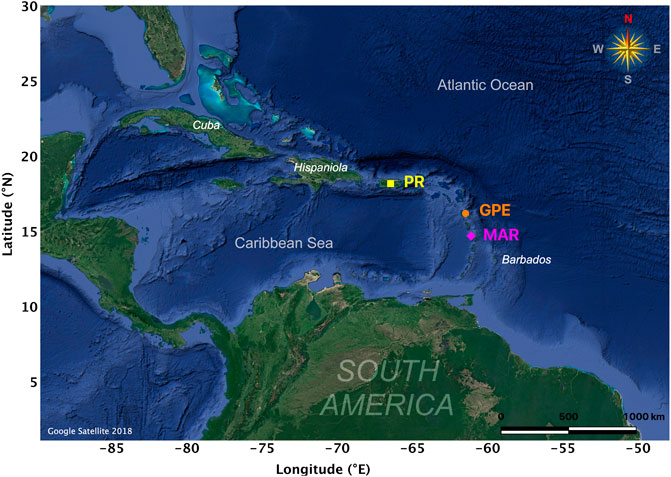
FIGURE 1. Overview of the Caribbean area with Puerto-Rico at the top (18.23°N, 66.50°W; PR in yellow) and Guadeloupe archipelago (16.25°N, 61.58°W; GPE in orange) then Martinique (14.66°N, 61.01°W; MAR in purple) in the middle.
For MAR-GPE-PR, PM10 measurements are respectively performed at Schoelcher (14.648°N 61.099°W, 2006–2016, urban area); Pointe-à-Pitre (16.242°N 61.541°W, 2006–2014, urban area) and Baie-Mahault (16.256°N 61.590°W, 2015–2016, suburban area); and Cataño (18.431°N 66.142°W, 2006–2016, suburban area). Consequently, 11 years of daily database is available for MAR-GPE-PR with 3,903–3,503–3,718 data points. A sequence of PM10 time series is displayed in Figure 2. One can observe that PM10 time series seem to follow the same temporal pattern for the three islands.
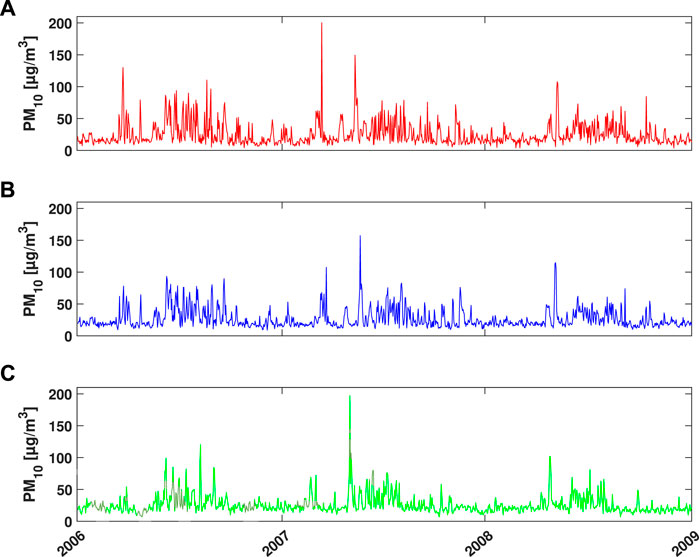
FIGURE 2. Illustration of daily measurements sequences of PM10 times series in (A) Martinique (MAR), (B) Guadeloupe (GPE) and (C) Puerto-Rico (PR) between 2006 and 2009.
3 Theoretical Framework
3.1 Hybrid Single Particle Lagrangian Integrated Trajectory
In literature, many studies have shown that Hybrid Single Particle Lagrangian Integrated Trajectory (HYSPLIT) is a robust tool to investigate the origin of air masses (McGowan and Clark, 2008; Ashrafi et al., 2014; Stein et al., 2015). In air pollution, HYSPLIT back trajectories are commonly performed to assess the origin of dusty air masses in the Caribbean basin (Prospero et al., 2014; Gläser et al., 2015; Euphrasie-Clotilde et al., 2020; Plocoste et al., 2020a). In HYSPLIT, the meteorological database used is the National Center for Atmospheric Research/National Centers for Environmental Prediction (NCAR/NCEP) re-analysis data (Kalnay et al., 1996). The following parameters are used to generate all daily back trajectories for MAR, GPE, and PR islands between 2006 and 2016: 1) Altitude: 1,500 m according to the properties of the Saharan Air Layer (SAL); 2) Starting locations: MAR (14.64°N; 61.09°W), GPE (16.24°N, 61.53°W), PR (18.43°N; 66.14°W); 3) Start time: 12 UTC (8 a.m. local time); 4) Duration: 10 days (240 h). Once back trajectories data as latitude/longitude and positions are created by HYSPLIT, this latter are transferred to QGIS geographic information system for visualisation (version QGIS-2.18.14, http://www.qgis.org/fr/site/). The protocol used in this study was validated and widely explained by Euphrasie-Clotilde et al. (2020).
3.2 CEEMDAN
As CEEMDAN is based on EEMD frame, the decomposition theory of EEMD is firstly presented. Let s the target signal. The EEMD algorithm can be describe as follow (Wu and Huang, 2009; Colominas et al., 2014):
• Step 1: Create s(i) = s + βw(i), where w(i) (i = 1, … , I) is a different white Gaussian noise and β > 0.
• Step 2: Fully decompose each s(i) (i = 1, … , I) by EMD, obtaining the modes
• Step 3: Put
In order to extract each
The main concept behind the CEEMDAN frame is the following: s(i) are generated from s and the first mode
Thereafter, EMD first mode is computed from an ensemble of r1 plus different realizations of a particular noise. The second mode
The following algorithm presents the CEEMDAN method in details. Specify Ej(⋅) as the operator that creates the kth mode obtained by EMD frame and let w(i) be a realization of zero mean unit variance white noise. If s is the target signal (Torres et al., 2011; Colominas et al., 2012):
• Step 1: For every i = 1, … I, decompose each s(i) = s + β0w(i) by EMD, until its first mode, and set the first CEEMDAN mode as:
• Step 2: For k = 1, compute the first residue as in Eq. (1):
• Step 3: For every i = 1, … I, decompose each r1 = s + β1E1(w(i)) by EMD and define the second CEEMDAN mode as:
• Step 4: For k = 2, … , K, compute the k-th residue:
• Step 5: For every i = 1, … I, decompose each rk + βkEk(w(i)) by EMD, until define the (k + 1)th CEEMDAN mode as:
• Step 6: Go to the step 4 for next k.
Iterate the steps 4–6 until the obtained residue can no longer be further decomposed by the EMD, because either it satisfies IMF criteria or it has been less than the three local extrema.
After construction of CEEMDAN, the final residue can be expressed as:
with k the total number of modes. Thus, the given signal s can be expressed as:
Equation 7 makes the proposed decomposition complete and gives an exact reconstruction of the original data. It is important to emphasize that the final number of modes is determined only by the data and the stop criterion. The selection of the Signal to Noise Ratio (SNR) are determined by the coefficients βk = ɛk std(rk).
3.3 ICEEMDAN
Even if CEEMDAN solved the problem of the number of modes for different realizations of signal plus noise, it still has some problems which may be improved (Colominas et al., 2014; Thuraisingham, 2021). Indeed, its modes contain some residual noise and the signal information presents some spurious modes in the early stages of the decomposition (Colominas et al., 2014). To improve on this, Colominas et al. (2014) proposed the Improved CEEMDAN (ICEEMDAN), obtaining components with less noise and more physical meaning. The ICEEMDAN algorithm is described based on CEEMDAN as follows (Colominas et al., 2014):
• Step 1: Compute by EMD the local means of I realizations s(i) = s + β0E1(w(i)) to get the first residue:
• Step 2: For k = 1, compute the first mode:
• Step 3: Estimate the second residue as the average of local means of the realizations r1 + β1E2(w(i)); then the second mode is defined as:
• Step 4: For k = 3, … , K, compute the kth residue:
• Step 5: Calculate the kth mode:
• Step 6: Repeat step 4 for the next k.
4 Results and Discussion
4.1 Descriptive Statistics
4.1.1 Overall Analysis
To understand the behavior of PM10 concentrations in the Caribbean area, the descriptive statistics are firstly computed. Figure 3 shows the box-plot of daily PM10 concentrations at MAR, GPE and PR from 2006 to 2016. At first glance, the box-plots seem to present the same pattern. The 25th percentiles and the medians are almost similar at MAR-GPE-PR with respectively 15.0-16.7-16.0 μg/m3 and 21.0-20.7-20.0 μg/m3. As regards the 75th and the 95th percentiles, a decrease is observed from MAR to PR with respectively 32.0-30.7-27.0 μg/m3 and 57.0-52.0-43.0 μg/m3. For each island, one can observe the presence of outliers. They are mainly due to African dust outbreaks. Indeed, a study made by Euphrasie-Clotilde et al. (2020) with NOAA-HYSPLIT day-to-day back trajectories highlighted that 98% of concentrations higher or equal to 35 μg/m3 in the Caribbean area are related to air masses coming from the African coast.
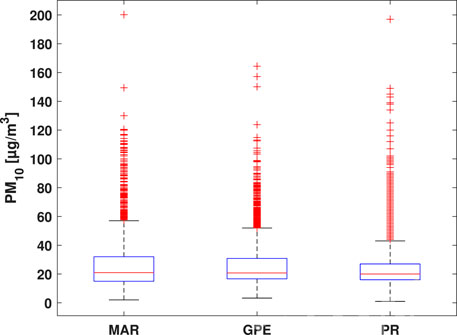
FIGURE 3. Box-plot of daily PM10 concentrations at Martinique (MAR), Guadeloupe (GPE) and Puerto-Rico (PR) from 2006 to 2016. The horizontal lines within the box represent the median while the bottom and top of each box are the 25th and 75th percentiles. The whiskers are the 5th and 95th percentiles.
Table 1 presents the statistical parameters for each studied island. The mean
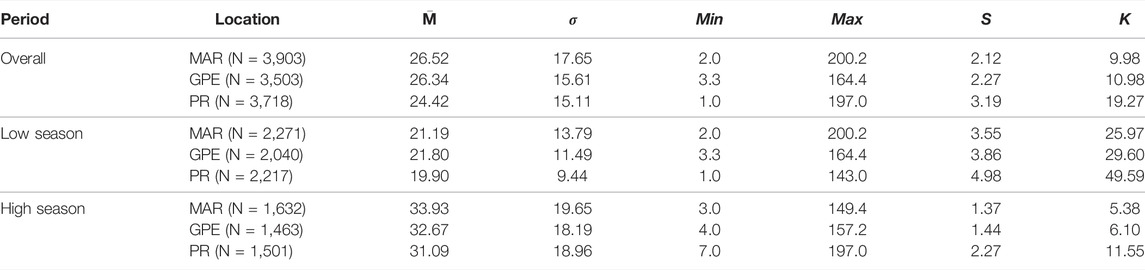
TABLE 1. Statistical parameters (Mean
It is important to emphasize that PM10 concentrations in the Caribbean
Moments of higher order, such as skewness (third order) and kurtosis (fourth order) are often estimated for a sharp characterization and therefore the highlighting of the Gaussianity of the considered process. Note that the third moment is zero for symmetric distributions. The kurtosis of a normal distribution is equal to 3. A positive kurtosis is therefore an indicator of the degree of intermittency. With 2.12 ≤ S ≤ 3.19 and 9.98 ≤ K ≤ 19.27, the skewness and kurtosis are positive for all PM10 time series. For S, it means that the frequency distribution moves away from a normal distribution on the right with a larger right tail. As K > 3, this indicates that the values we get are greater than the peak of a Gaussian distribution (Dong et al., 2017). In other words, there is in PM10 data some values related to extreme events and there is an irregularity in the process of PM10 emissions.
4.1.2 Seasonal Analysis
To refine the analysis of PM10 concentrations behavior, a statistical analysis is performed according to African dust seasonality. In the literature, many studies have shown that the low dust season runs from October to April while the high dust season runs from May to September in the Caribbean area (Prospero et al., 2014; Velasco-Merino et al., 2018; Plocoste and Pavón-Domínguez, 2020b). As expected, Table 1 shows that PM10 average concentrations are higher in the high dust season. As observed in section 4.1.1, there is a decrease in the average from MAR to PR during that period which is not the case in the low season. During summer months, a large amount of sand travels from the African coast towards the Caribbean in a Saharan Air Layer at an altitude between 1 and 5 km height (Prospero and Carlson, 1972; Tsamalis et al., 2013) and at an average speed of 10 ms−1 (Petit et al., 2005; Jury and Jiménez, 2021). Euphrasie-Clotilde et al. (2020) showed that ∼ 84% of dusty air masses in the Caribbean area come directly from the East African coasts. Many studies have already shown that Barbados (see Figure 1) is the first Caribbean island impacted by dust outbreaks (Prospero et al., 1970; Chiapello et al., 2005; Zuidema et al., 2019). Dry deposition (gravitational settling) and wet deposition (precipitation and cloud sweeping) are the two main processes that will remove these mineral dust from the atmosphere (Schepanski, 2018; Plocoste et al., 2021a). In other words, the further one moves away from the African coast, the lower the concentrations of PM10 linked to mineral dust.
Due to insular context, PM10 are mainly composed by marine aerosols and anthropogenic pollution in the low dust season (Clergue et al., 2015; Rastelli et al., 2017). In other words, this season is more representative of local pollution and sea spray. Contrary to African dust (large scale source), marine aerosols and anthropogenic pollution (mesoscale and local scale) fluctuate less over time. Indeed, anthropogenic pollution is related to daily human activities (Plocoste et al., 2018) while marine aerosols are advected by the trade winds which blow continuously during the year (Plocoste and Pavón-Domínguez, 2020a). This is the reason why σLow < σHigh.
In Table 1, one can observe that the minimum values are higher for the high dust season. This is due to the fact that a residual amount of dust remains in the atmosphere due to the continuous alternation between African easterly waves and dust outbreaks during that period (Plocoste et al., 2021c). As regards the maximum values, the behavior is different between both seasons. In the high dust season, these values correspond to the same haze of sand that impacted the Caribbean basin from May 14 to 20, 2007 with daily peaks on the 14 in MAR (149.4 μg/m3), 15 in GPE (157.2 μg/m3) and 16 in PR (197.0 μg/m3). This event seems special because although there is a daily lag between these peaks, the phenomenon increases in intensity instead of decreasing. One hypothesis would be the meeting between a mass of air coming from Africa and another one coming from cold higher latitudes, e.g., Alaska or Iceland, where main quantities of dust are transported southward and deposited in the North Atlantic (Prospero et al., 2012). This episode will be analyzed more precisely in a future study. Contrary to PR, one can notice that the higher maximum values for MAR and GPE are in the low dust season. During that period, dust outbreaks from Africa are more sporadic but can occur. With 200.2 μg/m3 on 16 February 2007 and 143.0 μg/m3 on 28 April 2010, MAR and PR are the perfect example. For GPE, the 164.4 μg/m3 is due to the eruption of Soufrière volcano at Montserrat in 13 February 2010 (mesoscale source) (Plocoste and Calif, 2019). All these results show that dust outbreaks are not the only natural source that can generate high PM10 concentrations in the Caribbean.
As regards the skewness and kurtosis, the same behavior is observed for both parameters, i.e. SHigh < SLow and KHigh < KLow. This may be due to the fact that African dust are recurrent in the high dust season (Plocoste et al., 2020a). During this period, days with PM10 concentrations exceeding the 50 μg/m3 recommended by the World Health Organization (2006) are more frequent. According to Huang et al. (2010), there is an average of ∼6 dust outbreak days per month during the summer months. Whatever the season, it may be noted that S and K values are higher for PR. The authors believe this is mainly due to the location of PM10 sensor. MAR and GPE seem to be undergoing the same plume of PM10 concentrations. To confirm this assumption, an analysis will have to be carried out with PM10 sampled at high frequency.
4.2 Distribution Analysis
To sharply describe the statistical information contained in a dataset, the probability density function (PDF) is a robust tool. It will allow to exhibit the entire range, mean and probability of occurrences of PM10 data. Figure 4 presents the PDFs of PM10 time series at MAR, GPE and PR over 11 years. Overall, one notice that all the PDFs show the same pattern. In “Area 1,” the first maximum probability value (peak of the PDF) is close between each island with 17.0 μg/m3 at MAR, 17.2 μg/m3 at PR and 19.2 μg/m3 at GPE. The higher value in GPE is due to the fact that the measurements are taken very close to the largest industrial area of the island (Plocoste et al., 2018). Then, all the distributions converge towards a same point at 28 μg/m3. In “Area 2,” it is important to underline that MAR and GPE curves are almost similar while that of PR diverges. The second maximum probability value is 46.2 μg/m3 at PR and 53.2 μg/m3 for MAR and GPE. Unlike the first peaks where the values seem homogeneous, the second peaks present a greater shift between PR and MAR-GPE. Intuitively, the first peak seems more representative of PM10 from local and mesoscale sources while the second seems strongly related to PM10 from large scale source. These results confirm that the further away from the African coast, the more the intensity of dusts outbreaks seems to decrease. Consequently, the authors believe that 28 μg/m3 is the detection threshold between local sources and large scale sources, i.e., African dust detection threshold.
FIGURE 4. Probability Density Function (PDF) of PM10 concentrations at Martinique (MAR), Guadeloupe (GPE) and Puerto-Rico (PR) from 2006 to 2016. The vertical purple dashed line indicates a point where all the distributions converge.
Figure 5 shows the distribution plot of PM10 concentrations by year. For some years, the same result as Figure 4 seems to be observed while for the others, the convergence point of the distributions, when it exists, is before or after the estimated threshold over 11 years. From one year to another, one can notice a strong heterogeneity in PM10 distribution for each island. This behavior is mainly due to the activation of dust sources in Africa. In summer, many African dust source in the Sahara and Sahel region become more active (Schepanski et al., 2007; Bou Karam et al., 2008; Kim et al., 2017). These activations are related to the development and movement of African easterly waves coupled with extra-tropical disturbances. The modifications of terrain properties in these source regions (vegetation cover or land use) combined with climate processes that affect them will act to modulate transport to the Caribbean area (Ginoux et al., 2012; Prospero et al., 2014). Indeed, PM10 inter-annual variability is also connected to dust removal and deposition mechanisms (e.g., changes in precipitation) (Gavrouzou et al., 2021). Drought years in the global dust belt zone are associated with a high presence of dust in the atmosphere due to reduced wet deposition (Dey and Di Girolamo, 2010; Prospero et al., 2021).
FIGURE 5. Probability Density Function (PDF) of PM10 concentrations at Martinique (MAR), Guadeloupe (GPE) and Puerto-Rico (PR) by year from 2006 to 2016. The vertical purple dashed line shows the African dust detection threshold estimated at 28 μg/m3 over 11 years.
4.3 Air Mass Back Trajectory
In order to validate the threshold previously determined in section 4.2, the daily HYSPLIT back trajectories are generated for dusty days (PM10 ≥ 28 μg/m3) and non-dusty days (PM10 < 28 μg/m3) from 2006 to 2016 according to Euphrasie-Clotilde et al. (2020) classification: North-West Atlantic Path (NWAP), South-West Atlantic Path (SWAP), North-Est Atlantic Path (NEAP), South America (SA) and North. NWAP and SWAP are air masses coming directly from the dust belt while NEAP is a circulation originating from the North of the United States which rotates nearby the African coasts. The seasonal behavior of these paths has been widely described in Euphrasie-Clotilde et al. (2020) works. On Figures 6, 7, one can observe that these paths (NWAP + SWAP + NEAP) correspond to the main air masses routes moving towards the Caribbean with on average 89 and 80% respectively for dusty days and non-dusty days. For both periods, the number of back trajectories passing near the eastern part of SA is of the same order of magnitude. Concerning the air masses coming directly from the North of the United States, these cases are at least 3 times greater during non-dusty days. In Figure 6, it is important to emphasize that PM10 average concentrations related to the back trajectories are well above the 28 μg/m3 threshold estimated. Furthermore, PM10 standard deviations of Figure 6 are higher than those of Figure 7. All these results highlight that dust sources activation in Africa is a key process allowing the increase of PM10 concentrations in the Caribbean area. Knowing that PM10 emissions from local sources are frequently below this threshold (see low season average in Table 1), these results confirm that 28 μg/m3 is a transition value between local sources and large scale sources as dust outbreaks. This threshold is lower than the 50 μg/m3 recommended by the World Health Organization for an average of 24 h (World Health Organization, 2006). It refines the threshold of 35 μg/m3 previously found in the literature to detect dust events (Euphrasie-Clotilde et al., 2020).
FIGURE 6. Cluster of daily back trajectories (in percentage) with their descriptive statistics (Mean
FIGURE 7. Cluster of daily back trajectories (in percentage) with their descriptive statistics (Mean
4.4 Multiscale Analysis
After studying the detection threshold between the local sources and large scale sources in a statistical way, we decide to analyze this threshold dynamically. Unlike statistical analysis, temporal analysis requires complete data to not compromise the dynamics of the signal, i.e. not modify the physical meaning of the studied parameter. Here, the difficulty was to have the maximum of complete and continuous data simultaneously for the three islands. This is the reason why 6 years were retained from 2006 to 2011 for this investigation.
In CEEMDAN and ICEEMDAN framework, the first mode characterizes the fast fluctuations while the last mode characterizes the slowest fluctuations (Torres et al., 2011; Colominas et al., 2014). The trend of the data is given by the residual part of the decomposition process (Hu et al., 2013). To perform the CEEMDAN and ICEEMDAN methods, the number of realizations was fixed at 300 and the Gaussian noise amplitude was set to 0.15 (Plocoste, 2022b). For each island, PM10 time series were decomposed into 10 IMFs and one residue. In order to assess the dynamic behavior of the PM10 detection threshold between local sources and large scale sources, the authors focused on the residual part of both approaches by comparing them to the statistical threshold estimated in section 4.2.
Figure 8 illustrates the residual from CEEMDAN and ICEEMDAN between 2006 and 2011. One can notice a heterogeneity in the residual behavior which seems to stabilize over the period of 6 years. Table 2 presents the statistical parameters for each method. Whatever approach is used, both methods converge towards the same result. Indeed, the average values of the residuals for each island are close to the statistical threshold of 28 μg/m3. The difference between the minimum and maximum values is smaller for MAR and GPE. As regards the standard deviation, the higher values is for PR. The authors assume that its greater distance from the African coasts and the location of the sensor may play a major role in this behavior for this location. In other words, the dynamical results are in agreement with the statistical results. Indeed, even with 6 years of data, the dynamic approach confirms the statistical threshold estimated with 11 years of data.
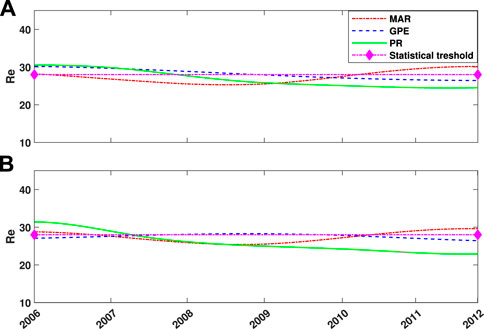
FIGURE 8. Residual (Re) from (A) CEEMDAN and (B) ICEEMDAN for Martinique (MAR), Guadeloupe (GPE) and Puerto-Rico (PR) from 2006 to 2011. The horizontal purple dash-dot line represents the PM10 statistical threshold estimated over 11 years at 28 μg/m3.
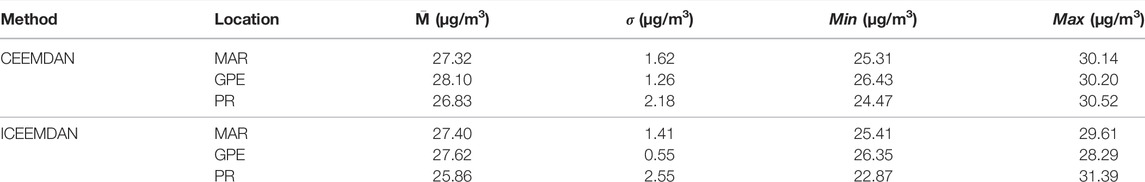
TABLE 2. Statistical parameters (Mean
Figures 9, 10 show the yearly residual part of PM10 times for each island respectively with CEEMDAN and ICEEMDAN methods. In both Figures one can observe that for some years the residual follows a seasonal cycle while for the others the residual can be almost constant. Overall, the residuals in Figure 10 seem closer to the statistical threshold of 28 μg/m3. It is important to recall that ICEEMDAN is the improved version of CEEMDAN (Colominas et al., 2014). For those following the seasonal cycle, the maximum values are generally between June and August, i.e., the period when the African dust sources are more active (Zuidema et al., 2019; Euphrasie-Clotilde et al., 2021; Gavrouzou et al., 2021). We must emphasize that the cases where the residue does not present seasonality are not anomalies. As its definition indicates, the residual gives the overall trend of PM10 time series, i.e., the background atmosphere. As expected, between MAR-GPE-PR, PR is the location where the seasonality is least marked in Figure 10 due to the arrival of air mass in Cataño from San Juan, i.e., the capital and the most populated area.
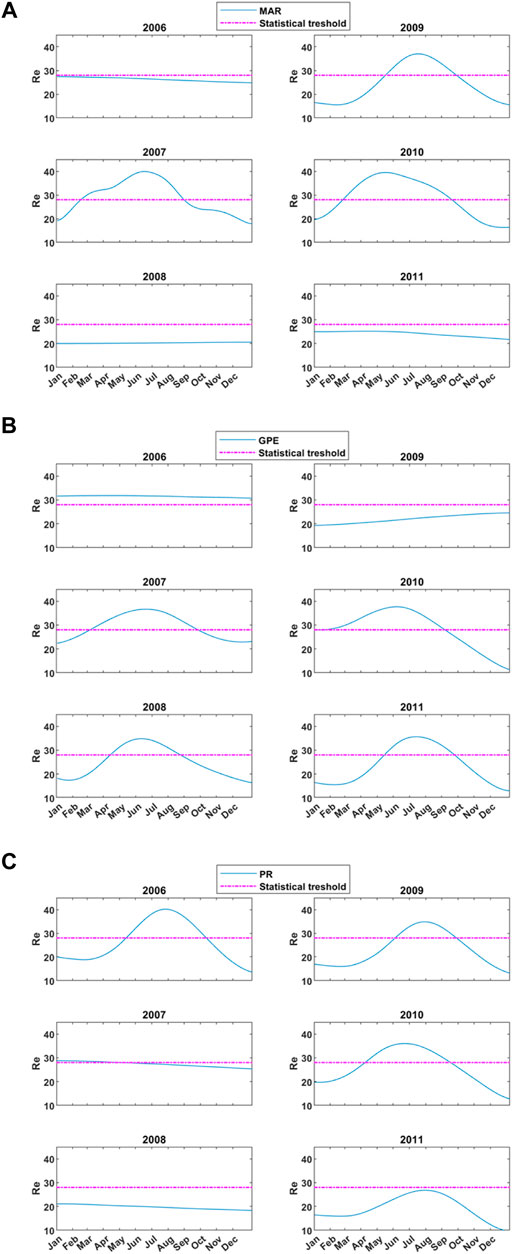
FIGURE 9. Residual (Re) from CEEMDAN for (A) Martinique (MAR), (B) Guadeloupe (GPE) and (C) Puerto-Rico (PR) by year. The horizontal purple dash-dot line represents the PM10 statistical threshold estimated over 11 years at 28 μg/m3.
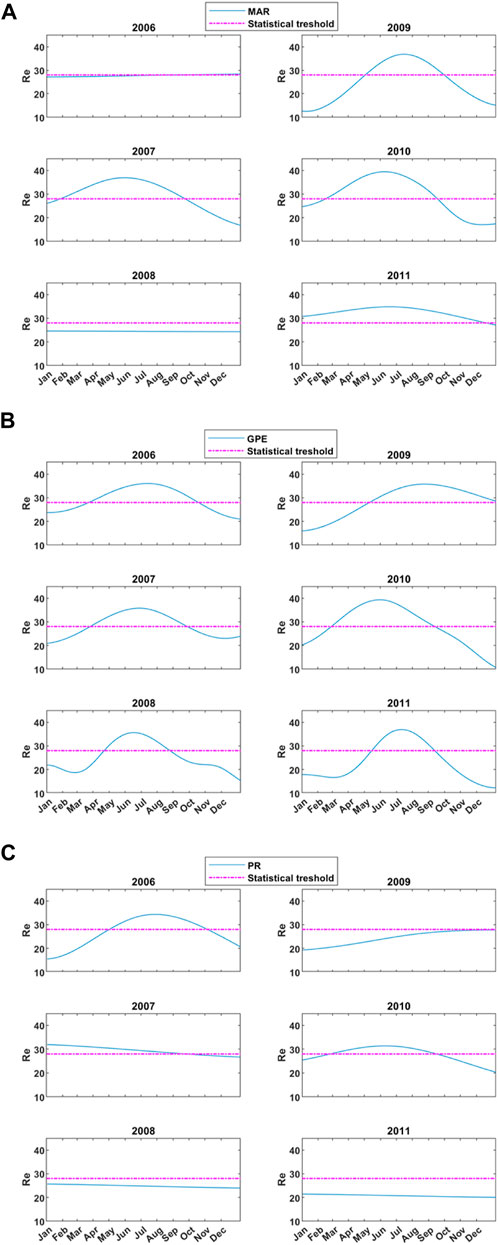
FIGURE 10. Residual (Re) from ICEEMDAN for (A) Martinique (MAR), (B) Guadeloupe (GPE) and (C) Puerto-Rico (PR) by year. The horizontal purple dash-dot line represents the PM10 statistical threshold estimated over 11 years at 28 μg/m3.
5 Conclusion
It is well known that air quality of the Caribbean basin is frequently deteriorated by African dust. Thus, vulnerable populations (the elderly, asthmatics or children) are often exposed to particulate pollution. That is why the aim of this study was to assess the PM10 detection threshold between local sources and large scale sources. To carry out this investigation, PM10 time series from Martinique (MAR), Guadeloupe (GPE) and Puerto-Rico (PR) islands were used.
The statistical analysis showed that the distance from the African coast is a key element for the distribution of PM10 concentrations during the high dust season in summer. Indeed, MAR which is the closest island has the highest PM10 average and the lowest kurtosis. Conversely, PR which is the furthest away has the lowest PM10 average and the highest kurtosis. During this period, high PM10 concentrations are mainly related to large scale sources. In the low dust season, PM10 concentrations are mainly related to local sources. Using the PDF analysis, a statistical threshold was estimated at 28 μg/m3. HYSPLIT back trajectories analysis confirmed this threshold. The authors assume that this value corresponds to the PM10 detection threshold between local sources and large scale sources.
In order to investigate this threshold in a dynamical way, the residual part of two multiscale decomposition methods was analyzed. CEEMDAN and ICEEMDAN results showed that the behavior of the residuals of each island over time remains close to the PM10 statistical threshold. Consequently, the dynamical results validate the PM10 detection threshold found with the statistical analysis.
To conclude, the results of this study are relevant because they define a new detection threshold for dust outbreaks in the Caribbean from ground measurements, i.e., after dry and wet deposition of mineral dust. These phenomena being events that last several days, this new threshold will make it possible to better determine the beginning and the end of a dusty episode in the atmospheric boundary layer. The competent authorities will therefore be able to take adequate measures to protect vulnerable populations. According to the European legislation, 28 μg/m3 corresponds to “medium” air quality (from 21 to 40 μg/m3). In view of the high rate of asthma in this area, the authors believe that this new threshold is more related to “poor” air quality, which actually corresponds to concentrations of 41–50 μg/m3 in European legislation. In this study, the impact of weather conditions on PM10 concentrations were not taken into account. This will be the aim of a future study.
Data Availability Statement
The data analyzed in this study is subject to the following licenses/restrictions: The data presented are available on request from the corresponding author. The data are not publicly available due to privacy or ethical reasons. Requests to access these datasets should be directed to thomas.plocoste@karusphere.com.
Author Contributions
TP: Writing–original draft, Conceptualization, Methodology, Software, Resources, Formal analysis, Data Curation, Supervision, Visualization, Validation, Investigation, Project administration, Writing–review and editing. LE-C: Investigation, Writing–original draft, Data Curation. RC: Supervision, Validation, Writing–review and editing. F-NB: Data Curation, Formal analysis.
Conflict of Interest
The authors declare that the research was conducted in the absence of any commercial or financial relationships that could be construed as a potential conflict of interest.
Publisher’s Note
All claims expressed in this article are solely those of the authors and do not necessarily represent those of their affiliated organizations, or those of the publisher, the editors and the reviewers. Any product that may be evaluated in this article, or claim that may be made by its manufacturer, is not guaranteed or endorsed by the publisher.
Acknowledgments
The authors are very grateful to the reviewers for their valuable comments and constructive suggestions, which helped us to improve substantially the quality of the paper. The authors would like to thank Martinique air quality network (MadininAir), Guadeloupe air quality network (Gwad’Air) and Puerto-Rico air quality network (Air Now) for providing air quality data. A special thanks to Mr Sylvio Laventure (geomatic specialist) for mapping assistance. The authors also acknowledge Dr. Gastón Schlotthauer for his valuable advice on CEEMDAN and ICEEMDAN methods.
References
Adams, A. M., Prospero, J. M., and Zhang, C. (2012). CALIPSO-derived Three-Dimensional Structure of Aerosol over the Atlantic Basin and Adjacent Continents. J. Clim. 25, 6862–6879. doi:10.1175/jcli-d-11-00672.1
Akpinar-Elci, M., Martin, F. E., Behr, J. G., and Diaz, R. (2015). Saharan Dust, Climate Variability, and Asthma in Grenada, the Caribbean. Int. J. Biometeorol. 59, 1667–1671. doi:10.1007/s00484-015-0973-2
Ashrafi, K., Shafiepour-Motlagh, M., Aslemand, A., and Ghader, S. (2014). Dust Storm Simulation over Iran Using HYSPLIT. J. Environ. Health Sci. Eng. 12, 9. doi:10.1186/2052-336x-12-9
Bai, Y., Li, Y., Wang, X., Xie, J., and Li, C. (2016). Air Pollutants Concentrations Forecasting Using Back Propagation Neural Network Based on Wavelet Decomposition with Meteorological Conditions. Atmos. Pollut. Res. 7, 557–566. doi:10.1016/j.apr.2016.01.004
Baughman, R. P., Culver, D. A., and Judson, M. A. (2011). A Concise Review of Pulmonary Sarcoidosis. Am. J. Respir. Crit. Care Med. 183, 573–581. doi:10.1164/rccm.201006-0865ci
Bou Karam, D., Flamant, C., Knippertz, P., Reitebuch, O., Pelon, J., Chong, M., et al. (2008). Dust Emissions over the Sahel Associated with the West African Monsoon Intertropical Discontinuity Region: A Representative Case-Study. Q. J. R. Meteorological Soc. A J. Atmos. Sci. Appl. meteorology Phys. Oceanogr. 134, 621–634. doi:10.1002/qj.244
Braun, S. A., Sippel, J. A., and Nolan, D. S. (2012). The Impact of Dry Midlevel Air on Hurricane Intensity in Idealized Simulations with No Mean Flow. J. Atmos. Sci. 69, 236–257. doi:10.1175/jas-d-10-05007.1
Cadelis, G., Tourres, R., and Molinie, J. (2014). Short-term Effects of the Particulate Pollutants Contained in Saharan Dust on the Visits of Children to the Emergency Department Due to Asthmatic Conditions in guadeloupe (French Archipelago of the Caribbean). PloS one 9, e91136. doi:10.1371/journal.pone.0091136
Cao, J., Li, Z., and Li, J. (2019). Financial Time Series Forecasting Model Based on CEEMDAN and LSTM. Phys. A Stat. Mech. its Appl. 519, 127–139. doi:10.1016/j.physa.2018.11.061
Chen, P.-S., Tsai, F. T., Lin, C. K., Yang, C.-Y., Chan, C.-C., Young, C.-Y., et al. (2010). Ambient Influenza and Avian Influenza Virus during Dust Storm Days and Background Days. Environ. health Perspect. 118, 1211–1216. doi:10.1289/ehp.0901782
Chiapello, I., Moulin, C., and Prospero, J. M. (2005). Understanding the Long-Term Variability of African Dust Transport across the Atlantic as Recorded in Both Barbados Surface Concentrations and Large-Scale Total Ozone Mapping Spectrometer (TOMS) Optical Thickness. J. Geophys. Res. Atmos. 110, 1–9. doi:10.1029/2004jd005132
Chin, M., Diehl, T., Tan, Q., Prospero, J., Kahn, R., Remer, L., et al. (2014). Multi-decadal Aerosol Variations from 1980 to 2009: a Perspective from Observations and a Global Model. Atmos. Chem. Phys. 14, 3657–3690. doi:10.5194/acp-14-3657-2014
Clergue, C., Dellinger, M., Buss, H., Gaillardet, J., Benedetti, M., and Dessert, C. (2015). Influence of Atmospheric Deposits and Secondary Minerals on Li Isotopes Budget in a Highly Weathered Catchment, Guadeloupe (Lesser Antilles). Chem. Geol. 414, 28–41. doi:10.1016/j.chemgeo.2015.08.015
Colominas, M. A., Schlotthauer, G., Torres, M. E., and Flandrin, P. (2012). Noise-assisted EMD Methods in Action. Adv. Adapt. Data Anal. 4, 1250025. doi:10.1142/s1793536912500252
Colominas, M. A., Schlotthauer, G., and Torres, M. E. (2014). Improved Complete Ensemble EMD: A Suitable Tool for Biomedical Signal Processing. Biomed. Signal Process. Control 14, 19–29. doi:10.1016/j.bspc.2014.06.009
Comrie, A. C. (2005). Climate Factors Influencing Coccidioidomycosis Seasonality and Outbreaks. Environ. health Perspect. 113, 688–692. doi:10.1289/ehp.7786
d’Almeida, G. A. (1986). A Model for Saharan Dust Transport. J. Appl. Meteorol. Climatol. 25, 903–916.
Delany, A., Delany, A. C., Parkin, D., Griffin, J., Goldberg, E., and Reimann, B. (1967). Airborne Dust Collected at Barbados. Geochim. Cosmochim. acta 31, 885–909. doi:10.1016/s0016-7037(67)80037-1
Dey, S., and Di Girolamo, L. (2010). A Climatology of Aerosol Optical and Microphysical Properties over the Indian Subcontinent from 9 Years (2000–2008) of Multiangle Imaging Spectroradiometer (MISR) Data. J. Geophys. Res. Atmos. 115, 1–22. doi:10.1029/2009jd013395
Does, M. V. D., Korte, L. F., Munday, C. I., Brummer, G.-J. A., and Stuut, J.-B. W. (2016). Particle Size Traces Modern Saharan Dust Transport and Deposition across the Equatorial North Atlantic. Atmos. Chem. Phys. 16, 13697–13710. doi:10.5194/acp-16-13697-2016
Dominguez-Rodriguez, A., Rodríguez, S., Baez-Ferrer, N., Abreu-Gonzalez, P., Abreu-Gonzalez, J., Avanzas, P., et al. (2020). Impact of Saharan Dust Exposure on Airway Inflammation in Patients with Ischemic Heart Disease. Transl. Res. 224, 16–25. doi:10.1016/j.trsl.2020.05.011
Dong, Q., Wang, Y., and Li, P. (2017). Multifractal Behavior of an Air Pollutant Time Series and the Relevance to the Predictability. Environ. Pollut. 222, 444–457. doi:10.1016/j.envpol.2016.11.090
Du, P., Wang, J., Hao, Y., Niu, T., and Yang, W. (2020). A Novel Hybrid Model Based on Multi-Objective Harris Hawks Optimization Algorithm for Daily PM2.5 and PM10 Forecasting. Appl. Soft Comput. 96, 106620. doi:10.1016/j.asoc.2020.106620
Dunion, J. P., and Velden, C. S. (2004). The Impact of the Saharan Air Layer on Atlantic Tropical Cyclone Activity. Bull. Am. Meteorol. Soc. 85, 353–366. doi:10.1175/bams-85-3-353
Euphrasie-Clotilde, L., Plocoste, T., Feuillard, T., Velasco-Merino, C., Mateos, D., Toledano, C., et al. (2020). Assessment of a New Detection Threshold for PM10 Concentrations Linked to African Dust Events in the Caribbean Basin. Atmos. Environ. 224, 117354. doi:10.1016/j.atmosenv.2020.117354
Euphrasie-Clotilde, L., Plocoste, T., and Brute, F.-N. (2021). Particle Size Analysis of African Dust Haze over the Last 20 years: A Focus on the Extreme Event of June 2020. Atmosphere 12, 502. doi:10.3390/atmos12040502
Flandrin, P., and Goncalves, P. (2004). Empirical Mode Decompositions as Data-Driven Wavelet-like Expansions. Int. J. Wavelets, Multiresol. Inf. Process. 2, 477–496. doi:10.1142/s0219691304000561
Gao, B., Huang, X., Shi, J., Tai, Y., and Zhang, J. (2020). Hourly Forecasting of Solar Irradiance Based on CEEMDAN and Multi-Strategy CNN-LSTM Neural Networks. Renew. Energy 162, 1665–1683. doi:10.1016/j.renene.2020.09.141
Gavrouzou, M., Hatzianastassiou, N., Gkikas, A., Korras-Carraca, M.-B., and Mihalopoulos, N. (2021). A Global Climatology of Dust Aerosols Based on Satellite Data: Spatial, Seasonal and Inter-annual Patterns over the Period 2005–2019. Remote Sens. 13, 359. doi:10.3390/rs13030359
Ginoux, P., Prospero, J. M., Gill, T. E., Hsu, N. C., and Zhao, M. (2012). Global-scale Attribution of Anthropogenic and Natural Dust Sources and Their Emission Rates Based on MODIS Deep Blue Aerosol Products. Rev. Geophys. 50, 1–36. doi:10.1029/2012rg000388
Gläser, G., Wernli, H., Kerkweg, A., and Teubler, F. (2015). The Transatlantic Dust Transport from North Africa to the Americas—Its Characteristics and Source Regions. J. Geophys. Res. Atmos. 120, 11–231. doi:10.1002/2015jd023792
Griffin, D. W. (2007). Atmospheric Movement of Microorganisms in Clouds of Desert Dust and Implications for Human Health. Clin. Microbiol. Rev. 20, 459–477. doi:10.1128/cmr.00039-06
Gupta, A., Patil, R., and Gupta, S. (2004). A Statistical Analysis of Particulate Data Sets for Jawaharlal Nehru Port and Surrounding Harbour Region in India. Environ. Monit. Assess. 95, 295–309. doi:10.1023/b:emas.0000029910.17854.c4
Gyan, K., Henry, W., Lacaille, S., Laloo, A., Lamsee-Ebanks, C., McKay, S., et al. (2005). African Dust Clouds Are Associated with Increased Paediatric Asthma Accident and Emergency Admissions on the Caribbean Island of Trinidad. Int. J. Biometeorol. 49, 371–376. doi:10.1007/s00484-005-0257-3
Hu, M., Jia, L., Wang, J., and Pan, Y. (2013). Spatial and Temporal Characteristics of Particulate Matter in Beijing, China Using the Empirical Mode Decomposition Method. Sci. Total Environ. 458, 70–80. doi:10.1016/j.scitotenv.2013.04.005
Huang, Y., and Schmitt, F. G. (2014). Time Dependent Intrinsic Correlation Analysis of Temperature and Dissolved Oxygen Time Series Using Empirical Mode Decomposition. J. Mar. Syst. 130, 90–100. doi:10.1016/j.jmarsys.2013.06.007
Huang, N. E., Shen, Z., Long, S. R., Wu, M. C., Shih, H. H., Zheng, Q., et al. (1998). The Empirical Mode Decomposition and the Hilbert Spectrum for Nonlinear and Non-stationary Time Series Analysis. Proc. R. Soc. Lond. A Math. Phys. Eng. Sci. 454, 903–995. The Royal Society. doi:10.1098/rspa.1998.0193
Huang, N. E., Shen, Z., and Long, S. R. (1999). A New View of Nonlinear Water Waves: the Hilbert Spectrum. Annu. Rev. fluid Mech. 31, 417–457. doi:10.1146/annurev.fluid.31.1.417
Huang, N. E., Wu, M.-L. C., Long, S. R., Shen, S. S., Qu, W., Gloersen, P., et al. (2003). A Confidence Limit for the Empirical Mode Decomposition and Hilbert Spectral Analysis. Proc. R. Soc. Lond. Ser. A Math. Phys. Eng. Sci. 459, 2317–2345. doi:10.1098/rspa.2003.1123
Huang, J., Zhang, C., and Prospero, J. M. (2010). African Dust Outbreaks: A Satellite Perspective of Temporal and Spatial Variability over the Tropical Atlantic Ocean. J. Geophys. Res. Atmos. 115, 1–20. doi:10.1029/2009jd012516
Huang, W., Poberaj, C. S., Enz, B., Horat, C., and Lohmann, U. (2020). When Does the Saharan Air Layer Impede the Intensification of Tropical Cyclones? J. Clim. 33, 10609–10626. doi:10.1175/jcli-d-19-0854.1
Jaenicke, R. (1988). Aerosol Physics and Chemistry. Zahlenwerte Funkt. aus Naturwissenschaften Tech. 4, 391–457.
Jiménez, E., Linares, C., Martínez, D., and Díaz, J. (2010). Role of Saharan Dust in the Relationship between Particulate Matter and Short-Term Daily Mortality Among the Elderly in Madrid (Spain). Sci. Total Environ. 408, 5729–5736. doi:10.1016/j.scitotenv.2010.08.049
Jury, M. R., and Jiménez, A. T. N. (2021). Tropical Atlantic Dust and the Zonal Circulation. Theor. Appl. Climatol. 143, 901–913. doi:10.1007/s00704-020-03461-4
Kalnay, E., Kanamitsu, M., Kistler, R., Collins, W., Deaven, D., Gandin, L., et al. (1996). The NCEP/NCAR 40-year Reanalysis Project. Bull. Am. Meteorol. Soc. 77, 437–472. doi:10.1175/1520-0477(1996)077<0437:tnyrp>2.0.co;2
Kim, D., Chin, M., Remer, L. A., Diehl, T., Bian, H., Yu, H., et al. (2017). Role of Surface Wind and Vegetation Cover in Multi-Decadal Variations of Dust Emission in the Sahara and Sahel. Atmos. Environ. 148, 282–296. doi:10.1016/j.atmosenv.2016.10.051
Knippertz, P., and Todd, M. C. (2012). Mineral Dust Aerosols over the Sahara: Meteorological Controls on Emission and Transport and Implications for Modeling. Rev. Geophys. 50, 1–28. doi:10.1029/2011rg000362
Kou, Z., Yang, F., Wu, J., and Li, T. (2020). Application of ICEEMDAN Energy Entropy and AFSA-SVM for Fault Diagnosis of Hoist Sheave Bearing. Entropy 22, 1347. doi:10.3390/e22121347
Kuai, M., Cheng, G., Pang, Y., and Li, Y. (2018). Research of Planetary Gear Fault Diagnosis Based on Permutation Entropy of CEEMDAN and ANFIS. Sensors 18, 782. doi:10.3390/s18030782
López-García, P., Gelado-Caballero, M. D., Patey, M. D., and Hernández-Brito, J. J. (2021). Atmospheric Fluxes of Soluble Nutrients and Fe: More Than Three Years of Wet and Dry Deposition Measurements at Gran Canaria (Canary Islands). Atmos. Environ. 246, 118090. doi:10.1016/j.atmosenv.2020.118090
Luukko, P. J., Helske, J., and Räsänen, E. (2016). Introducing Libeemd: A Program Package for Performing the Ensemble Empirical Mode Decomposition. Comput. Stat. 31, 545–557. doi:10.1007/s00180-015-0603-9
Martet, M., Peuch, V., Laurent, B., Marticorena, B., and Bergametti, G. (2009). Evaluation of Long-Range Transport and Deposition of Desert Dust with the CTM MOCAGE. Tellus B Chem. Phys. Meteorol. 61, 449–463. doi:10.1111/j.1600-0889.2008.00413.x
McGowan, H., and Clark, A. (2008). Identification of Dust Transport Pathways from Lake Eyre, Australia Using Hysplit. Atmos. Environ. 42, 6915–6925. doi:10.1016/j.atmosenv.2008.05.053
Mijić, Z., Tasić, M., Rajšić, S., and Novaković, V. (2009). The Statistical Characters of PM10 in Belgrade Area. Atmos. Res. 92, 420–426. doi:10.1016/j.atmosres.2009.01.002
Momtazan, M., Geravandi, S., Rastegarimehr, B., Valipour, A., Ranjbarzadeh, A., Yari, A. R., et al. (2018). An Investigation of Particulate Matter and Relevant Cardiovascular Risks in Abadan and Khorramshahr in 2014–2016. Toxin Rev. 38, 290–297. doi:10.1080/15569543.2018.1463266
Monteil, M. A. (2008). Saharan Dust Clouds and Human Health in the English-speaking Caribbean: what We Know and Don’t Know. Environ. Geochem. Health 30, 339–343. doi:10.1007/s10653-008-9162-0
Nowottnick, E., Colarco, P., Braun, S., Barahona, D., Da Silva, A., Hlavka, D., et al. (2018). Dust Impacts on the 2012 Hurricane Nadine Track during the NASA HS3 Field Campaign. J. Atmos. Sci. 75, 2473–2489. doi:10.1175/jas-d-17-0237.1
Ozel, G., and Cakmakyapan, S. (2015). A New Approach to the Prediction of PM10 Concentrations in Central Anatolia Region, Turkey. Atmos. Pollut. Res. 6, 735–741. doi:10.5094/apr.2015.082
Parkin, D., Delany, A., and Delany, A. C. (1967). A Search for Airborne Cosmic Dust on Barbados. Geochim. Cosmochim. Acta 31, 1311–1320. doi:10.1016/s0016-7037(67)80017-6
Petit, R., Legrand, M., Jankowiak, I., Molinié, J., Asselin de Beauville, C., Marion, G., et al. (2005). Transport of Saharan Dust over the Caribbean Islands: Study of an Event. J. Geophys. Res. Atmos. 110, D18S09. doi:10.1029/2004jd004748
Plocoste, T., and Calif, R. (2019). “Spectral Observations of PM10 Fluctuations in the Hilbert Space,” in Functional Calculus (IntechOpen), 1–13.
Plocoste, T., and Calif, R. (2021). Is There a Causal Relationship between Particulate Matter (PM10) and Air Temperature Data? an Analysis Based on the Liang-Kleeman Information Transfer Theory. Atmos. Pollut. Res. 12, 101177. doi:10.1016/j.apr.2021.101177
Plocoste, T., and Pavón-Domínguez, P. (2020a). Multifractal Detrended Cross-Correlation Analysis of Wind Speed and Solar Radiation. Chaos Interdiscip. J. Nonlinear Sci. 30, 113109. doi:10.1063/5.0026354
Plocoste, T., and Pavón-Domínguez, P. (2020b). Temporal Scaling Study of Particulate Matter (PM10) and Solar Radiation Influences on Air Temperature in the Caribbean Basin Using a 3D Joint Multifractal Analysis. Atmos. Environ. 222, 117115. doi:10.1016/j.atmosenv.2019.117115
Plocoste, T., Calif, R., and Jacoby-Koaly, S. (2017). Temporal Multiscaling Characteristics of Particulate Matter PM10 and Ground-Level Ozone O3 Concentrations in Caribbean Region. Atmos. Environ. 169, 22–35. doi:10.1016/j.atmosenv.2017.08.068
Plocoste, T., Dorville, J.-F., Monjoly, S., Jacoby-Koaly, S., and André, M. (2018). Assessment of Nitrogen Oxides and Ground-Level Ozone Behavior in a Dense Air Quality Station Network: Case Study in the Lesser Antilles Arc. J. Air Waste Manag. Assoc. 68, 1278–1300. doi:10.1080/10962247.2018.1471428
Plocoste, T., Calif, R., and Jacoby-Koaly, S. (2019). Multi-scale Time Dependent Correlation between Synchronous Measurements of Ground-Level Ozone and Meteorological Parameters in the Caribbean Basin. Atmos. Environ. 211, 234–246. doi:10.1016/j.atmosenv.2019.05.001
Plocoste, T., Calif, R., Euphrasie-Clotilde, L., and Brute, F. (2020a). The Statistical Behavior of PM10 Events over Guadeloupean Archipelago: Stationarity, Modelling and Extreme Events. Atmos. Res. 241, 104956. doi:10.1016/j.atmosres.2020.104956
Plocoste, T., Calif, R., Euphrasie-Clotilde, L., and Brute, F.-N. (2020b). Investigation of Local Correlations between Particulate Matter (PM10) and Air Temperature in the Caribbean Basin Using Ensemble Empirical Mode Decomposition. Atmos. Pollut. Res. 11, 1692–1704. doi:10.1016/j.apr.2020.06.031
Plocoste, T., Carmona-Cabezas, R., Gutiérrez de Ravé, E., and Jimnez-Hornero, F. J. (2021a). Wet Scavenging Process of Particulate Matter (PM10): A Multivariate Complex Network Approach. Atmos. Pollut. Res. 12, 101095. doi:10.1016/j.apr.2021.101095
Plocoste, T., Carmona-Cabezas, R., Jiménez-Hornero, F. J., Gutiérrez de Ravé, E., and Calif, R. (2021b). Multifractal Characterisation of Particulate Matter (PM10) Time Series in the Caribbean Basin Using Visibility Graphs. Atmos. Pollut. Res. 12, 100–110. doi:10.1016/j.apr.2020.08.027
Plocoste, T., Carmona-Cabezas, R., Jiménez-Hornero, F. J., and Gutiérrez de Ravé, E. (2021c). Background PM10 Atmosphere: In the Seek of a Multifractal Characterization Using Complex Networks. J. Aerosol Sci. 155, 105777. doi:10.1016/j.jaerosci.2021.105777
Plocoste, T. (2022a). Detecting the Causal Nexus between Particulate Matter (PM10) and Rainfall in the Caribbean Area. Atmosphere 13, 175. doi:10.3390/atmos13020175
Plocoste, T. (2022b). Multiscale Analysis of the Dynamic Relationship between Particulate Matter (PM10) and Meteorological Parameters Using CEEMDAN: A Focus on “Godzilla” African Dust Event. Atmos. Pollut. Res., 101252. doi:10.1016/j.apr.2021.101252
Prospero, J. M., and Carlson, T. N. (1972). Vertical and Areal Distribution of Saharan Dust over the Western Equatorial North Atlantic Ocean. J. Geophys. Res. 77, 5255–5265. doi:10.1029/jc077i027p05255
Prospero, J. M., Bonatti, E., Schubert, C., and Carlson, T. N. (1970). Dust in the Caribbean Atmosphere Traced to an African Dust Storm. Earth Planet. Sci. Lett. 9, 287–293. doi:10.1016/0012-821x(70)90039-7
Prospero, J. M., Bullard, J. E., and Hodgkins, R. (2012). High-latitude Dust over the North Atlantic: Inputs from Icelandic Proglacial Dust Storms. science 335, 1078–1082. doi:10.1126/science.1217447
Prospero, J. M., Collard, F.-X., Molinié, J., and Jeannot, A. (2014). Characterizing the Annual Cycle of African Dust Transport to the Caribbean Basin and South America and its Impact on the Environment and Air Quality. Glob. Biogeochem. Cycles 28, 757–773. doi:10.1002/2013gb004802
Prospero, J. M., Barkley, A. E., Gaston, C. J., Gatineau, A., Campos y Sansano, A., and Panechou, K. (2020). Characterizing and Quantifying African Dust Transport and Deposition to South America: Implications for the Phosphorus Budget in the Amazon Basin. Glob. Biogeochem. Cycles 34, e2020GB006536. doi:10.1029/2020gb006536
Prospero, J. M., Delany, A. C., Delany, A. C., and Carlson, T. N. (2021). The Discovery of African Dust Transport to the Western Hemisphere and the Saharan Air Layer: A History. Bull. Am. Meteorol. Soc. 102, E1239–E1260. doi:10.1175/bams-d-19-0309.1
Ramanathan, V., Crutzen, P., Kiehl, J., and Rosenfeld, D. (2001). Aerosols, Climate, and the Hydrological Cycle. science 294, 2119–2124. doi:10.1126/science.1064034
Rastelli, E., Corinaldesi, C., Dell’Anno, A., Martire, M. L., Greco, S., Facchini, M. C., et al. (2017). Transfer of Labile Organic Matter and Microbes from the Ocean Surface to the Marine Aerosol: an Experimental Approach. Sci. Rep. 7, 11475. doi:10.1038/s41598-017-10563-z
Rezaie-Balf, M., Maleki, N., Kim, S., Ashrafian, A., Babaie-Miri, F., Kim, N. W., et al. (2019). Forecasting Daily Solar Radiation Using CEEMDAN Decomposition-Based MARS Model Trained by Crow Search Algorithm. Energies 12, 1416. doi:10.3390/en12081416
Rizzolo, J. A., Barbosa, C. G., Borillo, G. C., Godoi, A. F., Souza, R. A., Andreoli, R. V., et al. (2017). Soluble Iron Nutrients in Saharan Dust over the Central Amazon Rainforest. Atmos. Chem. Phys. 17, 2673–2687. doi:10.5194/acp-17-2673-2017
Sakhamuri, S., and Cummings, S. (2019). Increasing Trans-Atlantic Intrusion of Sahara Dust: a Cause of Concern? Lancet Planet. Health 3, e242–e243. doi:10.1016/s2542-5196(19)30088-9
Sansuddin, N., Ramli, N. A., Yahaya, A. S., Yusof, N. F. F. M., Ghazali, N. A., and Al Madhoun, W. A. (2011). Statistical Analysis of PM10 Concentrations at Different Locations in Malaysia. Environ. Monit. Assess. 180, 573–588. doi:10.1007/s10661-010-1806-8
Schepanski, K., Tegen, I., Laurent, B., Heinold, B., and Macke, A. (2007). A New Saharan Dust Source Activation Frequency Map Derived from MSG-SEVIRI IR-Channels. Geophys. Res. Lett. 34, 1–5. doi:10.1029/2007gl030168
Schepanski, K. (2018). Transport of Mineral Dust and its Impact on Climate. Geosciences 8, 151. doi:10.3390/geosciences8050151
Schweitzer, M. D., Calzadilla, A. S., Salamo, O., Sharifi, A., Kumar, N., Holt, G., et al. (2018). Lung Health in Era of Climate Change and Dust Storms. Environ. Res. 163, 36–42. doi:10.1016/j.envres.2018.02.001
Sibtain, M., Li, X., Saleem, S., Qurat-Ul-Ain, , , Asad, M. S., Tahir, T., et al. (2021). A Multistage Hybrid Model ICEEMDAN-SE-VMD-RDPG for a Multivariate Solar Irradiance Forecasting. IEEE Access 9, 37334–37363. doi:10.1109/access.2021.3062764
Stein, A., Draxler, R. R., Rolph, G. D., Stunder, B. J., Cohen, M., and Ngan, F. (2015). NOAA’s HYSPLIT Atmospheric Transport and Dispersion Modeling System. Bull. Am. Meteorological Soc. 96, 2059–2077. doi:10.1175/bams-d-14-00110.1
Tegen, I., and Schepanski, K. (2009). “The Global Distribution of Mineral Dust,” in In IOP Conference Series: Earth and Environmental Science (Bristol, UK: IOP Publishing), 012001. doi:10.1088/1755-1307/7/1/0120017
Tegen, I., and Schepanski, K. (2018). Climate Feedback on Aerosol Emission and Atmospheric Concentrations. Curr. Clim. Change Rep. 4, 1–10. doi:10.1007/s40641-018-0086-1
Thuraisingham, R. (2021). Revisiting ICEEMDAN and EEG Rhythms. Biomed. Signal Process. Control 68, 102701. doi:10.1016/j.bspc.2021.102701
Tobías, A., Caylà, J. A., Pey, J., Alastuey, A., and Querol, X. (2011). Are Saharan Dust Intrusions Increasing the Risk of Meningococcal Meningitis? Int. J. Infect. Dis. 15, e503. doi:10.1016/j.ijid.2011.03.008
Torres, M. E., Colominas, M. A., Schlotthauer, G., and Flandrin, P. (2011). “A Complete Ensemble Empirical Mode Decomposition with Adaptive Noise,” in 2011 IEEE international conference on acoustics, speech and signal processing (ICASSP) (IEEE), 4144–4147. doi:10.1109/icassp.2011.5947265
Tsamalis, C., Chédin, A., Pelon, J., and Capelle, V. (2013). The Seasonal Vertical Distribution of the Saharan Air Layer and its Modulation by the Wind. Atmos. Chem. Phys. 13, 11235–11257. doi:10.5194/acp-13-11235-2013
Urrutia-Pereira, M., Rizzo, L. V., Staffeld, P. L., Chong-Neto, H. J., Viegi, G., and Solé, D. (2021). Dust from the Sahara to the American Continent: Health Impacts: Dust from Sahara. Allergol. Immunopathol. 49, 187–194. doi:10.15586/aei.v49i4.436
Velasco-Merino, C., Mateos, D., Toledano, C., Prospero, J. M., Molinie, J., Euphrasie-Clotilde, L., et al. (2018). Impact of Long-Range Transport over the Atlantic Ocean on Saharan Dust Optical and Microphysical Properties Based on AERONET Data. Atmos. Chem. Phys. 18, 9411–9424. doi:10.5194/acp-18-9411-2018
Viel, J.-F., Michineau, L., Garbin, C., Monfort, C., Kadhel, P., Multigner, L., et al. (2020). Impact of Saharan Dust on Severe Small for Gestational Births in the Caribbean. Am. J. Trop. Med. Hyg. 102, 1463–1465. doi:10.4269/ajtmh.19-0699
Villar-Argaiz, M., Cabrerizo, M. J., González-Olalla, J. M., Valiñas, M. S., Rajic, S., and Carrillo, P. (2018). Growth Impacts of Saharan Dust, Mineral Nutrients, and CO2 on a Planktonic Herbivore in Southern Mediterranean Lakes. Sci. Total Environ. 639, 118–128. doi:10.1016/j.scitotenv.2018.05.041
Windsor, H., and Toumi, R. (2001). Scaling and Persistence of UK Pollution. Atmos. Environ. 35, 4545–4556. doi:10.1016/s1352-2310(01)00208-4
World Health Organization (2006). Air Quality Guidelines: Global Update 2005: Particulate Matter, Ozone, Nitrogen Dioxide, and Sulfur Dioxide. Copenhagen (Denmark): World Health Organization.
Wu, Z., and Huang, N. E. (2009). Ensemble Empirical Mode Decomposition: a Noise-Assisted Data Analysis Method. Adv. Adapt. data analysis 1, 1–41. doi:10.1142/s1793536909000047
Wu, J., Zhou, T., and Li, T. (2020). A Hybrid Approach Integrating Multiple ICEEMDANs, WOA, and RVFL Networks for Economic and Financial Time Series Forecasting. Complexity 2020, 1–17. doi:10.1155/2020/9318308
Xi, W., Chen, R. J., Chen, B. H., and Kan, H. D. (2013). Application of Statistical Distribution of PM10 Concentration in Air Quality Management in 5 Representative Cities of China. Biomed. Environ. Sci. 26, 638–646. doi:10.3967/0895-3988.2013.08.002
Xiao, Y.-j., Wang, X.-k., Wang, J.-q., and Zhang, H.-y. (2021). An Adaptive Decomposition and Ensemble Model for Short-Term Air Pollutant Concentration Forecast Using ICEEMDAN-ICA. Technol. Forecast. Soc. Change 166, 120655. doi:10.1016/j.techfore.2021.120655
Yeh, J.-R., Shieh, J.-S., and Huang, N. E. (2010). Complementary Ensemble Empirical Mode Decomposition: A Novel Noise Enhanced Data Analysis Method. Adv. Adapt. data Anal. 2, 135–156. doi:10.1142/s1793536910000422
Yu, H.-L., Chien, L.-C., and Yang, C.-H. (2012). Asian Dust Storm Elevates Children’s Respiratory Health Risks: a Spatiotemporal Analysis of Children’s Clinic Visits across Taipei (Taiwan). PloS one 7, e41317. doi:10.1371/journal.pone.0041317
Zhang, W., Qu, Z., Zhang, K., Mao, W., Ma, Y., and Fan, X. (2017). A Combined Model Based on CEEMDAN and Modified Flower Pollination Algorithm for Wind Speed Forecasting. Energy Convers. Manag. 136, 439–451. doi:10.1016/j.enconman.2017.01.022
Zuidema, P., Alvarez, C., Kramer, S. J., Custals, L., Izaguirre, M., Sealy, P., et al. (2019). Is Summer African Dust Arriving Earlier to Barbados? the Updated Long-Term In Situ Dust Mass Concentration Time Series from Ragged Point, Barbados, and Miami, Florida. Bull. Am. Meteorol. Soc. 100, 1981–1986. doi:10.1175/bams-d-18-0083.1
Keywords: PM10, african dust threshold, statistical analysis, multiscale analysis, caribbean area
Citation: Plocoste T, Euphrasie-Clotilde L, Calif R and Brute F-N (2022) Quantifying Spatio-Temporal Dynamics of African Dust Detection Threshold for PM10 Concentrations in the Caribbean Area Using Multiscale Decomposition. Front. Environ. Sci. 10:907440. doi: 10.3389/fenvs.2022.907440
Received: 29 March 2022; Accepted: 19 April 2022;
Published: 04 May 2022.
Edited by:
Chen Siyu, Lanzhou University, ChinaReviewed by:
Pravash Tiwari, China University of Mining and Technology, ChinaBakhat Rawat, Memorial University of Newfoundland, Canada
Copyright © 2022 Plocoste, Euphrasie-Clotilde, Calif and Brute. This is an open-access article distributed under the terms of the Creative Commons Attribution License (CC BY). The use, distribution or reproduction in other forums is permitted, provided the original author(s) and the copyright owner(s) are credited and that the original publication in this journal is cited, in accordance with accepted academic practice. No use, distribution or reproduction is permitted which does not comply with these terms.
*Correspondence: Thomas Plocoste , dGhvbWFzLnBsb2Nvc3RlQGthcnVzcGhlcmUuY29t