 Yunfeng Shang
 Ming Zhang
 Mengya Chen
 Xueying Wang
 Yuting Dong
- 1Zhejiang Yuexiu University of Foreign Languages, Shaoxing, China
- 2Portsmouth Business School, University of Portsmouth, Portsmouth, United Kingdom
- 3Tianjin University of Commerce Boustead College, Tianjin, China
- 4Department of economics, School of Economics, Jinan University, Guangdong, China
The study investigates the nexus of CO2 emissions, tourism, fossil fuels, and GDP growth using China’s data from 1970 to 2019. The research applied the upset U-molded EKC and the ARDL -models to calculate the time series stationarity variables. The results showed that in the initial enlargement phases, a sophisticated GDP adversely impacts CO2 emissions, then a higher GDP positively influences CO2 emissions. The development of tourism, use of fossil fuels (coal and oil), and population growth show an important influence on CO2 emissions but the use of gas and electricity has little effect on CO2 emissions. In contrast, foreign direct investment besides population development had little effect on increasing CO2 emissions. Retreating foreign direct investment, strengthening the use of sustainable electricity, and improving transportation for explorers, especially the green tourism business, are excellent ways to reduce environmental degradation in China.
Introduction
In recent decades, researchers have grown increasingly concerned about the CO2 emissions caused by global warming. Chinese tourism has seen a dramatic shift in recent decades as demand for visitors has grown at an exponential rate. China is suffering from environmental deterioration because of the rising use of fossil fuels like oil, coal, and gas. High energy consumption for China’s GDP development creates pollution, mostly in the form of CO2 emissions, as a result of FDI, population growth, and the creation of a high level of energy for industrial output. Zaman et al. (2017) concluded that a greater GDP per capita nust be raised to meet the higher energy consumption and environmental pollution. The link between economic growth, tourism, and CO2 emissions can be used to examine the repercussions of economic and tourist activities on the environmental quality using the instance of China. There will be a short-term increase in non-renewable energy sources because of a rise in population and greater personal well-being (Lee, 2011). According to empirical evidence, experiments show that oil use and carbon emissions deter renewable energy adoption by inelastic amounts. The deployment of carbon sequestration technology propels the energy transition’s growth (Kassouri et al., 2022). The study purpose is to determine the relationship between tourism, coal and oil consumption, population growth, and CO2 emissions. Rojas-vallejos and Lastuka (2020) states a tradeoff between fossil fuel byproducts and wage disparity, the compromise varies and depends on the level of advancement in each of these countries’ economies. ARDL results show that a rise in wealth, energy intensity, and resource rent causes a decrease in the load capacity factor, whereas human capital enhances environmental quality in the long term (Pata and Isik, 2021). When fossil fuels like coal, oil, and natural gas are burned, CO2 is released into the atmosphere, causing environmental damage (Sun et al., 2022b). Non-renewable energy, such as oil, gas, and coal, significantly influenced CO2 emissions (Khan et al., 2019). Renewable energy is a better option for the environment than fossil fuels. Economic development is not affected by integrating renewable energy and fossil fuels in all environmental degradation metrics (Altntaş and Kassouri, 2020; Sun et al., 2022c). Because of the rising demand for fossil fuels such as oil and gas, China’s rapidly growing population might have an effect on climate change and the consequent rise in CO2 emissions. China accounts for 28% of global CO2 emissions which might exacerbate climate change. In China, however, economic growth’s short-term elasticity is less than its long-term one, indicating that the EKC hypothesis is invalid (Yilanci and Pata, 2020).
The remainder of the study consists of a literature review described in chapter-2. In chapter-3, the methodology is discussed, along with data collection sources and an econometrical explanation of variables. Chapter-4 explains the results and descriptions of the tables. Chapter-5 described the conclusions.
Literature Review
Zhang and Cheng (2009) discovered that GDP drives energy consumption, which causes pollution. According to Meng and Niu (2011), CO2 emissions, energy consumption, and financial development are all linked in eight Asian countries. In a study of 27 OECD countries, Saboori and Sulaiman (2013) revealed a bidirectional relationship between energy usage, CO2 emissions, and financial development. The good and negative shocks to FDI and natural resources lower carbon emissions, which has a positive effect on the environment (Udemba and Yalçintaş, 2021). Liu et al. (2019) claims no substantial relationship between tourism and CO2 emissions. The scheduled operations and transportation exercises are highly linked to inbound travel, whereas petroleum products and fossil fuel byproducts negatively affect outbound travel in Thailand (Zhang and Cheng, 2009; Sun and Razzaq, 2022a). The country’s energy and industrial sectors are properly regulated by effective legislation (Udemba et al., 2021). Shi et al. (2019) observed that CO2 emissions in low-income countries are more adaptable to increased per capita traveler consumption. Tourists in a country would raise GDP, but they would also impair environmental quality due to petroleum derivatives’ high energy consumption (Tsui et al., 2018). Economic growth, institutional quality, and renewable energy all have a beneficial and detrimental influence on Chile’s environment by reducing and encouraging emissions (Udemba, 2021a). The burgeoning travel sector has coincided with increased financial prospects in Asia, and travel is now a significant industry contributing to the region’s financial prosperity. Anser et al. (2020) observed that population increase and per capita GDP are major sources of CO2 emissions in the SAARC area. Autoregressive disturbed lag limits testing results indicated that economic growth, coal consumption, financial development, imports, industrialization, and urbanization had a positive influence on CO2 emissions (Pata, 2018a). According to Grunewald et al. (2017), lower fossil fuel byproducts are related to higher pay disparity, while higher pay disparity increments per capita are associated with higher fossil fuel byproducts. Economic growth, population, and FDI all have one-way transmissions from ecological footprint and FDI to energy use in the long run; from ecological footprint and FDI to energy use in the short run; and from ecological footprint and FDI to energy use in the long run (Udemba, 2021b). It was found by identified a causal association between coal consumption and GDP growth in South Korea. Economic expansion was shown to be the leading contributor to rising CO2 emissions, followed by urbanization and financial development (Pata, 2018b). However, Jinke et al. (2008) identified a one-way causal relationship between GDP growth and coal consumption in Japan and China, but none in India, South Korea, or South Africa. Bilgili et al. (2021b) determined the encouraging exploration stage financing for geothermal energy research and tax incentives for the exploration stage and expanding the resource base through joint oil and gas drilling production. Rufeal (2010) revealed that while flammable gas consumption negatively influences CO2 emissions in most places, there may be a direct correlation in select areas. Compared to fossil fuels and renewable energy research and development, energy efficiency research and development is more successful in reducing carbon emissions (Bilgili et al., 2021a; Sun et al., 2022d). According to (He and Richard, 2010), increasing oil prices decreases oil consumption, lowering CO2 emissions. The globalization, openness to commerce, and increased affluence all contribute to environmental damage, whereas growing human capital lessens the ecological footprint in the long run (Pata and Caglar, 2021). Payne (2012) found that rising oil prices had a long-term detrimental influence on US CO2 emissions. Experts supported a cost level below market pricing to stimulate the use of flammable gas as a coal substitute. During the 2008 Beijing Olympics, the authorities increased coal to gas conversion in Beijing. GDP growth and FDI have been demonstrated to negatively impact Australia’s environmental quality via increasing carbon emissions (Udemba and Alola, 2022). According to Chang (2010). In contrast to electricity and gas, unprocessed petroleum and coal promote economic growth. All forms of energy consumption contribute to CO2 emissions, but the relationship between financial expansion and CO2 emissions is just one-way. Gaseous fuel can be used by the government to pursue its financial activities with minimum environmental impact in this case. Digging in gaseous fuel can occasionally restrict the unrestrained spread of low-carbon energy offices because gas is affordable, impeding the expansion of renewable energy sources like wind and sunshine.
Research Methodology
Data Collection
This study examines electricity, oil, flammable gas, and coal use from 1970 to 2019 using China’s Energy Center point, real GDP per capita, and CO2 emissions. The research used data before COVID-19 started since including data from 2020 to 2021 requires additional analytical methods. Table 1 shows all applicable variables and data gathering sources.
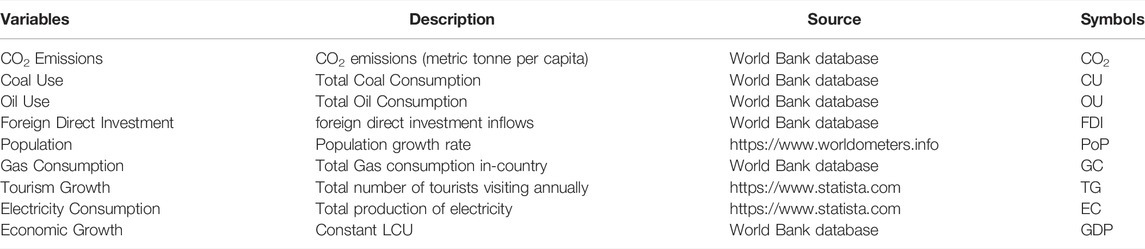
TABLE 1. Variables, descriptions, sources of data collection, and symbols.
Research Design
LogCO2 is the log of carbon dioxide emissions, while logGDP is the log of GDP per capita. When it comes to population growth, the study can use several metrics to track it. These include lnPoP, which stands for population growth, lnTG, which stands for tourist arrivals, lnFDI, which stands for foreign workers, and lnEU, which stands for electricity consumption. EKC and IPAT financial models are combined in this study to create a unique model in its own right. This study investigates the upset U-molded EKC using the EKC model. In the following image, the model is shown.
GDP1 is defined as a gross domestic product in the early stages of improvement, GDP2 as a gross domestic product in the latter stages of improvement, and v as the mistaken term,
The IPAT and EKC models have been used to study the influence of energy use and economic growth on CO2 emissions. This study focuses on the energy, combustible gas, oil, and coal, with the following model specifications:
The log of CO2 emissions is represented by lnCO2, while the log of GDP per capita is represented by lnGDP. When it comes to population growth, the study can use several metrics to track it. These include lnPoP, which stands for population growth, lnTG, which stands for tourist arrivals, lnFDI, which stands for foreign workers, and lnEU, which stands for electricity consumption. For the ARDL method, the Johansen approach and Engle-Granger strategies provide greater advantages. If you’re interested in learning more about how the model works, you can see how it compares to other models that use request I(0) and I(1) components. Because of this, the Expanded Dickey-Fuller (ADF) test is used to determine if a time-series data set has a unit root.
Where ∆ is the first differential operator,
For example, consider the first differential operator (j), (k), and (l), (m), (n), and (p), (q), (r), and (s). The F-statistic evaluates the null and alternative hypotheses for a long-run connection between the variables.
H0=∅0 = ∅1 = ∅2 = ∅3 = ∅4 = ∅5 = ∅6 = ∅7 = ∅8 = ∅9 = 0 (Long—run relationship does not Exist)
H1=∅0/ = V1/ = ∅2/ = ∅3/ = ∅4/ = ∅5/ = ∅6/ = ∅7/ = ∅8/ = ∅9/ = 0 (Long—run relationship exists)
As a result, determining whether or not there is a co-joining is a challenge. It is necessary to assess the long-term ARDL model after establishing whether or not the co-incorporation exists, and the following conditions are present:
The short-run ARDL model is derived from the long-run ARDL model, which contains the error correction component (ECT). The ECM equation and error correction model are as follows:
There may also be a long-term correlation between tourist arrivals, foreign employment, population expansion, and CO2 emissions.
Results and Discussions
The descriptive statistics for all of the variables in this study are shown in Table 2. lnCO2, lnCU, lnOU, lnTG, lnGU, lnPoP, lnGDP, lnGDP2, and lnEU are all included in the table which gives the maximum, minimum, mean, and standard deviation values. According to the Table 2, each variable has a substantial variance.
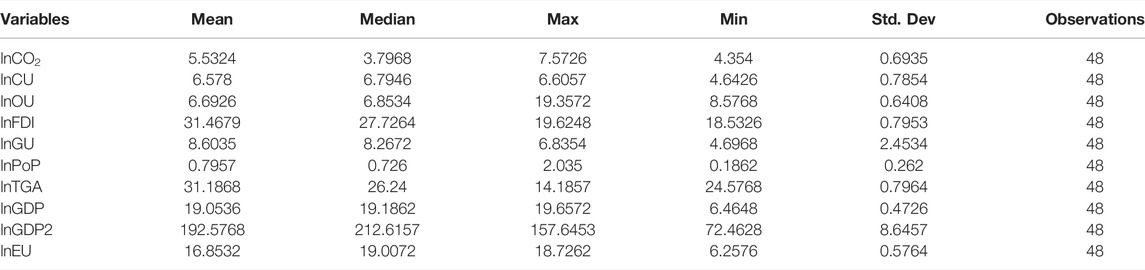
TABLE 2. Shows the results of descriptive statistics.
Using the unit root test, you can see the results in Table 3. Only lnCU and lnGU are fixed at the level with a pattern, whereas all the other components are not fixed at the level with no pattern. The results also reveal that all parameters are fixed at 1% at the main difference with almost no pattern. In terms of a pattern, all the variables except for lnCO2, which is enormous at 5%, are set at 1%, and before evaluating the long-run coefficients, the bound test was run.
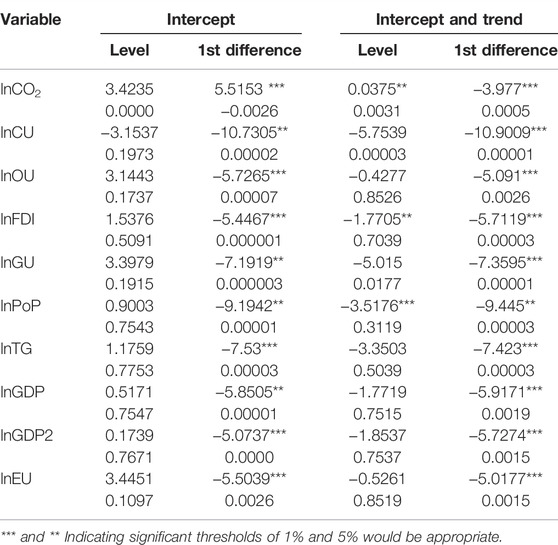
TABLE 3. Shows the results of the unit root test for intercept and trend.
As shown in Table 4, the bound test is complete, and it is more than the basic value at the 5% level of relevance, according to the F-value. The study may use the method of the impact of energy consumption, foreign direct investment, the tourism industry, GDP, GDP2, and electric use on CO2 emissions.
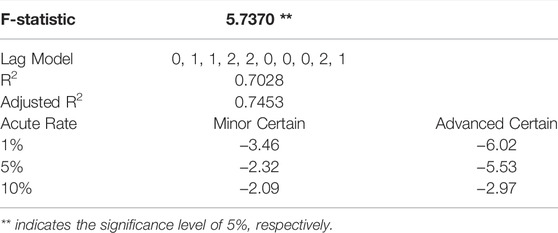
TABLE 4. Displays the results of the bound test.
Application of ARDL Method
Using the ARDL technique, researchers have discovered the long-term impacts on CO2 emissions of coal usage, oil use, gas use, energy use, unknown direct investment, population growth, vacationer appearances, GDP and GDP2. In addition, the findings reveal that traveler looks can have a long-term influence on CO2 emissions, which is crucial at 1%. The usage of combustible gases has also been proven to have no long-term connection with CO2 emissions (Table 5).
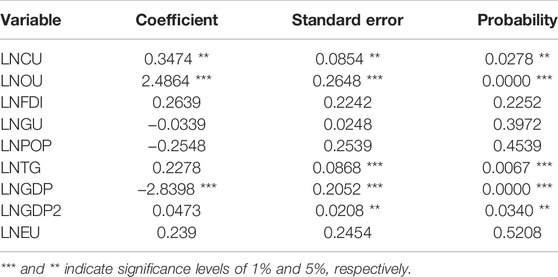
TABLE 5. Shows the long-term impacts of employing the ARDL method.
There is no long-term influence on CO2 emissions from increased petroleum gas usage, and CO2 emissions have no long-term correlation with population growth. In China, population growth has little effect on CO2 emissions over the long term. When GDP reaches its latter stages, it has a positive and important relationship with CO2 emissions, significant at 1%. A 1% increase in GDP2 can increase CO2 emissions over the long term, revealing long-term success with a U-molded EKC. The addition of FDI does not have a long-term impact on CO2 emissions and no link was made between electricity use and environmental decline. The study may conclude that unrefined petroleum consumption is linked positively to CO2 emissions, which are crucial at 1% and error correction term (ECT), energy consumption, FDI, tourism industry, GDP and GDP2 all have an impact on CO2 emissions in the short run using the ARDL technique.
Short-Run Impact of ARDL Technique
Table 6 illustrates these impacts, and the ECT coefficient is minus 1%, which is a large number. There is a strong correlation between the amount of CO2 released and the amount of coal used. According to the coefficient esteem, an increase in coal utilization of 1% can lead to a rise in the short term.
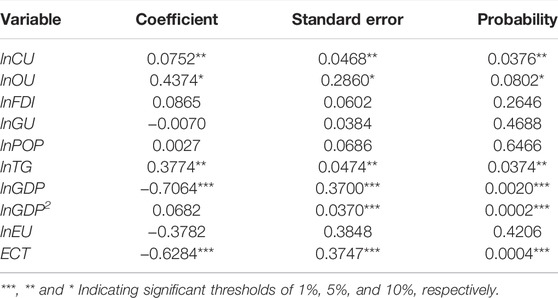
TABLE 6. Shows the results of the ARDL short-term impact method.
While electricity usage impacts CO2 emissions, the use of combustible gas has no such effect and energy consumption increases by one percent in this technique will have no direct influence on CO2 emissions. According to a coefficient of tourist appearances, tourists’ arrival has a five percent correlation with CO2 emissions. CO2 emissions are linked to the consumption of unrefined petroleum by 5%. There may be a rise in ecological corruption if raw petroleum grows in the short future. Diagnostic testing findings are summarized in Table 7 and include LM, Ramsey RESET stability, and Heteroscedasticity (Breusch-Godfrey Serial Correlation). The outcomes reveal that the model is free of diagnostic issues, implying that it can explain the influences of energy use, foreign direct investment inflows and tourist industry growth on CO2 emissions.
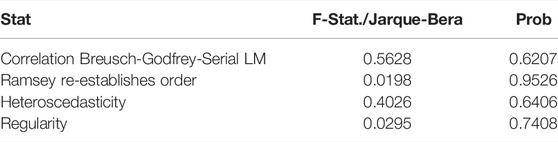
TABLE 7. Shows the results of several diagnostic procedures.
Robustness Test
Table 8 shows the elasticity estimates based on the robustness analysis. The augmented mean group and common correlated effects estimators are also employed to forecast long-run elasticities in order to verify the long-run discoveries. Technology long-run elasticities related with GDP growth, population growth, innovation electrical generation capacity, and technical innovation are homogeneous across all the regression estimators.

TABLE 8. Shows the results of the Robustness test.
However, the technological elasticity parameters associated with GDP and population growth are considered as actually irrelevant under the augmented mean group (AMG) and common correlated effects (CCE) research. With these findings, it is possible to make a better informed decision about whether or not to use the ARDL technique to address the cross-sectional dependency and inclination heterogeneity concerns in the data. The relapse exams are followed by a board causality inquiry. As the results show, financial reorganization has the potential to substantially increase the amount of cloudiness contamination, both in the short term and over the long term.
Discussions
The study’s findings may be explained by China’s recent shift in energy strategy, which aims to minimize the country’s dependence on foreign oil. When flammable gas is used, there is no indication that electricity has any influence on emissions (Dong et al., 2017a). When generating energy, combustible gas poses the least environmental risk. CO2 emissions are greatly affected by the usage of crude oil and coal. According to Pata and Kumar, (2021) the raw petroleum CO2 outflows nexus and coal and CO2 emissions in China and India are connected. When oil and coal are utilized as energy sources, carbon dioxide is emitted into the environment. CO2 emissions may be affected significantly by the presence of visitors. In the early stages of improvement, GDP is positively correlated with CO2 emissions. China’s southwest, central, and upper east regions have a U-shaped EKC similar for China’s tourism business (Jiang et al., 2020). The transportation sector’s growth will be accompanied by an increase in energy consumption. Unknown experts have little effect on CO2 emissions, either immediately or in the long run.
Conclusion
The study investigated the nexus of CO2 emissions, tourism, fossil fuels, and GDP growth using China’s data from 1970 to 2019. As a result of the attack on COVID-19, the research has omitted data from 2020 to 2021. The study applied the upset U-molded EKC using EKC and the ARDL models to calculate the time series stationarity variables. Gaseous fuel, electricity, or population increase has no immediate or long-term impact on natural debasement. Coal and oil use and increasing travel will raise CO2 emissions in the long and short terms alike. The bulk of new hires are working in fields that do not produce a lot of CO2 emissions, including construction and agriculture, so the GDP directly impacts CO2 emissions in both the short and long terms because these are all the resources of GDP growth. Finally, GDP per capita positively stimulates environmental decline in the long run and short run. The results of the study do not sustain the inverted U-shaped EKC. Long- and short-term impacts of GDP per capita on natural debasement can be attributed to both GDP1 and GDP2. These results are helping the politicians in selecting the appropriate course of action, as FDI, tourism industry, and electricity production energy use can lead to more GDP growth which directly plays a role in the environmental degradation of China. While the country may use gasoline and diesel more frequently, gas consumption creates a high quantity of CO2 emissions. Since China will not harm the ecology, it may attract more tourists.
Future Research Suggestions
In these two considerations, new research reveals that in the last phases of the revolution, GDP per capita can raise CO2 emissions. Even though the study can accomplish its goal, there are still areas that need to be addressed. Future studies may look at other countries, especially those rapidly developing, and to obtain better results, exclusively examine China (Dong et al., 2017b; Sharif et al., 2017; Udemba and Tosun, 2022).
Data Availability Statement
The original contributions presented in the study are included in the article/supplementary material, further inquiries can be directed to the corresponding authors.
Author Contributions
YS: Conceptualizing, writing, drafting—Original draft MZ: Conceptualizing, writing MC: Data and methodology XW: writing, drafting—Original draft YD: Conceptualizing, writing, drafting—Original draft.
Funding
Authors thank the financial support of Key accounting research projects of Tianjin Fiscal Bureau and Tianjin Accounting Society in 2021-2022 (N0. Q210606).
Conflict of Interest
The authors declare that the research was conducted in the absence of any commercial or financial relationships that could be construed as a potential conflict of interest.
Publisher’s Note
All claims expressed in this article are solely those of the authors and do not necessarily represent those of their affiliated organizations, or those of the publisher, the editors and the reviewers. Any product that may be evaluated in this article, or claim that may be made by its manufacturer, is not guaranteed or endorsed by the publisher.
References
Altıntaş, H., and Kassouri, Y. (2020). Is the Environmental Kuznets Curve in Europe Related to the Per-Capita Ecological Footprint or CO2 Emissions? Ecol. Indic. 113, 106187. doi:10.1016/j.ecolind.2020.106187
Anser, M. K., Alharthi, M., Aziz, B., and Wasim, S. (2020). Impact of Urbanization, Economic Growth, and Population Size on Residential Carbon Emissions in the SAARC Countries. Clean. Techn Environ. Policy 22 (4), 923–936. doi:10.1007/s10098-020-01833-y
Bilgili, F., Nathaniel, S. P., Kuşkaya, S., and Kassouri, Y. (2021a). Environmental Pollution and Energy Research and Development: an Environmental Kuznets Curve Model through Quantile Simulation Approach. Environ. Sci. Pollut. Res. 28 (38), 53712–53727. doi:10.1007/s11356-021-14506-0
Bilgili, F., Kuşkaya, S., Gençoğlu, P., Kassouri, Y., and Garang, A. P. M. (2021b). The Co-movements between Geothermal Energy Usage and CO2 Emissions through High and Low Frequency Cycles. Environ. Sci. Pollut. Res. 28 (45), 63723–63738. doi:10.1007/s11356-020-11000-x
Chang, C. C. (2010). A Multivariate Causality Test of Carbon Dioxide Emissions, Energy Consumption and Economic Growth in China. Appl. Energy 87, 3533–3537. doi:10.1016/j.apenergy.2010.05.004
Dong, K., Sun, R., and Hochman, G. (2017a2017). Do natural Gas and Renewable Energy Consumption Lead to Less CO2 Emission? Empirical Evidence from a Panel of BRICS Countries. Energy 141, 1466–1478. doi:10.1016/j.energy.2017.11.092
Dong, K., Sun, R., Hochman, G., Zeng, X., Li, H., and Jiang, H. (2017b). Impact of Natural Gas Consumption on CO2 Emissions: Panel Data Evidence from China's Provinces. J. Clean. Prod. 162, 400–410. doi:10.1016/j.jclepro.2017.06.100
Grunewald, N., Klasen, S., Martínez-Zarzoso, I., and Muris, C. (2017). The Trade-Off between Income Inequality and Carbon Dioxide Emissions. Ecol. Econ. 142, 249–256. doi:10.1016/j.ecolecon.2017.06.034
He, J., and Richard, P. (2010). Environmental Kuznets Curve for CO2 in Canada. Ecol. Econ. 69 (5), 1083–1093. doi:10.1016/j.ecolecon.2009.11.030
Jiang, M., Kim, E., and Woo, Y. (2020). The Relationship between Economic Growth and Air Pollution-A Regional Comparison between China and South Korea. Int. J. Environ. Res. Public Health 17, 2761. doi:10.3390/ijerph17082761
Jinke, L., Hualing, S., and Dianming, G. (2008). Causality Relationship between Coal Consumption and GDP: Difference of Major OECD and Non-OECD Countries. Appl. Energy 85, 421–429. doi:10.1016/j.apenergy.2007.10.007
Kassouri, Y., Altuntaş, M., and Alola, A. A. (2022). The Contributory Capacity of Natural Capital to Energy Transition in the European Union. Renew. Energy 190, 617–629. doi:10.1016/j.renene.2022.03.142
Khan, M. K., Teng, J.-Z., and Khan, M. I. (2019). Effect of Energy Consumption and Economic Growth on Carbon Dioxide Emissions in Pakistan with Dynamic ARDL Simulations Approach. Environ. Sci. Pollut. Res. 26, 23480–23490. doi:10.1007/s11356-019-05640-x
Lee, R. (2011). The Outlook for Population Growth. Science 333 (333), 569–573. doi:10.1126/science.1208859
Liu, Y., Kumail, T., Ali, W., and Sadiq, F. (2019). The Dynamic Relationship between CO2 Emission, International Tourism and Energy Consumption in Pakistan: a Cointegration Approach. Tour. Rev. 74 (4), 761–779. doi:10.1108/TR-01-2019-0006
Meng, M., and Niu, D. (2011). Modeling CO2 Emissions from Fossil Fuel Combustion Using the Logistic Equation. Energy 36 (5), 3355–3359. doi:10.1016/j.energy.2011.03.032
Pata, U. K., and Caglar, A. E. (2021). Investigating the EKC Hypothesis with Renewable Energy Consumption, Human Capital, Globalization and Trade Openness for China: Evidence from Augmented ARDL Approach with a Structural Break. Energy 216, 119220. doi:10.1016/j.energy.2020.119220
Pata, U. K., and Isik, C. (2021). Determinants of the Load Capacity Factor in China: A Novel Dynamic ARDL Approach for Ecological Footprint Accounting. Resour. Policy 74, 102313. doi:10.1016/j.resourpol.2021.102313
Pata, U. K., and Kumar, A. (2021). The Influence of Hydropower and Coal Consumption on Greenhouse Gas Emissions: A Comparison between China and India. Water 13, 1387. doi:10.3390/w13101387
Pata, U. K. (2018a). Renewable Energy Consumption, Urbanization, Financial Development, Income and CO2 Emissions in Turkey: Testing EKC Hypothesis with Structural Breaks. J. Clean. Prod. 187, 770–779. doi:10.1016/j.jclepro.2018.03.236
Pata, U. K. (2018b). The Influence of Coal and Noncarbohydrate Energy Consumption on CO2 Emissions: Revisiting the Environmental Kuznets Curve Hypothesis for Turkey. Energy 160, 1115–1123. doi:10.1016/j.energy.2018.07.095
Payne, J. E. (2012). The Causal Dynamics between US Renewable Energy Consumption, Output, Emissions, and Oil Prices. Energy Sources, Part B Econ. Plan. Policy 7 (4), 323–330. doi:10.1080/15567249.2011.595248
Rojas-vallejos, J., and Lastuka, A. (2020). The Income Inequality and Carbon Emissions Trade-Off Revisited. Energy Policy 139, 111302. doi:10.1016/j.enpol.2020.111302
Rufeal, Y. (2010). Coal Consumption and Economic Growth Revisited. Appl. Energy. 87, 160–167. doi:10.1016/j.apenergy.2009.05.001
Saboori, B., and Sulaiman, J. (2013). Environmental Degradation, Economic Growth and Energy Consumption: Evidence of the Environmental Kuznets Curve in Malaysia. Energy Policy 60, 892–905. doi:10.1016/j.enpol.2013.05.099
Sharif, A., Afshan, S., and Nisha, N. (2017). Impact of Tourism on CO2emission: Evidence from Pakistan. Asia Pac. J. Tour. Res. 22, 408–421. doi:10.1080/10941665.2016.1273960
Shi, H., Li, X., Zhang, H., Liu, X., Li, T., and Zhong, Z. (2019). Global Difference in the Relationships between Tourism, Economic Growth, CO2 Emissions, and Primary Energy Consumption. Curr. Issues Tour. 23, 1122–1137. doi:10.1080/13683500.2019.1588864
Sun, Y., and Razzaq, A. (2022a). Composite Fiscal Decentralisation and Green Innovation: Imperative Strategy for Institutional Reforms and Sustainable Development in OECD Countries. Sustain. Dev., 1–14. doi:10.1002/sd.2292
Sun, Y., Guan, W., Razzaq, A., Shahzad, M., and An, N. (2022b). Transition Towards Ecological Sustainability Through Fiscal Decentralization, Renewable Energy and Green Investment in OECD Countries. Renew. Energy 190, 385–395. doi:10.1016/j.renene.2022.03.099
Sun, Y., Razzaq, A., Sun, H., and Irfan, M. (2022c). The Asymmetric Influence of Renewable Energy and Green Innovation on Carbon Neutrality in China: Analysis From Non-Linear ARDL Model. Renew. Energy 193, 334–343. doi:10.1016/j.renene.2022.04.159
Sun, Y., Anwar, A., Razzaq, A., Liang, X., and Siddique, M. (2022d). Asymmetric Role of Renewable Energy, Green Innovation, and Globalization in Deriving Environmental Sustainability: Evidence from Top-10 Polluted Countries. Renew. Energy 185 , 280–290. doi:10.1016/j.renene.2021.12.038
Tsui, W. H. K., Balli, F., Tan, D. T. W., Lau, O., and Hasan, M. (2018). New Zealand Business Tourism. Tour. Econ. 24 (4), 386–417. doi:10.1177/1354816617731387
Udemba, E. N., and Alola, A. A. (2022). Asymmetric inference of carbon neutrality and energy transition policy in Australia: The (de)merit of foreign direct investment. J. Clean. Prod. 343, 131023. doi:10.1016/j.jclepro.2022.131023
Udemba, E. N., Güngör, H., Bekun, F. V., and Kirikkaleli, D. (2021). Economic Performance of India amidst High CO2 Emissions. Sustain. Prod. Consum. 27, 52–60. doi:10.1016/j.spc.2020.10.024
Udemba, E. N. (2021a). Mitigating Environmental Degradation with Institutional Quality and Foreign Direct Investment (FDI): New Evidence from Asymmetric Approach. Environ. Sci. Pollut. Res. 28 (32), 43669–43683. doi:10.1007/s11356-021-13805-w
Udemba, E. N. (2021b). Nexus of Ecological Footprint and Foreign Direct Investment Pattern in Carbon Neutrality: New Insight for United Arab Emirates (UAE). Environ. Sci. Pollut. Res. 28 (26), 34367–34385. doi:10.1007/s11356-021-12678-3
Udemba, E. N., and Tosun, M. (2022). Energy Transition and Diversification: A Pathway to Achieve Sustainable Development Goals (SDGs) in Brazil. Energy 239, 122199. doi:10.1016/j.energy.2021.122199
Udemba, E. N., and Yalçıntaş, S. (2021). Interacting Force of Foreign Direct Invest (FDI), Natural Resource and Economic Growth in Determining Environmental Performance: A Nonlinear Autoregressive Distributed Lag (NARDL) Approach. Resour. Policy 73, 102168. doi:10.1016/j.resourpol.2021.102168
Yilanci, V., and Pata, U. K. (2020). Investigating the EKC Hypothesis for China: the Role of Economic Complexity on Ecological Footprint. Environ. Sci. Pollut. Res. 27 (26), 32683–32694. doi:10.1007/s11356-020-09434-4
Zaman, K., Moemen, M. A.-e., and Islam, T. (2017). Dynamic Linkages between Tourism Transportation Expenditures, Carbon Dioxide Emission, Energy Consumption and Growth Factors: Evidence from the Transition Economies. Curr. Issues Tour. 20 (16), 1720–1735. doi:10.1080/13683500.2015.1135107
Keywords: CO2 emissions, FDI inflows, GDP growth, natural gas consumption, electricity consumption, ARDL methods
Citation: Shang Y, Zhang M, Chen M, Wang X and Dong Y (2022) A Nexus of CO2, Tourism Industry, GDP Growth, and Fossil Fuels. Front. Environ. Sci. 10:912252. doi: 10.3389/fenvs.2022.912252
Received: 04 April 2022; Accepted: 10 May 2022;
Published: 01 July 2022.
Edited by:
Mobeen Ur Rehman, Shaheed Zulfikar Ali Bhutto Institute of Science and Technology (SZABIST), United Arab EmiratesReviewed by:
Yacouba Kassouri, Leipzig University, GermanyEdmund Udemba, Gelişim Üniversitesi, Turkey
Ugur Korkut Pata, Osmaniye Korkut Ata University, Turkey
Copyright © 2022 Shang, Zhang, Chen, Wang and Dong. This is an open-access article distributed under the terms of the Creative Commons Attribution License (CC BY). The use, distribution or reproduction in other forums is permitted, provided the original author(s) and the copyright owner(s) are credited and that the original publication in this journal is cited, in accordance with accepted academic practice. No use, distribution or reproduction is permitted which does not comply with these terms.
*Correspondence: Yunfeng Shang, MjAxNDEwNzVAenl1ZmwuZWR1LmNu; Ming Zhang, MjAxMzEwNTBAenl1ZmwuZWR1LmNu; Mengya Chen, bWVuZ3lhLmNoZW5AbXlwb3J0LmFjLnVr; Xueying Wang, am9jZWx5bnd6QDEyNi5jb20=