 Mohamad A. Alkhalidi
 Zahraa H. Al-Nasser
 Hanan A. Al-Sarawi
- 1Civil Engineering Department, Kuwait University, Kuwait City, Kuwait
- 2Marine Science Center, Kuwait University, Kuwait City, Kuwait
- 3Director of Research and Studies Office, Kuwait Environment Public Authority (KEPA), Kuwait City, Kuwait
Marine pollution in shallow embayments is hazardous to human and marine health. This research investigates the environmental impact of sewage discharge from coastal outfalls on the semi-enclosed-shallow Doha Bay. Such a study highlights the impact of environmental stressors on the health of such bays. Also, the study assesses the spreading of the pollutant relative to the location of the pollution source. The bay is susceptible to sewage discharge as it is featured slow tidal currents leading to increased pollution concentrations within its basin. The concentrations and distributions of microbial water quality indicators (E. coli, fecal coliform, and fecal streptococci) were investigated parallel with physical and chemical water quality parameters. Water samples were collected from the outfalls and within Doha Bay for four months. The results show that the concentrations of discharged Biological Oxygen Demand (BOD), Total Suspended Solids (TSS), Total Dissolved Solids (TDS), Total Organic Carbon (COD), Nitrites (
Introduction
Many regions within the Arabian Gulf (AG) basin have environmental and economic importance, and many of them are susceptible to environmental alteration due to weak tidal circulation and shallow depths. The environmental pressure increased dramatically over the past sixty years due to rapid development, urbanization, and population increase, especially along the west coast of the gulf. The population increase per year in the AG varied between 1.83% in 1995 and 7.76% in 2010 (United Nations, 2019). As a result, the production of household, industrial, and medical sewages increased, and the discharge of pollutants into the sea became a real threat to human and marine lives and the environment. Furthermore, the urbanization was not matched by an appropriate waste treatment plant development, leading to a significant increase in pumping wastes (especially household sewage) to the sea. For example, there are five wastewater treatment plants (WWTPs) in Kuwait with a total treatment capacity of 324.34 million m3/year with an annual average of 275.3 million m3/year of treated wastewater. Comparing this with the 364.19 million m3/year inflow of sewage to the WWTPs, 88.89 million m3/year remains untreated and discharged to the sea (Aleisa and Al-Shayji, 2019). In addition, some of the treated water (about 42%) is pumped to the sea (Aleisa and Al-Shayji, 2019).
One of the most environmentally sensitive locations within the AG is Kuwait Bay (KB), located in the northwestern part of the gulf. The bay is a narrow-mouthed and semi-enclosed shallow embayment around 35 km wide and 130 km long coastline with a maximum depth of 23 m and mean depth of 5 m (Pokavanich and Alosairi, 2014; Devlin et al., 2015) and is a nutrient-rich area and is considered one of the most affluent fish and shrimp nursery areas and a feeding ground for wading birds in the AG (Al-Yamani et al., 2004; Devlin et al., 2015). Also, it is the home of the major trading ports linking Kuwait to the world (Figure 1) and the fishing industry, which is the second leading natural source after oil (Devlin et al., 2015). In addition, the Shatt Al-Arab River supplies the northern part of the bay with significant nutrients, and as a result, this part of the bay experiences high phytoplankton productivity characterized by high diversity and a strong diatoms dominance (Polikarpov et al., 2009; Al-Yamani and Saburova, 2011).
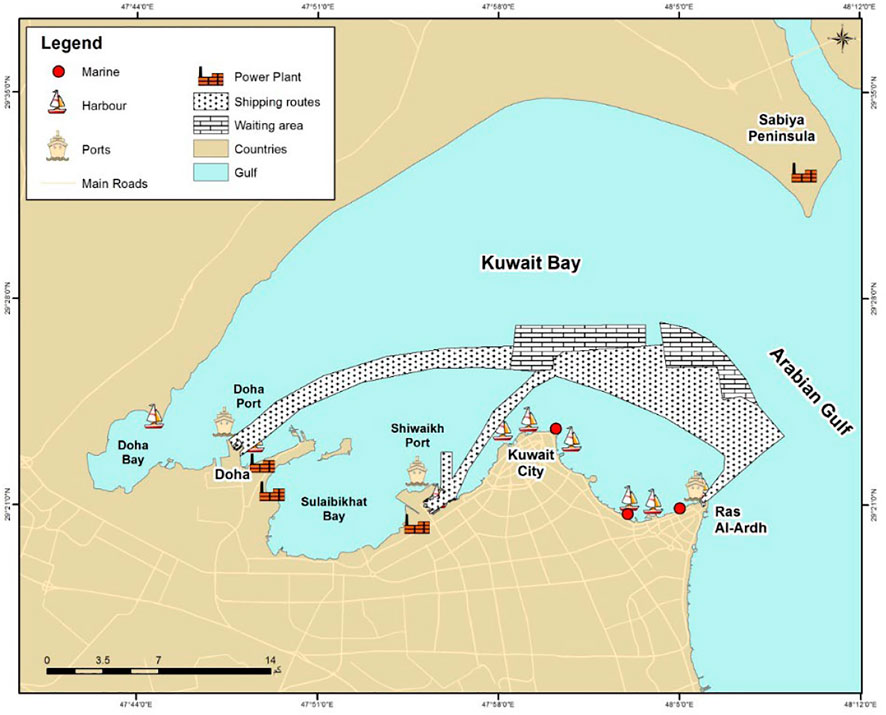
FIGURE 1. Kuwait bay.
Over the past few decades, the environmental status of Kuwait Bay has continued to decline due to the continued pumping of pollutants through coastal outfalls and the outlets of power and desalination plants. Figure 2 shows that 50 outfalls are spreading along the bay’s western and southern coasts. Although prohibited by the KEPA’s bylaws, many of these outfalls are still active (Kepa, 2014). This environmental deterioration is causing several environmental, biological, and health problems. Desalination plants release super saline warm water (brine), raising the salinity level to 4% (Al-Sarawi et al., 2015). The impact of brine discharge is apparent significantly near the shallow inner parts of the bay (Al-Sarawi et al., 2015). Through the outfalls, KEPA and the Ministry of Public Works data show that different pollutants are discharged to the bay, such as industrial, medical, and household wastes.

FIGURE 2. Coastal outfalls along the southern coast of Kuwait Bay.
The northern AG and KB are dominated by anticlockwise circulation patterns and have a low seawater exchange rate. As a result, sediments originating from the Shatt Al-Arab estuary are deposited inside the bay, forming the extensive north intertidal mudflats (Al-Yamani and Saburova, 2011) and causing the northern part of the bay to be considerably shallower and slow down the flushing characteristics than the other parts (Al-Ghadban et al., 2002). In 2010, Rakha and others Rakha et al. (2010) divided the bay into 1) east zone and 2) west zone. The east zone has a relatively high current with a velocity of >1 m/s at the center of the bay (Al-Ghadban and Salman, 1993). This zone is influenced by Shatt Al Arab and is characterized by lower temperatures and salinity. The west zone is shallower, with low tidal currents and higher salinity. In general, the current speed decreases toward the western portion of the bay (Pokavanich and Alosairi, 2014). Tides, winds, and density are the main factors affecting water circulation in the bay and the upper part of the Arabian Gulf (Al-Yamani et al., 2004; Pokavanich et al., 2013). Pokavanich and Alosairi (2014) reported that sluggish tidal currents were detected at high tide and low tide toward the western parts of the bay.
Previous studies agreed that KB is characterized by slow flushing time (Gopalakrishnan, 1989; Rakha et al., 2010; Pokavanich et al., 2013; Pokavanich and Alosairi, 2014). These studies showed that the flushing time of the bay could vary between two months to 2 years. However, Pokavanich and Alosairi (2014) results showed that taking the wind and density-driven current into consideration reduces the bay’s flushing time to 65 days. The flushing characteristics are crucial for estimating pollutants’ residence time within the bay and determining the most vulnerable environmental areas.
The western part of the bay is characterized by shallow water and low tidal currents, so it is anticipated that pollutants need a longer time to exit and disperse than other parts of the bay. Doha Bay (DB), also named Dawhat Kazima, or Jahra Bay, is a semi-enclosed embayment far west of Kuwait Bay (Figure 3) and is bordered by the southeast, highly dense polluted Sulaibikhat Bay (SB) as well as Doha Desalination Plant. There are two emergency outlets and five stormwater outfalls along the DB west and south coasts (Figure 3). DB receives large amounts of municipal waste from Kuwait City and various illegal industrial units (Baby, 2011). The field visits of this study revealed that the excess untreated water is discharged to DB through the two emergency outfalls, and hence the deterioration in the bay’s environmental status is due mainly to wastewater discharge from the outfalls. Lyons and others in 2015 Lyons et al. (2015) found highly polluted sediments in DB with high fecal sterol contamination, where levels of pollution indicate raw or partially treated sewage.
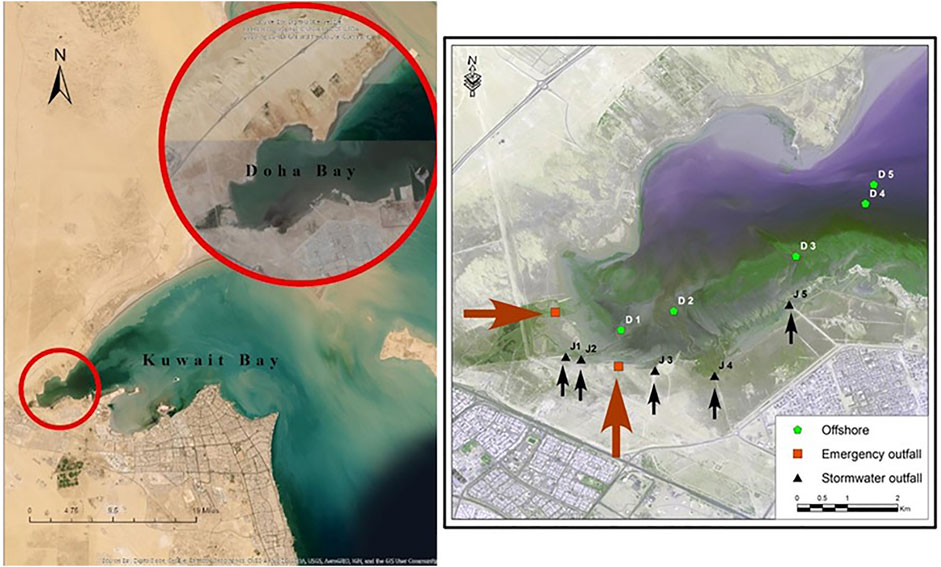
FIGURE 3. Doha Bay and stormwater and emergency outfalls and offshore sampling sites D1–5.
Furthermore, high concentrations of nutrients, trace metals, and other dissolved and particulate matter are evident in DB (Devlin et al., 2015). Several studies (Al-Muzaini et al., 1999; Al-Mutairi et al., 2014; Al-Mutairi et al., 2015) described DB as the most heavily affected area of KB by pollutants. However, to our knowledge, no previous studies are available that focus solely on DB and specify the type of the pollutants and their sources. The study fills this gap, investigates the fate of untreated wastewater from the treatment plants, and determines the distribution of pollution levels of different microbial indicators within the bay. To date, information on the potential impacts of the coastal outfalls on water quality in neighboring areas and offshore is insufficient and difficult to access. This study highlights the impact of environmental stressors on the health of such bays. Also, the study assesses the spreading of the pollutant relative to the location of the pollution source. The study focuses on examining microbiological pollution indicators (fecal coliform, E. coli, and fecal streptococci) and their distribution within DB and studying the distribution of microbiological indicators from the source (outfalls) to offshore.
Methodology
Field Measurements, Water Sampling, and Laboratory Analysis
The field campaign started in October 2018 and lasted until February 2019. The water temperature and salinity and some of the physical/chemical parameters of the water were measured in the field using the CASTAWAY-CTD and Professional Plus Multiparameter Water Quality Professional Plus. Also, water samples were collected from eight locations in DB at five offshore locations and three outfalls (Figure 3 and Table 1). Samples from outfalls were collected during the low tide to avoid mixing the outfall discharge and the ambient seawater. The samples were collected using sterile plastic bottles of 1 L, stored in an icebox to limit biological and chemical activity, transported to the laboratory, and kept at 20 C. Unfortunately, it was impossible to obtain samples from the outfalls J1 and J2 and the area between the outfalls and the offshore due to safety concerns; the area is muddy, has soft beds, and is very shallow even at high tide was hard to reach by boat. J3 serves Saad Al-Abdallah residential area and Al-Jahra industrial area, J4 serves Sulaibiya Wastewater Treatment and Amghara industrial area, and J5 serves Jaber Al-Ahmad residential area (Figure 4). Water samples analysis was carried out at the National Unit of Environmental Research and Services (NURES) Project no–SRUL01/13, NUERS, Faculty of Science, Kuwait University. The pH, BOD, TSS, TDS, TOC, COD, nitrites, nitrates, ammonia, and phosphate were determined using the standard US EPA test methods (Nelson, 2003). The details of these tests are available through the US EPA website (https://www.epa.gov). In addition, the analysis of microbiological content (fecal coliform, E. coli) was carried out at KEPA laboratories. The isolation and numeration of microbial quality parameters (fecal coliform and E. coli) were conducted at each site for seawater samples to estimate the level of sewage contamination. This was undertaken using the membrane filter technique following the methods recommended by the Regional Organization for the Protection of the Marine Environment (Moopam, 2010) and Section 9222 D of Standard Methods for the Examination of Water and Wastewater (American Public Health Association (Apha), 1992). Under the aseptic technique, volumes 0.1, 1, 3, and 10 ml and serial dilution (10−1, 10−3, and 10−5) using 0.1% peptone water for each seawater were filtered through sterile a 47-mm diameter, 0.45 μm pore size cellulose filter paper. Filter papers were then placed separately on m-FC media (EMD, Germany) with 10 ml 1% Rosolic acid in 0.2N NaOH, pH 7.4 plates. The plates were incubated at 44°C for 24 h. Counts were adjusted to the number of colonies per 100/ml of sample filtered (Lyons et al., 2015). The formula used to Counts the number of colonies per 100/ml of sample filtered is
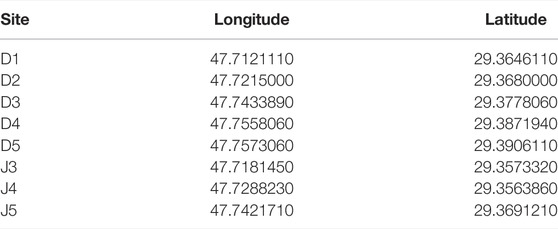
TABLE 1. Locations of the sampling sites.
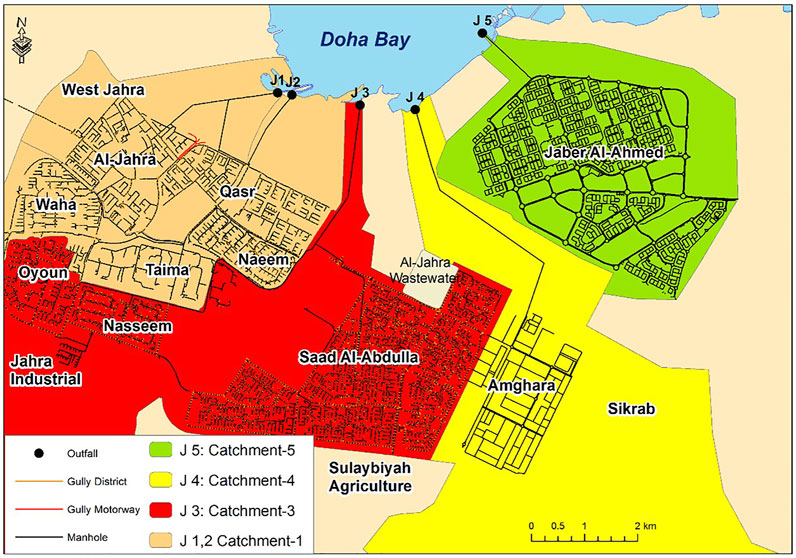
FIGURE 4. Sewage sources to the outfalls J3, J4, and J5.
Finally, fecal streptococci were analyzed at MPW–Sanitary Engineering Sector–laboratories. Details of the laboratory analysis can be found in (Al-Nasser, 2022).
Statistical Data Analysis and Mapping
The statistical analysis and pollutant concentration mapping were conducted using SPSS and ArcGIS software. The statistical analysis includes DB water’s physical, chemical, and biological characteristics. The data of temperature, Acidity (pH), salinity, Total Suspended Solids (TSS), Total Dissolved Solids (TDS), Total Organic Carbon (TOC), Biological Oxygen Demand (BOD), nitrate (
The concentration maps of E. coli, fecal coliform, and fecal Streptococci were done as follows:
1) The concentration map production was achieved using the Inverse Distance Weighted (IDW) interpolation method. The resulted map shows the concentration variation of the biological indicators spatially and temporally.
2) Scatter plots were created to monitor the variation of the biological indicators.
3) Charts to find the relationship between the pollutant levels and the distance from the pollution source were created.
Results and Discussion
The result presentation and discussion below are based on the guidelines for water quality discharged into Kuwait seawater, and the Guidelines for Seawater quality and bacterial indicators in recreational coastal water are presented in Tables 2, 3, respectively.
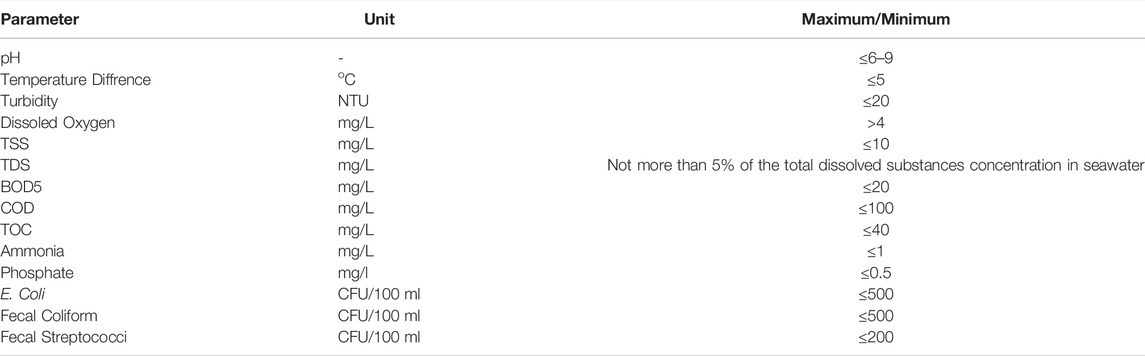
TABLE 2. Guidelines for water quality discharged into Kuwait seawater (Kepa, 2014).
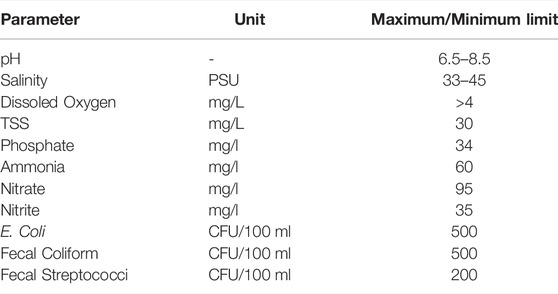
TABLE 3. Guidelines for Seawater quality and bacterial indicators in recreational coastal water (Kepa, 2014).
Physical and Chemical Water Quality Indicators
Table 4 summarizes the statistics of the water quality parameters from the J3, J4, and J5 outfalls, and Table 5 presents those of the offshore locations. The temperature differences between the three outfalls were negligible during the measurement times. However, the mean and maximum temperatures at the offshore locations (Table 5) were higher than those at the outfalls, while the minimum temperature was slightly lower. During all field campaigns, the temperature difference between the discharged water to the sea and the ambient seawater never exceeded 5°C, the maximum temperature difference allowed by KEPA (Table 2). The maximum temperature and salinity of 31.4°C and 43.9 PSU were recorded at D5 in September 2018. KEPA’s permanent stations near D5 show that the salinity and temperature vary between 41–44 PSU and 12–35.5°C over the year, respectively, and the peak values occurred in Septemper (Alkhalidi et al., 2021). It is necessary to mention that the higher salinity and temperature at D5 are due to its location offshore Doha power and Desalination plant, where numerous brine is discharged continuously (Nadi, 2015). Also, it is essential to mention that many fish kills incidents have occurred near this location over many years (Heil et al., 2001; Glibert et al., 2002; Islam and Tanaka, 2004; Piontkovski et al., 2012; Bacon et al., 2017; Alosairi and Alsulaiman, 2019; Alqattan and Gray, 2021). The fish kill incidents at high temperature and salinity locations confirm that high salinity and temperature are correlated with low Dissolved Oxygen (DO), as reported by Al-Yamani et al. (2004); Mann and Lazier (2013), and they directly affect marine fauna and flora and alter marine life.
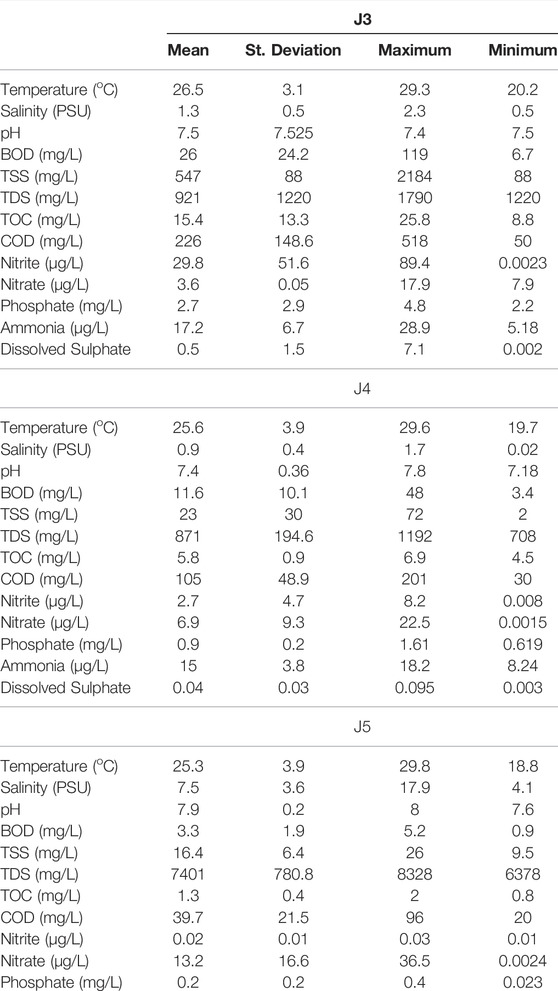
TABLE 4. Statistical summary of water quality from J3, J4, and J5 outfalls.
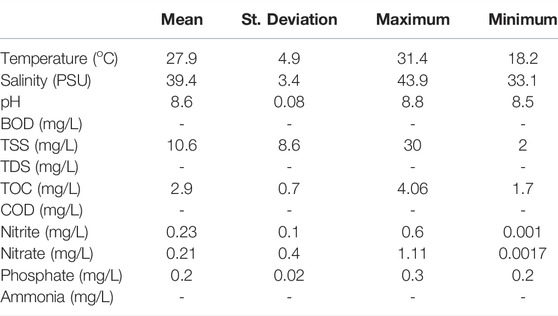
TABLE 5. Statistical summary of water quality of the offshore locations D1–D5.
The environment law of Kuwait requires that the pH level discharged to the sea must be between 6 and 9 (Kepa, 2014). The pH levels measured at the outfalls were within the allowable ranges of KEPA, with mean pH at outfalls J3, J4, and J5 being 7.5, 7.4, and 7.9, respectively. Inside DB, the maximum and mean pH values (Table 4) were slightly above the maximum seawater quality limit of KEPA (6.5 < pH < 8.5). The minimum and maximum pH values were recorded at D3 in December 2018. The mean pH values in DB are close to those reported by Al-Mutairi et al. (2014); Al-Sarawi et al. (2018). Al-Mutairi and others Al-Mutairi et al. (2014) relate the minimal variation in the pH levels to the high buffering capacity of KB.
The mean concentration of BOD at J3, J4, and J5 was 26, 11.6, and 3.3 mg/L, respectively. While the maximum recorded value of BOD was low at J5 (5.2 mg/L), it exceeds KEPA allowable limits (20 mg/L) six times at J3 (119 mg/L) and nearly two and half times at J4 (48 mg/L). Both maximum values at J3 and J5 were recorded in August 2018. Different studies (Al-Muzaini et al., 1991; Al Bakri and Kittaneh, 1998; El-Anbaawy et al., 2018) reported BOD levels in the range of 14–209 mg/L in SB (Figure 2), where many outfalls exist. The BOD and DO are inversely related, and hence in addition to the impact of high temperature, salinity, and evaporation rates, discharging pollutants with these high levels of BOD into DB and KB contribute significantly to the deterioration of the environmental status of the bay, the diversity of species, and the fish stock decline (Martina and Radjawane, 2019; Alqattan and Gray, 2021).
The mean TSS concentration at J3 was excessively high, with maximum, minimum, and mean values of 2184, 88, and 547 mg/L, respectively. The maximum concentration recorded was 2184 mg/L in October 2018. Knowing that the maximum concentration level allowed from KEPA to be discharged to the sea is 10 mg/L, the amount of TSS disposed to the sea from J3 is unacceptable and contributes to the bay’s environmental deterioration. The mean concentrations of TSS at J4 and J5 were 23 and 16.4 mg/L, respectively, while the maximum values were 72 and 26 mg/L. These levels are also above KEPA maximum limits but much lower than J3. Offshore the mean TSS concentration was 10.16 mg/L, with a maximum value of 30 mg/L at D1 recorded in September 2018 and a minimum value of 2 mg/L at D5 recorded in December 2018. KEPA’s maximum allowed value for TSS in the coastal water of Kuwait is 30 mg/L. In KB, the mean concentration of TSS is 14.1 mg/L, with a maximum of 29.1 mg/L (Al-Mutairi et al., 2014). Comparing the TSS values inside the bay with those outside the bay, the bay’s high TSS is due to sewage discharge and the shallowness of the western part of the bay (Devlin et al., 2015). Other factors of high TSS are the Shamal wind, rainstorms, and the bay’s slow flushing (Devlin et al., 2019). These factors also elevate the turbidity values in winter (Devlin et al., 2019). Since D5 is located at the DB entrance (the faster water flushing, larger tidal currents, and deeper water), TSS is significantly lower than the other offshore stations. KEPA’s stations Z02 recorded a mean and maximum concentration of TSS of 17.2 and 985 mg/L, respectively.
The maximum concentrations of TDS in Table 4 were all measured in August 2018. A maximum concentration of 8328 mg/L was measured at J5, and the minimum, 708 mg/L, was measured at J4 in December 2018. Dashti and Al-Haddad (2019), in April and May 2019, found higher TDS concentrations near the outfalls of SB. The range of TDS in their sampling campaign was between 31,747 mg/L and 44,270 mg/L. Al Bakri and Kittaneh (1998) classified DB as a slightly polluted embayment with TDS. High TDS concentrations are expected in such embayment due to natural and human stressors such as extreme climate and excessive waste discharge.
On the other hand, the TOC levels at the outfalls and offshore were lower than KEPA maximum limits. For example, KEPA requires that TOC concentration discharged to the sea not exceed 40 mg/L while the maximum concentration measured was 25.8 mg/L at J3 in December 2018. These measurements contradict many studies that reported high levels of TOC in KB in general. Al-Said and others Al-Said et al. (2018) conducted a two-year water sampling campaign to assess the TOC of Kuwait’s territorial coastal water from 2014 to 2016. Their findings showed that high TOC levels in Kuwait’s coastal water are the highest measured in any marine system. Also, they reported that these TOC levels are maximum in DB and decrease offshore and toward the open water. Two leading contributors increase the TOC levels in seawater. These contributors are the waste discharge and the high salinity due to the brine discharge, making the seawater denser. The discrepancy between the TOC of this study and (Al-Said et al., 2018) requires establishing a monitoring program for Doha Bay due to its environmental sensitivity and importance and because it is considered the most polluted area in Kuwaiti regional waters.
KEPA allows water to be discharged to the sea with a COD level of not more than 100 mg/L Kepa (2014). The data of this study show that the mean COD concentrations exiting J3 and J4 outfalls are 226 and 105 mg/L, respectively. The mean and maximum COD concentrations existing from J5 were 39.7 and 96, respectively, below the KEPA maximum limit, while the maximum COD level was measured at J3 at a value of 518 mg/L in August 2018. The second highest values were recorded at J4 with a maximum value of 201 mg/L in August 2018. Seater samples collected from SB by El-Anbaawy et al. (2018) show high levels of COD in the range of 94.3 and 120 mg/L. The high levels of COD deplete the oxygen demand in the seawater and hence directly affect the environment and marine life.
Nitrites (
Phosphate (
The mean concentration of ammonia (NH3) in J3 and J4 was 17.2 and 15 μg/L, respectively, and there was no NH3 measurement at J5. The maximum concentration of NH3 was 28.9 μg/L measured at J3 and was 18.2 μg/L at J4. These values exceeded KEPA’s maximum allowable NH3 to be discharged to the sea, 1 μg/L.
Microbiological Indicators: Fecal Coliform, Escherichia coli, and Fecal Streptococci
Microbiological pollution near coastal areas is hazardous to beach users because feces may contain pathogenic microorganisms that can be ingested and bring intestinal problems (Lee et al., 2002; Lee, 2006). Studies and Epidemiological surveys revealed a positive correlation between fecal pollution in coastal areas and swimming diseases (Wade et al., 2003). KEPA seawater quality guidelines of bacterial indicators in water discharge through coastal outfalls are 500 CFU/100 ml for fecal coliform bacteria, 500 CFU/100 ml for Escherichia coli, and 200 CFU/100 ml for fecal streptococci bacteria. During the field campaign of this study, samples and measurements were taken from the three outfalls (J3, J4, and J5) and offshore locations (D1—D5). It was noticed that the sewage discharge from J5 was minimal compared to J3 and J4, and there was no continuous raw sewage discharge to the sea from J5. Table 6 summarizes the microbial water quality indicators at the outfalls. Figure 5 presents the spatial and temporal variations of the microbiological water quality indicators. Table 6 and Figure 5 show extremely high fecal coliform and E. coli at all outfalls and offshore locations, specifically during January and February 2019 (Figures 6, 7). The minimum E. coli concentration was 5 × 10² CFU/100ml, the maximum limit concentration allowed by KEPA (discharged from J5 in December 2018). The mean concentration of E. coli from J3 is nearly 18 and 86 times that from J4 and J5, respectively. fecal Streptococci concentration levels discharged from the J5 outfall were consistently below the KEPA maximum allowed limit, but at J3 and J4, the mean levels exceeded KEPA maximum limits by 3.65 and 2.2 times, respectively. The maximum level of fecal coliform varies between 1 × 10⁴ and 3.5 × 10⁵ CFU/100 ml at J5 and J3, respectively. These levels are exceeding the KEPA maximum limits significantly. The minimum levels of fecal coliform were between 2.5 × 10³ and 3 × 10⁵ CFU/100 ml at J4 and J3, respectively. These levels are also high, exceeding KEPA limits, and indicating the beaches of DB can be considered a health hazard location for swimmers and the health of the bay’s fish consumers.
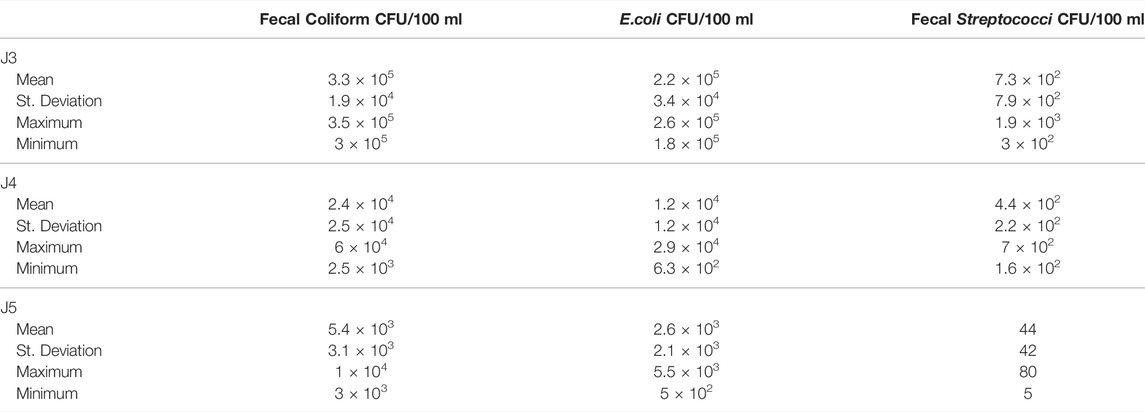
TABLE 6. Statistical summary of microbial water quality indicators at outfalls J3, J4, and J5.
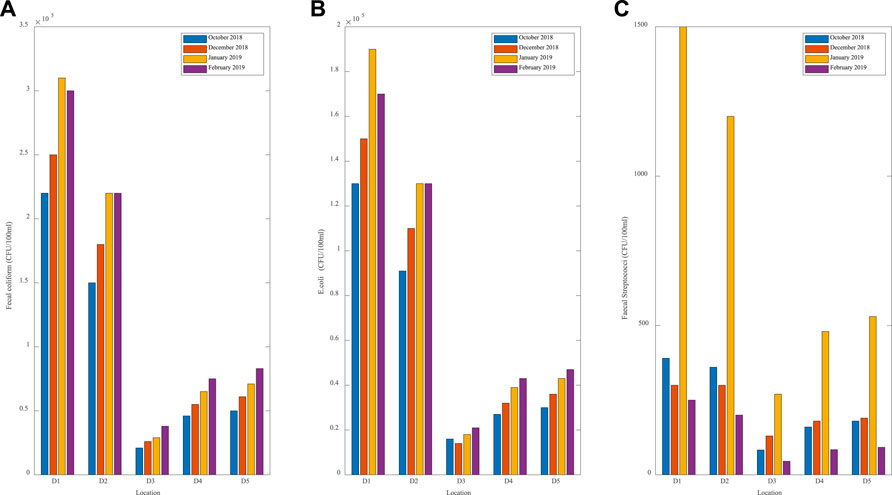
FIGURE 5. Fecal coliform (A), E. coli (B), and fecal Streptococci (C) concentrations at the offshore locations.
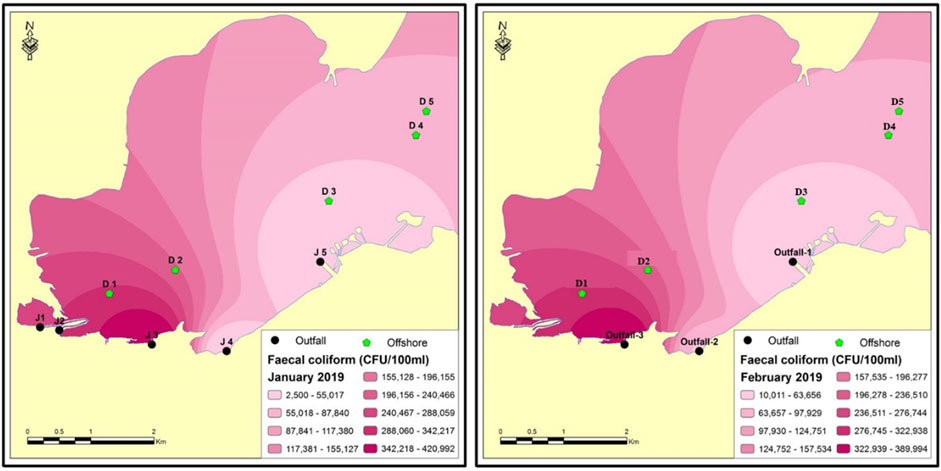
FIGURE 6. Distribution of fecal coliform in Doha Bay using ArcGis.
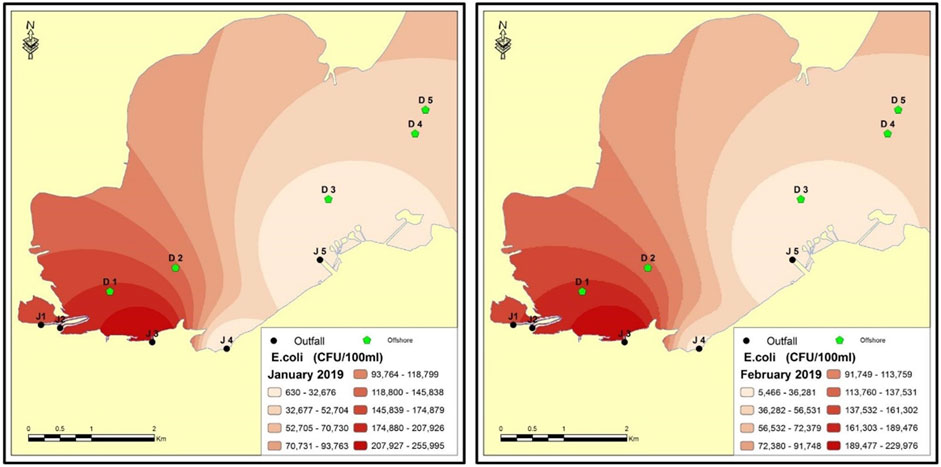
FIGURE 7. Distribution of E. coli in Doha Bay using ArcGis.
Figures 6–8 show the maximum concentration of the microbiological indicators in DB using ArcGIS. The figures show the highest concentration was in the west area of DB, around D1 and D2, and the lowest concentration was around J5 and D3. The concentration around D4 and D5 was higher than around D3 due to the waste discharge from SB (north-south of D4 and D5). The concentration of the extreme values near D1 and D2 because they are very close to the outfall J3, which discharges more pollutants to the bay than the other outfalls (Figures 6–8).
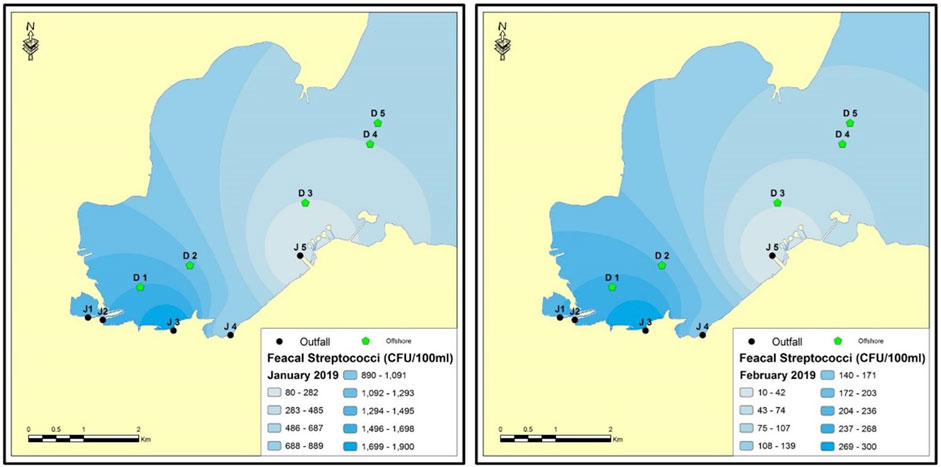
FIGURE 8. Distribution of fecal Streptococci in Doha Bay using ArcGis.
The results in Table 6 confirm the claim of Aleisa and Al-Shayji (2019) that 88.89 million m3/year of wastewater remains untreated and discharged to the sea. In addition, Lyons et al. (2015) indicated that illegal connections to the storm drains are responsible for the sewage pollution in DB.
Figure 5 shows that DB is highly polluted with microbiological indicators, and this pollution is mainly due to the continuous sewage discharge from the three outfalls, specifically from J3. Locations D1 and D2 are significantly more polluted than D3, D4, and D5. This significant more pollution at D1 and D2 is because these two locations are closer to outfalls J3 and J4 and are in shallower water depths than the other locations. Saeed and others Saeed et al. (2015) reported that most of the southern part of KB is highly polluted with fecal.
Conclusion
The water quality parameters and the microbiological indicators measured in this study show that DB is heavily polluted, especially in the southwest. In addition to the natural impactors such as temperature and salinity, sewage discharge to sensitive coastal areas similar to DB increases the environmental impact as such areas are shallow and feature slow flushing characteristics. The high concentrations of discharged BOD, TSS, TDS, COD, Nitrites (
Outfall J3 poses a more significant environmental hazard to people’s health and marine life among the three outfalls. It serves heavily populated residential and industrial areas (Figure 4), and it discharges intensive raw sewage to the sea. The minimum and maximum fecal coliform at J3 were 600 and 700 times the maximum KEPA limit. The microbiological waste discharge from the other two outfalls is still higher than the maximum KEPA limits; at J5, the location of minimum waste discharge, the fecal coliform was six times higher than the maximum KEPA limit. The results in Table 6 confirm the claim of Aleisa and Al-Shayji (2019) that a large amount of wastewater remains untreated and discharged to the sea. In addition, the results enhance the claim of Lyons et al. (2015) that illegal connections to the storm drains are contributing to the pollution in DB.
The concentration distribution of fecal coliform and E. coli in DB is disastrous, with levels that exceed all standards and limits. This distribution contributes to the decline in fish stock and the health of marine life. Also, for beach users, these levels of concentrations are hazardous and could be a source of different diseases.
Therefore, we conclude that the DB is under massive environmental stress due to the discharge from the outfalls. The biological importance of the bay necessitates developing a comprehensive monitoring program to measure the environmental indicators continuously. Also, it is essential to control the sewage discharge from the outfalls within DB and SB, especially the illegal discharges, to reduce future environmental consequences. In addition, numerical hydrodynamic and environmental studies are recommended to track the pollutant movement and distribution and test offshore outfalls’ effect on reducing marine pollution. Offshore and deepwater outfalls were used and were environmentally effective in Italy, Brazil, Salvador, and Australia (Philip and Pritchard, 1996; Bocci et al., 2006; Roth et al., 2016; Feitosa, 2017; Besley and Birch, 2019b,c,a; Manning et al., 2019).
Data Availability Statement
The raw data supporting the conclusion of this article will be made available by the authors, without undue reservation.
Author Contributions
MA and HA-S conceived the presented idea and the methodology. ZA-N did the field investigations and the laboratory analysis. All authors conducted the result analysis and findings, and the conclusion was established by MA. MA wrote most of the manuscript, and ZA-N and HA-S reviewed and edited the manuscript.
Conflict of Interest
The authors declare that the research was conducted in the absence of any commercial or financial relationships that could be construed as a potential conflict of interest.
Publisher’s Note
All claims expressed in this article are solely those of the authors and do not necessarily represent those of their affiliated organizations, or those of the publisher, the editors and the reviewers. Any product that may be evaluated in this article, or claim that may be made by its manufacturer, is not guaranteed or endorsed by the publisher.
References
Al-Ghadban, A., Al-Majed, N., and Al-Muzaini, S. (2002). The State of Marine Pollution in Kuwait: Northern Arabian Gulf. Technology 8 (1-2), 7–26.
Al-Ghadban, A. N., and Salman, A. S. (1993). Preliminary Assessment of the Suspended Sediment and its Associated Pollutants in Kuwait Bay. Kuwait: Kuwait Institute for Scientific Research.
Al-Mutairi, N., Abahussain, A., Abahussain, A., and Al-Battay, A. (2014). Environmental Assessment of Water Quality in Kuwait Bay. Ijesd 5 (6), 527–532. doi:10.7763/ijesd.2014.v5.539
Al-Mutairi, N., Abahussain, A., and El-Battay, A. (2015). Spatial Assessment of Monitoring Network in Coastal Waters: a Case Study of Kuwait Bay. Environ. Monit. Assess. 187 (10), 621. doi:10.1007/s10661-015-4841-7
Al-Muzaini, S., Samhan, O., and Hamoda, M. F. (1991). Sewage-Related Impact on Kuwait's Marine Environment – A Case Study. Water Sci. Technol. 23 (1-3), 181–189. doi:10.2166/wst.1991.0414
Al-Muzaini, S., Beg, M., Muslamani, K., and Al-Mutairi, M. (1999). The Quality of Marine Water Around a Sewage Outfall. Water Sci. Technol. 40 (7), 11–15. doi:10.2166/wst.1999.0316
Al-Nasser, Z. (2022). Monitoring Sea Water Quality Using Multiple Microbiological Indicators, Doha Bay, Kuwait. Kuwait: Kuwait University.
Al-Said, T., Naqvi, S. W. A., Al-Yamani, F., Goncharov, A., and Fernandes, L. (2018). High Total Organic Carbon in Surface Waters of the Northern Arabian Gulf: Implications for the Oxygen Minimum Zone of the Arabian Sea. Mar. Pollut. Bull. 129 (1), 35–42. doi:10.1016/j.marpolbul.2018.02.013
Al-Sarawi, H. A., Jha, A. N., Al-Sarawi, M. A., and Lyons, B. P. (2015). Historic and Contemporary Contamination in the Marine Environment of Kuwait: an Overview. Mar. Pollut. Bull. 100 (2), 621–628. doi:10.1016/j.marpolbul.2015.07.052
Al-Sarawi, H. A., Jha, A. N., Baker-Austin, C., Al-Sarawi, M. A., and Lyons, B. P. (2018). Baseline Screening for the Presence of Antimicrobial Resistance in E. coli Isolated from Kuwait's Marine Environment. Mar. Pollut. Bull. 129 (2), 893–898. doi:10.1016/j.marpolbul.2017.10.044
Al-Yamani, F., Bishop, J., Ramadhan, E., Al-Husaini, M., and Al-Ghadban, A. (2004). Oceanographic Atlas of Kuwait's Waters. Kuwait: Kuwait Institute for Scientific Research.
Al-Yamani, F. Y., and Saburova, M. A. (2011). Illustrated Guide on the Benthic Diatoms of Kuwait's Marine Environment. Kuwait: Kuwait Institute for Scientific Research.
Aleisa, E., and Al-Shayji, K. (2019). Analysis on Reclamation and Reuse of Wastewater in Kuwait. J. Eng. Res. 7 (1), 13.
Alkhalidi, M., Alsulaili, A., Almarshed, B., Bouresly, M., and Alshawish, S. (2021). Assessment of Seasonal and Spatial Variations of Coastal Water Quality Using Multivariate Statistical Techniques. Jmse 9 (11), 1292. doi:10.3390/jmse9111292
Alosairi, Y., and Alsulaiman, N. (2019). Hydro-environmental Processes Governing the Formation of Hypoxic Parcels in an Inverse Estuarine Water Body: Assessment of Physical Controls. Mar. Pollut. Bull. 157, 111311. doi:10.1016/j.marpolbul.2020.111311
Alqattan, M. E. A., and Gray, T. S. (2021). Marine Pollution in Kuwait and its Impacts on Fish-Stock Decline in Kuwaiti Waters: Reviewing the Kuwaiti Government's Policies and Practices. Front. Sustain. 2, 667822. doi:10.3389/frsus.2021.667822
American Public Health Association (Apha) (1992). Standard Methods for the Examination of the Water and Wastewater, Method D 9222. Washington, DC: Water Environment Federation.
Baby, S. (2011). Information Research on Coastal Morphological Environment of kuwait, Organizations, Role and Coastal Legislations. Emir. J. Eng. Res. 16 (2), 7–24.
Bacon, J., Haverson, D., Devlin, M., and Phillips, R. (2017). Modelling Potential Drivers of Fish Kill Events in Sulaibikhat Bay, Kuwait. Graz: HENRY.
Bakri, D. A., and Kittaneh, W. (1998). RESEARCH: Physicochemical Characteristics and Pollution Indicators in the Intertidal Zone of Kuwait: Implications for Benthic Ecology. Environ. Manag. 22 (3), 415–424. doi:10.1007/s002679900116
Besley, C. H., and Birch, G. F. (2019a). Deepwater Ocean Outfalls: A Sustainable Solution for Sewage Discharge for Mega-Coastal Cities (Sydney, Australia): A Synthesis. Mar. Pollut. Bull. 145, 675–677. doi:10.1016/j.marpolbul.2019.06.010
Besley, C. H., and Birch, G. F. (2019b). Deepwater Ocean Outfalls: A Sustainable Solution for Sewage Discharge for Mega-Coastal Cities (Sydney, Australia): Influence of Deepwater Ocean Outfalls on Shelf Benthic Infauna. Mar. Pollut. Bull. 145, 724–738. doi:10.1016/j.marpolbul.2019.06.016
Besley, C. H., and Birch, G. F. (2019c). Deepwater Ocean Outfalls: A Sustainable Solution for Sewage Discharge for Mega-Coastal Cities (Sydney, Australia): Influence of Deepwater Ocean Outfalls on Shelf Sediment Chemistry. Mar. Pollut. Bull. 145, 707–723. doi:10.1016/j.marpolbul.2019.06.009
Bocci, M., Chiarlo, R., De Nat, L., Fanelli, A., Petersen, O., Sorensen, J. T., et al. (2006). Modelling of Impacts From a Long Sea Outfall Outside of the Venice Lagoon (Italy). Antalya: MWWD, 14.
Dashti, F., and Al-Haddad, A. (2019). Investigations of the Physical, Chemical and Microbial Parameters of Coastal Seawater Near Sewage Outlets, Kuwait. Ismailia: IWTC, 515–524.
Devlin, M. J., Breckels, M., Graves, C. A., Barry, J., Capuzzo, E., Huerta, F. P., et al. (2019). Seasonal and Temporal Drivers Influencing Phytoplankton Community in Kuwait Marine Waters: Documenting a Changing Landscape in the Gulf. Front. Mar. Sci. 6, 141. doi:10.3389/fmars.2019.00141
Devlin, M. J., Massoud, M. S., Hamid, S. A., Al-Zaidan, A., Al-Sarawi, H., Al-Enezi, M., et al. (2015). Changes in the Water Quality Conditions of Kuwait's Marine Waters: Long Term Impacts of Nutrient Enrichment. Mar. Pollut. Bull. 100, 607–620. doi:10.1016/j.marpolbul.2015.10.022
El-Anbaawy, M., Abdelhalim, A., Al Ajmi, D., and Al Sarawi, M. (2018). Environmental Assessment and Evaluation of Anthropogenic Impacts on Sulaibikhat Bay Tidal Flat Area, Kuwait. Jher 4 (1), 21–34. doi:10.11648/j.jher.20180401.14
Feitosa, R. C. (2017). Emissários submarinos de esgotos como alternativa à minimização de riscos à saúde humana e ambiental. Ciênc. saúde coletiva 22, 2037–2048. doi:10.1590/1413-81232017226.15522016
Glibert, P. M., Landsberg, J. H., Evans, J. J., Al-Sarawi, M. A., Faraj, M., Al-Jarallah, M. A., et al. (2002). A Fish Kill of Massive Proportion in Kuwait Bay, Arabian Gulf, 2001: the Roles of Bacterial Disease, Harmful Algae, and Eutrophication. Harmful Algae 1 (2), 215–231. doi:10.1016/s1568-9883(02)00013-6
Gopalakrishnan, T. C. (1989). A Moving Boundary Circulation Model for Regions with Large Tidal Flats. Int. J. Numer. Meth. Engng. 28 (2), 245–260. doi:10.1002/nme.1620280202
Heil, C., Glibert, P., Al-Sarawi, M., Faraj, M., Behbehani, M., and Husain, M. (2001). First Record of a Fish-Killing Gymnodinium Sp. Bloom in Kuwait Bay, Arabian Sea: Chronology and Potential Causes. Mar. Ecol. Prog. Ser. 214, 15–23. doi:10.3354/meps214015
Kepa, A. (2014). Environmental Protection Law. Authority, K.E.P. (ed). Kuwait: Kuwait Environment Public Authority, 164.
Lee, S. H., Levy, D. A., Craun, G. F., Beach, M. J., and Calderon, R. L. (2002). Surveillance for Waterborne-Disease outbreaks--United States, 1999-2000. MMWR Surveill. Summ. 51 (8), 1–47.
Lee, Y. S. (2006). Factors Affecting Outbreaks of High-Density Cochlodinium Polykrikoides Red Tides in the Coastal Seawaters Around Yeosu and Tongyeong, Korea. Mar. Pollut. Bull. 52 (10), 1249–1259. doi:10.1016/j.marpolbul.2006.02.024
Lyons, B. P., Devlin, M. J., Abdul Hamid, S. A., Al-Otiabi, A. F., Al-Enezi, M., Massoud, M. S., et al. (2015). Microbial Water Quality and Sedimentary Faecal Sterols as Markers of Sewage Contamination in Kuwait. Mar. Pollut. Bull. 100 (2), 689–698. doi:10.1016/j.marpolbul.2015.07.043
Mann, K. H., and Lazier, J. R. (2013). Dynamics of Marine Ecosystems: Biological-Physical Interactions in the Oceans. New york: John Wiley & Sons.
Manning, S. S., Dixon, J. P., Birch, G. F., and Besley, C. H. (2019). Deepwater Ocean Outfalls: A Sustainable Solution for Sewage Discharge for Mega-Coastal Cities (Sydney, Australia): Influences on Beach Water Quality. Mar. Pollut. Bull. 145, 691–706. doi:10.1016/j.marpolbul.2019.05.010
Martina, A., and Radjawane, I. M. (2019). Data Analysis on Sea Water Quality Data in Jakarta Bay Using Principal Components Analysis (PCA) Method during Transitional Monsoon 2012. IOP Conf. Ser. Earth Environ. Sci. 339 (1), 012023. doi:10.1088/1755-1315/339/1/012023
Moopam, R. (2010). Manual of Oceanographic Observations and Pollutant Analysis Methods. Kuwait: Regional Organization for the Protection of the Marine Environment (ROPME).
Philip, N. A., and Pritchard, T. R. (1996). Australia's First Deepwater Sewage Outfalls: Design Considerations and Environmental Performance Monitoring. Mar. Pollut. Bull. 33 (7), 140–146. doi:10.1016/s0025-326x(96)00165-8
Piontkovski, S. A., Al-Gheilani, H. M. H., Jupp, B., Sarma, V. Y., and Al-Azri, A. R. (2012). The Relationship between Algal Blooms, Fish Kill Incidents, and Oxygen Depletions along the Omani Coast. Int. J. Oceans Oceanogr. 6 (2), 145–177.
Pokavanich, T., Polikarpov, I., Lennox, A., Al-Hulail, F., Al-Said, T., Al-Enezi, E., et al. (2013). Comprehensive Investigation of Summer Hydrodynamic and Water Quality Characteristics of Desertic Shallow Water Body: Kuwait Bay. France: Arcachon, 1253–1264.
Pokavanich, T., and Alosairi, Y. (2014). Summer Flushing Characteristics of Kuwait Bay. J. Coast. Res. 297 (5), 1066–1073. doi:10.2112/jcoastres-d-13-00188.1
Polikarpov, I., Al-Yamani, F., and Saburova, M. (2009). Space-time Variability of Phytoplankton Structure and Diversity in the North-Western Part of the Arabian Gulf (Kuwait's Waters). BIORISK-Biodiversity Ecosyst. Risk Assess. (3), 83–96. doi:10.3897/biorisk.3.8
Rakha, K. A., Al-Banaa, K., and Al-Hulail, F. (2010). Flushing Characteristics of Kuwait Bay. Kuwait J. Sci. Eng. 37 (1A), 16.
Roth, F., Lessa, G. C., Wild, C., Kikuchi, R. K., and Naumann, M. S. (2016). Impacts of a High-Discharge Submarine Sewage Outfall on Water Quality in the Coastal Zone of Salvador (Bahia, Brazil). Mar. Pollut. Bull. 106 (1), 43–48. doi:10.1016/j.marpolbul.2016.03.048
Saeed, T., Al-Shimmari, F., Al-Mutairi, A., and Abdullah, H. (2015). Spatial Assessment of the Sewage Contamination of Kuwait's Marine Areas. Mar. Pollut. Bull. 94 (1), 307–317. doi:10.1016/j.marpolbul.2015.01.030
Shahidul Islam, M., and Tanaka, M. (2004). Impacts of Pollution on Coastal and Marine Ecosystems Including Coastal and Marine Fisheries and Approach for Management: a Review and Synthesis. Mar. Pollut. Bull. 48 (7-8), 624–649. doi:10.1016/j.marpolbul.2003.12.004
United Nations (2019). World Population Prospects 2019. New York, NY: United Nations: Department of Economic and Social Affairs Population Division.
Keywords: Doha Bay, marine pollution, water quality, pollutant distribution, fecal pollution
Citation: Alkhalidi MA, Al-Nasser ZH and Al-Sarawi HA (2022) Environmental Impact of Sewage Discharge on Shallow Embayment and Mapping of Microbial Indicators. Front. Environ. Sci. 10:914011. doi: 10.3389/fenvs.2022.914011
Received: 13 April 2022; Accepted: 09 June 2022;
Published: 28 June 2022.
Edited by:
Ahmed El Nemr, National Institute of Oceanography and Fisheries (NIOF), EgyptReviewed by:
Anton Purnama, Sultan Qaboos University, OmanFleurdeliz Maglangit, University of the Philippines Cebu College, Philippines
Pooja Sharma, National University of Singapore, Singapore
Copyright © 2022 Alkhalidi, Al-Nasser and Al-Sarawi. This is an open-access article distributed under the terms of the Creative Commons Attribution License (CC BY). The use, distribution or reproduction in other forums is permitted, provided the original author(s) and the copyright owner(s) are credited and that the original publication in this journal is cited, in accordance with accepted academic practice. No use, distribution or reproduction is permitted which does not comply with these terms.
*Correspondence: Mohamad A. Alkhalidi, bW9oYW1hZC5hbGtoYWxkaUBrdS5lZHUua3c=