 Abdullah Bin Omar
 Shuai Huang2*
 Haris Khurram
 Muhammad Fareed
- 1Department of Business Administration, National College of Business Administration & Economics (NCBA&E), Lahore, Pakistan
- 2Department of Real Estate Studies, Konkuk University, Seoul, South Korea
- 3Department of Management Information Systems, College of Business Administration, Prince Sattam Bin Abdulaziz University, Al-Kharj, Saudi Arabia
- 4National University of Computer and Emerging Sciences, Chiniot, Pakistan
- 5School of Business Management, Universiti Utara Malaysia, Sintok, Malaysia
Stock market forecasting is considered the most challenging problem to solve for analysts. In the past 2 years, Covid-19 has severely affected stock markets globally, which, in turn, created a great problem for investors. The prime objective of this study is to use a machine learning model to effectively forecast stock index prices in three time frames: the whole period, the pre-Covid-19 period, and the Covid-19 period. The model accuracy testing results of mean absolute error, root mean square error, mean absolute percentage error, and r2 suggest that the proposed machine learning models autoregressive deep neural network (AR-DNN(1, 3, 10)), autoregressive deep neural network (AR-DNN(3, 3, 10)), and autoregressive random forest (AR-RF(1)) are the best forecasting models for stock index price forecasting for the whole period, for the pre-Covid-19 period, and during the Covid-19 period, respectively, under high stock price fluctuations compared to traditional time-series forecasting models such as autoregressive moving average models. In particular, AR-DNN(1, 3, 10) is suggested when the number of observations is large, whereas AR-RF(1) is suggested for a series with a low number of observations. Our study has a practical implication as they can be used by investors and policy makers in their investment decisions and in formulating financial decisions and policies, respectively.
Introduction
In the past two decades, stock market prediction has gained adequate attention from researchers in the field of time-series forecasting (Jackson et al., 2021), and, as result, this area spawned a number of studies. As stock market prices exhibit random walk (Fama, 1995), it is considered the most challenging task to predict the magnitude and directional changes of stock prices as it has always been a knotty problem (Meher et al., 2021). Therefore, investors always demand accurate stock market forecasting as correct prediction about share prices ultimately facilitates them to make an informed decision in their future investment plans.
Literature in empirical finance has produced a plethora of studies proposing different ways to forecast the stock market. The most widely used statistical method is autoregressive integrated moving average (ARIMA), deployed by several studies to predict stock price trends. Challa et al. (2020), for example, used the ARIMA model to predict the variation in returns of S&P BSE IT and S&P BSE Sensex indices of the Bombay Stock Exchange and found that the ARIMA model has an ability to predict long- or medium-term horizons by using historical observations. In a similar manner, stock prices of the Nigerian stock exchange and New York stock exchange were predicted by Ariyo et al. (2014) using the ARIMA model, and they concluded that the ARIMA model has a vigorous predictability for short-term forecasting. Likewise, Banerjee (2014) and Devi et al. (2013) used the ARIMA model in their studies and proposed it as a better model for stock market prediction. Later on, with the development of the machine learning field, several studies suggests that hybrid machine learning models can be a promising alternative to the traditional linear methods (Zhang, 2003), and as result, the scientific community started to develop different intelligent and more advanced machine learning models for stock market prediction to get better-forecasted results such as support vector machine (SVM), genetic algorithm, and neural networks (NNs). Shen et al. (2012), for example, used SVM to forecast NASDAQ, S&P500, and DJIA daily stock price series, and their results suggest high accuracy from SVM than from other traditional benchmarks. Likewise, Sable et al., 2017 and Naik et al. (2012) used the genetic algorithm to detect the increasing or decreasing trend in stock value in the upcoming period. In a similar manner, by using the historical share price data of Tehran Stock Exchange, Mahdi Pakdaman et al., 2010 predicted the stock market value by using two kinds of NNs and found that results of NNs are promising for predicting stock value changes.
With the growing number of studies on stock market forecasting, it has been now proven in the literature that no single model or method is appropriate to use in all types of situations (Chatfield, 1988; Zhang, 2003); rather, its more appropriate to combine different individual models for better results (Uri, 1977; Jenkins, 1982), as hybridizing different models mitigates forecasting error rate (Granger, 1989; Krogh and Vedelsby, 1995; Sunday Adebayo et al., 2022). Plenty of studies, for example, used ARIMA hybrid models to forecast the stock market. Babu and Reddy (2014), for example, developed ARIMA-generalized autoregressive conditional heteroscedastic and concluded that their proposed model outperforms other traditional models. Kumar and Thenmozhi (2012) and Musa and Joshua (2020) both proposed a combined model to forecast stock market index return, i.e., ARIMA-ANN. Former findings revealed that the hybrid ARIMA-ANN forecasting model is outperformer to linear ARIMA and nonlinear backpropagation NN, while later results declared the superiority of the proposed forecasting model over single ARIMA and ANN models. An attempt to predict the share prices of pharmaceutical firms was carried out by Meher et al. (2021) in which each pharmaceutical firm has considered to frame the ARIMA model. Another improved hybrid model, DWT-ARIMA-GSXGB, was proposed by Wang and Guo (2020), and its results were compared with those of GSXGB, ARIMA, DWT-ARI-MA-XGBoost, and XGBoost. Findings showed that it has the lowest error rate with good prediction ability.
In a similar manner, various hybrid machine learning models were developed by different studies to check their efficiency in predicting stock market movement. For example, the performance of different machine learning models, consisting of the linear model, ANN, random forests (RFs), and SVM, was tested by Ayala et al. (2021). Their results exhibit that the linear model and ANN were the best performers. By using 715 novel input features, a deep learning stock price prediction system was developed by Song et al. (2019) with the use of only technical analysis methods. Their findings confirmed the higher cumulative and stable returns. In a similar manner, to improve the prediction accuracy of the stock, Sohangir et al. (2018) tested the power of different NN models such as doc2vec, convolutional NN (CNN), and long short-term memory (LSTM) and found CNN as the best model to predict the StockTwist dataset. Combining the features of SVR and the ensemble adaptive neuro-fuzzy inference system, Zhang et al. (2021) proposed a two-stage machine learning model. Their empirical findings showed that the proposed model has strong potential to predict performance as compared to two-stage models such as SVR-Linear, SVR–ANN, SVR–SVR, and single-stage models. Likewise, the efficiency of LSTM networks and gated recurrent unit (GRU) was tested by Site et al. (2019) using stock close values of Google and Amazon, and LSTM was found to be more useful than GRU. In a nutshell, synthesis of the relevant literature reveals the absence of consensus of researchers on an appropriate forecasting model for stock prices, which is the substantial gap in literature. Hence, the authors are motivated to fill in this gap.
Meanwhile, the Covid-19 outbreak has taken the world to an unprecedented position where economic and financial resources have been drying up. Today, the world is shocked by this epidemic, and its outbreak has caused substantial losses to several economies and an enormous impact on the stock market (Ahmad et al., 2021; Ghosh and Datta Chaudhuri, 2021). It has abruptly wreaked havoc on the domestic and international business activities, which ultimately led the nations toward strict lockdown, suspension of flight operations, and seal of cross-border trade, and ultimately, all these have brought increased uncertainty and volatility in stock markets around the globe. Therefore, this area has been a hot topic since the start of Covid-19, and several studies have analyzed the effect of the epidemic on the global economy (see, e.g., Ashraf, 2020; Zhang et al., 2020; Engelhardt et al., 2021; Harjoto et al., 2021; Liu et al., 2021; Mazur et al., 2021). The stock price trends and behavior of stock indices have been changed in the Covid-19 era as compared to those in the pre-Covid-19 period, and they are getting more unpredictable months after months. As the uncertainties in businesses are growing day by day, the investment decision under these extreme dicey conditions becomes very hard for investors to make and opens the avenue for further research. All these pandemic situations have become a source of motivation for us to undertake this study.
This study aims to forecast the Karachi Stock Exchange (KSE)-100 index data of the Pakistan Stock Exchange (PSX) by using daily closing price series. The primary objective of the study is to investigate the best model with minimum error rate and predicting power with high accuracy to forecast stock prices. We present statistical and hybrid machine learning models to get the benefit of the superior power of linear and nonlinear modeling. The purposes of the study are twofold. First, we check whether stock price trends can be forecasted to some extent of accuracy before and during the Covid-19 period. Second, we examine the performance of these hybrid machine learning models for stock market index prediction. We do hope that the finding of this study will provide useful insights to investors seeking to maximize returns during the Covid-19 global crisis as well as fill the gap in the current vein of literature as stock market forecasting during the Covid-19 pandemic is still under-researched. This study also contributes to the body of existing scientific literature by providing the best forecasting model to forecast stock prices for developing and emerging economies like Pakistan.
Materials and Methods
Autoregressive Integrated Moving Average Model
In 1970, George Box and Gwilym Jenkins introduced a methodology to analyze the probabilistic, or stochastic, properties of time-series data under the philosophy “let the data speak themselves,” which is later popularly known as Box–Jenkins (BJ) methodology based on autoregressive (AR) and moving average (MA) models (Box and Jenkins, 1970).
AR(p) models corroborate that the output variable depends on its p-lagged series in linear form. In contrast, an MA(q) model is simply a sequential pattern of the error term in such a way that the output variable linearly depends on q-lagged series of disturbance terms. It may be possible that the output variable is linearly explained by combinedly both AR(p) and MA(q) models, which ultimately leads toward ARMA(p, q), where p denotes the R terms and q denotes the MA terms. Some series follow the AR(p) process, while some follows the MA(q) process, so the benefit of this method is that it explicitly identifies what process is followed by a certain time series. For a time-series
which can also be written as
where c is the intercept of the model and
Although the ARIMA model was the most widely used method in economic forecasting studies, for any time-series data, there is the problem of how to identify whether data are following purely the AR, MA, ARMA, or ARIMA process with appropriate values of p, d, and q. To solve this puzzle, BJ methodology comes in and provides three iterative forecasting steps of model identification, parameter estimation, and diagnostic checking. Initially, appropriate values of p, d, and q are identified, and then we estimate the parameters of the AR and MA terms included in the model. After having a particular ARIMA model, we perform certain diagnostic tests to ascertain that the residuals estimated from the model are white noise. If the model is not adequate, then a new tentative model is identified, followed by the same steps.
Autoregressive NN Model
The limitation of the ARIMA model is that it only deals with time-series data that are linear but does not accommodate the nonlinear structure of the data. This limitation introduced several machine learning forecasting models that are efficient in dealing with nonlinear data. NN is among one of the machine learning models used to approximate various nonlinearities of the data and is widely used by past studies while predicting stock market returns.
In a modern sense, NN is a network of several neurons composed of artificial nodes or neurons (Hopfield, 1982). The ANN model is comprised of input and output layers with one or multiple numbers of hidden layers where each layer is a collection of several neurons connected to multiple neurons in adjacent layers. The nonlinear relationship between variables is captured by hidden layers. The benefit of ANN over other machine learning models is stability in exchange for complexity and training speed. Almost all increased performance in speed is because of the ability to effectively parallelize computations during training.
Consider a series
The AR(p) input terms using the NN model can be written as
where
Apart from ANN applications, several studies use deep learning techniques that are considered more powerful than several other machine learning models owing to their distinct features, notable success, and improved results in different fields (LeCun et al., 2015). Unlike conventional NN, the DNN model has a capacity to pass data through multiple layers, which, as a result, enables a computer system to design multifaceted concepts out of simpler concepts (Goodfellow et al., 2016; Abe and Nakayama, 2018; Zhong and Enke, 2019). We have considered the autoregressive deep NNs (AR-DNN(p, k, l)) for modeling and forecasting. In AR-DNN(p, l, k), p is the number of autoregressive lags, l is the number of layers in the model, and k is the number of hidden nodes in each layer. The training of model is done by using resilient backpropagation as discussed by Riedmiller (1994).
Autoregressive Random Forest Model
The RF model was proposed by Breiman (2001) as an improved form of the decision tree. It has many applications in solving classification and regression problems and need to optimize a few parameters. There are two parameters in the RF model that generally affect the performance of the model: the number of trees
Data Description
The daily close price series data of the KSE-100 index is used in this study to examine and compare the performance and effectiveness of proposed models before and during the Covid-19 period. The closing price is chosen because it reflects all the activities of the index on a trading day (Ariyo et al., 2014). The KSE-100 index comprises 100 companies, listed in PSX, selected based on sector representation and market capitalization, which represents approximately 70–80% of the market capitalization of all listed companies in PSX. Data were collected from PSX, starting from 1 January 2001 to 20 August 2021, which comprised a total of 5,077 observations. For the analysis perspective, the whole period is sub-divided into two time frames: pre-Covid-19 period and Covid-19 period. As the first Covid-19 case was confirmed in Pakistan on 26 February 2020 in Karachi by the Ministry of Health (Sindh Province), the government of Pakistan and Pakistan Federal Ministry of Health confirmed another case in Islamabad on the same day (Ali, 2021). Therefore, the first phase covers the pre-Covid-19 period starting from 1 January 2001 to 25 February 2020 (4,712 observations), and the second phase covers the Covid-19 period starting from 26 February 2020 to 20 August 2021 (365 observations). However, we also account for the whole period in our analysis for the purpose of comparing the results from the pre-Covid-19 and Covid-19 periods. The dataset of each time frame is divided into two parts: training and testing. The training dataset is exclusively used to develop the model, while test dataset is particularly used to evaluate the performance of the developed model. In total, 75% of data are used for training, and the remaining 25% are used for testing purposes in each time frame. The above discussion is summarized in Table 1. All of the analyses were programmed in R-language.
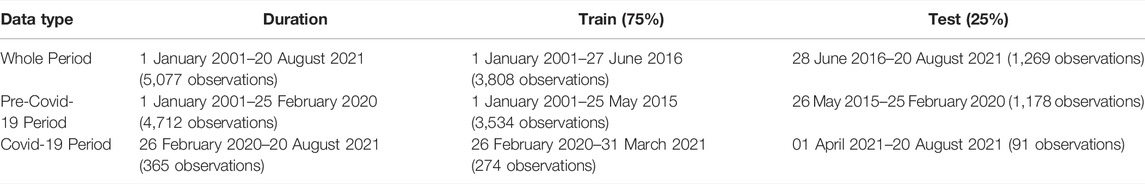
TABLE 1. Time frame, sample composition, and number of observations.
Performance Measures
The test data of each series were used in the evaluation of forecasting performance. The order selection of ARIMA models was done using Akaike information criteria (AIC). The performance of m test data values
Results and Discussion
The time-series plot of stock index prices is given in Figure 1, exhibiting several frequent turning points in the series. It can be noted that from the start of the Covid-19 period, there is a drastic downfall in index prices, which is likely the effect of the pandemic. Overall, high variations in the stock index prices can be observed.
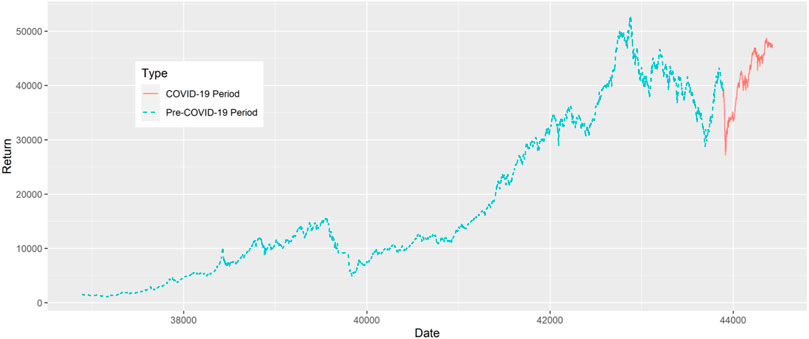
FIGURE 1. Time-series plot of stock index prices.
Table 2 presents the results of the stationarity test of stock price index during all time frames. The stationarity of the data is tested using the augmented Dickey–Fuller (ADF) test. It can be seen that all the series during any time frame is non-stationary at level. However, p-values are significant at first difference indicates that all series become stationary.
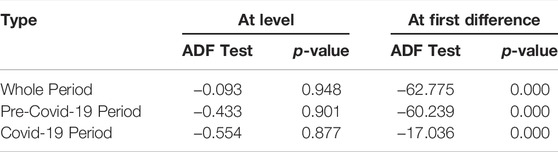
TABLE 2. Stationarity test of stock index prices during all time frames.
A comparison of the different orders of ARIMA models for the KSE-100 index on different time frames is given in Figure 2. The three most preferable information criteria are used to choose the best ARIMA model, i.e., the AIC, the Schwarz criterion, and the Hannan–Quinn information criterion (HQIC). AIC values are the least one among all criteria for each time frame. Therefore, owing to space limitation, we did not present the results for the rest of the criteria. AIC suggests that ARIMA(4, 1, 6), ARIMA(4, 1, 10), and ARIMA(3, 1, 5) are suitable for predicting the KSE-100 index for the whole period, pre-Covid-19 period, and during the Covid-19 period, respectively.
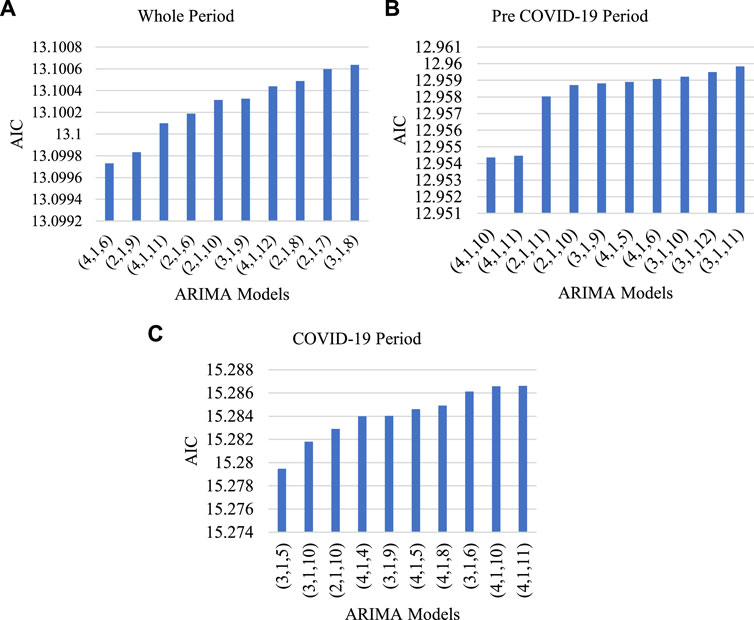
FIGURE 2. Comparison of different orders of ARIMA models for stock indices based on AIC on different time frames; i.e., (A) whole period, (B) pre-Covid-19 period, and (C) Covid-19 period.
NN plots with estimated model weights for each time frame are presented in Figure 3. Each image shows three deep layers and 10 neurons. For each time frame, we take one to four inputs (lags) and one output. AR-DNN(1, 3, 10) means, for example, one input, three hidden layers, and ten neurons.
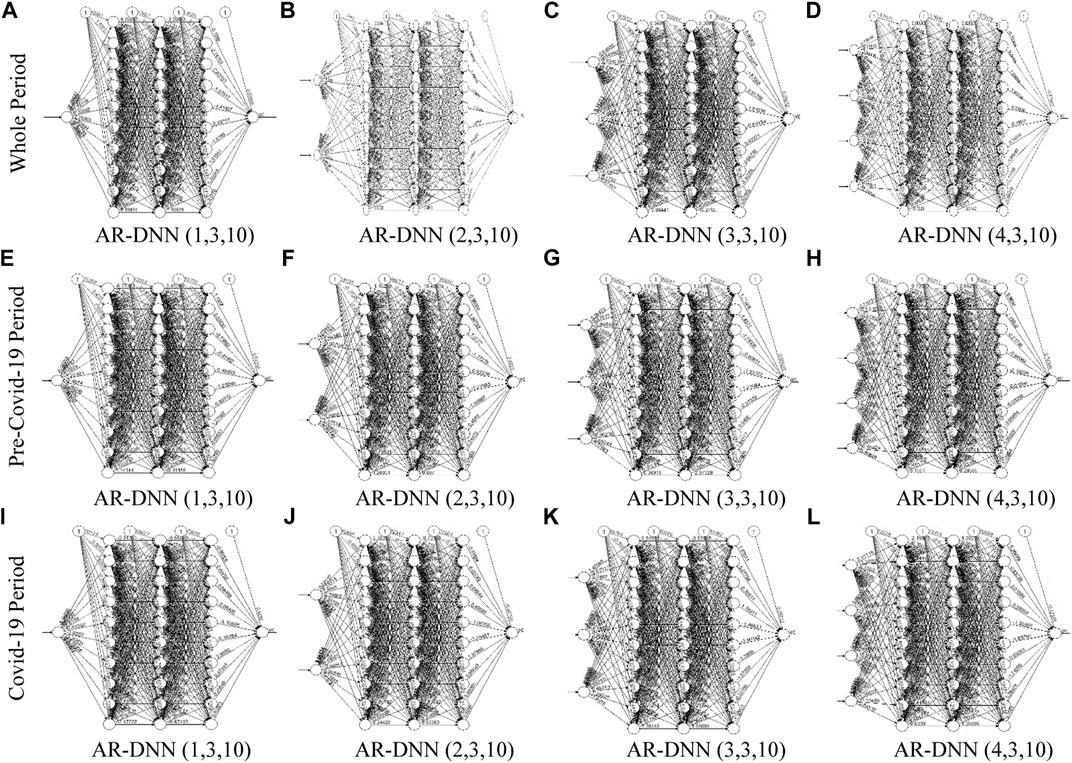
FIGURE 3. Neural network plot with estimated model weights: (A) AR-DNN(1, 3, 10). (B) AR-DNN(2, 3, 10). (C) AR-DNN(3, 3, 10). (D) AR-DNN(4, 3, 10). (E) AR-DNN(1, 3, 10). (F) AR-DNN(2, 3, 10). (G) AR-DNN(3, 3, 10). (H) AR-DNN(4, 3, 10). (I) AR-DNN(1, 3, 10). (J) AR-DNN(2, 3, 10). (K) AR-DNN(3, 3, 10). (L) AR-DNN(4, 3, 10).
Table 3 exhibits the performance of each proposed model for all sub-periods. For the whole period, AR-RF(1) is found the best among all RF models as it has the lowest values in all performance indices with the exception of r2. Among all DNN models, AR-DNN(1, 3, 10) is the preferred one owing to its lowest values in all performance indicators and outperforming among all proposed models for stock index forecasting for the whole period; hence, it is recommended for large number of observations.
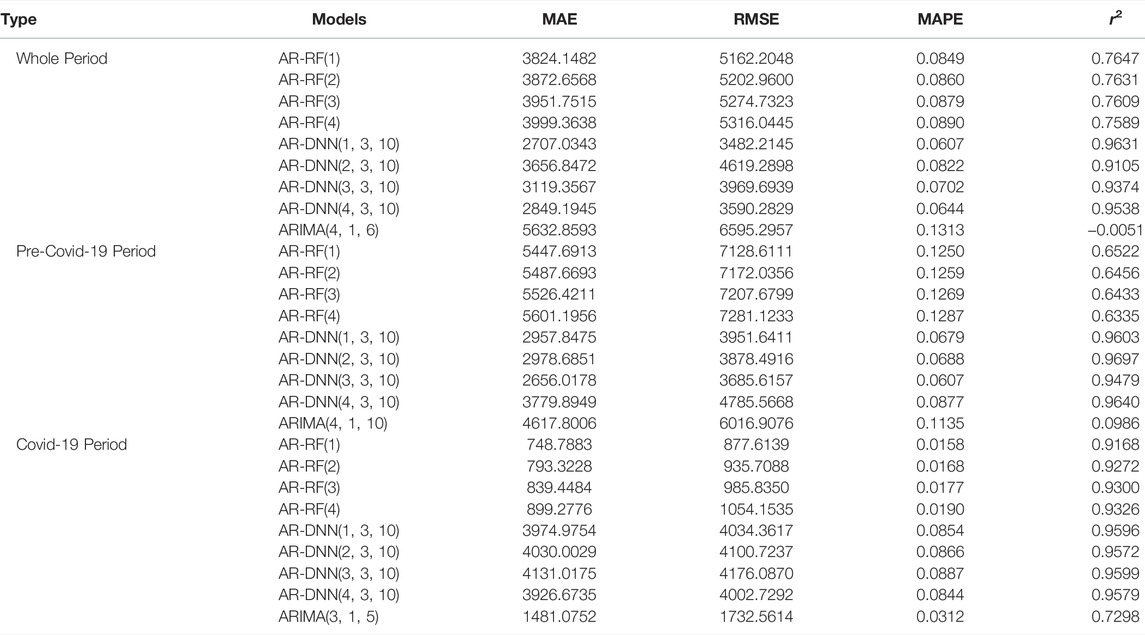
TABLE 3. Forecasting performance Comparison of different models for stock index using test data.
Opposite to that, ARIMA(4, 1, 6) is the least preferred one owing to significantly higher error values and considerably low r2 (i.e., r2 = −0.005), indicating weak relationship between actual and forecasted stock index prices for test data. The mean absolute error (MAE), root mean square error (RMSE), and mean absolute percentage error (MAPE) values of ARIMA(4, 1, 6) are respectively 108, 89, and 116% higher than those of the outperformer, i.e., AR-DNN(1, 3, 10).
Similar to above, for the pre-Covid-19 period, AR-RF(1) is also found to be the most ideal one among all RF models, but AR-DNN(3, 3, 10) is found as the best one among all DNN models to forecast the stock index, and it outperforms all other proposed models. ARIMA(4, 1, 10) again has significantly higher error values and low r2 and hence is not preferred at all. Finally, the Covid-19 period is the one with high fluctuations in stock index prices most likely because of the pandemic; therefore, its results are quite interesting. AR-RF(1) and AR-DNN(4, 3, 10), for example, are observed as the best RF and DNN models, respectively. Overall, unlike the DNN model in other sub-periods, AR-RF(1) is the outperformer during the Covid-19 period, hence suggesting for a low number of observations. However, the ARIMA(3, 1, 5) results are far more improved than those of DNN models but not better than RF results. Surprisingly, the error rate of all performance indicators for AR-DNN(4, 3, 10) is significantly higher than that of ARIMA(3, 1, 5). This may be because of the relatively low number of observations during the Covid-19 period.
Finally, a comparison of the best performers in all time frames shows that the best selected ARIMA models, i.e., ARIMA(4, 1, 6), ARIMA(4, 1, 10), ARIMA(3, 1, 5), have the significantly highest error rate for all performance indicators, which suggests that machine learning models have more power to accurately forecast the stock market indices than traditional forecasting models like ARIMA.
The comparison of actual and forecasted prices of the stock index using testing data in all time frames is illustrated in Figure 4. Each sub-figure (a, b, and c) shows the graph lines of actual data and forecasted results of best selected models of RF, DNN, and ARIMA in each of the selected periods. The results presented in each figure are exactly consistent with the performance measure results given in Table 3. For example, among all proposed models, AR-DNN(1, 3, 10) has the lowest error rate in the whole period for all performance indices; therefore, its line in Figure 4A is closest to that actual data line than those of others. In a similar manner, AR-DNN(3, 3, 10) was declared as the best among all proposed models for the pre-Covid-19 period based on performance indicators; therefore, it can be seen in Figure 4B that its line is close to the actual data line. Finally, AR-RF(1) is the best performer during the Covid-19 period, and this can also be verified in Figure 4C, which shows that its line is very much close to the actual data line.
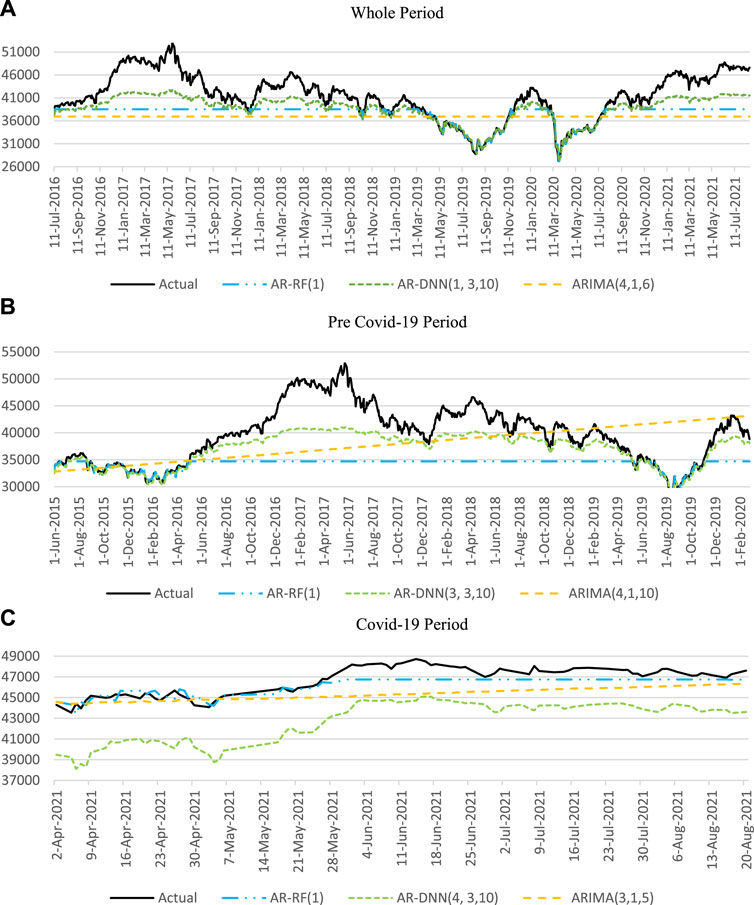
FIGURE 4. Comparison of actual and forecasted stock index prices using test data: (A) whole period, (B) pre-Covid-19 period, and (C) Covid-19 period.
Conclusion, Implications, Limitations, and Future Directions of the Study
Stock market prediction is becoming the most challenging task for investors especially during the Covid-19 period when the volatilities in stock prices and market uncertainties are too high owing to this pandemic. Though much effort has been devoted so far during the last two decades to the development and improvement of time-series and machine learning forecasting models, comparatively, there are fewer studies that cover the Covid-19 period and propose machine learning models for stock market forecasting during this period. This study fills this substantial gap by proposing the hybrid machine learning models, i.e., AR-DNN and AR-RF, in comparison with the ARIMA model for the KSE-100 index of the PSX covering the longer period of the last 21 years starting from 2001 to 2021. This whole period is further sub-divided into two time frames: pre-Covid-19 period and Covid-19 period. MAE, RMSE, MAPE, and correlation coefficient are used as performance measures for the proposed models. Results revealed that all data series are stationary at first-difference level in all time frames. Furthermore, findings indicate the dominancy of DNN models over other models as AR-DNN(1, 3, 10) and AR-DNN(3, 3, 10) are found as outperformers for the whole period and pre-Covid-19 period, respectively, as the number of observations is too high in these two time frames. However, for the Covid-19 time frame, AR-RF(1) is the outperformer, which may be because of a low number of observations. For all time frames, the ARIMA model is the least preferred model owing to high error values. Results suggest that DNN models are best for large observations, whereas the RF model is appropriate to use when the number of observations is low. As this study provides evidence on the KSE-100 index of PSX for a long period especially during the global pandemic period, it will help market participants, particularly investors, as well as policymakers in managing their risks and portfolios in their future investments. As no study is without limitations, this study has some limitations that provide the avenue for future research. This study, for example, employs only selected machine learning models, so the same work can be carried out by using other relevant models such as SVM, LSTM, and GRU. In a similar manner, other statistical models in conjunction with machine learning models can also be applied for better forecasting. Likewise, this study is limited to the Asian market and uses index data for forecasting. Future studies may use the share price data of top companies listed in renowned stock exchanges to facilitate their shareholders in their investment decisions.
Data Availability Statement
Publicly available datasets were analyzed in this study. These data can be found here: https://finance.yahoo.com/quote/KSE.BO/history/?guccounter = 1&guce_referrer = aHR0cHM6Ly93d3cuZ29vZ2xlLmNvbS8&guce_referrer_sig = AQAAAHUFfEEy9lJLsDj4sTXOflUnzFdIYG8-Vx3kX_tCIRyKmXVRao-95UtKjNIVpKc_ebK4cEqBfMHc_wzE9V33MEHmx_q_99H0ypucGm5qzYYaS32wnqx-4DakIx6djeklVnzYjb8i4UBXKvtAQxTFGLHXyTx7Lv4VqvaIjHtIquAr
Author Contributions
This study is contributed by the current authors in following manner: The idea generation and conceptualization and data collection and its management are collectively done by AO and AS; software programming, technical analysis and proof reading of write up along with validation of results are jointly performed by HK and SH; and in the last but not the least, MF contributed in formal analysis, drafting and critically revisit and added the value by inserting intellectual content in different sections of the manuscript with significant contributions. Finally, formal investigation and follow ups, writing and proofreading the original draft contents are evenly done by all authors.
Conflict of Interest
The authors declare that the research was conducted in the absence of any commercial or financial relationships that could be construed as a potential conflict of interest.
Publisher’s Note
All claims expressed in this article are solely those of the authors and do not necessarily represent those of their affiliated organizations or those of the publisher, the editors, and the reviewers. Any product that may be evaluated in this article, or claim that may be made by its manufacturer, is not guaranteed or endorsed by the publisher.
References
Abe, M., and Nakayama, H. (2018). “Deep Learning for Forecasting Stock Returns in the Cross-Section,” in Advances in Knowledge Discovery and Data Mining (Springer International Publishing), 273–284.doi:10.1007/978-3-319-93034-3_22
Ahmad, N., Naveed, R. T., Scholz, M., Irfan, M., Usman, M., and Ahmad, I. (2021). CSR Communication through Social Media: A Litmus Test for Banking Consumers' Loyalty. Sustainability 13 (4), 2319. doi:10.3390/su13042319
Ali, I. (2021). Pakistan Confirms First Two Cases of Coronavirus, Govt Says 'no Need to Panic. [Online]. Available at: aHR0cHM6Ly93d3cuZGF3bi5jb20vbmV3cy8xNTM2NzkyL3Bha2lzdGFuLWNvbmZpcm1zLWZpcnN0LXR3by1jYXNlcy1vZi1jb3JvbmF2aXJ1cy1nb3Z0LXNheXMtbm8tbmVlZC10by1wYW5pYw== (Accessed September 11, 2021).
Ariyo, A. A., Adewumi, A. O., and Ayo, C. K. (2014). “Stock Price Prediction Using the ARIMA Model,” in Proceeding of the 2014 UKSim-AMSS 16th International Conference on Computer Modelling and Simulation, 106–112. doi:10.1109/uksim.2014.67
Ashraf, B. N. (2020). Stock Markets' Reaction to COVID-19: Cases or Fatalities? Res. Int. Bus. Finance 54, 101249. doi:10.1016/j.ribaf.2020.101249
Ayala, J., García-Torres, M., Noguera, J. L. V., Gómez-Vela, F., and Divina, F. (2021). Technical Analysis Strategy Optimization Using a Machine Learning Approach in Stock Market Indices. Knowledge-Based Syst. 225, 107119. doi:10.1016/j.knosys.2021.107119
Babu, C. N., and Reddy, B. E. (2014). “Selected Indian Stock Predictions Using a Hybrid ARIMA-GARCH Model,” in Proceeding of the 2014 International Conference on Advances in Electronics Computers and Communications, 1–6.
Banerjee, D. (2014). “Forecasting of Indian Stock Market Using Time-Series ARIMA Model,” in Proceeding of the 2014 2nd International Conference on Business and Information Management (ICBIM)), 131–135.
Box, G. E. P., and Jenkins, G. M. (1970). Time Series Analysis : Forecasting and Control. San Francisco: Holden Day.
Challa, M. L., Malepati, V., and Kolusu, S. N. R. (2020). S&P BSE Sensex and S&P BSE IT Return Forecasting Using ARIMA. Financ. Innov. 6 (1), 47. doi:10.1186/s40854-020-00201-5
Chatfield, C. (1988). What Is the 'best' Method of Forecasting? J. Appl. Statistics 15 (1), 19–38. doi:10.1080/02664768800000003
Jackson, C., PrassannaQuadir, J., and Sivakumar, M. V. (2021). “Stock Market Analysis and Prediction Using Time Series Analysis” in Materials Today: Proceedings. Available at: https://www.sciencedirect.com/science/article/pii/S2214785320389823 doi:10.1016/j.matpr.2020.11.364
Devi, B. U., Sundar, D., and Alli, P. (2013). An Effective Time Series Analysis for Stock Trend Prediction Using ARIMA Model for Nifty Midcap-50. Int. J. Data Min. Knowl. Manag. Process 3 (1), 65.
Dudek, G. (2015). Short-Term Load Forecasting Using Random Forests. Springer International Publishing, 821–828. doi:10.1007/978-3-319-11310-4_71
Engelhardt, N., Krause, M., Neukirchen, D., and Posch, P. N. (2021). Trust and Stock Market Volatility during the COVID-19 Crisis. Finance Res. Lett. 38, 101873. doi:10.1016/j.frl.2020.101873
Fama, E. F. (1995). Random Walks in Stock Market Prices. Financial Analysts J. 51 (1), 75–80. doi:10.2469/faj.v51.n1.1861
Ghosh, I., Datta Chaudhuri, T., and Chaudhuri, T. D. (2021). FEB-stacking and FEB-DNN Models for Stock Trend Prediction: A Performance Analysis for Pre and Post Covid-19 Periods. Decis. Mak. Appl. Manag. Eng. 4 (1), 51–86. doi:10.31181/dmame2104051g
Granger, C. W. J. (1989). Invited Review Combining Forecasts-Twenty Years Later. J. Forecast. 8 (3), 167–173. doi:10.1002/for.3980080303
Harjoto, M. A., Rossi, F., and Paglia, J. K. (2021). COVID-19: Stock Market Reactions to the Shock and the Stimulus. Appl. Econ. Lett. 28 (10), 795–801. doi:10.1080/13504851.2020.1781767
Hopfield, J. J. (1982). Neural Networks and Physical Systems with Emergent Collective Computational Abilities. Proc. Natl. Acad. Sci. U.S.A. 79 (8), 2554–2558. doi:10.1073/pnas.79.8.2554
Jenkins, G. M. (1982). Some Practical Aspects of Forecasting in Organizations. J. Forecast. 1 (1), 3–21. doi:10.1002/for.3980010103
Krogh, A., and Vedelsby, J. (1995). “Neural Network Ensembles, Cross Validation, and Active Learning,” in Advances in Neural Information Processing Systems, 231. 7.
Kumar Meher, B., Thonse Hawaldar, I., Spulbar, C., and Birau, R. (2021). Forecasting Stock Market Prices Using Mixed ARIMA Model: a Case Study of Indian Pharmaceutical Companies. Invest. Manag. Financial Innovations 18 (1), 42–54. doi:10.21511/imfi.18(1).2021.04
Kumar, M., and Thenmozhi, M. (2012). Stock Index Return Forecasting and Trading Strategy Using Hybrid ARIMA-Neural Network Model. Int. J. Financial Manag. 1 (1).
LeCun, Y., Bengio, Y., and Hinton, G. (2015). Deep Learning. Nature 521 (7553), 436–444. doi:10.1038/nature14539
Liu, Z., Huynh, T. L. D., and Dai, P.-F. (2021). The Impact of COVID-19 on the Stock Market Crash Risk in China. Res. Int. Bus. Finance 57, 101419. doi:10.1016/j.ribaf.2021.101419
Mahdi Pakdaman, N., Taremian, H., and Homa Baradaran, H. (2010). “Stock Market Value Prediction Using Neural Networks,” in Proceeding of the 2010 International Conference on Computer Information Systems and Industrial Management Applications (CISIM), 132–136. doi:10.1109/cisim.2010.5643675
Mazur, M., Dang, M., and Vega, M. (2021). COVID-19 and the March 2020 Stock Market Crash. Evidence from S&P1500. Finance Res. Lett. 38, 101690. doi:10.1016/j.frl.2020.101690
Musa, Y., and Joshua, S. (2020). Analysis of ARIMA-Artificial Neural Network Hybrid Model in Forecasting of Stock Market Returns. Ajpas 6, 42–53. doi:10.9734/ajpas/2020/v6i230157
Naik, R. L., Ramesh, D., Manjula, B., and Govardhan, A. (2012). Prediction of Stock Market Index Using Genetic Algorithm. Comput. Eng. Intelligent Syst. 3 (7), 162–171.
Riedmiller, M. (1994). Rprop-description and Implementation Details. Karlsruhe: University of Karlsruhe.
Sable, S., Porwal, A., and Singh, U. (2017). “Stock Price Prediction Using Genetic Algorithms and Evolution Strategies,” in Proceeding of the 2017 International conference of Electronics, Communication and Aerospace Technology (ICECA), 549–553. doi:10.1109/iceca.2017.8212724
Shen, S., Jiang, H., and Zhang, T. (2012). Stock Market Forecasting Using Machine Learning Algorithms. Stanford, CA: Department of Electrical Engineering, Stanford University, 1–5.
Site, A., Birant, D., and Işık, Z. (2019). “Stock Market Forecasting Using Machine Learning Models,” in Proceeding of the 2019 Innovations in Intelligent Systems and Applications Conference (ASYU), 1–6. doi:10.1109/asyu48272.2019.8946372
Sohangir, S., Wang, D., Pomeranets, A., and Khoshgoftaar, T. M. (2018). Big Data: Deep Learning for Financial Sentiment Analysis. J. Big Data 5 (1), 3. doi:10.1186/s40537-017-0111-6
Song, Y., Lee, J. W., and Lee, J. (2019). A Study on Novel Filtering and Relationship between Input-Features and Target-Vectors in a Deep Learning Model for Stock Price Prediction. Appl. Intell. 49 (3), 897–911. doi:10.1007/s10489-018-1308-x
Sunday Adebayo, T., Saint Akadiri, S., Haouas, I., and Rjoub, H. (2022). A Time-Varying Analysis between Financial Development and Carbon Emissions: Evidence from the MINT Countries. Energy & Environ., 0958305X2210820. doi:10.1177/0958305x221082092
Uri, N. D. (1977). Forecasting: A Hybrid Approach. Omega 5 (4), 463–472. doi:10.1016/0305-0483(77)90008-1
Wang, Y., and Guo, Y. (2020). Forecasting Method of Stock Market Volatility in Time Series Data Based on Mixed Model of ARIMA and XGBoost. China Commun. 17 (3), 205–221. doi:10.23919/JCC.2020.03.017
Zhang, D., Hu, M., and Ji, Q. (2020). Financial Markets under the Global Pandemic of COVID-19. Finance Res. Lett. 36, 101528. doi:10.1016/j.frl.2020.101528
Zhang, G. P. (2003). Time Series Forecasting Using a Hybrid ARIMA and Neural Network Model. Neurocomputing 50, 159–175. doi:10.1016/S0925-2312(01)00702-0
Zhang, J., Li, L., and Chen, W. (2021). Predicting Stock Price Using Two-Stage Machine Learning Techniques. Comput. Econ. 57 (4), 1237–1261. doi:10.1007/s10614-020-10013-5
Keywords: Covid-19, deep neural network, forecasting, machine learning, random forest, stock market, ARIMA
Citation: Omar AB, Huang S, Salameh AA, Khurram H and Fareed M (2022) Stock Market Forecasting Using the Random Forest and Deep Neural Network Models Before and During the COVID-19 Period. Front. Environ. Sci. 10:917047. doi: 10.3389/fenvs.2022.917047
Received: 19 April 2022; Accepted: 01 June 2022;
Published: 25 July 2022.
Edited by:
Elie Bouri, Lebanese American University, LebanonReviewed by:
Tomiwa Sunday Adebayo, Cyprus International University, TurkeyAnupam Dutta, University of Vaasa, Finland
Copyright © 2022 Omar, Huang, Salameh, Khurram and Fareed. This is an open-access article distributed under the terms of the Creative Commons Attribution License (CC BY). The use, distribution or reproduction in other forums is permitted, provided the original author(s) and the copyright owner(s) are credited and that the original publication in this journal is cited, in accordance with accepted academic practice. No use, distribution or reproduction is permitted which does not comply with these terms.
*Correspondence: Shuai Huang, aHMxMTE2QGtvbmt1ay5hYy5rcg==