 Jitong Fan
 Gang Liu
 Ziqian Xia
 Sanfa Cai2
- 1School of Civil Engineering, Tianjin University, Tianjin, China
- 2School of Economics and Management, Tongji University, Shanghai, China
- 3College of Management and Economics, Tianjin University, Tianjin, China
Climate change is a global problem, and it is receiving increasing scientific attention due to its significant impact. To provide valuable insights for understanding and summarizing the research trends and prospects on climate change risk perception, this study takes a qualitative and quantitative analysis by using bibliometric tools. This analysis presents information related to authors, countries, institutions, journals, top cited publications, research hot spots, trends, and prospects. The analysis involved 4429 articles after rigorous screening and evaluated them on the risk perception of climate change in countries and the public. The majority of publications were published during the period of 2016–2022 (70.92%), with Climatic Change being the dominant journal and most research originating from the USA, England and Australia. The research content of this topic is primarily divided into several categories, including environmental sciences, atmospheric sciences, water resources and public health. The results showed that adaptation and vulnerability attract much attention. Finally, this paper identifies and discusses five research themes that should be further studied: determinants of perception, human behavior, human mental health risk, agriculture and adaptive strategy.
1 Introduction
Recently, the Sixth Assessment Report of IPCC (Intergovernmental Panel on Climate Change), the authority on global climate change, warns that global action to mitigate climate change and adaptation is urgent and that any delay will make people's futures unlivable and sustainable. At the same time, scientists, politicians, and economists have all centered their attention on climate change in recent decades. It is one of the main causes of adverse impacts and key risks to natural and human social systems. Denying climate change, especially by governments and policymakers, is a serious problem because it hinders the process of risk mitigation and strategy adaptation. There is a broad scientific conclusion that global climate change is taking place. Research on the impact of climate change mainly focuses on environmental and economic aspects, including food security (Parvin and Ahsan, 2013), water resources (Yang et al., 2018), health (Madeira et al., 2018), biodiversity (Fei et al., 2017), energy (Wang et al., 2018) and some other aspects. Scientists' research on climate change has been quite comprehensive.
Climate change has been a widespread concern, but less attention has been given to climate change risk perception. Climate change is a human-reduced, serious risk, but the public's perception of climate change and support for climate change policies are still ambiguous in many parts of the world (Brechin and Bhandari, 2011), which depends on their environment and world outlook (Becerra et al., 2020). Many scholars from various countries have conducted much research on the risk perception of climate change. For instance, Leiserowitz studied the perception of the American people on the local climate and found that most people pay high attention to the global climate change problem, but they believe that the risk of climate change is medium, and the public perception of climate change also affects their perception of relevant government policies (Leiserowitz, 2005). Recent research on the public perception of climate change has improved our understanding of the changing public response (Brulle et al., 2012). These climate change risk perception studies are important to inform and support local people, technical experts and decision makers (Funatsu et al., 2019). Understanding and encouraging the potential drivers of local people to adapt to climate change can help develop plans and strategies, which has a greater possibility of achieving positive results.
Climate change risk perception is a complex problem with subjectivity based on environmental and cultural characteristics. However, it is important for scientists and politicians to develop adaptation and mitigation strategies and policies (Armah et al., 2017). Strengthening the research on the risk perception of climate change and judging whether public perception is accurate by comparing with the actual climate change trend. These results can provide a reference for government decision-making behavior. Although many articles cover different perspectives of climate change risk perception, it is necessary to conduct a comprehensive bibliometric analysis to help scholars evaluate current research progress and determine future research directions. Since these publications are geographically and spatially distributed, our analysis will show the relationship between them and how much they are related to each other.
The application of big data and bibliometric analysis makes it more convenient to collect and process scientific climate change research. This helps to understand the relationship between previous research and the current literature (Callaghan et al., 2020). Bibliometric research has been proven to be very useful for natural science, urban research and other research directions (Wu et al., 2018) and has become one of the most prominent methods to evaluate and predict the research trends of specific topics (Zhao et al., 2018). At the same time, this research method is helpful for revealing the research trends and the characteristics of academic publishing, as well as the relationship among different documents, authors and publishing regions (Lee, 2017). In bibliometric analysis, big data is defined as “big literature”, which is characterized by high velocity, volume, and variability (Nunez Mir et al., 2016). The objective of this study is to analyze the 4429 pieces of literature collected (from 2000 to 2022) and thus derive a research analysis of climate change risk perception.
We identified hot spots, trends and improvements in climate change risk perception in recent years through bibliometric analysis. Moreover, we analyzed the core topic, future research hotspots and practical research methods to provide an overview of references for theoretical research and practical work on climate change risk perception. The dataset has been made publicly available on figshare (https://figshare.com/articles/dataset/data_zip/21314085).
2 Materials and methods
2.1 Data collection
We comprehensively searched the Web of Science Core Collection (WoSCC) database to search publications, and the selected time span ranged from 2000 to 2022. The reason for only including 22 years of studies is that only 16 papers were found before 2000 by searching WoSCC using our preidentified keywords (see below). Additionally, papers published before 2000 are not very relevant to the current study due to the long distance between them. Therefore, we selected papers from 2000-2022 for analysis. The retrieval time was March 13th, 2022. The search statement is “TS= (("climat* chang*" or "climat* var*" or "environment* chang*" or "climat* warm*") and risk and (aware* or percept* or sense* or feel* or cogni*)) AND PY= (2000-2022)”. The WoSCC is currently one of the primary sources for most bibliometric analyses (Mongeon and Paul-Hus, 2015). We restricted the language of our results to English. We choose the related categories, including environmental sciences, environmental studies, meteorology atmospheric sciences, water resources, public environmental occupational health, geosciences multidisciplinary, geography or ecology, economics, development studies, energy fuels, social sciences interdisciplinary, multidisciplinary sciences, biodiversity conservation, regional urban planning, mathematics interdisciplinary applications, psychology multidisciplinary and communication. We finally selected original research and review articles, filtering publications to 4429 records. Remove papers that are not related to the research topic, including ethics, limnology, toxicology, pediatrics, etc. The timeframe spanned more than 20 years, which made the analysis of the structure and trends of knowledge domains more typical. To ensure an accurate search, our theoretical approaches consider what is now understood as climate change risk perception research. Three independent variables, climate change, risk and perception, were defined as the search keywords.
2.2 Topic explanation
The theme of this paper is “climate change risk perception,” which means people’s perception of climate change risk. Compared with (Howe et al., 2015), our paper pays more attention to climate change risk perception globally; our paper focuses on the many aspects of climate change risk perception, rather than just the climate change risk perception about environment (Bradley et al., 2020); compared with (Tam and McsDaniels, 2013), our research focuses on relevant policies; also, our paper is more concentrated on the people of all classes than (Parvin and Ahsan, 2013) and (Wu et al., 2018).
2.3 Bibliometric Analysis
Bibliometrics provides an important method for analyzing academic documents. It can visually show the statistical results of academic documents by using bibliometric tools such as VOSviewer and Bibliometrix (Li et al., 2017). Bibliometrix, an important R-tool for comprehensive bibliometric analysis designed in R language (Aria and Cuccurullo, 2017). With a complete process of data import, data transformation, data analysis, and scientific visualization, Bibliometrix basically meets the requirements of bibliometric analysis (Chen et al., 2022). We used it to make diagrams and tables, including thematic map, thematic evolution, network map, co-citation network, co-authorship network and co-occurrence network. VOSviewer is a program developed for constructing and viewing bibliometric maps. The program is freely available to the bibliometric research community (van Eck and Waltman, 2010). Therefore, we use VOSviewer, which also has three types of visualization: network, overlay and density. It is color-coded depending on the popularity and similarity of the studies. The line used in the interconnection of words also changes in contrast. As the word is commonly used in different studies, the color becomes vibrant (Tamala et al., 2022). The viewing capabilities of VOSviewer are particularly useful for analyses that contain at least a moderate number of items (at least 100 items) (van Eck and Waltman, 2010).
3 Results
3.1 Overview of result data and map
As shown in Figure 1. First, we summarize the data and network diagram obtained by analyzing the collected documents with bibliometric tools. In the performance analysis, we study the following aspects: publication-related, citation-related, citation-publication-related and author-related metrics. Combining these data, we can see the current situation of climate change risk perception research, the degree of citation of relevant literatures and the overall level of the authors. We use two bibliometric tools to map science mapping. Through VOSviewer, we can obtain three main types of graphs: network, overlay and density visualization maps. Co-occurrence, citation and co-citation analyses are represented by these three kinds of diagrams. Furthermore, we used the Bibliometrix package in R language for visual analysis. Using it, we can obtain a visual map of overview, documents, sources and authors.
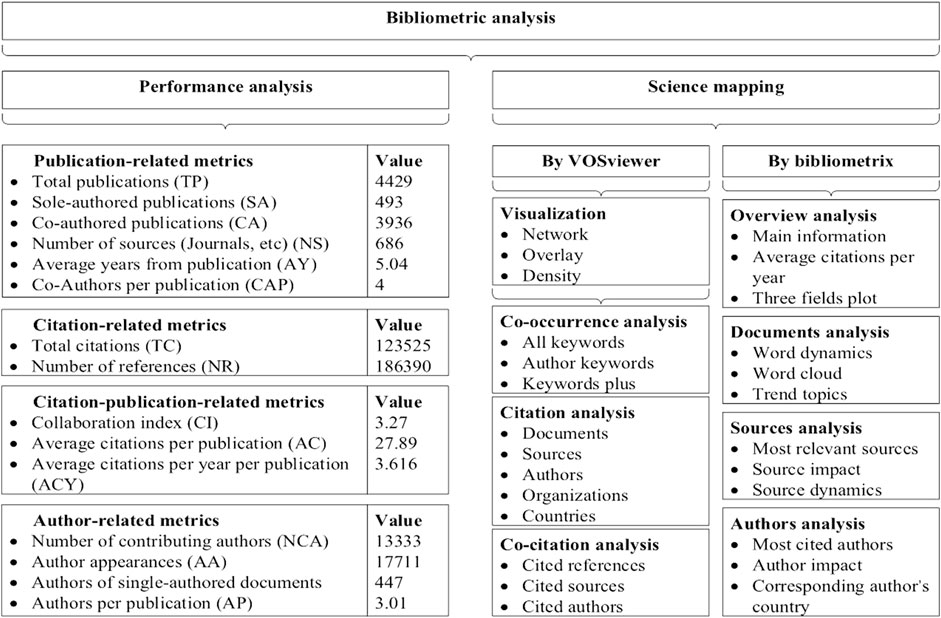
FIGURE 1. Overview of the bibliometric analysis in this paper
3.2 Analysis of articles
The annual growth rate of related publications is 15.76%. The number of related publications increased slowly from 2000 to 2015, accounting for just 29.08% of the total. The number of publications has increased substantially since 2015. The number of related papers has grown rapidly, with 26.49% during 2016-2017. The majority of publications (70.92%) were published from 2016 to 2022, which is shown in Figure 2. This may be because these years had the greatest impact from climate change. A World Meteorological Organization survey showed that 2015 was the hottest year on record, and during this period, concentrations of the major greenhouse gases continued to rise and reached record levels for the instrumental period (World Meteorological Organization, 2019). In addition, the Paris Agreement was adopted by the United Nations Climate Change Conference in 2015 (United Nations, 2015). All these factors have led to the upsurge in climate change research since 2015.
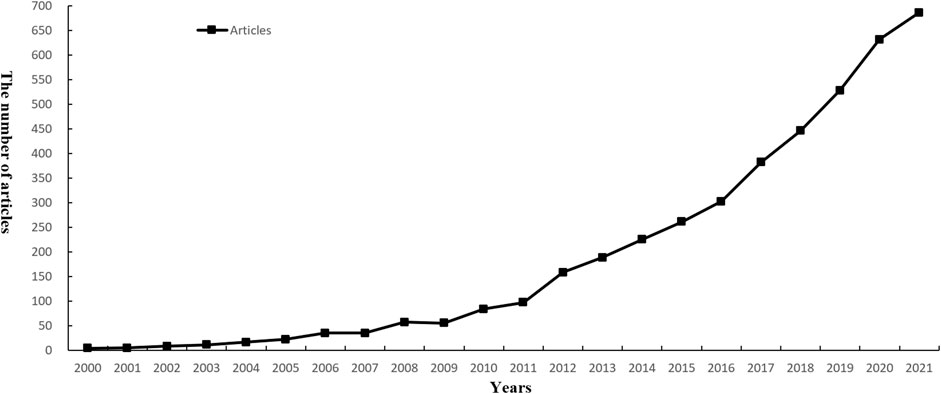
FIGURE 2. Number of articles per year from 2000 to 2021.
3.2.1 Citations of articles
Table 1 shows the top 10 articles according to the number of total citations and total citations per year and local citation scores. (Adger, 2006), published in the Global Environmental Change in 2006, is cited the most 2895 times, which reviews research traditions of vulnerability to environmental change and the challenges for present vulnerability research in integrating with the domains of resilience and adaptation (Adger, 2006). The other three articles are also cited more than 1000 times (Adger et al., 2009) (1267 times), (Leiserowitz, 2006) (1078 times) and (Parry et al., 2004) (1023 times). Meanwhile, (Adger, 2006) is also the most cited article per year (170.29), followed by (Dryhurst et al., 2020) (160.67) and (Gatto et al., 2020) (134.67). The most cited articles can provide helpful insights to researchers interested in this field. Moreover, two important indicators, the local citation score (LCS) and global citation score (GCS), were used to identify hot publications with citation analysis (Huang et al., 2022). GCS refers to the total number of citations in the Web of Science database. LCS represents the number of times a document has been cited in the current sample literature (Huang et al., 2022). The article with the highest local citation score in the current research field is (Leiserowitz, 2006), with an LCS of 428 and GCS of 1078, which means that its local citations are more than others. However, there are some articles, for example, (Adger et al., 2009) with high GCS (1267) but low LCS (197), which shows that their study content is mostly interdisciplinary research.
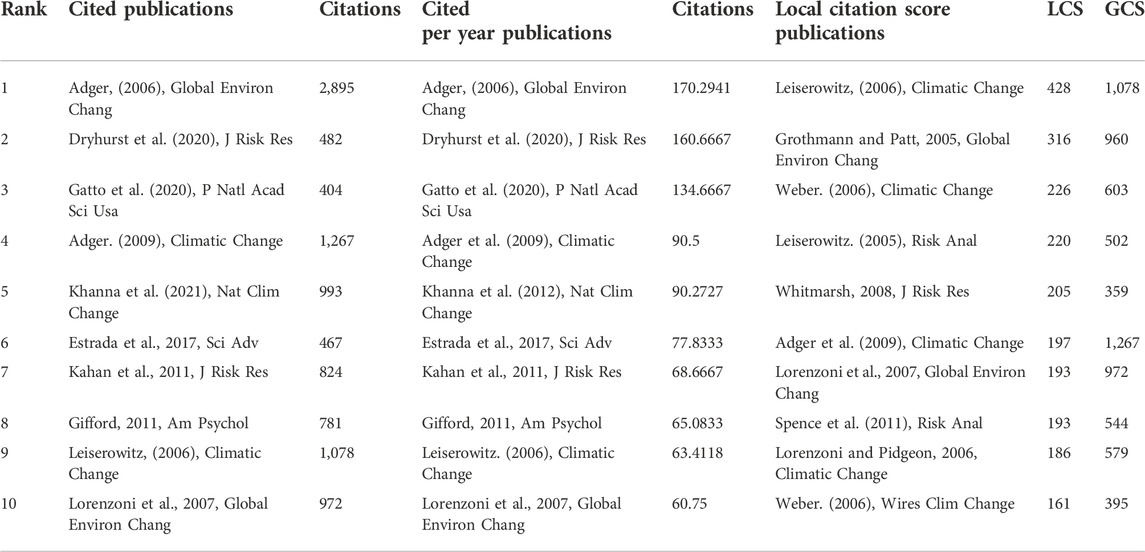
TABLE 1. The Top 10 articles according to the number of total citations and total citations per year and local citation score
3.2.2 Co-Citation Network Analysis
Co-citation is a bibliographic analysis method that indicates a connection between two documents that are both cited by an identical third document (Nadelhoffer and Raich, 1992). The co-citation analysis of VOSviewer software includes cited references, cited sources, and cited authors, which can find close relationship between articles, journals and authors in that field. In the co-citation network, a cluster can be defined as a group of well-connected articles in a research field, and the connection with articles in other clusters or research fields is limited (Huang et al., 2022).
Among the 196313 cited references, according to the calculated total strength of links with other cited references. There is a co-citation network composed of the top 50 influential articles (each has more than 97 cited references) is displayed in Figure 3A, which has a small table about the information of the top 3. The reason for choosing the top 50 articles for the network diagram is that 50 items can display the main content of the graph in a reasonable way when drawing, without cluttering the graph because of too many items. At the same time, the graph does not contain too little information due to the small number of items. Moreover, most of the bibliometric literature also selects approximately 50 items for network diagramming (e.g., (Rana, 2020)). (Leiserowitz, 2006) has the highest total link strength. This study found that American risk perceptions and policy support are strongly influenced by experiential factors, which is 2268, followed by (Spence et al., 2011) (1487) and (Weber, 2006) (1425), and they are all the top influence co-citation articles. Figure 3A also shows 3 clusters in these articles, and each cluster has a different color. The red cluster with 22 articles focuses on public perception (Weber, 2006; Spence et al., 2011); the green cluster with 15 items focuses on risk perception (Slovic, 2020); and the blue cluster with 13 publications focuses on perception and policy support (Leiserowitz, 2006).
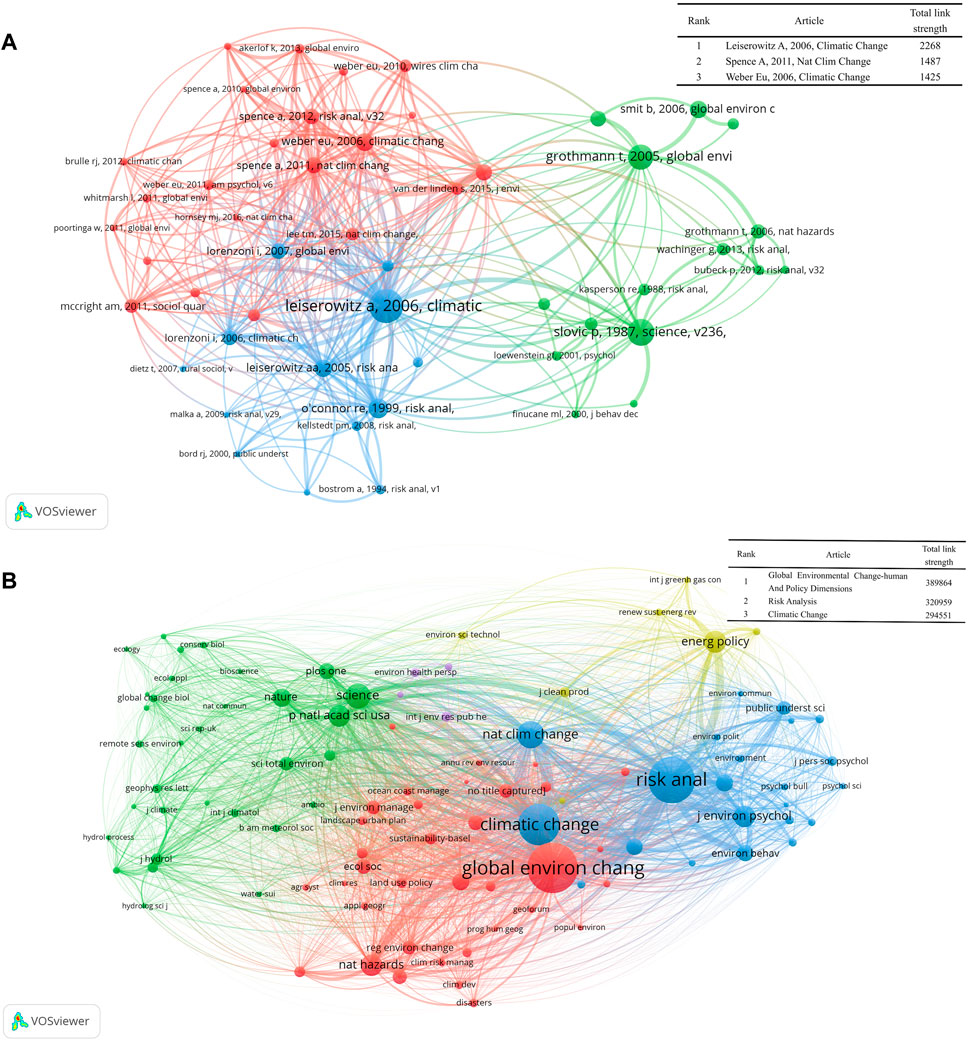
FIGURE 3. Cocitation map of articles (A) (top 50 articles with more than 97 cited references) and journals (B) ((top 50 journals with more than 488 cited references)
3.3 Analysis of journals
3.3.1 Distribution of journals
The results show that the 4429 selected studies are published in 686 types of journals. Table 2 shows the primary performance of the top 10 most productive journals. The results find that Climatic Change (Climatic Change is dedicated to the totality of the problem of climatic variability and change, including its descriptions, causes, implications and interactions among these) is the most productive journal publishing 190 papers, followed by Sustainability (176 papers) and International Journal of Environmental Research and Public Health (131 papers). Global Environmental Change-human And Policy Dimensions has the highest h-index (53), followed by Climatic Change (40) and Risk Analysis (40). Global Environmental Change-human And Policy Dimensions also has the highest total citations (14036). These all indicate that Global Environmental Change-human And Policy Dimensions, Climatic Change, Risk Analysis, Sustainability and International Journal of Environmental Research and Public Health have significant contributions in this field, while the rest of journals have additional contributions. Among these ten journals, 4 were in England, 3 were in the Netherlands and 2 were in Switzerland, and they all had high impact factors.
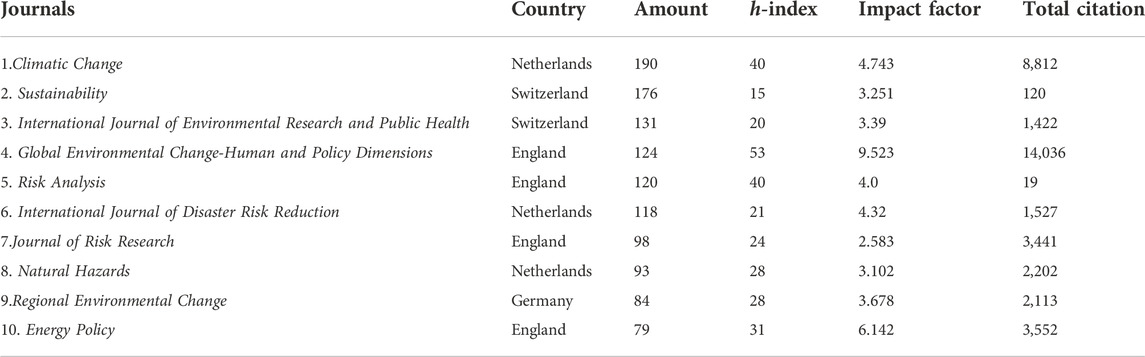
TABLE 2. The Primary performance of the top 10 most productive journals.
3.3.2 Co-Citation of journals
In the visualization of journal co-citation, the distance between the two journals reflects the correlation between different journals and disciplines. Generally, the closer the distance between the two journals, the stronger the correlation between them. We can easily find that VOSviewer divides journals into five clusters in Figure 3B: environmental and global in the red cluster (Global Environmental Change-Human And Policy Dimensions, Natural Hazards and Environmental Science & Policy); risk and climate change in the blue cluster (Climatic Change, Risk Analysis and Nature Climate Change); nature and biology in green cluster (Nature, Science and Plos One); energy and technology (Energy Policy, Energy Research & Social Science and Environmental Science & Technology); public health in purple (International Journal Of Environmental Research And Public Health and Environmental Health Perspectives). Among the 67859 sources, Global Environmental Change-Human and Policy Dimensions, which advance knowledge about the human and policy dimensions of global environmental change, have the highest total link strength, which is 389864.
3.4 Subject categories analysis
The top 10 subject categories included environmental sciences (1933 articles, accounting for 43.64% of the total), environmental studies (1399 articles, 31.59%), meteorology atmospheric sciences (809 articles, 18.27%), water resources (563 articles, 12.71%), public environmental occupational health (488 articles, 11.01%), geosciences multidisciplinary (414 articles, 9.35%), geography (292 articles, 6.60%), ecology (243 articles, 5.49%), economics (213 articles, 4.81%), and development studies (163 articles, 3.68%). The number of various publications reflects the trend of climate change risk perception research in different fields. Between 2000 and 2022, the number of publications in environmental sciences, environmental studies and meteorology atmospheric sciences increased significantly, while the number of publications in other categories increased gradually.
3.5 Changes and trends of themes
In Figure 4A, the time periods analyzed are divided according to important time points (e.g., the enactment of important agreements). The themes are generated automatically by the analysis of Bibliometrix. The different themes were weighted by using a modified version of the inclusion index, taking into account the occurrences per period of each keyword appearing in a theme (Aria et al., 2020). In Figure 4B, motor theme means a theme that is currently being researched and is likely to become a hot topic for future research. The basic theme means that it is more basic and from which most other research is developed. A declining theme means that it is fading and will likely not be researched in the future. The niche theme means a theme of a small group that deviates from the main direction of research.
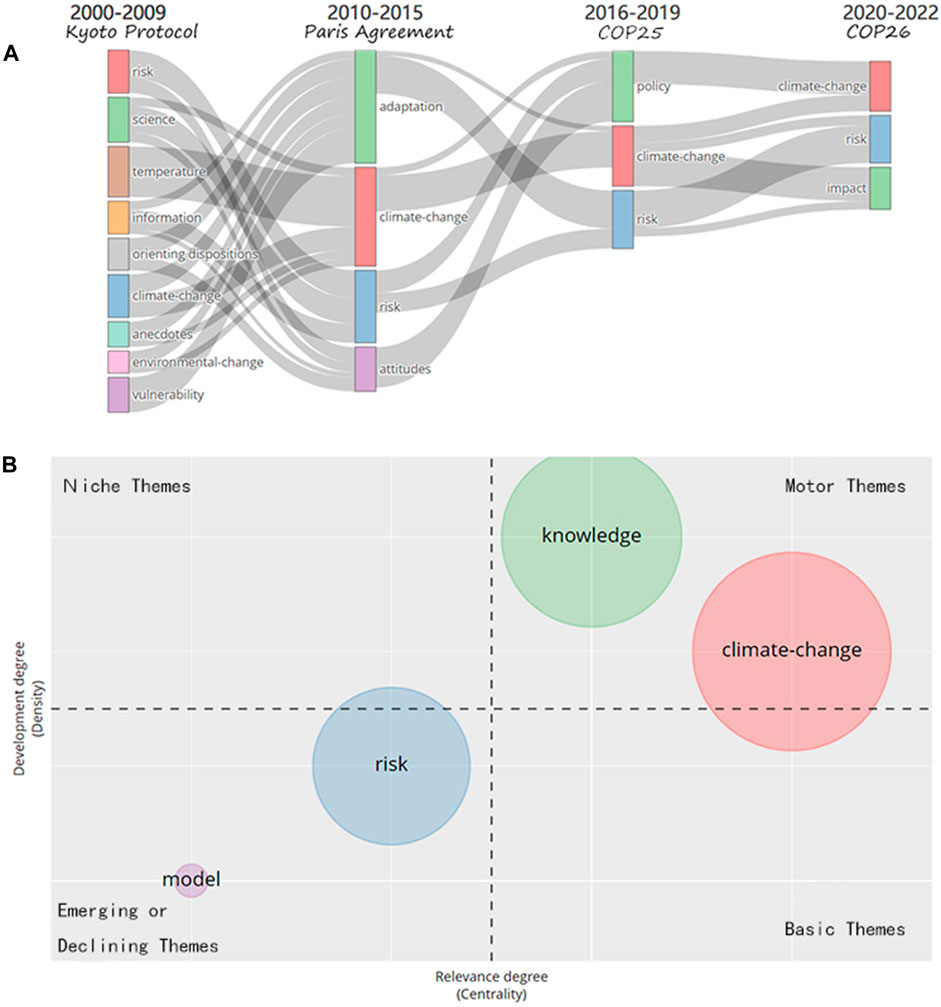
FIGURE 4. The change in the themes at different times during the period 2000-2022 (A); status and development trend of different themes during the period 2016-2022 (B).
3.5.1 Change of the themes
In Figure 4A, we can find the change in the themes at different times, the influence of different events, and the future development trends. With the implementation of the Kyoto Protocol during the period 2000-2009, countries began to perceive climate change and gradually recognize the risks it poses. Therefore, during this period, the main themes were risk, science, temperature and information. In addition, the basic themes are science and climate change. After 2009, the themes were changed, when 129 countries discussed follow-up plans after the expiration of phase I commitments of the Kyoto Protocol. Between 2010 and 2015, they became adaptation, change and climate change, and it was determined that the motor theme was adaptation. The active participation of countries led to the signing of the Paris Agreement, which will cause a change in research direction. Moreover, countries' awareness of climate change risk perception is deepening. Therefore, COP25 was held in Madrid in 2019, and COP26 was held in Glasgow in 2021. The global perception of climate change is becoming stronger.
In fact, the keywords that shift from one period to another are also relevant. The shift from 9 keywords in the 2000-2009 period of research to 4 keywords in the 2010-2015 period of research indicates that scientists' research on climate change risk perception tends to be rational and targeted. The shift from temperature and environmental change in the first period (2000-2009) to climate change in the second period (200-2015) shows that scientists' research on climate change is gradually becoming systematic. From "adoption" in the second period and "policy" in the third period, we can see that people are increasingly trying to find solutions to the problems caused by climate change. In the fourth period (2020-2022), "impact" becomes one of the key words, indicating that scientists are looking for the far-reaching effects of climate change.
3.5.2 Trend of different themes during the period 2016-2022
Figure 4B depicts the status and development trend of different themes during the period 2016-2022. The main themes turned into policy, climate change and risk during 2015-2019 (Figure 4B). Meanwhile, the basic theme is risk, and the niche theme is policy. The motor theme is knowledge, and the declining theme is the model. More importantly, from this figure, we can see that the themes of “climat-change” and “risk” are becoming increasingly important. After this period, countries actively cooperated and took action to deal with climate change.
3.6 Active authors, countries and institutions
A total of 13333 authors were involved in the study of climate change risk perception. Table 3 illustrates the top 10 authors in the number of papers, total citations and h-index. In this topic, Leiserowitz A (School of the Environment Yale University) published the largest number of 32 papers, followed by Pidgeon N (28) and Siegrist M (26). Adger Wn has the highest total citations (5621), followed by Lorenzoni I (4317) and Leiserowitz A (3190). Meanwhile, Leiserowitz A has the highest h-index. Therefore, Leiserowitz A made a great contribution to this topic.
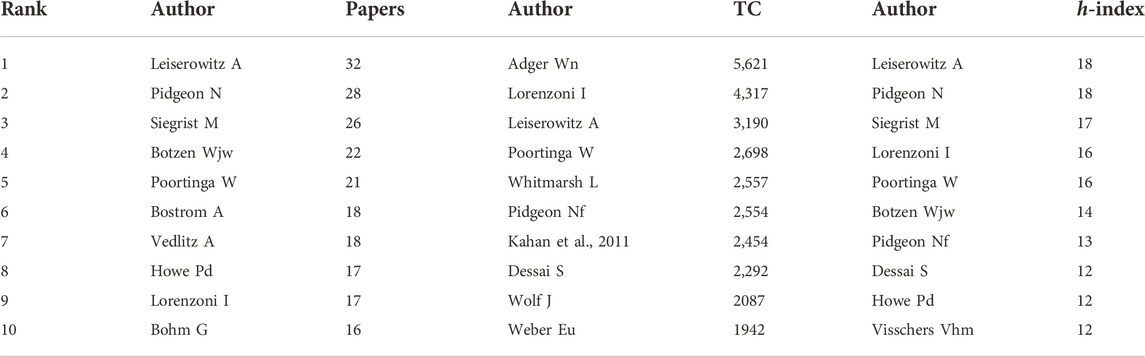
TABLE 3. The top 10 authors regarding the number of papers, total citations and h-index.
All of the papers were from 145 countries, among which the United States published the highest number of 1438 papers, accounting for 32.47%, followed by the United Kingdom (602 papers, 13.59%), Australia (493 papers, 11.13%), China (389 papers, 8.78%) and Germany (387 papers, 8.74%). Figure 5A shows the number of papers and collaborations among the 30 most productive countries. The table of the data of the top 5 countries is in the upper right corner. The size of the node in the figure indicates the number of papers. The larger the node is, the more papers there are (Li et al., 2019). Moreover, the thickness of the line between two points indicates the degree of contact between the two countries. It is obvious that China has the closest cooperative relationship with the United States and Australia. The color of the node in the figure from dark to light indicates the time sequence when the country began to study. We can see that the United States began research earlier, while China began research in recent years. This may be because the Obama administration (beginning in 2009) has established the action policy of building a green economy and developing new energy and explored new economic growth models to achieve America’s economic recovery. However, starting from the construction of “The Belt and Road” (since 2015), China began to clearly implement the new concept of global governance, which is to build a community of human destiny to achieve win‒win cooperation and common development.
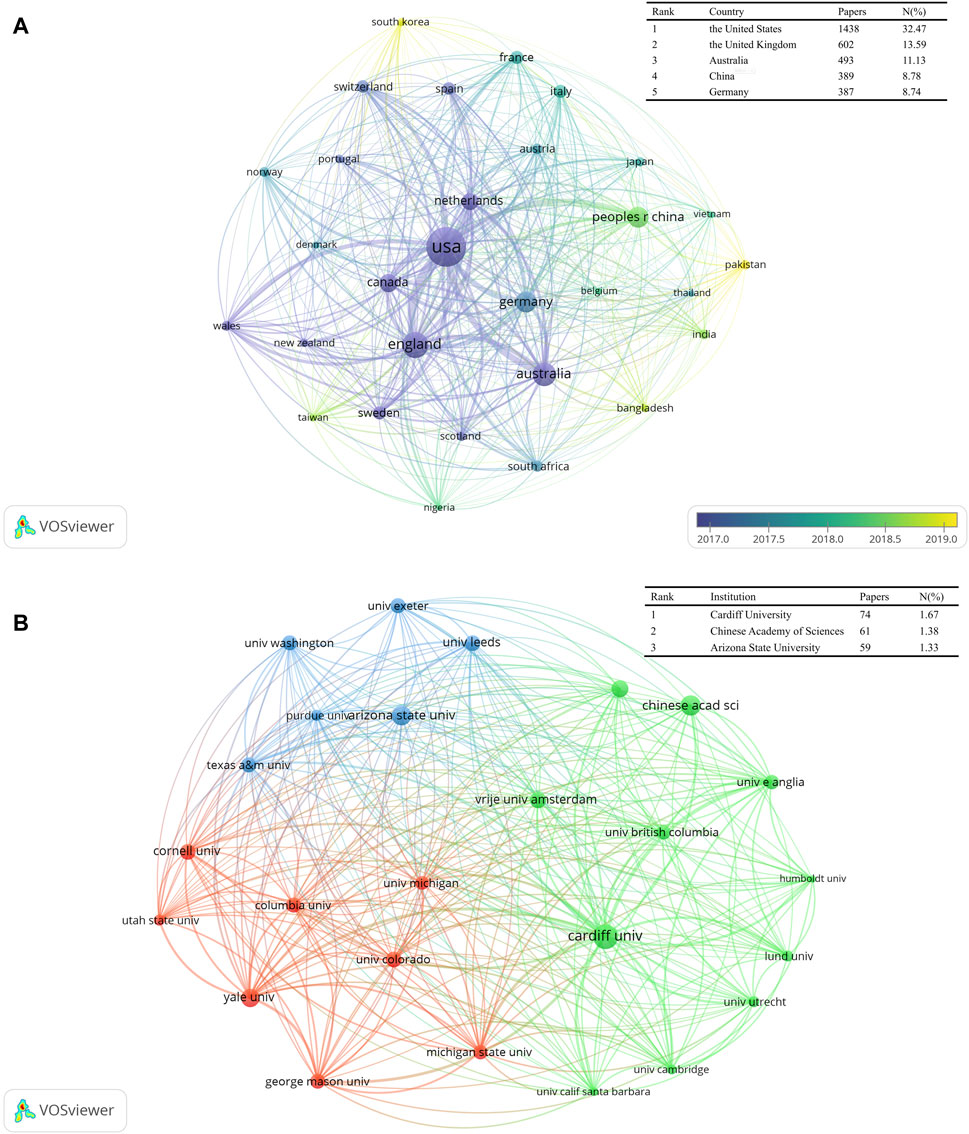
FIGURE 5. The Network map of (A) the top 30 productive countries (top 30 countries with more than 45 documents) and (B) the top 25 institutions for research on climate change risk perception (top 25 institutions with more than 950 cited references).
Network maps can provide information about influential research institutions and potential collaborators and can help researchers establish collaborations (Shi et al., 2020). A total of 4063 institutions worldwide contribute to research on climate change risk perception. Figure 5B shows the top 25 institutions with the most contributions; in addition, the table about the information of the top 3 institutions is in the upper right corner. Cardiff University is ranked first, contributing 74 papers, accounting for 1.67%. Then, the Chinese Academy of Sciences published 61 papers (1.38%), followed by Arizona State University (59 papers, 1.33%). The graph also shows frequent exchanges between Cardiff University, Yale University, Chinese Academy of Sciences, the University of Queensland and Michigan State University.
3.7 Keyword analysis
3.7.1 Hotspots of keywords
The frequency analysis of keywords is key to investigating hot topics and developments associated with a given field (Wang, 2018). We use author keywords and keywords plus to explore hot issues and identify the research trends in this topic. Author keywords can provide important information about the core content and research trends (Ma and Zhang, 2020), while keywords plus are generated by an ISI algorithm from words or expressions of the article’s reference titles (Huang et al., 2022). Except for the search terms in this study, the two most commonly used author keywords and keywords plus are all "adaptation" and "vulnerability" (Table 4). Meanwhile, “climate change adaptation” and “resilience” are also common keywords, and “management” and “policy” are common keywords plus. Figure 6A shows the density visualization (a function of VOSviewer) based on the keywords plus and the intensity of hot spots with the color spectrum, with warm red colors representing hot areas and cool blue colors representing cool areas (Zhang et al., 2020). In addition, the distance between them means the extent of their relationship, such as “climate-change”, “risk” and “policy”, are closer than other words.
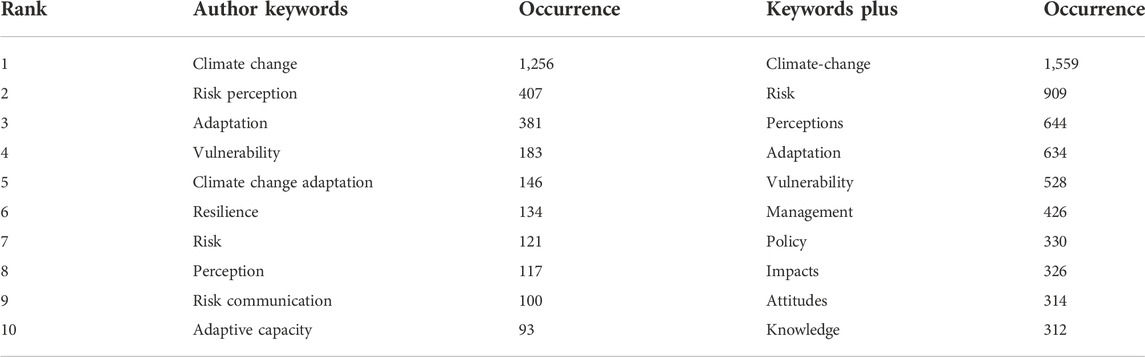
TABLE 4. The Top 10 frequencies of author keywords and keywords used during 2000–2022.
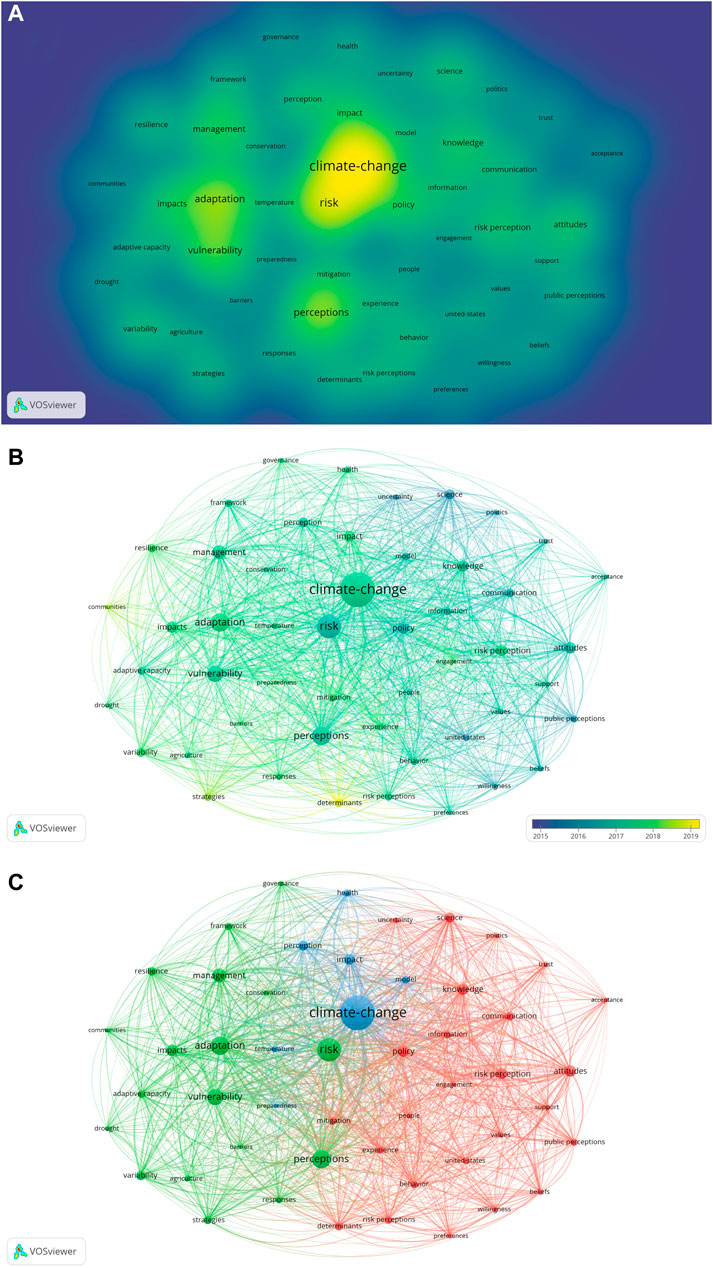
FIGURE 6. The Density (A), overlay (B) and network (C) visualization map of keywords plus.
3.7.2 Co-occurrence keyword analysis
Figure 6B is an overlay visualization map illustrating the keywords plus from 2015 to 2019. The yellower the color of the node in the figure is, the newer the keywords. The keywords in the blue region almost appeared before 2015. Obviously, most keywords have appeared in the past five years. This may reflect that climate change risk perception is a new field. In addition, Figure 6C shows network visualization, which consists of different nodes and wires. All these keywords are divided into 3 clusters, and the size of the node in the figure indicates the frequency of the keywords. The color of the nodes represents the cluster to which it belongs, and different clusters are represented by different colors. The red cluster focuses on policy, people and information about risk perception. The keywords with the highest frequency in the blue cluster are health and climate change. The green one concerns the influence of climate change risk perception in different fields: adaptation, strategy, vulnerability, management and agriculture.
4 Discussion
By summarizing the collected literature with a high number of citations in recent years and analyzing Figure 6C, we discuss the following topics. They largely reflect the hot spots of research in recent years and future trends.
4.1 Determinants of risk perception
The determinants affecting climate change risk perception are an important research topic (Figure 6C red cluster). At present, the relationship between education level and climate change risk perception has been basically confirmed (Lee et al., 2015). Research shows that the higher the level of education is, the sharper the risk perception of climate change. We argue that this is because higher educators have a better understanding of the phenomenon and connotations of climate change, and they are more likely to worry about the world. Moreover, experience is also an important factor affecting climate change risk perception. Usually, the elderly have more experience (Rufat and Botzen, 2022), especially compared the current climate with the climate of their youth, since they experience climate change longer than young people. At the same time, we found that beliefs and values also play an important role in perception ("beliefs” and “values” are all the keywords in the red cluster). Different beliefs pay different attention to climate, which leads to differences in perception. Some religions encourage believers to raise awareness of climate change and participate in environmental protection (Hornsey et al., 2016).
4.2 Human behavior
On the other hand, we can see that the red cluster also contains another core view of "behavior" (Figure 6C red cluster). First, human behavior is the main cause of global climate change (Ayal et al., 2021). At the same time, behavior is also bidirectional, which means that climate change will affect people's behavior. Because of the drastic change in climate, people choose adaptive behavior and support for government policies to reduce personal losses (Xue et al., 2021). Research has shown that adaptation is essential to reduce or avoid the negative effects of climate change (Valkengoed and Steg, 2019). The majority of people actively or passively take actions conducive to the environment. At present, the government's intervention policies are mainly divided into monetary intervention and nonmonetary intervention. Monetary intervention is often more able to motivate the public and achieve better results (Khanna et al., 2021). People preferably take action when they return from the government. However, when people take environmentally friendly actions for the first time, they are more likely to continue. In the future, we should continue to study what kind of intervention can improve people's enthusiasm to take action to protect the environment.
4.3 Human mental health risk
Climate change will not only have an influence on human behavior but also have an important impact on public health, especially on mental health (Figure 6C blue cluster). Climate change can affect mental health through a variety of risk pathways (Cunsolo and Ellis, 2018), including the extinction of wild animals and the deterioration of the surrounding environmental landscape. People's emotions are largely related to their environment. However, clinical medicine has not revealed the specific relationship between climate change and mental health (Brown et al., 2021). Grief is a normal response to the deterioration of the environment, and this psychology will become more common with the aggravation of climate change, ultimately affecting the overall mental health of the public. In addition, this emotion may encourage them to take measures to protect the environment. While climate change will affect all people, some groups bear greater risks than others (Manning and Clayton, 2018). Generally, this emotion, grief, increases with the improvement of perception level. At the same time, women and children are easily affected, perhaps because of their relative psychological vulnerability. Researchers should further explore the specific relationship between climate change and mental health and strengthen counseling for the mental health of vulnerable people.
4.4 Impact on Agriculture
Climate change has an impact on almost all human production and life, especially on agricultural production (keyword “agriculture” in Figure 6C green cluster). Climate change has been shown to increase temperature and reduce precipitation, resulting in lower soil water content, which in turn affects agricultural production (Grusson et al., 2021). In fact, the agricultural production system is very fragile, and climate change will hinder the development of agriculture. Because they themselves heavily rely on the climate, it is difficult to make self-regulation in the short term. Therefore, farmers are required to actively adopt adaptive plans to adjust agricultural production. A study in Sri Lanka shows that farmers' adaptation measures can increase rice production (Suresh et al., 2021). However, farmers generally have limited capacity and are especially unable to cope with extreme weather and long-term climate risks caused by climate change. Relevant researchers should search for appropriate and targeted adaptive measures, guiding agricultural producers to implement.
4.5 Adaptive strategy
The continuous change in climate led to the attention of adaptive strategies (Figure 6C green cluster). However, based on existing traditional concepts, most people only accept adaptation strategies similar to the current situation (Tam and McDaniels, 2013). Nevertheless, these strategies often do not play a substantive role, and the adaptive effect is very small. This is closely related to people's conservative ideas. Some people even sacrifice their livelihood to maintain their original way of life. For example, some shrimp fishermen in Bangladesh tend to maintain their customs, resulting in a decline in production, which has also had a great impact on the development of the country. Therefore, governments should introduce adaptive policies. At the same time, natural and social scientists also need to contact and work with decision makers (Seddon et al., 2020). Moreover, in Figure 6B, we found that the word "adaptation" has only been studied in the last five years, which is also the key content of the Paris Agreement, signed in 2015 and implemented in 2016. Obviously, the signing of the Paris Agreement has promoted the emergence and development of adaptive policies. We suggest that climate change research should be guided by the international situation in the future.
4.6 Summary of discussion
This paper also reveals some characteristics and directions of current climate change risk perception. At present, research in this direction is relatively sufficient, but there are still some deficiencies. In the future, we should strengthen the research in the following aspects. First, it is important to explore the determinants that affect the public's risk perception of climate change. We should continue to reveal them, which will help to purposefully improve the perception level of the public. Then, governments should increase investment in research and intervention policies to encourage people to carry out adaptive behavior. Moreover, the research proves that climate change will lead to mental health diseases, but it does not reveal the specific relationship between them. Psychologists and environmentalists should cooperate in this research. On the other hand, climate change also causes an imbalance in the agricultural system. Farmers use adaptive methods, which is an effective way to solve the problem, but farmers' capability is limited, and they need further guidance from researchers. In addition, we find that moderate adaptation policies have little effect. Finally, the analysis shows that more cooperation between different research institutions is needed to maximize success (Chen et al., 2022).
Conclusion
The great impact of climate change on human society and global ecosystems has attracted the attention of the whole world. Although the importance of climate change is obvious, climate change risk perception still needs further research. This paper conducts a bibliometric analysis of the global research overview of climate change risk perception and provides relevant information, including countries, institutions, journals, articles, authors, hot topics and research trends. From 2000 to 2022, the publication of relevant articles gradually increased with increasingly serious climate change. Among them, articles published by the United States, the United Kingdom and Australia account for 57.19%. Cardiff University, the Chinese Academy of Sciences and Arizona State University are the top productivity institutions. Climatic Change and Global Environmental Change-Human and Policy Dimensions are the most productive and influential journals, respectively. Keywords co-occurrence analysis reveals three key research topics: policy of risk perception, health and adaptation strategy. Determinations and strategies are recent research directions. At the same time, it reveals that the current climate change research has been interdisciplinary research involving the environment, politics, medicine, agriculture and other disciplines.
Data availability statement
The original contributions presented in the study are included in the article/supplementary material, further inquiries can be directed to the corresponding author/s.
Author contributions
JF: Methodology, Formal analysis, and Writing—Original Draft; GL: Conceptualization, Resources, Writing—Review & Editing and Funding acquisition; ZX: Methodology and Writing—Review & Editing; SC: Methodology and Writing—Review & Editing.
Funding
This work was supported by the International Cooperation and Exchange of the National Key Research and Development Program of China (2021YFC3201204).
Conflict of interest
The authors declare that the research was conducted in the absence of any commercial or financial relationships that could be construed as a potential conflict of interest.
Publisher’s note
All claims expressed in this article are solely those of the authors and do not necessarily represent those of their affiliated organizations, or those of the publisher, the editors and the reviewers. Any product that may be evaluated in this article, or claim that may be made by its manufacturer, is not guaranteed or endorsed by the publisher.
References
Adger, W. N., Dessai, S., Goulden, M., Hulme, M., Lorenzoni, I., Nelson, D. R., et al. (2009). Are there social limits to adaptation to climate change? Clim. Change 93 (3), 335–354. doi:10.1007/s10584-008-9520-z
Adger, W. N. (2006). Vulnerability. Glob. Environ. Change 16 (3), 268–281. doi:10.1016/j.gloenvcha.2006.02.006
Aria, M., and Cuccurullo, C. (2017). bibliometrix: An R-tool for comprehensive science mapping analysis. J. Informetr. 11, 959–975. doi:10.1016/j.joi.2017.08.007
Aria, M., Misuraca, M., and Spano, M. (2020). Mapping the evolution of social research and data science on 30 Years of social indicators research. Soc. Indic. Res. 149 (3), 803–831. doi:10.1007/s11205-020-02281-3
Armah, F. A., Yengoh, G. T., Ung, M., Luginaah, I., Chuenpagdee, R., and Campbell, G. (2017). The unusual suspects? Perception of underlying causes of anthropogenic climate change in coastal communities in Cambodia and Tanzania. J. Environ. Plan. Manag. 60, 2150–2173. doi:10.1080/09640568.2017.1281797
Ayal, D. Y., Tilahun, K., Ture, K., and Terefe Zeleke, T. (2021). Psychological dimensions of climate change: Perceptions, collective efficacy, and responses in berehet district, north shoa, Ethiopia. Clim. Change 165 (1–2), 32. doi:10.1007/s10584-021-03033-z
Becerra, M. J., Pimentel, M. A., De Souza, E. B., and Tovar, G. I. (2020). Geospatiality of climate change perceptions on coastal regions: A systematic bibliometric analysis. Geogr. Sustain. 1 (3), 209–219. doi:10.1016/j.geosus.2020.09.002
Bradley, G. L., Babutsidze, Z., Chai, A., and Reser, J. P. (2020). The role of climate change risk perception, response efficacy, and psychological adaptation in pro-environmental behavior: A two nation study. J. Environ. Psychol. 68, 101410. doi:10.1016/j.jenvp.2020.101410
Brechin, S. R., and Bhandari, M. P. (2011). Perceptions of climate change worldwide. Wiley Interdiscip. Rev. Clim. Change 2, 871–885. doi:10.1002/wcc.146
Brown, M. J., White, B. P., and Nicholas, P. K. (2021). Mental health impacts of climate change: Considerations for nurse practitioners. J. Nurse Pract. 18, 359–363. doi:10.1016/j.nurpra.2021.07.013
Brulle, R. J., Carmichael, J., and Jenkins, J. C. (2012). Shifting public opinion on climate change: An empirical assessment of factors influencing concern over climate change in the U.S., 2002–2010. Clim. Change 114, 169–188. doi:10.1007/s10584-012-0403-y
Callaghan, M. W., Minx, J. C., and Forster, P. M. (2020). A topography of climate change research. Nat. Clim. Chang. 10, 118–123. doi:10.1038/s41558-019-0684-5
Chen, Y., Lin, M., and Zhuang, D. (2022). Wastewater treatment and emerging contaminants: Bibliometric analysis. Chemosphere 297, 133932. doi:10.1016/j.chemosphere.2022.133932
Cunsolo, A., and Ellis, N. R. (2018). Ecological grief as a mental health response to climate change-related loss. Nat. Clim. Chang. 8, 275–281. doi:10.1038/s41558-018-0092-2
Dryhurst, S., Schneider, C. R., Kerr, J., Freeman, A. L. J., Recchia, G., van der Bles, A. M., et al. (2020). Risk perceptions of COVID-19 around the world. J. Risk Res. 23 (7–8), 994–1006. doi:10.1080/13669877.2020.1758193
Estrada, A., Garber, P. A., Rylands, A. B., Roos, C., Fernandez-Duque, E., Di Fiore, A., et al. (2017). Impending extinction crisis of the world’s primates: Why primates matter. Sci Adv. 3 (1), e1600946. Published January 18, 2017. doi:10.1126/sciadv.1600946
Fei, S., Desprez, J. M., Potter, K. M., Jo, I., Knott, J. A., and Oswalt, C. M. (2017). Divergence of species responses to climate change. Sci. Adv. 3, e1603055. doi:10.1126/sciadv.1603055
Funatsu, B. M. (2019). Perceptions of climate and climate change by Amazonian communities. Glob. Environ. Change 57, 101923. doi:10.1016/j.gloenvcha.2019.05.007
Gatto, M., Bertuzzo, E., Mari, L., Miccoli, S., Carraro, L., Casagrandi, R., et al. (2020). Spread and dynamics of the COVID-19 epidemic in Italy: Effects of emergency containment measures. Proc. Natl. Acad. Sci. U. S. A. 117 (19), 10484–10491. doi:10.1073/pnas.2004978117
Gifford, R. (2011). The dragons of inaction: psychological barriers that limit climate change mitigation and adaptation. Am. Psychol. 66 (4), 290–302.
Grothmann, T., and Patt, A. (2005). Adaptive capacity and human cognition: The process of individual adaptation to climate change. Glob. Environ. Change-Human and Pol. Dimensions 15, 199–213.
Grusson, Y., Wesström, I., and Joel, A. (2021). Impact of climate change on Swedish agriculture: Growing season rain deficit and irrigation need. Agric. Water Manag. 251, 106858. doi:10.1016/j.agwat.2021.106858
Hornsey, M. J., Harris, E. A., Bain, P. G., and Fielding, K. S. (2016). Meta-analyses of the determinants and outcomes of belief in climate change. Nat. Clim. Chang. 6 (6), 622–626. doi:10.1038/nclimate2943
Howe, P. D., Mildenberger, M., Marlon, J. R., and Leiserowitz, A. (2015). Geographic variation in opinions on climate change at state and local scales in the USA. Nat. Clim. Chang. 5 (6), 596–603. doi:10.1038/nclimate2583
Huang, L., Xia, Z., and Cao, Y. (2022). A bibliometric analysis of global fine roots research in forest ecosystems during 1992–2020. Forests 13 (1), 93–16. doi:10.3390/f13010093
Kahan, D., Jenkins-Smith, H. C., and Braman, D. (2011). Cultural cognition of scientific consensus. J. Risk Res. 14, 147–174.
Khanna, T. M., Baiocchi, G., Callaghan, M., Creutzig, F., Guias, H., Haddaway, N. R., et al. (2021). A multi-country meta-analysis on the role of behavioural change in reducing energy consumption and CO2 emissions in residential buildings. Nat. Energy 6 (9), 925–932. doi:10.1038/s41560-021-00866-x
Lee, I. (2017). Big data: Dimensions, evolution, impacts, and challenges. Bus. Horizons 60, 293–303. doi:10.1016/j.bushor.2017.01.004
Lee, T. M., Markowitz, E. M., Howe, P. D., Ko, C. Y., and Leiserowitz, A. A. (2015). Predictors of public climate change awareness and risk perception around the world. Nat. Clim. Chang. 5 (11), 1014–1020. doi:10.1038/nclimate2728
Leiserowitz, A. (2005). American risk perceptions: Is climate change dangerous? Risk Anal. 25, 1433–1442. doi:10.1111/j.1540-6261.2005.00690.x
Leiserowitz, A. (2006). Climate change risk perception and policy preferences: The role of affect, imagery, and values. Clim. Change 77 (1), 45–72. doi:10.1007/s10584-006-9059-9
Li, C., Wu, K., and Wu, J. (2017). A bibliometric analysis of research on haze during 2000–2016. Environ. Sci. Pollut. Res. 24, 24733–24742. doi:10.1007/s11356-017-0440-1
Li, H. (2019). An analysis of research hotspots and modeling techniques on carbon capture and storage. Sci. Total Environ. 687, 687–701. doi:10.1016/j.scitotenv.2019.06.013
Lorenzoni, I., and Pidgeon, N. F. (2006). Public views on climate change: European and USA perspectives. Clim. Change 77, 73–95.
Lorenzoni, I., Nicholson-Cole, S. A., and Whitmarsh, L. (2007). Barriers perceived to engaging with climate change among the UK public and their policy implications. Glob. Environ. Change-Human and Pol. Dimensions 17, 445–459.
Ma, Q., and Zhang, Y. (2020). Global research trends and hotspots on submarine groundwater discharge (sgd): A bibliometric analysis. Int. J. Environ. Res. Public Health 17, 830. doi:10.3390/ijerph17030830
Madeira, C., Mendonca, V., Leal, M. C., Flores, A. A., Cabral, H. N., Diniz, M. S., et al. (2018). Environmental health assessment of warming coastal ecosystems in the tropics - application of integrative physiological indices. Sci. Total Environ. 643, 28–39. doi:10.1016/j.scitotenv.2018.06.152
Manning, C., and Clayton, S. (2018). “9 - threats to mental health and wellbeing associated with climate change,” in Psychology and climate change. Editors S. Clayton, and C. Manning (New York: Academic Press), 217–244. doi:10.1016/B978-0-12-813130-5.00009-6
Mongeon, P., and Paul-Hus, A. (2015). The journal coverage of Web of science and scopus: A comparative analysis. Scientometrics 106, 213–228. doi:10.1007/s11192-015-1765-5
Nadelhoffer, K. J., and Raich, J. W. (1992). Fine root production estimates and belowground carbon allocation in forest ecosystems. Ecology 73, 1139–1147. doi:10.2307/1940664
Nunez Mir, G. C., Iannone, B. V., Pijanowski, B. C., Kong, N., and Fei, S. (2016). Automated content analysis: Addressing the big literature challenge in ecology and evolution. Methods Ecol. Evol. 7, 1262–1272. doi:10.1111/2041-210x.12602
Parry, M. L., Rosenzweig, C., Iglesias, A., Livermore, M., and Fischer, G. (2004). Effects of climate change on global food production under SRES emissions and socio-economic scenarios. Glob. Environ. Change 14 (1), 53–67. doi:10.1016/j.gloenvcha.2003.10.008
Parvin, G. A., and Ahsan, M. S. (2013). Impacts of climate change on food security of rural poor women in Bangladesh. Manag. Environ. Qual. Int. J. 24, 802–814. doi:10.1108/meq-04-2013-0033
Rana, I. A. (2020). Disaster and climate change resilience: A bibliometric analysis. Int. J. Disaster Risk Reduct. 50, 101839. doi:10.1016/j.ijdrr.2020.101839
Rufat, S., and Botzen, W. J. W. (2022). Drivers and dimensions of flood risk perceptions: Revealing an implicit selection bias and lessons for communication policies. Glob. Environ. Change 73, 102465. doi:10.1016/j.gloenvcha.2022.102465
Seddon, N. (2020). Understanding the value and limits of nature-based solutions to climate change and other global challenges. Philosophical Trans. R. Soc. B Biol. Sci. 375, 1794. doi:10.1098/rstb.2019.0120
Shi, J., Shi, S., Shi, S., Jia, Q., Yuan, G., Chu, Y., et al. (2020). Bibliometric analysis of potassium channel research. Channels 14 (1), 18–27. doi:10.1080/19336950.2019.1705055
Slovic, P. (2020). Risk perception and risk analysis in a hyperpartisan and virtuously violent world. Risk Anal. 40, 2231–2239. doi:10.1111/risa.13606
Spence, A., Poortinga, W., Butler, C., and Pidgeon, N. F. (2011). Perceptions of climate change and willingness to save energy related to flood experience. Nat. Clim. Chang. 1 (1), 46–49. doi:10.1038/nclimate1059
Suresh, K. (2021). An economic analysis of agricultural adaptation to climate change impacts in Sri Lanka: An endogenous switching regression analysis. Land Use Policy 109, 105601. doi:10.1016/j.landusepol.2021.105601
Tam, J., and McDaniels, T. L. (2013). Understanding individual risk perceptions and preferences for climate change adaptations in biological conservation. Environ. Sci. Policy 27, 114–123. doi:10.1016/j.envsci.2012.12.004
Tamala, J. K., Maramag, E. I., Simeon, K. A., and Ignacio, J. J. (2022). A bibliometric analysis of sustainable oil and gas production research using VOSviewer. Clean. Eng. Technol. 7, 100437. doi:10.1016/j.clet.2022.100437
United Nations (2015). “‘Adoption of the Paris agreement, proposal by the president, Draft decision’,” in Conference of the parties (FCCC), 32. Available at: http://unfccc.int/resource/docs/2015/cop21/eng/l09r01.pdf.
Valkengoed, A. M. V., and Steg, L. (2019). Meta-analyses of factors motivating climate change adaptation behaviour. Nat. Clim. Chang. 9, 158–163. doi:10.1038/s41558-018-0371-y
van Eck, N. J., and Waltman, L. (2010). Software survey: VOSviewer, a computer program for bibliometric mapping. Scientometrics 84 (2), 523–538. doi:10.1007/s11192-009-0146-3
Wang, B. (2018). Role of renewable energy in Chins energy security and climate change mitigation: An index decomposition analysis. Renew. Sustain. Energy Rev. 90, 187–194. doi:10.1016/j.rser.2018.03.012
Wang, Z., Zhao, Y., and Wang, B. (2018). A bibliometric analysis of climate change adaptation based on massive research literature data. J. Clean. Prod. 199, 1072–1082. doi:10.1016/j.jclepro.2018.06.183
Whitmarsh, L. (2008). Are flood victims more concerned about climate change than other people? The role of direct experience in risk perception and behavioural response. J. Risk Res. 11, 351–374.
Weber, E. U. (2006). Experience-based and description-based perceptions of long-term risk: Why global warming does not scare us (yet). Clim. Change 77 (1), 103–120. doi:10.1007/s10584-006-9060-3
World Meteorological Organization (2019). The global climate in 2015 - 2019. Centre Res. Epidemiol. Disasters Natl. Inst. Space Res. 1179, 32. Available at: https://library.wmo.int/doc_num.php?explnum_id=10251.
Wu, F., Geng, Y., Tian, X., Zhong, S., Wu, W., Yu, S., et al. (2018). Responding climate change: A bibliometric review on urban environmental governance. J. Clean. Prod. 204, 344–354. doi:10.1016/j.jclepro.2018.09.067
Xue, M., Zhao, Y., Wang, Z., and Zhang, B. (2021). Behavioural determinants of an individual’s intention to adapt to climate change: Both internal and external perspectives. Environ. Impact Assess. Rev. 91, 106672. doi:10.1016/j.eiar.2021.106672
Yang, L. E., Chan, F. K. S., and Scheffran, J. (2018). Climate change, water management and stakeholder analysis in the Dongjiang River basin in South China. Int. J. Water Resour. Dev. 34, 166–191. doi:10.1080/07900627.2016.1264294
Zhang, Y., Pu, S., Lv, X., Gao, Y., and Ge, L. (2020). Global trends and prospects in microplastics research: A bibliometric analysis. J. Hazard. Mater. 400, 123110. doi:10.1016/j.jhazmat.2020.123110
Keywords: Climate Change, Risk Perception, Bibliometric, impact, adaptive strategy
Citation: Fan J, Liu G, Xia Z and Cai S (2022) A bibliometric analysis of climate change risk perception: Hot spots, trends and improvements. Front. Environ. Sci. 10:917469. doi: 10.3389/fenvs.2022.917469
Received: 11 April 2022; Accepted: 04 November 2022;
Published: 22 November 2022.
Edited by:
Qiang Zhang, Beijing Normal University, ChinaReviewed by:
Andrea L. Pierce, University of Delaware, United StatesMohamad N. Azra, Institute of Marine Biotechnology, Universiti Malaysia Terengganu, Malaysia
Copyright © 2022 Fan, Liu, Xia and Cai. This is an open-access article distributed under the terms of the Creative Commons Attribution License (CC BY). The use, distribution or reproduction in other forums is permitted, provided the original author(s) and the copyright owner(s) are credited and that the original publication in this journal is cited, in accordance with accepted academic practice. No use, distribution or reproduction is permitted which does not comply with these terms.
*Correspondence: Gang Liu, bGdsaG1AdGp1LmVkdS5jbg==