 Xikang Hou1,2†
 Wei Gao3†Meng Zhang4Rui Xia1,2*Yuan Zhang3*Kai Zhang1,2Xiao Wang1,2Kai Yang1,2Xiaofei Chen1,2Yu Deng1,2
- 1State Environmental Protection Key Laboratory of Environmental Criteria and Risk Assessment, Chinese Research Academy of Environmental Sciences, Beijing, China
- 2State Environmental Protection Key Laboratory of Simulation and Control of Groundwater Pollution, Chinese Research Academy of Environmental Sciences, Beijing, China
- 3Guangdong Provincial Key Laboratory of Water Quality Improvement and Ecological Restoration for Watersheds, School of Ecology, Environment and Resources, Guangdong University of Technology, Guangzhou, China
- 4Jiangxi Academy of Environmental Sciences, Nanchang, China
Source apportionment of surface water is essential for effective pollution control and sustainable water management. Physical mechanism models usually need so much data and parameters for calibration that their application for complex hydrologic condition watershed becomes difficult. However, reverse source tracing methods only based on water quality parameters present a certain subjectivity and uncertainty. In this research, additional land-use parameters were applied as an auxiliary in principal component analysis (PCA) for accurate identification of pollution sources. Thirteen water quality parameters and two meteorology parameters were used in the PCA and absolute principal component score–multiple linear regression (APCS–MLR) model to quantitatively identify potential pollution sources and their contributions to surface water pollution of the Poyang Lake Basin, in which frequent flow and sediment flux exchange with Yangtze River make the river–lake relationship complex. The results showed that urban wastewater with 34% contribution and agricultural non-point sources with 16% contribution, were the major sources of pollution in water quality. TP and NH3–N, the most serious pollutants, causing agricultural non-point source pollutions with 40% contributions and urban wastewater with 21% contributions were the major sources in the Poyang Lake Basin. Urban wastewater with 60% contributions was the major source of organic contamination. It can be concluded that with associated land-use parameters, the GIS approach with the APCS–MLR model can improve the accuracy and certainty of source apportionment, providing aid decision information for managers on protection of surface water quality.
1 Introduction
Due to rapid growth of world’s economies and the expansion of industrial and agricultural production, surface water pollution has been a serious problem to human health and economic development in many countries, such as Nigeria (Ighalo et al., 2021), central Poland (Zieliński et al., 2016), United Kingdom (Hutchins et al., 2018), and China (Ma et al., 2020a; Huang et al., 2021). Contaminants in surface water come from a lot of pathways, including the discharge of municipal and industrial wastewater, the excessive usage of fertilizers, the mining activities, and the natural factors (Yu et al., 2019; Ma et al., 2020b). To analyze the potential pollution sources of the surface water contaminants and identify their relationship, it is necessary to formulate treatment measures for government administration. The Poyang Lake Basin is one of the most important agricultural and economic regions in China. However, due to human activities in recent years, the overall water quality is threatened by elevated contaminant concentrations (Gao et al., 2016; Wu et al., 2017; Han et al., 2020; Li et al., 2020b). The pollution source of the Poyang Lake Basin is quite complex due to rapidly changing hydrology regime, as well as frequent flow and sediment flux exchange with the Yangtze River (Wang and Liang, 2015; Yang et al., 2016).
The analytical methods of source apportionment are divided into forward and reverse source tracing. The forward methods mainly include the coefficient method and mechanistic model method. The coefficient approach has been widely used to estimate non-point source pollution load, describing a comprehensive effect of generation processes via surface runoff (Hou et al., 2018). However, it is difficult to determine pollutants’ attenuation rate of the generation processes due to its large spatial–temporal heterogeneity in land characteristics, weather, human activity, and so on (Strickling and Obenour, 2018; Westphal et al., 2019; Wang et al., 2020). Although the relevant processes of pollutant generation and transport in terrestrial–riverine systems can be simulated, physical mechanism models usually need so much data and parameters for calibration that their application for complex hydrologic condition watersheds becomes difficult (Lu et al., 2013). However, reverse source tracing methods do not need detailed discharge information of pollution sources or track the migration of pollutants, such as the UNMIX model, positive definite matrix factorization model, isotope model, absolute principal component score-multiple linear regression (APCS–MLR), and so on. Due to good performance, the APCS–MLR model has been widely used in traceability studies of various pollutants in surface water (Zhou et al., 2007; Su et al., 2011; Liu et al., 2020).
Accurate identification of pollution sources in principal component analysis (PCA) is essential for quantitative assessment of the percentage contributions to surface water in APCS–MLR. Analysis of pollution sources with PCA just based on hydrochemistry indicators may lead to large uncertainty and subjectivity due to the commonality of pollutants from various sources (Jiang and Guo, 2019; Li J. et al., 2020). In consequence, the results of PCA were turned out to show large deviations, particularly when multiple source profiles are similar for collinearity (Salim et al., 2019; Zhang et al., 2020a; Zhang et al., 2020b; Zhang et al., 2022). The associated GIS approach, land use, and socioeconomic parameters with PCA analysis were advised to reduce the uncertainty, one-sidedness, and subjectivity of pollution source identification, so that more accurate conclusions can be acquired (Zhang et al., 2015; Shen et al., 2021). Lockhart et al. (2013) found a significant spatial correlation between groundwater nitrate contamination and land uses. Mirhosseini et al. (2018) concluded that three land-use types including rangeland, irrigated, and urban area significantly affect the water quality of Zanjanroud Watershed in northwestern Iran. According to Liu et al. (2021), one-to-one relations of R-squared (R2) between landscape metrics and hydrochemistry variables vary from 0.32 to 0.74. However, few studies considered adding land-use parameters to the improvement of source identification accuracy in PCA (Cheng et al., 2020).
This study focused on the Poyang Lake Basin aims to: 1) identify spatio-temporal distribution characteristics of the water quality with GIS technology, 2) identifying the pollution sources through PCA, and 3) using the APCS–MLR model to quantify the percentage contribution of identified pollution sources to water contamination. Considering the significant correlation between water quality and land use (Giri and Qiu, 2016; Wijesiri et al., 2018), to obtain more objectivity and accurate identification results, the correlation analysis (CA) of factor scores and land use was involved in the PCA analysis in this research.
2 Materials and methods
2.1 Study area
The Poyang Lake Basin, which accounts for about 97% of the area of Jiangxi Province, has a drainage area of 1.62 × 10⁵ km2 (Zhou et al., 2016). The basin belongs to a subtropical monsoon climate, with a mean annual air temperature of 18° and a mean annual rainfall of 1615 mm that is concentrated in the wet season (Peng et al., 2013). Poyang Lake is located in the Middle and Lower reaches of the Yangtze River and is the largest freshwater lake in China (Figure 1). As one of the Yangtze-connected lakes, Poyang Lake freely exchanges water and sediment with the Yangtze River. Consequently, the limnology of Poyang Lake changes seasonally based on variations in the water level which is approximately 10 m (Wu et al., 2013; Zhang et al., 2014). During the wet season, the surface areas of Poyang Lake can be 27 times larger than that during the dry season (the wet season lasts from April to September and the dry season lasts from October to March), while the volume can be 63 times larger accordingly (Guo et al., 2012).
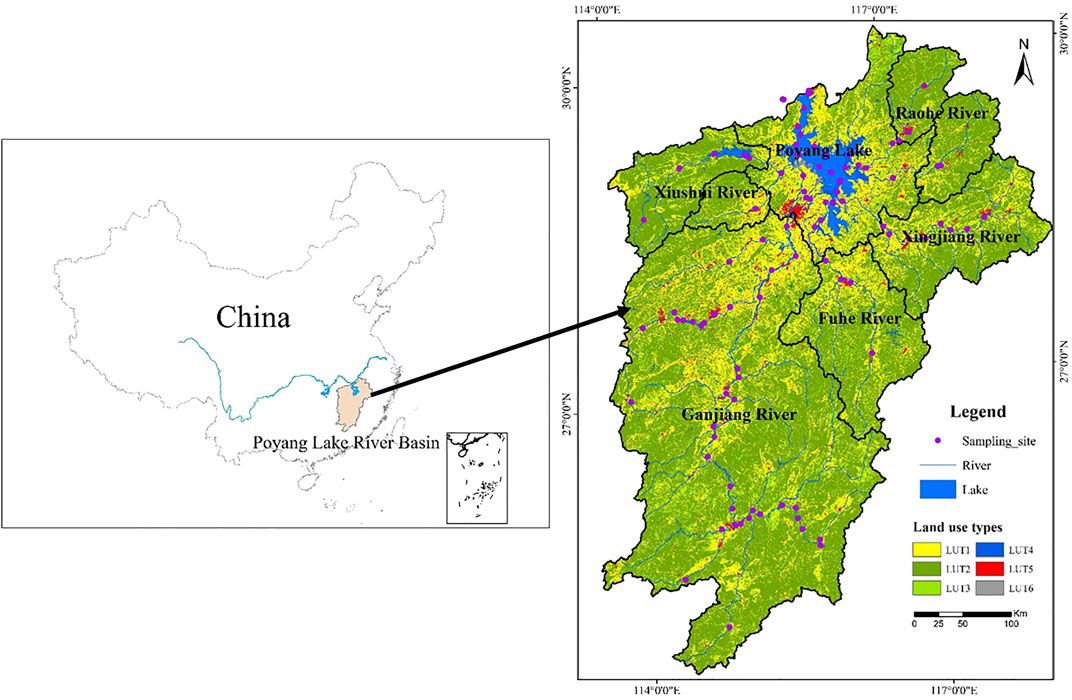
FIGURE 1. Location of the study area, water quality sampling sites, and land-use distribution (LUT1: cultivated land; LUT2: forest land; LUT3: grassland; LUT4: water area; LUT5: urban residential areas and other construction land; and LUT6: unused land).
2.2 Multivariate statistical methods
All statistical analyses were conducted using SPSS 22 and RStudio. Multivariate statistical analyses including CA, PCA, and APCS–MLR were adopted in this research. The PCA could assess the degree of dispersion in water quality parameters and extract principal components (PCs), which was conducted in this study to assess possible sources that influence water quality (Zhang et al., 2020b). Metadata standardization, Kaiser–Meyer–Olkin (KMO), and Bartlett’s test were used to test the applicability of PCA datasets. Eigenvalues greater than one was extracted to be the principal components based on the Kaiser standard (Kaiser, 1974). To maximize the sum of the squared loadings for each component, the factor load matrix was rotated in an orthogonal way. Absolute factor loadings larger than 0.75, in the range of 0.50–0.75, and in the range of 0.30–0.50 are considered to be strong, moderate, and weak loadings, respectively (Huang et al., 2010; Liu et al., 2015). Additionally, CA of factor scores and land use was incorporated to improve the precision of assessing possible sources (Cheng et al., 2020).
The APCS–MLR model is designed to quantify the contribution of pollution sources to water quality parameters in rivers/lakes based on PCA. First, the PCA analysis extract PCs from plenty of relevant variables by data dimensionality reduction, then the pollution source of PCS could be identified according to the calculated rotating load. Nevertheless, the percentage contribution of pollution sources could not be directly calculated based on the standard value of data by PCA (Thurston and Spengler 1987). Converting the standardized factor score into the non-standardized absolute principal component score (APCS) is indispensable. The APCS can be expressed as
where
The source contributions to contaminant’s concentration (Ci) could be modeled by building a multiple linear regression (MLR) model. The calculation formula can be as follows
where ami is the coefficient of MLR of the source m for contaminant i, and
The contribution rate of unidentified source can be expressed as
where
2.3 Description of data
Monthly data of 13 hydrochemistry and two weather parameters at 98 surface water sampling sites covering the whole basin were considered for analysis (Table 1). A total of 35,072 observations from January 2017 to December 2018 were collected to identify the pollution sources. These 98 sampling sites are managed by local Ecology and Environment monitoring bureaus as state control sites in China. The 13 hydrochemistry parameters included pH, dissolved oxygen (DO), potassium permanganate index (CODMn), chemical oxygen demand (CODCr), biochemical oxygen demand (BOD5), ammonia–nitrogen (NH3–N), Cu, Zn, total phosphorus (TP), Cd, Hg, Pb. and fluoride (F). Land-use data (30-m resolution) for 2018 were obtained from the Resource and Environment Data Cloud Platform (https://www.resdc.cn/Default.aspx). Data on monthly averaged precipitation (P) and temperature (T) of each monitoring sites were obtained from the 0.1-degree China Meteorological Forcing Dataset (CMFD) v0106 (http://data.cma.cn/).
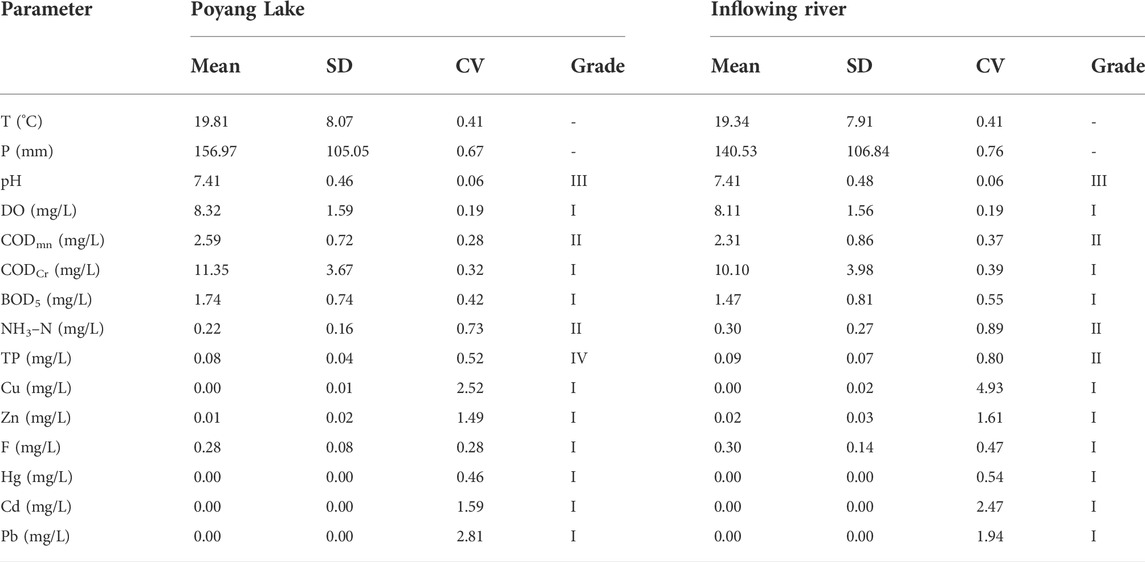
TABLE 1. Statistical descriptions (arithmetical mean [mean], standard deviation [SD], coefficient of variation [CV], and grade of water quality [grade]) of the water quality and weather parameters of the Poyang Lake Basin.
3 Results
3.1 Temporal and spatial variations in water quality
The basic statistics of mean value, standard deviation (SD), coefficient of variation (CV) of water quality parameters in Poyang Lake, inflowing rivers, and different seasons are presented in Table 1 and Figure 2. According to the National Surface Water Quality Standard of China (GB3838-2002), during 2017–2018, the water quality of the Poyang Lake was grade III except for TP in Poyang Lake. TP concentrations were the main sources of pollution. Due to different standards in TP between lakes and rivers, the inflowing rivers reached grade II. The mean TP concentrations reached 0.080 ± 0.042 mg/L (1σ) and 0.085 ± 0.068 mg/L in Poyang Lake and inflowing rivers, respectively, in all the sites during 2017–2018. Temporal characteristics of water quality in wet (May to October) and dry seasons (November to April) are shown in Figure 2B. It can be seen that air temperature and precipitation in the wet season were higher than those in the dry season. The DO concentration in the wet season, which was accompanied by high temperature, was lower because higher temperature could reduce the solubility of DO in water. The other parameters had no significant differences between the two seasons.
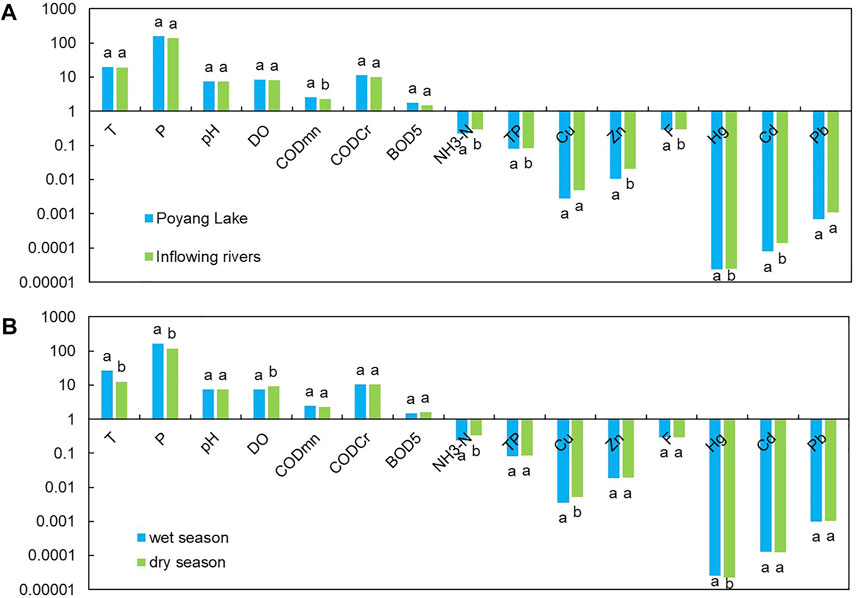
FIGURE 2. Water quality and weather parameters in the Poyang Lake and inflowing rivers (A), wet and dry season. (B) Ordinate is the logarithm of the parameters, and the base number is 10. The different letters denote significant differences (p < 0.05) between mean parameters for groups within each category. Units: mg/L, except pH dimensionless, T: °C, P: mm.
The grade of water quality was assessed according to the National Surface Water Quality Standard of China (GB3838-2002). Grade I to grade V indicate an increasing deterioration in water quality. As T, P, and pH are not included in the standard, we could not arrest the relationship between them and the standard. Thus, the grade of T, P, and pH are listed as ‘‘–”, meaning not applicable.
As shown in Figure 2, TP and NH3–N were the most serious and concerned pollutants in the Poyang Lake Basin. CODCr, CODMn, and BOD5 are generally considered as crucial indicators for organic pollution. DO reflects the self-purification ability of a river. Consequently, spatial variability of the six parameters, which reflected the impact of anthropogenic activities and different land-use types, are selected to show in Figure 3. For TP, NH3–N, CODCr, CODMn, and BOD5, the lowest values almost all occurred in Zhelin Lake and upstream of Gan River. The monthly averaged values in Zhelin Lake reached 0.017 ± 0.008 mg/L (1σ), 0.055 ± 0.041 mg/L, 9.0 ± 2.6 mg/L, 1.60 ± 0.31 mg/L, and 1.55 ± 0.49 mg/L, respectively. For upstream of the Gan River, they reached 0.067 ± 0.034 mg/L, 0.270 ± 0.208 mg/L, 9.4 ± 3.2 mg/L, 1.96 ± 0.59 mg/L, and 1.13 ± 0.52 mg/L, respectively. The highest values of TP and NH3–N occurred in the Yuan River, reached 0.117 ± 0.057 mg/L and 0.498 ± 0.301 mg/L. For CODCr, CODMn, and BOD5, the highest values all occurred in Xiannv Lake, reached 15.1 ± 5.1 mg/L, 3.88 ± 1.16 mg/L, and 2.58 ± 1.27 mg/L, respectively.
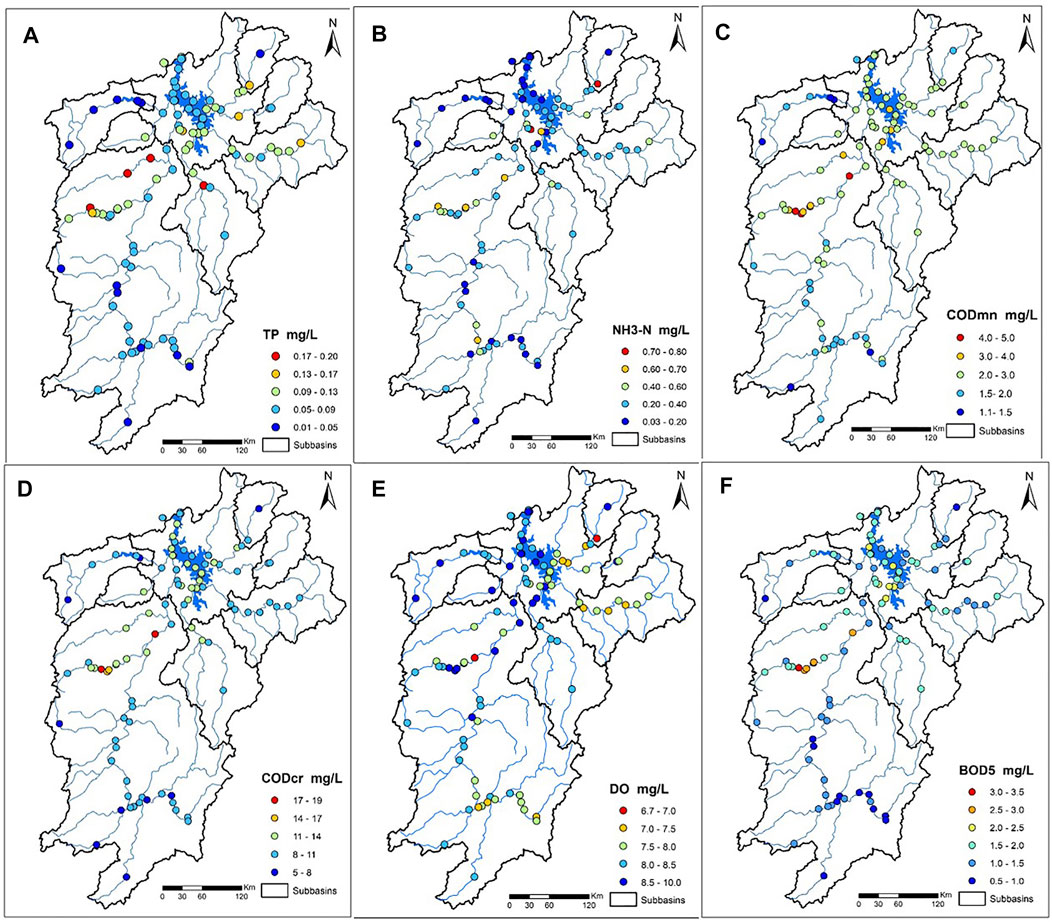
FIGURE 3. Spatial distribution of the contents of (A) TP, (B) NH3-N, (C) CODMn, (D) CODCr, (E) DO and (F) BOD5 of the Poyang Lake Basin during 2017–2018.
3.2 Pollution source identification with principal component analysis
The KMO value for the Poyang Lake Basin was 0.661, and the value of Bartlett’s test was close to zero (p < 0.005). The statistically significant interrelationship was proven between variables and that the results of PCA analysis was valid. Five principal components were obtained, summing 71% of the total variance in the dataset (Table 2).
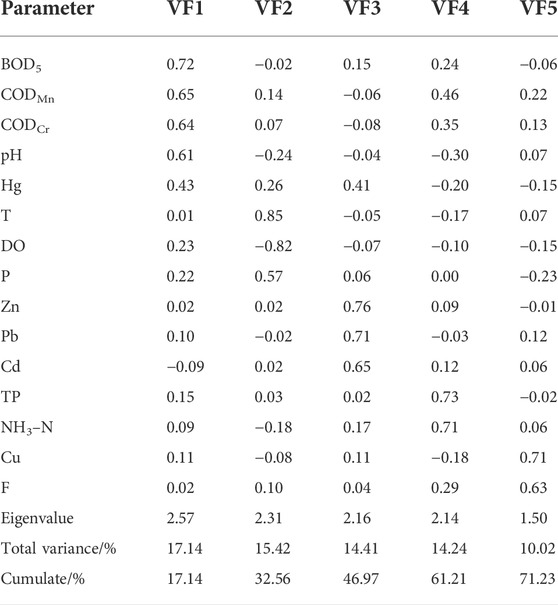
TABLE 2. Loading of 15 variables on varimax rotated factors (VFs) in the Poyang Lake Basin.
To improve the objectivity and accuracy of pollution source identification by PCA, CA of the factor scores and area percentage of each land-use types were applied to offer reference criteria for comprehensive judgment (Table 3), as well as area percentage of each land-use types in different sub-basins (Table 4).
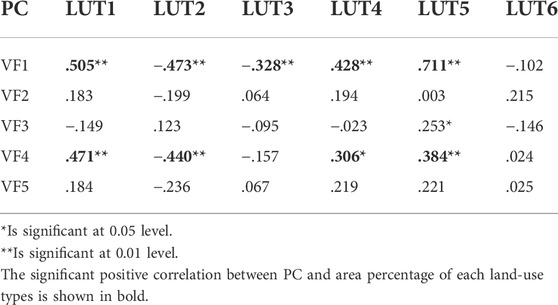
TABLE 3. Pearson correlation coefficient matrix between the APCS and land-use types. For LUT1-6, refer to Figure 1.
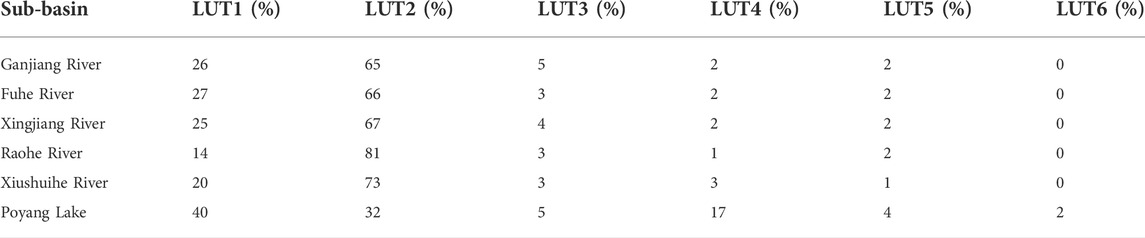
TABLE 4. Area percentage of each land-use types in different sub-basins.
3.3 Pollution source apportionment with absolute principal component score–multiple linear regression model
According to the aforementioned source identification results, this study built a APCS–MLR model to perform source apportionment of water pollution in the Poyang Lake Basin. The contribution rate of unidentified sources as estimated values bi in Eq. 4 was also considered. In general, R2 > 0.5 implies a good fitting between observed and predicted values, and a reliable source apportionment result (Gholizadeh et al., 2016; Wang et al., 2016). As shown in Table 5, mean R2 of 0.65 (most parameters more than 0.70) and mean ratio/slope of 0.86 (most parameters more than 0.90) indicated that the model’s performance is perfect (Simeonov et al., 2003), except for relatively low R2 for Hg (0.48), Cd (0.44), and Pb (0.53) and low ratio for Cd (0.52) and Pb (0.62) due to some of the observed values below the detection limit (Liu et al., 2019).
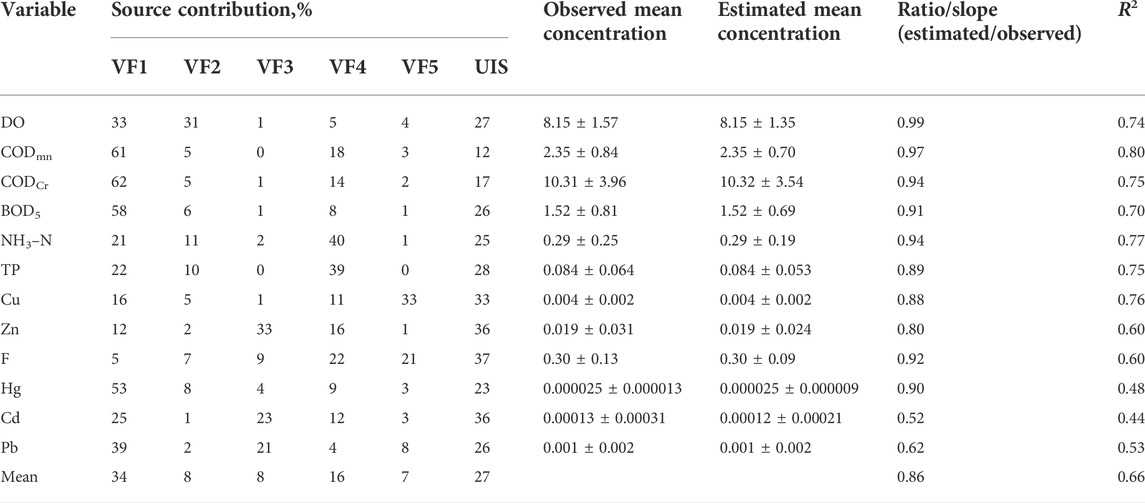
TABLE 5. Mean source contributions to different variables concentrations (UIS: unidentified source).
As shown in Figure 4, most of the variables were mainly affected by VF1 (average 34%), manifested by the high contribution rates of organic indexes (CODMn, 61%; CODCr, 62%; and BOD5, 58%), Hg (53%), and Pb (39%). In addition, VF4 accounted for 16% of the total pollution source, represented as NH3–N (40%) and TP (39%), respectively. The contributions of VF2 (average 8%) for different water quality parameters ranged between 1% (Cd) and 31% (DO). VF3 explained 8% of the total pollution sources, mainly shown by Zn (33%), Cd (23%), and Pb (21%). VF5 (average 7%) represented copper mine sources, and the corresponding contribution rate on Cu was 33%. At last, the contribution of UIS was ranging from 12% (CODMn) to 36% (Zn and Cd). The receptor model estimated that 27% of DO, 17% of CODCr, 26% of BOD5, 25% of NH3–N, and 28% of TP resulted from UIS, respectively. It might be due to the fact that pollutants coming from mixed and complicated sources resulted in the difficulty in source identification using the APCS–MLR model (Gholizadeh et al., 2016).
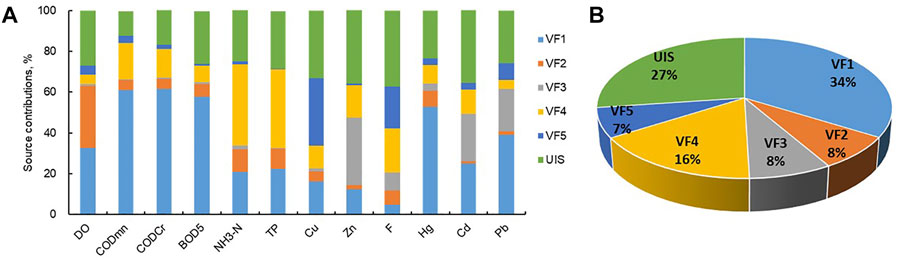
FIGURE 4. Contributions on the selected water quality parameters (A) and average contributions (B) of different pollution sources in the Poyang Lake Basin using the APCS–MLR model.
4 Discussion
VF1 explained 15.42% of the total variance, with moderate positive loadings (0.72, 0.65, 0.64, and 0.61) on BOD5, CODMn, CODCr, and pH. VF1 was most positively related to urban residential areas and other construction land, cultivated land, and water areas. These substances are all organic pollutants, which mainly come from urban wastewater, involving domestic sewage and industrial effluents (Najar and Khan, 2012; Liu et al., 2019). VF1 is negatively related to forest land and grassland, which have the ability to absorb and well trap these organic substances in surface water that flows through them before they enter the nearby rivers (Xu et al., 2019), VF1 is also included in urban runoff. VF2 explained 17.14% of the total variance, with strong and moderate loadings (0.85, −0.82, and 0.57) on T, DO, and P. No significant relationships between VF2 and land-use types were detected. The negative DO loadings could be interpreted by the fact that higher temperature could reduce the solubility of DO in water (Guo et al., 2021). VF2 could be ascribed to meteorological sources. VF3 explained 14.41% of the total variance, with strong and moderate loadings (0.76, 0.71, and 0.65) on Zn, Pb, and Cd. Only urban residential areas and other construction land had a weak positive correlation with VF3. The lead–zinc mines in this area are abundant, such as the Yinshan Lead–Zinc mine, which located near the right bank of the Jishui River, a tributary of the Rao River, were as high as 4.3 × 10⁵ t for Pb and 5.2 × 10⁵ t for Zn (Wang et al., 2013; Li et al., 2020a). The corresponding non-ferrous metal processing enterprises, such as the Yinshan Lead–Zinc mine smelter, were also built nearby the mine. Furthermore, data from this study show that the average concentration of Zn reached 0.038 mg/L in the Rao River during 2017–2018, which was the highest within the Poyang Lake Basin. Cd showed a significantly positive correlation with Zn (r = 0.33**). VF3 could be ascribed to lead–zinc mining and industrial activities. VF4 explained 14.24% of the total variance, with moderate loadings (0.73 and 0.71) on TP and NH3–N. These substances are primarily from the application of fertilizers on farmland and from the discharge of domestic sewage containing a large number of nutrients (Yang et al., 2020). VF4 was most significantly positively related to cultivated land, then was to urban residential areas and other construction land, and significantly negative related to forest land. This relative analysis demonstrated that VF4 was non-point sources, which could be composite pollution sources from agricultural non-point sources and urban sewage overflows pollution. VF5 explained 10.02% of the total variance, with moderate loadings (0.71 and 0.63) on Cu and F. Also, no significant relationships between VF5 and land-use types were detected. There are large quantities of copper deposits in the basin. Wang et al. (2017) found Cu deposit in the sediment in Poyang Lake mainly due to increasing mining activities, as well as mineral deposits. The sediment load from the Xinjiang and Raohe rivers, which was strongly influenced by mining activities (such as the Yongping and Dexing copper mines), contributed more than 35% of the Cu in Poyang Lake (Cui et al., 2013; Wang et al., 2017; Dai et al., 2018). In particular, the Dexing copper mine accounts for as high as 20% of China’s copper reserves, which is the biggest opencast copper mine (Kuang et al., 2020). Between 1983 and 2003, the amount of Cu eventually flowed into the lake climbed to 1000t in 2003 from 447t in 1983. Fluoride in both rivers and groundwater mainly came from fluoride-rich rocks and minerals (Agorhom et al., 2015). Similar to VF3, VF5 was attributed to copper mine sources.
Poyang Lake is threatened by elevated TP concentrations. The source apportionment has attracted much attention in recent years. This study demonstrated that TP come mainly from VF4 (agricultural non-point source and urban sewage overflows; 39%), VF1 (domestic sewage, urban runoff, and industrial effluents; 22%), and VF2 (meteorological sources, 10%). Additionally, unidentified sources comprised 28%. The contributors exhibited a similar pattern as Yang et al. (2020), to know which agricultural non-point source (planting, 29%; livestock, 17%; aquaculture, 10%) and urban sewage (25%) contributed the most in 2016 and 2017. Given the lack of consideration of hydro-climatic conditions and background concentrations, such as soil erosion, the contribution rate of the aforementioned sources of this study is lower than that of Yang et al. (2020). However, these two factors cannot be ignored. Furthermore, pollutant transportation and degradation along the way in the Poyang Lake Basin are deeply affected by variations in the hydrological regime. Li et al. (2020) showed a significant correlation between monthly TP and water level fluctuations in Poyang Lake due to the dilution effect and biological degradation capacity. Gao et al. (2016) also found that net anthropogenic phosphorus input and the water level together explains 64% of TP variability. Given the close correlation between meteorological and hydrological conditions, this study showed that the contribution rate of meteorological sources (VF2) is 10%.
Compared to previous research in pollution source apportionment with APCS–MLR, combining land-use information in PCA decreased the subjectivity, one-sidedness, and uncertainty of pollution source identification in this study, and the methodology provides an alternative way that can be applicated in source apportionment for other polluted lakes/rivers. With the help of land-use parameters, urban and agricultural sources could be distinguished easily, as well as point and non-point pollution sources. However, there are still some deficiencies due to limitations in the methods and data. Because of a weak relationship between land use and factor scores for some pollutants, subjective experience to identify the sources still exists. Moreover, the correlation coefficients between certain land-use types are very high (Table 6), which increased the uncertainty of the source identification results combined with land-use parameters. Additionally, the contribution of pollution sources is relative values. For better recognition of factors and pressure exerted by these pollution sources, we need to know the absolute values. In future research, based on even more monitoring sites and longer datasets, long-term validation could be tested to obtain a more accurate source identification result. Combining with other source identification technologies, such as stable isotopic tracer method and fingerprinting techniques, can reduce the uncertainty of source apportionment. Furthermore, some forward traceability models could be used to calculate the absolute values of source contributions in order to formulate better protective measures by practitioners.
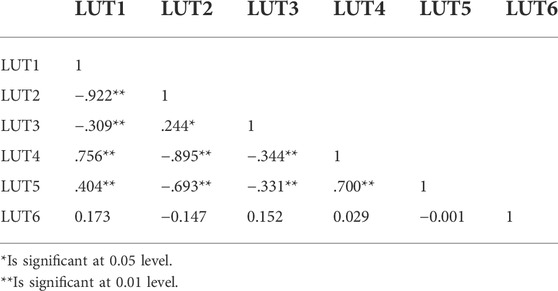
TABLE 6. Correlation analysis of land-use type in the Poyang Lake Basin. For LUT1-6, refer to Figure 1.
5 Conclusion
In this research, CA, PCA, GIS analytical methods, and APCS–MLR model combined with land-use parameters were applied to assess temporal and spatial variation of the water quality and source apportionment in Poyang Lake and its major rivers. Five potential pollution sources were identified by PCA analysis. Urban wastewater with 34% contribution and agricultural non-point sources with 16% contribution, were the major sources of pollution in water quality. TP and NH3–N, the most serious pollutants, agricultural non-point source pollutions (VF4) with 40% contributions and urban wastewater (VF1) with 21% contributions was the major sources in Poyang Lake Basin. Urban wastewater (VF1) with 60% contributions was the major source of organic contamination (CODMn, CODCr, and BOD5). It can be concluded that with associated land-use parameters, the GIS approach with the APCS–MLR model can improve the accuracy and certainty of source apportionment, providing aid decision information for managers on protection of surface water quality. Some additional research should be conducted to assess precisely the UIS and variation of other water quality parameters that were not considered in this research.
Data availability statement
The original contributions presented in the study are included in the article/Supplementary Material; further inquiries can be directed to the corresponding authors.
Author contributions
RX and YZ contributed to conception and design of the study. XH and WG wrote the first draft of the manuscript. KZ, XW, KY, XC, and YD organized the database. MZ contributed to manuscript revision, read, and approved the submitted version.
Funding
This work was supported by the Budget Surplus of Central Financial Science and Technology Plan (2021-JY-25, 2021YSKY-05), National Key Research and Development Program of China (2021YFC3201502), and Postdoctoral Science Foundation of China (2019M660751).
Conflict of interest
The authors declare that the research was conducted in the absence of any commercial or financial relationships that could be construed as a potential conflict of interest.
Publisher’s note
All claims expressed in this article are solely those of the authors and do not necessarily represent those of their affiliated organizations, or those of the publisher, the editors, and the reviewers. Any product that may be evaluated in this article, or claim that may be made by its manufacturer, is not guaranteed or endorsed by the publisher.
References
Agorhom, E. A., Lem, J. P., Skinner, W., and Zanin, M. (2015). Challenges and opportunities in the recovery/rejection of trace elements in copper flotation-a review. Miner. Eng. 78, 45–57. doi:10.1016/j.mineng.2015.04.008
Cheng, G., Wang, M., Chen, Y., and Gao, W. (2020). Source apportionment of water pollutants in the upstream of Yangtze River using APCS-MLR. Environ. Geochem. Health 42, 3795–3810. doi:10.1007/s10653-020-00641-z
Cui, L., Qiu, Y., Fei, T., Liu, Y., and Wu, G. (2013). Using remotely sensed suspended sediment concentration variation to improve management of Poyang Lake, China. Lake Reserv. Manag. 29, 47–60. doi:10.1080/10402381.2013.768733
Dai, L., Wang, L., Li, L., Liang, T., Zhang, Y., Ma, C., et al. (2018). Multivariate geostatistical analysis and source identification of heavy metals in the sediment of Poyang Lake in China. Sci. Total Environ. 621, 1433–1444. doi:10.1016/j.scitotenv.2017.10.085
Gao, W., Gao, B., Yan, C., and Liu, Y. (2016). Evolution of anthropogenic nitrogen and phosphorus inputs to Lake Poyang Basin and its' effect on water quality of lake. Acta Sci. Circumstantiae 36, 3137–3145. doi:10.13671/j.hjkxxb.2015.0779
Gholizadeh, M. H., Melesse, A., and Reddi, L. (2016). Water quality assessment and apportionment of pollution sources using APCS-MLR and PMF receptor modeling techniques in three major rivers of South Florida. Sci. Total Environ. 566, 1552–1567. doi:10.1016/j.scitotenv.2016.06.046
Giri, S., and Qiu, Z. (2016). Understanding the relationship of land uses and water quality in twenty first century: a review. J. Environ. Manag. 173, 41–48. doi:10.1016/j.jenvman.2016.02.029
Guo, H., Hu, Q., Zhang, Q., and Feng, S. (2012). Effects of the three gorges dam on Yangtze River flow and river interaction with Poyang lake, China: 2003–2008. J. Hydrol. 416-417, 19–27. doi:10.1016/j.jhydrol.2011.11.027
Guo, H., Huang, J. J., Zhu, X., Wang, B., Tian, S., Xu, W., et al. (2021). A generalized machine learning approach for dissolved oxygen estimation at multiple spatiotemporal scales using remote sensing. Environ. Pollut. 288, 117734. doi:10.1016/j.envpol.2021.117734
Han, Y., Guo, X., Jiang, Y., Xu, Z., and Li, Z. (2020). Environmental factors influencing spatial variability of soil total phosphorus content in a small watershed in Poyang Lake Plain under different levels of soil erosion. Catena 187, 104357. doi:10.1016/j.catena.2019.104357
Hou, X. K., Zhan, X. Y., Zhou, F., Yan, X. Y., Gu, B. J., Reis, S., et al. (2018). Detection and attribution of nitrogen runoff trend in China's croplands. Environ. Pollut. 234, 270–278. doi:10.1016/j.envpol.2017.11.052
Huang, F., Wang, X., Lou, L., Zhou, Z., and Wu, J. (2010). Spatial variation and source apportionment of water pollution in Qiantang River (China) using statistical techniques. Water Res. 44, 1562–1572. doi:10.1016/j.watres.2009.11.003
Huang, J., Zhang, Y., Bing, H., Peng, J., Dong, F., Gao, J., et al. (2021). Characterizing the river water quality in China: recent progress and on-going challenges. Water Res. 201, 117309. doi:10.1016/j.watres.2021.117309
Hutchins, M. G., Abesser, C., Prudhomme, C., Elliott, J. A., Bloomfield, J. P., Mansour, M. M., et al. (2018). Combined impacts of future land-use and climate stressors on water resources and quality in groundwater and surface waterbodies of the upper Thames river basin, UK. Sci. Total Environ. 631-632, 962–986. doi:10.1016/j.scitotenv.2018.03.052
Ighalo, J. O., Adeniyi, A. G., Adeniran, J. A., and Ogunniyi, S. (2021). A systematic literature analysis of the nature and regional distribution of water pollution sources in Nigeria. J. Clean. Prod. 283, 124566. doi:10.1016/j.jclepro.2020.124566
Jiang, Y., and Guo, X. (2019). Multivariate and geostatistical analyses of heavy metal pollution from different sources among farmlands in the Poyang Lake region, China. J. Soils Sediments 19, 2472–2484. doi:10.1007/s11368-018-2222-x
Kuang, H., Hu, C., Wu, G., and Chen, M. (2020). Combination of PCA and PMF to apportion the sources of heavy metals in surface sediments from Lake Poyang during the wet season. J. Lake Sci. 32, 964–976. doi:10.18307/2020.0406
Li, B., Wan, R., Yang, G., Wang, S., and Wagner, P. D. (2020a). Exploring the spatiotemporal water quality variations and their influencing factors in a large floodplain lake in China. Ecol. Indic. 115, 106454. doi:10.1016/j.ecolind.2020.106454
Li, B., Yang, G., and Wan, R. (2020b). Multidecadal water quality deterioration in the largest freshwater lake in China (Poyang Lake): implications on eutrophication management. Environ. Pollut. 260, 114033. doi:10.1016/j.envpol.2020.114033
Li, J., Song, L., Chen, H., Wu, J., and Teng, Y. (2020c). Source apportionment of potential ecological risk posed by trace metals in the sediment of the Le'an River, China. J. Soils Sediments 20, 2460–2470. doi:10.1007/s11368-020-02604-4
Liu, Y., Wang, S. Y., Lohmann, R., Yu, N., Zhang, C. K., Gao, Y., et al. (2015). Source apportionment of gaseous and particulate PAHs from traffic emission using tunnel measurements in Shanghai, China. Atmos. Environ. 107, 129–136. doi:10.1016/j.atmosenv.2015.02.041
Liu, L., Tang, Z., Kong, M., Chen, X., Zhou, C., Huang, K., et al. (2019). Tracing the potential pollution sources of the coastal water in Hong Kong with statistical models combining APCS-MLR. J. Environ. Manag. 245, 143–150. doi:10.1016/j.jenvman.2019.05.066
Liu, L., Dong, Y., Kong, M., Zhou, J., Zhao, H., Tang, Z., et al. (2020). Insights into the long-term pollution trends and sources contributions in Lake Taihu, China using multi-statistic analyses models. Chemosphere 242, 125272. doi:10.1016/j.chemosphere.2019.125272
Liu, J., Xu, J., Zhang, X., Liang, Z., and Rao, K. (2021). Nonlinearity and threshold effects of landscape pattern on water quality in a rapidly urbanized headwater watershed in China. Ecol. Indic. 124, 107389. doi:10.1016/j.ecolind.2021.107389
Lockhart, K. M., King, A. M., and Harter, T. (2013). Identifying sources of groundwater nitrate contamination in a large alluvial groundwater basin with highly diversified intensive agricultural production. J. Contam. Hydrol. 151, 140–154. doi:10.1016/j.jconhyd.2013.05.008
Lu, J., Gong, D., Shen, Y., Liu, M., and Chen, D. (2013). An inversed Bayesian modeling approach for estimating nitrogen export coefficients and uncertainty assessment in an agricultural watershed in eastern China. Agric. Water Manag. 116, 79–88. doi:10.1016/j.agwat.2012.10.015
Ma, T., Sun, S., Fu, G., Hall, J. W., Ni, Y., He, L., et al. (2020a). Pollution exacerbates China’s water scarcity and its regional inequality. Nat. Commun. 11, 650. doi:10.1038/s41467-020-14532-5
Ma, T., Zhao, N., Ni, Y., Yi, J., Cheng, W., He, L., et al. (2020b). China's improving inland surface water quality since 2003. Sci. Adv. 6, eaau3798. doi:10.1126/sciadv.aau3798
Mirhosseini, M., Farshchi, P., Noroozi, A. A., Shariat, M., and Aalesheikh, A. A. (2018). Changing land use a threat to surface water quality: a vulnerability assessment approach in Zanjanroud watershed, Central Iran. Water Resour. 45, 268–279. doi:10.1134/s0097807818020100
Najar, I. A., and Khan, A. B. (2012). Assessment of water quality and identification of pollution sources of three lakes in Kashmir, India, using multivariate analysis. Environ. Earth Sci. 66, 2367–2378. doi:10.1007/s12665-011-1458-1
Peng, J., Liu, Y., Zhao, X., and Loew, A. (2013). Estimation of evapotranspiration from MODIS TOA radiances in the Poyang Lake Basin, China. Hydrol. Earth Syst. Sci. 17, 1431–1444. doi:10.5194/hess-17-1431-2013
Salim, I., Sajjad, R. U., Paule-Mercado, M. C., Memon, S. A., Lee, B.-Y., Sukhbaatar, C., et al. (2019). Comparison of two receptor models PCA-MLR and PMF for source identification and apportionment of pollution carried by runoff from catchment and sub-watershed areas with mixed land cover in South Korea. Sci. Total Environ. 663, 764–775. doi:10.1016/j.scitotenv.2019.01.377
Shen, D., Huang, S., Zhang, Y., and Zhou, Y. (2021). The source apportionment of N and P pollution in the surface waters of lowland urban area based on EEM-PARAFAC and PCA-APCS-MLR. Environ. Res. 197, 111022. doi:10.1016/j.envres.2021.111022
Simeonov, V., Stratis, J. A., Samara, C., Zachariadis, G., Voutsa, D., Anthemidis, A., et al. (2003). Assessment of the surface water quality in Northern Greece. Water Res. 37, 4119–4124. doi:10.1016/s0043-1354(03)00398-1
Strickling, H. L., and Obenour, D. R. (2018). Leveraging spatial and temporal variability to probabilistically characterize nutrient sources and export rates in a developing watershed. Water Resour. Res. 54, 5143–5162. doi:10.1029/2017wr022220
Su, S., Li, D., Zhang, Q., Xiao, R., Huang, F., and Wu, J. (2011). Temporal trend and source apportionment of water pollution in different functional zones of Qiantang River, China. Water Res. 45, 1781–1795. doi:10.1016/j.watres.2010.11.030
Thurston, G. D., and Spengler, J. D. (1987). A quantitative assessment of source contributions to inhalable particulate matter pollution in metropolitan boston - reply. Atmos. Environ. 21, 259–260. doi:10.1016/0004-6981(87)90291-5
Wang, L., and Liang, T. (2015). Distribution characteristics of phosphorus in the sediments and overlying water of Poyang lake. PLoS One 10, e0125859. doi:10.1371/journal.pone.0125859
Wang, G.-G., Ni, P., Wang, R.-C., Zhao, K.-D., Chen, H., Ding, J.-Y., et al. (2013). Geological, fluid inclusion and isotopic studies of the Yinshan Cu–Au–Pb–Zn–Ag deposit, South China: implications for ore genesis and exploration. J. Asian Earth Sci. 74, 343–360. doi:10.1016/j.jseaes.2012.11.038
Wang, H., An, J., Cheng, M., Shen, L., Zhu, B., Li, Y., et al. (2016). One year online measurements of water-soluble ions at the industrially polluted town of Nanjing, China: sources, seasonal and diurnal variations. Chemosphere 148, 526–536. doi:10.1016/j.chemosphere.2016.01.066
Wang, H., Zhao, Y., Liang, D., Deng, Y., and Pang, Y. (2017). 30+ year evolution of Cu in the surface sediment of Lake Poyang, China. Chemosphere 168, 1604–1612. doi:10.1016/j.chemosphere.2016.11.149
Wang, W., Chen, L., and Shen, Z. (2020). Dynamic export coefficient model for evaluating the effects of environmental changes on non-point source pollution. Sci. Total Environ. 747, 141164. doi:10.1016/j.scitotenv.2020.141164
Westphal, K., Graeber, D., Musolff, A., Fang, Y., Jawitz, J. W., and Borchardt, D. (2019). Multi-decadal trajectories of phosphorus loading, export, and instream retention along a catchment gradient. Sci. Total Environ. 667, 769–779. doi:10.1016/j.scitotenv.2019.02.428
Wijesiri, B., Deilami, K., and Goonetilleke, A. (2018). Evaluating the relationship between temporal changes in land use and resulting water quality. Environ. Pollut. 234, 480–486. doi:10.1016/j.envpol.2017.11.096
Wu, Z. S., Cai, Y. J., Liu, X., Xu, C. P., Chen, Y. W., and Zhang, L. (2013). Temporal and spatial variability of phytoplankton in Lake Poyang: the largest freshwater lake in China. J. Gt. Lakes. Res. 39, 476–483. doi:10.1016/j.jglr.2013.06.008
Wu, Z., Zhang, D., Cai, Y., Wang, X., Zhang, L., and Chen, Y. (2017). Water quality assessment based on the water quality index method in Lake Poyang: the largest freshwater lake in China. Sci. Rep. 7, 17999. doi:10.1038/s41598-017-18285-y
Xu, J., Jin, G., Tang, H., Mo, Y., Wang, Y.-G., and Li, L. (2019). Response of water quality to land use and sewage outfalls in different seasons. Sci. Total Environ. 696, 134014. doi:10.1016/j.scitotenv.2019.134014
Yang, G., Xiao, M., Gross, J., Al-Zubaidy, H., and Huang, Y. (2016). “Delay and backlog analysis for 60 GHz wireless networks,” in 2016 IEEE global communications conference (GLOBECOM), Washington, DC, USA, 04-08 December 2016, 1–7.
Yang, Z., Zhang, M., Hao, C., Hou, X., Wang, L., Xia, R., et al. (2020). Source apportionment of total phosphorus pollution in Poyang lake basin based on source-sink process modeling. Res. Environ. Sci. 33, 2493–2506. doi:10.13198/j.issn.1001-6929.2020.09.11
Yu, C. Q., Huang, X., Chen, H., Godfray, H. C. J., Wright, J. S., Hall, J. W., et al. (2019). Managing nitrogen to restore water quality in China. Nature 567, 516–520. doi:10.1038/s41586-019-1001-1
Zhang, Q., Ye, X. C., Werner, A. D., Li, Y. L., Yao, J., Li, X. H., et al. (2014). An investigation of enhanced recessions in Poyang Lake: comparison of Yangtze River and local catchment impacts. J. Hydrol. 517, 425–434. doi:10.1016/j.jhydrol.2014.05.051
Zhang, Q., Sun, J., Liu, J., Huang, G., Lu, C., and Zhang, Y. (2015). Driving mechanism and sources of groundwater nitrate contamination in the rapidly urbanized region of south China. J. Contam. Hydrol. 182, 221–230. doi:10.1016/j.jconhyd.2015.09.009
Zhang, H., Cheng, S., Li, H., Fu, K., and Xu, Y. (2020a). Groundwater pollution source identification and apportionment using PMF and PCA-APCA-MLR receptor models in a typical mixed land-use area in Southwestern China. Sci. Total Environ. 741, 140383. doi:10.1016/j.scitotenv.2020.140383
Zhang, H., Li, H., Yu, H., and Cheng, S. (2020b). Water quality assessment and pollution source apportionment using multi-statistic and APCS-MLR modeling techniques in Min River Basin, China. Environ. Sci. Pollut. Res. 27, 41987–42000. doi:10.1007/s11356-020-10219-y
Zhang, H., Li, H., Gao, D., and Yu, H. (2022). Source identification of surface water pollution using multivariate statistics combined with physicochemical and socioeconomic parameters. Sci. total Environ. 806, 151274. doi:10.1016/j.scitotenv.2021.151274
Zhou, F., Huang, G. H., Guo, H., Zhang, W., and Hao, Z. (2007). Spatio-temporal patterns and source apportionment of coastal water pollution in eastern Hong Kong. Water Res. 41, 3429–3439. doi:10.1016/j.watres.2007.04.022
Zhou, Y., Jin, S. G., Tenzer, R., and Feng, J. L. (2016). Water storage variations in the Poyang Lake Basin estimated from GRACE and satellite altimetry. Geodesy Geodyn. 7, 108–116. doi:10.1016/j.geog.2016.04.003
Keywords: Poyang Lake Basin, water quality, source apportionment, APCS–MLR, land use
Citation: Hou X, Gao W, Zhang M, Xia R, Zhang Y, Zhang K, Wang X, Yang K, Chen X and Deng Y (2022) Source apportionment of water pollutants in Poyang Lake Basin in China using absolute principal component score–multiple linear regression model combined with land-use parameters. Front. Environ. Sci. 10:924350. doi: 10.3389/fenvs.2022.924350
Received: 20 April 2022; Accepted: 05 August 2022;
Published: 30 August 2022.
Edited by:
Ping Wang, Beijing Forestry University, ChinaReviewed by:
Qinghui Huang, Tongji University, ChinaRenata Augustyniak-Tunowska, University of Warmia and Mazury in Olsztyn, Poland
Copyright © 2022 Hou, Gao, Zhang, Xia, Zhang, Zhang, Wang, Yang, Chen and Deng. This is an open-access article distributed under the terms of the Creative Commons Attribution License (CC BY). The use, distribution or reproduction in other forums is permitted, provided the original author(s) and the copyright owner(s) are credited and that the original publication in this journal is cited, in accordance with accepted academic practice. No use, distribution or reproduction is permitted which does not comply with these terms.
*Correspondence: Rui Xia, eGlhcnVpQGNyYWVzLm9yZy5jbg==; Yuan Zhang, emhhbmcueXVhbkBnZHV0LmVkdS5jbg==
†These authors have contributed equally to this work and share first authorship