 Jie Feng
 Yuemin Lin
 Mingkun Li
 Tingping Ouyang
 Mingjie Yu
- School of Geographic Sciences, South China Normal University, Guangzhou, China
The river environment is complex and receives a variety of contaminants from numerous sources that are persistent, bioaccumulative, and toxic. The distribution, source, contamination, and ecological risk status of Zn, Pb, Cu, Ni, Cr, and Cd were evaluated in the surface sediments at 45 sites on the Moyang and Jian rivers in Western Guangdong, China. Single pollution indices, including contamination factor (CF) and enrichment factor (EF), revealed that Zn, Pb, Ni, Cu, and Cd showed moderate to significant enrichment. To overcome the limitation of the single element indices, a range of sediment quality indices, including modified contamination index (mCd), pollution index (PI), and modified pollution index (MPI), were utilized to ascertain the sediment quality. The sediment in the study area is deemed to be slightly to extremely polluted. The sediment quality guidelines (SQGs), potential ecological risk index (RI), and modified ecological risk index (MRI) were used to assess possible ecological risks. According to the SQGs, Pb, Ni, and Cu have the potential to induce biological effects. The RI indicated that the sediment poses a low ecological risk. However, the MRI indicated that the ecological risk of the sediment was moderate to very high. The accuracy of the single and multi-element indices and ecological risk assessment were evaluated in the river using the principal component analysis (PCA) and cluster analysis (CA), showing an anthropogenic impact. Results demonstrate the need to pay attention to the ecological environment of small rivers, which are sensitive to their surroundings.
1 Introduction
Metal pollutants pose potential harmful effects on human health and the whole ecosystem due to their inherent toxicity, persistence, non-degradability, and bioaccumulation (Wei et al., 2016). Metals in aquatic environments originate from natural sources (mainly weathering of soil and rock, erosion, forest fires, and volcanic eruptions) and anthropogenic activities (industrial effluents, mining and refining, agricultural drainage, domestic discharges, and atmospheric deposition) (Karbassi et al., 2007; Malik et al., 2009; Davutluoglu et al., 2011). Toxic heavy metal elements (such as Pb, Hg, and Cr) enter the human body through the food chain, causing serious harm to the human body (Liu et al., 2018).
Sediment acts as an ultimate receptor of pollutants and a potential secondary source of overlying water. The pollutants from residential sewage and agricultural water may be stored in the sediments through hydrodynamic and biogeochemical processes (Wu et al., 2017). The harm caused by heavy metal sediments is mainly reflected in the “secondary pollution”. In addition, heavy metals accumulated in sediments enter the water due to changes in interface environmental conditions such as pore water pH, decomposition of organic matter, biological activities, storms and dumping of port dredged materials (Tang et al., 2015). Therefore, the analysis of river sediments is a useful approach to characterize pollution in an ecosystem (Akcay et al., 2003).
A number of indices have been developed to accurately assess the metal contamination in sediments and its ecological risk. The common indicators mainly include contamination factor (CF), enrichment factor (EF), (modified) degree of contamination (Cd or mCd), (modified) pollution index (PI or MPI), sediment quality guidelines (SQGs), and (modified) potential ecological risk index (RI or MRI) (Yuan et al., 2014; Vaezi et al., 2015; Duodu et al., 2016; Kumar et al., 2018). These indicators can be divided into two broad categories. SQGs, RI, and MRI indicate the risk of sediments based on the metal concentrations, while CF, EF, Cd, mCd, PI, and MPI denote the enrichment compared with the background concentrations based on the total metal concentrations (Yuan X et al., 2014). The CF, EF, Cd, and mCd assess the sediment quality by using single pollution indices. Meanwhile, PI and MPI assess the sediment quality by using multi-element indices (Duodu et al., 2016). MRI and MPI can normalize the impact of terrestrial sedimentary inputs using EFs (Brady et al., 2015; Duodu et al., 2016). Numerous studies have used more than one index to have a more comprehensive analysis of the contamination in sediment (Vaezi et al., 2015; Kumar et al., 2018; Siddiqui and Pandey, 2019).
Recently, urban-industrial-driven economic development has dramatically altered the aquatic environments with increasingly high input of metals and other pollutants. Terrestrially derived metals, whether geogenic or anthropogenic, flow into rivers and accumulate in sediments (Omwene et al., 2018). Studies on heavy metal pollution in river sediments have mostly focused on large rivers, such as the Yangtze and Pearl rivers in China (Fu et al., 2013; Zhao et al., 2016), the Korotoa and Buriganga rivers in Bangladesh (Mohiuddin et al., 2016), and the Tajum River in Indonesia (Budianta, 2020). However, studies on small rivers are scarce. The Pearl River is located in the developed Pearl River Delta region of Guangdong Province, where sediment pollution has received considerable attention (Zhao et al., 2016). However, few investigations have been conducted on the pollution status of sediments in the Jian and Moyang rivers in Western Guangdong’s underdeveloped areas.
Although the economic and social development in Western Guangdong is slow, it is the main agricultural contribution area in Guangdong. In addition, with the transfer of industries in the Pearl River Delta, the industrial domestic pollution of Western Guangdong has increased (Zhong and Yang, 2001; Chen, 2014). Therefore, the pollution problems of small rivers located in Western Guangdong have frequently occurred in recent years, which need to be paid attention to.
In this study, 45 surface river sediment samples collected from Moyang and Jian rivers in Western Guangdong, China, were studied. This study aimed to use sediment quality indicators, such as CF, EF, PI, MPI, RI, MRI, and SQGs to examine the contamination and ecological status of the Moyang and Jian Rivers sediment. Moreover, this study sought to identify natural and anthropogenic sources of metal contamination based on multivariate statistical analysis. To the best of our knowledge, this work is the first to study heavy metal contamination and bioavailability for the ecological risks in the Moyang and Jian rivers, which might construct a more susceptible and accurate evaluation system for similar river ecosystems in China.
2 Materials and Methods
2.1 Study Area
The study area (Western Guangdong, 109°31′E to 112°21′E and 20°13′N to 22°41′ N) is located in the western part of Guangdong Province. This area has a subtropical climate, which is affected by the maritime monsoon and subtropical high-pressure climate. The main source of surface runoff is rainfall. Due to the uneven distribution of rainfall over time, annual runoff varies greatly. Flood season is mainly from April to September, and non-flood season is from October to March of the next year. The coastal rivers in the study area include Jian, Moyang, Jiuzhou, Nandu, and Suixi Rivers. Our study focused on sediment pollution in the Jian and Moyang rivers, which are longer rivers in Western Guangdong, with a total length of 231 and 199 km, respectively. The urban land accounts for about 10% of the province in Western Guangdong, while the arable land accounts for 32.4% of the province. The economic structure of the study area accounts for a large proportion of agricultural output value (Zhang, 2020). Therefore, the environmental pollution caused by pesticides, fertilizers, and livestock is obvious during agricultural production. The study area, as the undertaking area for industrial transfer in the Pearl River Delta, has experienced significant growth in economic and social development in recent years (Zhang, 2013; Huang et al., 2020), which probably increased industrial and urban life pollution.
2.2 Experimental Design
Considering the distribution of land utilization types, dam distribution, and flood season time, 45 surface sediment samples (0–10 cm) were collected using corers from November 1st to 7th, 2020 (Figure 1). It was found that periods of low flows in dry seasons lead to higher concentrations of heavy metals in channel-bed sediments, whereas wet seasons are characterized by a lower metal content in the bed and a higher metal content in suspended sediments (Gaiero et al., 1997; He et al., 1997). In order to avoid the dilution of heavy metals in river sediments during flood season, we sampled river sediments during non-flood season. A total of 45 sampling sites were set up downstream of Jian River (S1-S20) and downstream of Moyang River (S20-S45). They are distributed in agricultural areas, urban areas, estuaries, and other types of land areas. Reservoirs and dams weakened the hydrodynamic intensity of the river and accelerated the deposition of suspended solids (Kang et al., 2021). But there is no reservoir and dam in the section where the sampling site is located. Locations of sampling stations were determined using Global Positioning System (GPS) (Supplementary Table S1). The collected samples were collected in polyethylene sealed bags and transported to the laboratory of Guangdong Polytechnic of Water Resources and Electric Engineering for analysis.
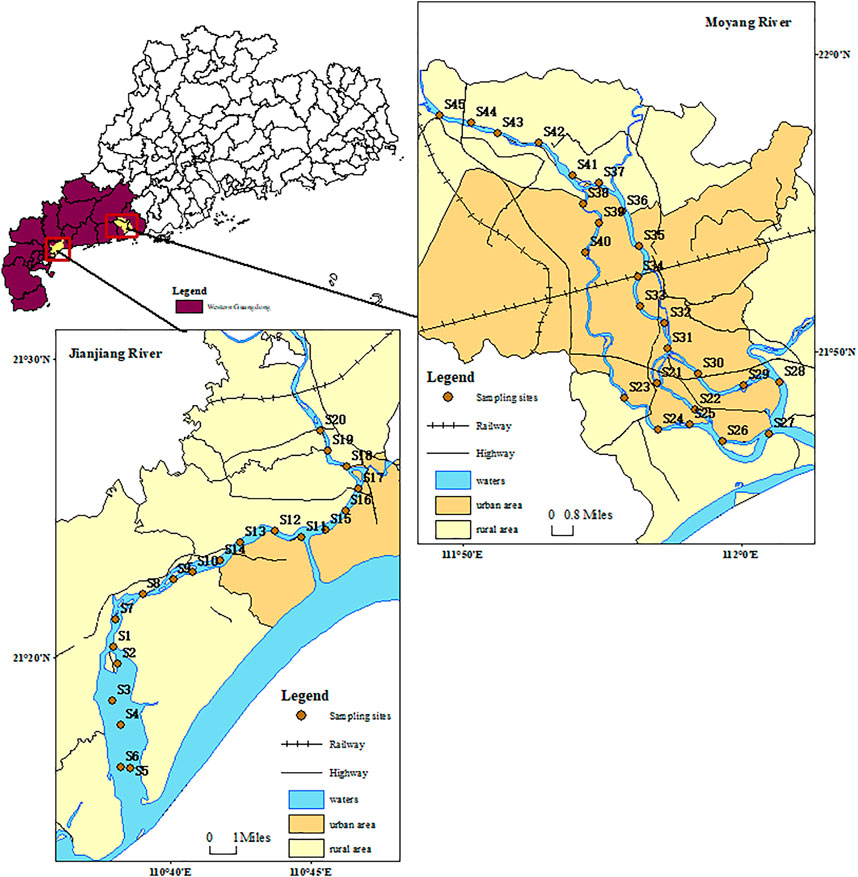
FIGURE 1. Locations of sampling sites of surface sediments in Jian and Moyang river basins.
2.3 Sampling and Analytical Methods
After the sediment samples were freeze-dried, they were ground through a 200-mesh sieve and stored for testing. The analytical method of heavy metal concentration in sediment was as follows: 0.5 g of sediment was taken into a digestion tube. Then, 3–5drops of pure water, 8 ml of concentrated nitric acid, 5 ml of hydrofluoric acid, and 5 ml of hydrogen peroxide were added in sequence. Then, a graphite digester (GDI-20, Guangzhou Jichuang Instrument Co., Ltd. China) was used to digest until 1–2 ml of sample solution remained in the tube. The solution was filtered into a 50 ml colorimetric tube with a 0.45 um water-based disposable filter needle. the volume was diluted to 50 ml with pure water for testing. The prepared samples were analyzed by atomic absorption spectrometry (AAS). Seven metals were analyzed in the sediment sample, which are Cu, Pb, Zn, Cd, Cr, Ni, Fe, and Mn. The quality control process of heavy metal analysis in sediments was as follows: The reagents used in the experimental analysis were all high-grade samples. The relative standard deviation (RSD) of experiments was less than 5%.
2.4 Data Analysis
The average of the metal concentrations was calculated in this study. The data were analyzed using the multivariate statistical tools, principal component analysis (PCA) and cluster analysis (CA), to group variables based on similarities and their sources. Single pollution indices, multi-element indices, and ecological risk assessment were combined to analyze heavy metal pollution in the study area. Given that the study area is located in the South China–Youjiang water system and the low mountain and hilly water system, the evaluation method in this study took the average background value of these water systems as the evaluation standard Cb, Zn: 67.60 mg/kg, Pb: 28.49 mg/kg, Ni: 20.13 mg/kg, Mn: 575.35 mg/kg, Cu: 19.00 mg/kg, Cr: 51.30 mg/kg, and Cd: 0.1298 mg/kg (Shi et al., 2016).
2.4.1 Single Element Indices
Contamination factor (CF) provides the ratio of an element at background sites, a reference value or a national criterion for that metal (Duodu et al., 2016). This indicator provides information about how an element has been concentrated at the site of interest relative to a background site, which indicates the input of metals by human activities (Ahmed et al., 2016). Eq. 1 shows how CF is calculated (Hakanson, 1980).
where CF is the contamination factor, Ci is the concentration of interest metal at a site, and Cb is the concentration of the same metal at a background or reference site. Four qualitative terminologies are used to describe the CF by Hakanson (1980): CF < 1: low contamination; 1 ≤CF < 3: moderate contamination; 3 ≤ CF < 6: considerate contamination; CF ≥ 6: very high contamination.
EF is normalized against an element, which compares the ratio of the element of interest to a “conservative element” in a given sample to the same ratio in a local background (Brady et al., 2015; Islam et al., 2018). “Conservative element” commonly uses the following elements: Al, Fe, Mn, Sc, and Ti. In this study, Mn was selected as the “conservative element” (Bergamaschi et al., 2002; Salati and Moore, 2009; Duodu et al., 2016; Islam et al., 2018). Before adopting EF, PCA and CA were used to determine whether Mn is a conserved element (Han et al., 2006). This approach can negate the effect of terrestrial sedimentary input and identify anthropogenic pollution sources (Brady et al., 2015).
This was determined using the following equation given by Muller (1981):
where Ci is the concentration of the element of interest and Cb is the concentration of the normalization element. Five contamination categories are associated with EF by Sutherland (2000): EF < 2 indicates depletion to minimum enrichment; 2 ≤ EF < 5 represents moderate enrichment; 5 ≤ EF < 20 indicates significant enrichment; 20 ≤ EF < 40 represents very high enrichment; and EF ≥ 40 indicates extremely high enrichment.
2.4.2 Multi-Element Indices
The limitations of the single element indices have led to the development of multiple element indices to assess sediment quality (Brady et al., 2015; Duodu et al., 2016). The most common multiple element indices are the modified contamination index (mCd) developed by Hakanson (1980), the Nemerow pollution index (PI) (Nemerow, 1991), and the modified pollution index (MPI) by Brady et al. (2015).
The mCd calculates the average impact of all heavy metal elements at a sampling point to evaluate sediment pollution. Meanwhile, the PI allows the qualification of sediment quality that is much more considerate of the effect of a single element by using a weighted average. To account for the behaviour of sediments within estuaries and the possibilities of multiple sediment sources, an improved method for determining the PI is proposed by using EF to calculate an MPI, which would allow for the non-conservative behaviour of sediments due to normalization against an element (Brady et al., 2015). Eqs. 4 and 6 show how mCd, PI, and the MPI are calculated. The thresholds for sediment quality classification using the three integrated indices are presented in Table 1.
where CFi, CFaverage, CFmax, and EFmax represent contamination factors for an individual element, average of CF, average of EF, maximum CF, and maximum EF, respectively.
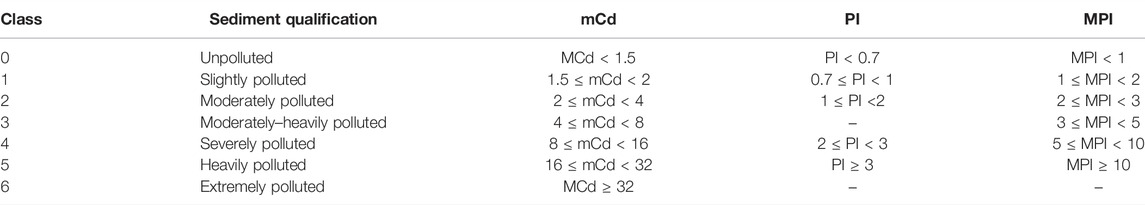
TABLE 1. Thresholds for sediment quality classification for multi-element indices.
2.4.3 Ecological Risk Assessment
The SQGs is a simple and comparative indicator used to assess the quality of sediments and their adverse biological effects on the aquatic ecosystem (MacDonald et al., 2000; Ke et al., 2017; Kang et al., 2020). In this study, two limit values were applied to evaluate the potential risk of the ecosystem, threshold effect content (TEC) and probable effect content (PEC). If the content is below the TEC, then adverse biological effects rarely occur; if the concentrations are equal to or greater than the TEC but less than the PEC, then a range of biological effects occasionally occur; if the concentrations are at or above the PEC, then a probable effect range of adverse biological effects frequently occur (Ke et al., 2017; Kang et al., 2020).
Potential ecological risk index (RI) and modified potential ecological risk index (MRI) were used to assess the extent of heavy metal pollution and its potential ecological harm (Hakanson, 1980). RI takes into consideration the CF of metal, potential ecological risk factors (Er), and toxicological response factors (Tr) (1 for Zn; 2 for Cr; 5 for Cu, Pb, and Ni; and 30 for Cd) (Hakanson 1980; Xu et al., 2008). MRI uses EF in the calculation of RI to account for the effect of terrestrial sedimentary (Duodu et al., 2016). Eqs. 7 and 8 show how the RI and MRI are calculated.
where Eri is the potential ecological risk index of an individual element, Tri is the biological toxic response factor of an individual element, CFi is the contamination factor for each single element, and EFi is the enrichment factor for each single element. Grading of potential ecological risk factors are as follows: Er <40 for low risk, 40–80 indicates moderate risk, 80–160 represents considerable risk, 160–320 represents high risk, and >320 represents very high risk. Grades of potential and modified ecological risk index such as RI or MRI <150 indicates low risk, 150–300 represents moderate risk, 300–600 indicates considerable risk, and >600 indicates very high risk.
3 Results
3.1 Concentration of Heavy Metals in Surface Sediments
Table 2 illustrates the descriptive statistics of the heavy metal contents of the Jian and Moyang rivers. The metals in the sediments from the Jian and Moyang rivers ranged from 57.86 to 317.41 for Mn, 18.64 to 109.34 for Zn, 21.16 to 97.80 for Pb, 9.89 to 53.66 for Ni, 1.20 to 93.66 for Cu, 1.27 to 11.44 for Cr, and 0.004–0.63 mg/kg for Cd. The values of the median concentrations can be ranked in descending order for the Jian and Moyang rivers: Mn > Zn > Pb > Ni > Cu > Cr > Cd. The comparison of the reported results of this study with the background value of water system sediments in the South China Youjiang orogenic zone and low hill water system sediments (Shi et al., 2016) revealed that the concentrations of Cu, Cd, Ni, and Pb were higher than the background value. The average Zn, Pb, Cu, and Cd concentrations in this study were higher than the other studies in Table 3, whilst the concentrations of Zn, Pb, and Cd were much lower in China’s Pearl River.
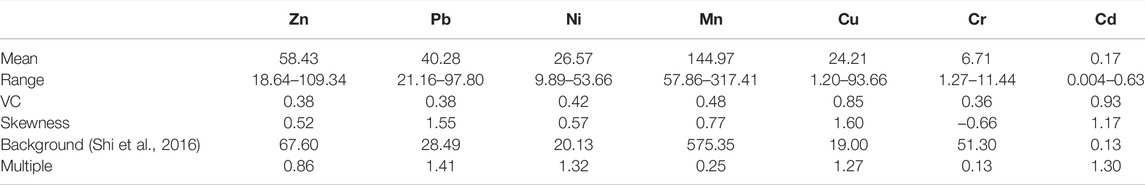
TABLE 2. The heavy metal consensus-based quality guideline values (mg/kg) and background values (mg/kg) in soils of Jian and Moyang river basins.
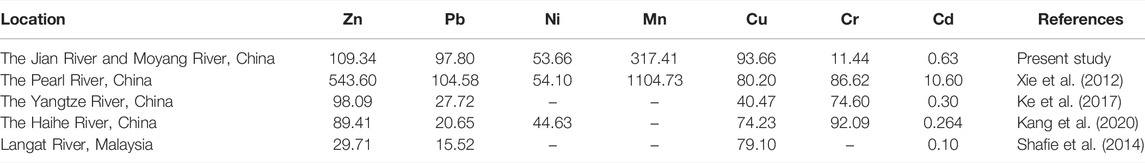
TABLE 3. Metal concentrations (mg/kg) in the Jian and Moyang rivers compared with the mean sediment concentrations reported previously.
3.2 Cluster Analysis and Principal Component Analysis
Cluster analysis (CA) was performed to divide the sampling sites into groups with similar concentrations of heavy metals in sediments. CA is a statistical method used to identify groups or clusters of similar parameters based on similarities within a class and dissimilarities between different classes. In this study, CA made it possible to divide the measurement points into groups 1–1, 1–2, and 2 (Figure2).
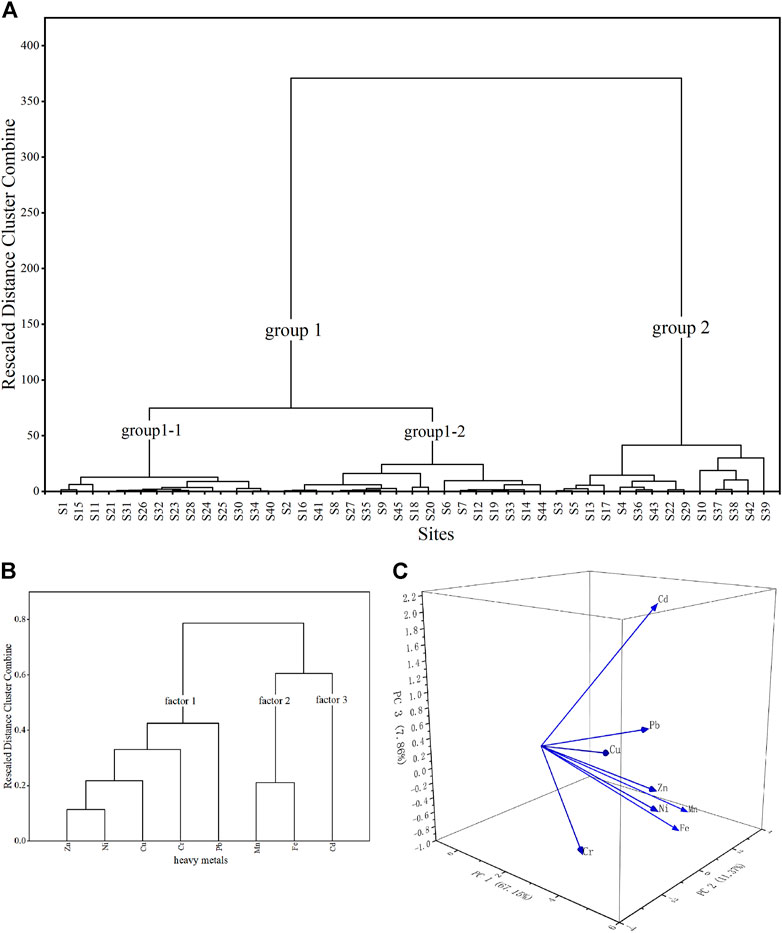
FIGURE 2. (A–B) Cluster diagram of sampling sites and heavy sites and heavy metal elements obtained using Ward’s method and Squared Euclidean distance matrix. (A) Sampling sites. (B) Heavy metal elements. (C) Principal component analysis of different metals.
Considering the relatively high variability of the heavy metal concentrations in certain groups of sampling sites, principal component analysis (PCA) and CA was separately performed for three clusters (Table 4 and Figure 2). The first factor represented 37.872% out of the total variance and members of the significant variables with high loading on Cr, Cu, Ni, Zn, and Pb. The second factor was dominated by Mn and Fe, accounting for 29.348% of the total variance. The third factor contributed 19.165% of the total variance and was only characterized by the loading of Cd.
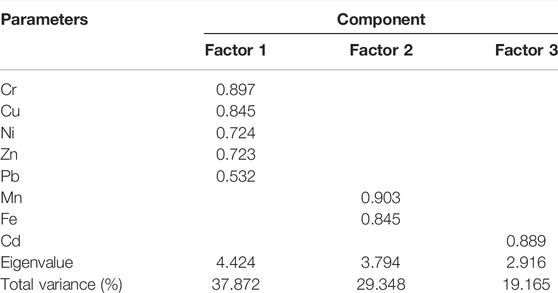
TABLE 4. Loading corresponding to three factors for surface sediments of the Jian and Moyang rivers.
3.3 Single Pollution Indices
Amongst the studied metals, the average values of CF decreased in the order Pb > Ni > Cd > Cu > Zn > Cr. Meanwhile, Zn, Pb Ni, Cu, and Cd showed moderate contamination in some sample stations (37.78%, 77.78%, 68.89%, 46.67.56, and 33.33%, respectively) (Table 5). Significant contamination was observed at the S22, S17, S19, and S22 (group2) sample stations, mainly because of Cu concentration. At sample stations S11 (group 1–1), S18 (group 1–2), and S10, S37, S42, and S43 (group 2), the values of CF for Cd indicated considerate contamination. In addition, S39 (Group2) sample station indicated considerable contamination by Pb (Figure 3).

TABLE 5. Evaluation results in contamination factor (CF) and enrichment factor (EF) percentage (%) in the surface sediments of the Jian and Moyang rivers.
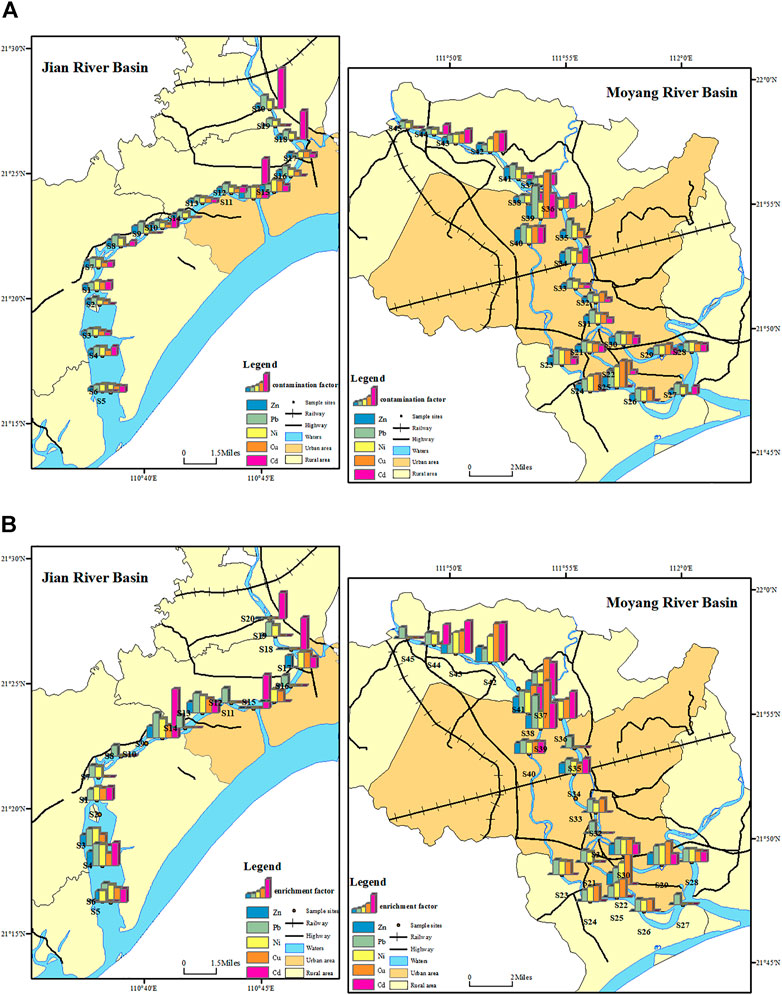
FIGURE 3. Distribution of pollution evaluation results by CF and EF from Jian and Moyang rivers’ sediments. (A) Contamination factor; (B) enrichment factor (The results of the contamination factor only show the sampling sites with moderate contamination and above, and the results of the enrichment factor only show the sampling sites with moderate contamination and above).
Group 2 consisted of Mn–Fe in PCA, which widely exists in nature (Graney and Eriksen, 2004). This notion means that Mn is a conservative element in the studied environment. EF values computed for the metals at various sites are also presented in Table 5. The average values of EF decreased in the order Pb > Ni > Cd > Cu > Zn > Cr, which is similar to the CF results. The assessment of the EF values for the Jian and Moyang rivers demonstrated that Pb, Ni, Cd, and Cu have greater enrichment compared with the other heavy metals (Table 5). In the case of the Jian and Moyang rivers, the values of EF for Pb indicated moderate enrichment at 35.56% of the sample stations and significant enrichment at 62.22% of the sample stations, whilst very high enrichment was observed at S39 (group 2). The analysis of the EF for Ni shows that moderate enrichment occurs at 44.44% of the sample stations and significant enrichment at 55.56% of the sample stations. The assessment of the EF for Cd shows moderate enrichment at 40.00% of the sample stations and significant enrichment at 31.11% of the sample stations, but very high enrichment at S11 (group 1–1) and S20 (group 1–2). In addition, 31.11% of the sample stations indicated moderate enrichment, and 44.44% of the sample stations implied significant enrichment by Cu, with only S39 (group2) having very high enrichment (Figure 3). Spatial distribution of the CF and EF from Jian and Moyang rivers show heavier metal enrichment of sediments in the upper course of Moyang River and heavier Cd metal enrichment of sediments in the upper course of Jian River (Figure 3).
3.4 Multi-Element Indices
Given that the problem of heavy metal pollution in sediments is influenced by various heavy metals, this study used multi-element indices (mCd, PI, and MPI) to assess the influence of multiple contamination species at a site to overcome some limitations of the single indices. In this study, contamination was low, as indicated by “unpolluted” (Figure 4), because none of the sites had an index (mCd) greater than 1.5 except S10, S17, S18, S23, S22, and S39 (group 2), which are slightly to moderately polluted (Table 6). However, the PI value for the Jian River (group 1–2:S2) was lower than 0.7 at only one sample station (Figure 4). The PI values for the rest of the sample stations were above 0.7, indicating that the overall contamination status of the Jian and Moyang rivers was polluted. In the case of the study area, 28.89 and 46.67% of the sample stations were slightly polluted and moderately polluted by PI, respectively. The analysis of the PI for the Jian and Moyang rivers shows that severe pollution occurs at 13.33% of the sample stations (group 1–1: S11, group 1–2: S18, group2: V2, V16, V18, and V23), whilst heavy pollution was observed only at four sample stations (group 2: S10, S37, S39, and S42) (Figure 4). The PI results indicated heavier pollution of sediments in group 2 sample stations. The values of MPI for sediments indicated that the pollution was moderate to heavily in the study area, with a mean value of 7.02. The MPI values for 35.56% of the sample stations indicate moderate to heavy pollution, and 51.11% denoted heavy pollution (Table 6). Moreover, assessment of the MPI shows that extreme pollution occurs at 13.33% of the sample stations (group1–1: S11 and S25; group1–2: S18 and S20; and group2: S39 and S40).
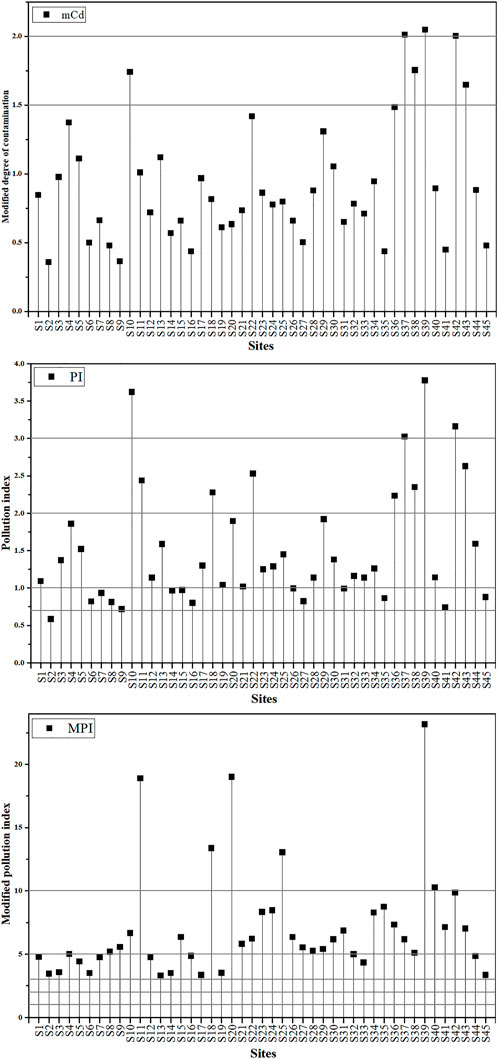
FIGURE 4. Sediment quality assessment by multi-element indices (mCd: modified degree of contamination, PI: pollution index, and MPI: modified pollution index).
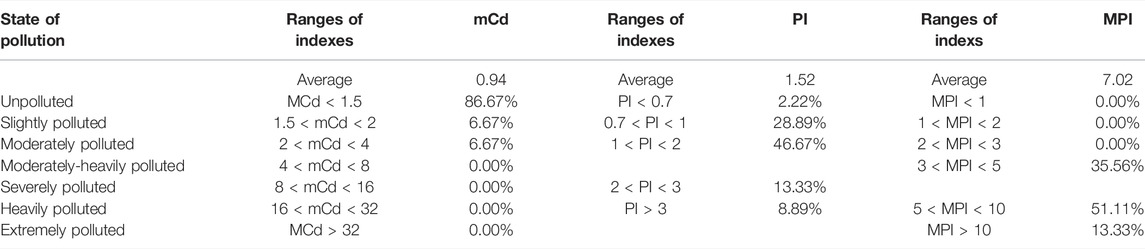
TABLE 6. Variations of evaluation results in the modified degree of contamination (mCd), pollution index (PI), and modified pollution index (MPI) percentage (%) in the surface sediments of the Jian and Moyang rivers.
3.5 Ecological Risk Assessment of Metals in Sediment
When compared with the reference limit values of TEC and PEC, the majority of the samples were below the PEC value, which is defined as the limit above which a toxic effect on aquatic can be expected. Only 4.44% of the Ni sediment samples for the Jian and Moyang rivers were above this level (Table 7). However, biological Ni, Cu, and Ni effects occur in 51.11%, 31.11%, and 4.44% of the sample, with values between TEC and PEC. Therefore, the application of SQGs to the sediment analyzed revealed that Pb, Ni, and Cu can potentially cause biological effects.
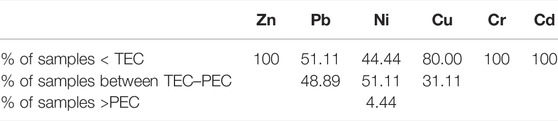
TABLE 7. Comparison between sediment quality guidelines (SQGs) and heavy metal concentrations (mg/kg) of all samples in Jian and Moyang rivers.
The Er calculated using CF showed that the heavy metals all have a low risk, except for Cd (Table 8). In the case of the study rivers, the Er with CF for Cd indicated moderate to considerate risk at 28.89% of the sample stations. Meanwhile, the average value of the Er with EF showed that only Cd had an ecological risk in the study area. The obtained results showed that the Er with EF for Pb, Ni, and Cu has moderate to considerable ecological risk in some sampling stations (20.00%, 15.56%, and 13.33%, respectively) (Table 8).
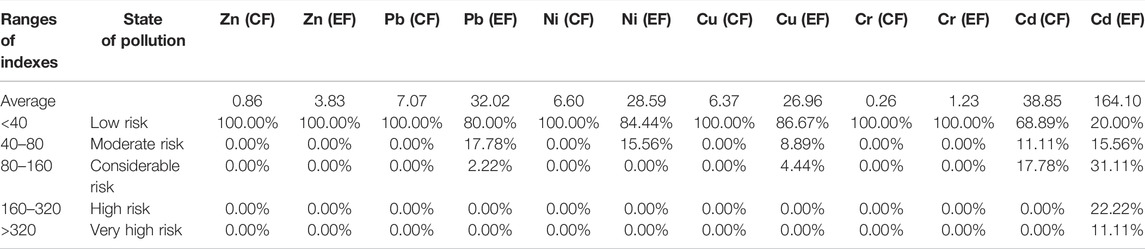
TABLE 8. Evaluation results in the potential ecological risk index of an individual element (Eri) with EF or CF percentage (%) in the surface sediments of the Jian and Moyang rivers.
The RI and MRI were computed (Figure 5). The RI values for the analyzed heavy metals were lower than 150, indicating that none of the sample stations has an ecological risk for the aquatic environment (Table 9), except for S10 and V22 (Group2). However, the mean values of the MRI indicated that moderate ecological risk occurred in Jian and Moyang rivers. In the case of the study area, 48.89% of the sample stations showed moderate risk. Moreover, the MPI values were more than 300 at 22.22% of the sample stations (group 1–1: S11 and S34; group1–2: S18 and S20; and group2: S10, S36, S39, S40, S42, and S43).
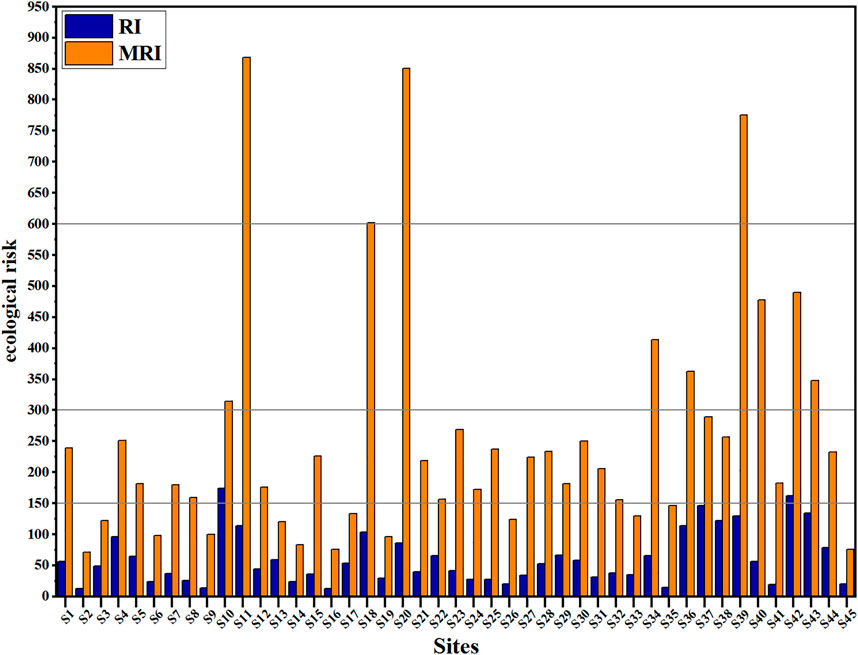
FIGURE 5. Sediment quality assessment by ecological risk assessment of metals in sediment. (RI: potential ecological risk index and MRI: modified ecological risk index).
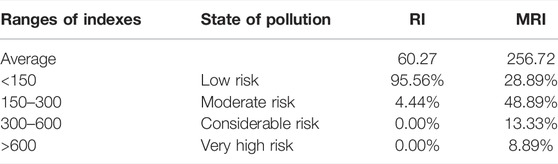
TABLE 9. Variations of evaluation results in the potential ecological risk index (RI) and modified ecological risk index (MRI) percentage (%) in the surface sediments of the Jian and Moyang rivers.
4 Discussion
4.1 Contamination and Risk Assessment
In this study, the mean values of the heavy metals in CF and EF showed that Pb, Ni, Cd, and Cu are moderate contaminants. This finding is similar to the results of related studies in the Pearl River Basin (Xiao et al., 2013; Zhao et al., 2016; Jiao et al., 2018). The Pb contamination can be linked to leaded gasoline (Al-Khashman, 2007) because the seriously impacted sample station S39 is close to the highway. The proximity of S10, S11, S18, S37, S42, and S43 to the farming area indicates that Cd contamination is a result of the application of pesticides and fertilizers (Gray et al., 1999). The considerate Cu contamination may have been caused by antifouling paints from a shipping yard and ferry activities near S22 (Duodu et al., 2016) and the use of Cu-containing insecticides and fungicides around S22, S37, and S39. Moreover, Cu contamination may be associated with traffic, such as tyre and brake wear because the affected sample station S39 was a road (Duodu et al., 2016). According to the SQGs, some sample stations may occasionally have biological Ni, Pb, and Cd effects. This result is similar to the research results in the Pearl River Basin (Niu et al., 2009; Xiao et al., 2013; Liao et al., 2017; Yao et al., 2021). The results of the potential ecological risk indices of each metal (Er) showed that all heavy metals are a low risk, except for Cd, based on the mean value in Er with (EF). This difference is probably related to the magnitude of toxicological response factors:1 for Zn; 2 for Cr; 5 for Cu, Pb, and Ni; and 30 for Cd (Hakanson 1980; Xu et al., 2008). Cd is highly toxic to living organisms (Kumar et al., 2018). Our study performed a PCA to extract a small number of latent factors to analyze the relationships amongst variables. The results of the PCA, in combination with the abovementioned research, on the sources of single heavy metals in the study are as follows. The first factor is dominated by Cr, Cu, Ni, Zn, and Pb, which are associated with a variety of polluted sources, such as transportation, agricultural, industrial, and natural sources. The second factor showed strong loadings of Mn and Fe, indicating a lithogenic contribution (Graney and Eriken, 2004). The third factor is characterized by Cd, demonstrating the impact of agricultural production.
To identify the groups of similar sample stations, CA was used to divide the sample sites in this study into groups 1–1, 1–2, and 2. In multi-element indices, S11, S23, and S25 (group 1–1), S18 and S20 (group 1–2), and S10, S17, S22, S36, S37, S38, S39, S40, S42, and S43 (group 2) are slightly to moderately polluted by mCd or severely polluted by PI or extremely polluted by MPI. This notion indicates that group 2 is the most prominent in heavy metal pollution. The analysis of the RI showed that moderate ecological risk occurs at S10 and S42 (group 2). The result of the MRI indicated that very high ecological risk occurs at S11 and S34 (group 1–1), S18 and S20 (group 1–2), and S10, S16, S39, S40, S42, and S43 (group 2). The comprehensive pollution of group 2 is more serious than that of group 1, and 65.16% of the sampling points with significant and very high Cd enrichment are located in group 2. This finding indicated that group 2 might be affected by agricultural production mainly located in the upper reaches of Moyang River. Although groups 1–1 and 1–2 have no significant difference in the proportion of high pollution values, the MRI evaluation results showed that group 1–1 was moderate and above an ecological pollution level, except S26, and 52.94% of the samples in group 1–2 are low risk. In the single element Indices, all the samples in group 1–1 have Cu and Ni significant enrichment, except S1 and S32. In combination with the sample distribution, group 1–1 is mainly affected by industrial production and urban activities. These findings suggest that continuous monitoring of Cd, Pb, Ni, and Cu in the river sediment of the Jian and Moyang rivers should be directed to evaluate the threat of these elements to the public health and to the ecology of the river under study. Agricultural pollution must be given attention, and the detection of industrial and urban pollution in river governance must be strengthened.
4.2 Use of Pollution Indices
The RI evaluates the combined pollution risk of an aquatic system through a toxic-response factor using CF. Although the CF, PI, and RI have been increasingly used in recent years, there are some limitations relating to their use. CF does not take into consideration lithogenic and sedimentary inputs of the element of interest. If the CF is used to determine the PI and RI, this could be a source of error when estuarine environments are considered because there are areas of intense sedimentation with significant input from terrestrial waterways (Brady et al., 2015; Duodu et al., 2016). To negate the effect of terrestrial sedimentary input, EF can be used to standardize the impact of terrestrial inputs by normalizing the element of interest against an element that has no anthropogenic source. An improved method for determining PI and the RI is proposed by using EF to calculate MPI and MRI, allowing for the non-conservative behaviour of sediments due to normalization against an element (Brady et al., 2015).
In this study, six heavy metal contaminants were used to calculate the CF, EF, mCd, PI, MPI, RI, and MRI. Although the CF and EF indicated heavy metal contamination in this study, EF appeared to detect contamination (at more sites and of more metals) better than CF in the worst-case scenario. The assessment of the CF values demonstrated that Cd was considered contamination in S11. Meanwhile, this sample station has extremely high enrichment based on the EF. This finding suggests that the use of EF is more sensitive to monitoring heavy metal pollution because it can normalize the impact of terrestrial sedimentary inputs to provide more useful information. Similar results were obtained in earlier studies (Duodu et al., 2016; Kumar et al., 2018), wherein EF could detect terrestrial sedimentary inputs of metals due to the normalization. In multi-element indices, the mCd values for 86.67% of the sample stations indicate unpolluted, whilst PI overestimates the risk at all sites and indicates that only 2.22% of the sample stations are unpolluted. The weighted average rather than just the average CF of PI makes a more likely, higher value for the index, and the trigger thresholds are lower than those for the other indices (Brady et al., 2015). Accordingly, the PI is more likely to identify high levels of contamination for a suite of elements. The results of MPI also indicated that the sample stations were affected by multiple contaminations. However, MPI shows more sample points with high values. According to the ecological risk assessment of the metals in the sediment, the RI showed no ecological risk for the aquatic environment, except for S10 and V22. However, the MRI values indicated that 71.11% of the sample stations were at moderate to very high ecological risk. Therefore, the MPI and MRI, which are calculated from EF, can more sensitively detect pollution in this study than PI and MRI. The results of the study would be valuable for researchers in environmental quality evaluation, and the applied methods applied can be used for pollution assessment in other environments.
4.3 Pollution Assessment in Small Rivers
Environmental conditions are complicated, with towns, villages, and farmland on both sides of small rivers. Small rivers have been used as a drainage channel for intensive runoff in densely populated urban areas or as a water source in agricultural areas (Lee et al., 2022). Once polluted, small rivers are difficult to recover because they are low in volume, slow in flow, and heavily silted. If small rivers are polluted, then the pollutants flow into large rivers and oceans, affecting ecological security. In comparison with big rivers, small rivers are more sensitive to changes in the surrounding environment and capable of tending to human activities and natural factors (Zhou et al., 2020). Therefore, precise metal source identification, distribution, and pollution characterization are particularly important in small rivers.
The findings of Nasrabadi et al. (2010), Giri et al. (2013), Li et al. (2014), Wu et al. (2017), and Arisekar et al. (2022) on the small-scale rivers indicate the impact of anthropogenic agents on the heavy metal abundance in Xiaoyang, Thamirabarani, Subarnarekha, Lianshan, Wuli, and Cishan river sediments. Wu et al. (2017) showed that anthropogenic input is associated with urban development, especially industrial intensification. Giri et al. (2013) confirmed that the increased concentration of metals in the Subarnarekha River is due to the direct discharge of industrial, urban, and mining wastes into the river. However, Arisekar et al. (2022) highlighted that the high level of pollution was influenced by agricultural runoff. According to this study, the Moyang and Jian rivers are moderately to very highly contaminated with Pb, Ni, Cd, and Cu metals when the CF, EF, mCd, PI, MPI, RI, and MRI values are taken into consideration. When combined with PA and PCA, we concluded that the increased concentrations of metals in the sediment of the Moyang and Jian rivers are due to the discharge of agricultural, industrial, and urban wastes into the river. Therefore, small rivers can be susceptible to the influence of human activities, which must be addressed.
5 Conclusion
The concentrations of metals in the Jian and Moyang rivers’ sediment are presented in this study. Two single contamination indices (EF and CF) were used to assess the sediment quality in addition to the three multi-element indices (mCd, PI, and MPI). The river sediment was slightly to extremely polluted. The SQGs revealed that Pb, Ni, and Cu have potential biological effects. MPI, which took into consideration the lithogenic and sedimentary inputs of the element of interest, indicated that most sampling points have moderate to very high ecological risks. CA and PCA showed that pollution in this study area is primarily caused by anthropogenic activities (agricultural pollution, industrial effluents, and sewage discharge). Our study found that both sides of small rivers are vulnerable to being polluted by production activities, which must be taken seriously. In comparison with the various evaluation methods, the indices calculated from EF detect pollution more sensitively and may also be used to assess pollution in other environments.
Data Availability Statement
The original contributions presented in the study are included in the article/Supplementary Material; further inquiries can be directed to the corresponding author.
Author Contributions
JF: conception, experimentation, analysis of data, and writing—original draft; YL: pretreatment of samples and experimentation; ML: collection of samples, experimentation, and data analysis; TO: conception, methodology, and writing—review and editing; MY: collection of samples, conception, data curation, methodology, and writing—review and editing.
Funding
This research was funded by the Natural Science Foundation of Guangdong Province (Grant Nos. 2018B030311056 and 2019A1515110195).
Conflict of Interest
The authors declare that the research was conducted in the absence of any commercial or financial relationships that could be construed as a potential conflict of interest.
Publisher’s Note
All claims expressed in this article are solely those of the authors and do not necessarily represent those of their affiliated organizations, or those of the publisher, the editors, and the reviewers. Any product that may be evaluated in this article, or claim that may be made by its manufacturer, is not guaranteed or endorsed by the publisher.
Supplementary Material
The Supplementary Material for this article can be found online at: https://www.frontiersin.org/articles/10.3389/fenvs.2022.927765/full#supplementary-material
References
Ahmed, F., Fakhruddin, A. N. M., Imam, M. D. T., Khan, N., Khan, T. A., Rahman, M. M., et al. (2016). Spatial Distribution and Source Identification of Heavy Metal Pollution in Roadside Surface Soil: a Study of Dhaka Aricha Highway, Bangladesh. Ecol. Process 5 (1). doi:10.1186/s13717-016-0045-5
Akcay, H., Oguz, A., and Karapire, C. (2003). Study of Heavy Metal Pollution and Speciation in Buyak Menderes and Gediz River Sediments. Water Res. 37 (4), 813–822. doi:10.1016/s0043-1354(02)00392-5
Al-Khashman, O. A. (2007). Determination of Metal Accumulation in Deposited Street Dusts in Amman, Jordan. Environ. Geochem Health 29 (1), 1–10. doi:10.1007/s10653-006-9067-8
Arisekar, U., Shakila, R. J., Shalini, R., Jeyasekaran, G., Keerthana, M., Arumugam, N., et al. (2022). Distribution and Ecological Risk Assessment of Heavy Metals Using Geochemical Normalization Factors in the Aquatic Sediments. Chemosphere 294, 133708. doi:10.1016/j.chemosphere.2022.133708
Bergamaschi, L., Rizzio, E., Valcuvia, M. G., Verza, G., Profumo, A., and Gallorini, M. (2002). Determination of Trace Elements and Evaluation of Their Enrichment Factors in Himalayan Lichens. Environ. Pollut. 120 (1), 137–144. doi:10.1016/s0269-7491(02)00138-0
Brady, J. P., Ayoko, G. A., Martens, W. N., and Goonetilleke, A. (2015). Development of a Hybrid Pollution Index for Heavy Metals in Marine and Estuarine Sediments. Environ. Monit. Assess. 187 (5). doi:10.1007/s10661-015-4563-x
Budianta, W. (2020). Heavy Metal Pollution and Mobility of Sediment in Tajum River Caused by Artisanal Gold Mining in Banyumas, Central Java, Indonesia. Environ. Sci. Pollut. Res. 28 (7), 8585–8593. doi:10.1007/s11356-020-11157-5
Chen, W. T. (2014). Analysis on the Status Quo and Water Quality Change Trend of Water Functional Zones in the Moyang River Basin. Guangdong Water Resour. Hydropower (10), 31–34. doi:10.11905/j.issn.1008-0112.2014.10.009
Davutluoglu, O. I., Seckin, G., Ersu, C. B., Yilmaz, T., and Sari, B. (2011). Heavy Metal Content and Distribution in Surface Sediments of the Seyhan River, Turkey. J. Environ. Manag. 92 (9), 2250–2259. doi:10.1016/j.jenvman.2011.04.013
Duodu, G. O., Goonetilleke, A., and Ayoko, G. A. (2016). Comparison of Pollution Indices for the Assessment of Heavy Metal in Brisbane River Sediment. Environ. Pollut. 219, 1077–1091. doi:10.1016/j.envpol.2016.09.008
Fu, J., Hu, X., Tao, X., Yu, H., and Zhang, X. (2013). Risk and Toxicity Assessments of Heavy Metals in Sediments and Fishes from the Yangtze River and Taihu Lake, China. Chemosphere 93 (9), 1887–1895. doi:10.1016/j.chemosphere.2013.06.061
Gaiero, D. M., Ross, G. R., Depetris, P. J., and Kempe, S. (1997). Spatial and Temporal Variability of Total Non-residual Heavy Metals Content in Stream Sediments from the Suquia River System, Cordoba, Argentina. Water Air Soil Pollut. 93 (1-4), 303–319. doi:10.1007/bf02404763
Giri, S., Singh, A. K., and Tewary, B. K. (2013). Source and Distribution of Metals in Bed Sediments of Subarnarekha River, India. Environ. Earth Sci. 70 (7), 3381–3392. doi:10.1007/s12665-013-2404-1
Graney, J. R., and Eriksen, T. M. (2004). Metals in Pond Sediments as Archives of Anthropogenic Activities: a Study in Response to Health Concerns. Appl. Geochem. 19 (7), 1177–1188. doi:10.1016/j.apgeochem.2004.01.014
Gray, C. W., McLaren, R. G., Roberts, A. H. C., and Condron, L. M. (1999). The Effect of Long-Term Phosphatic Fertiliser Applications on the Amounts and Forms of Cadmium in Soils under Pasture in New Zealand. Nutrient Cycl. Agroecosyst. 54 (3), 267–277. doi:10.1023/A:1009883010490
Hakanson, L. (1980). An Ecological Risk Index for Aquatic Pollution control.a Sedimentological Approach. Water Res. 14 (8), 975–1001. doi:10.1016/0043-1354(80)90143-8
He, M., Wang, Z., and Tang, H. (1997). Spatial and Temporal Patterns of Acidity and Heavy Metals in Predicting the Potential for Ecological Impact on the Le an River Polluted by Acid Mine Drainage. Sci. Total Environ. 206 (1), 67–77. doi:10.1016/s0048-9697(97)00217-9
Hoang, H.-G., Lin, C., Chiang, C.-F., Bui, X.-T., Lukkhasorn, W., Bui, T.-P. -T., et al. (2021). The Individual and Synergistic Indexes for Assessments of Heavy Metal Contamination in Global Rivers and Risk: a Review. Curr. Pollut. Rep. 7, 247–262. doi:10.1007/s40726-021-00196-2
Islam, M. S., Hossain, M. B., Matin, A., and Islam Sarker, M. S. (2018). Assessment of Heavy Metal Pollution, Distribution and Source Apportionment in the Sediment from Feni River Estuary, Bangladesh. Chemosphere 202, 25–32. doi:10.1016/j.chemosphere.2018.03.077
Jiao, Z., Li, H., Song, M., and Wang, L. (2018). Ecological Risk Assessment of Heavy Metals in Water and Sediment of the Pearl River Estuary, China. IOP Conf. Ser. Mat. Sci. Eng. 394, 052055. doi:10.1088/1757-899x/394/5/052055
Kang, D., Zheng, G., Yu, J., Chen, Q., Zheng, X., Zhong, J., et al. (2021). Hydropower Reservoirs Enhanced the Accumulation of Heavy Metals towards Surface Sediments and Aggravated Ecological Risks in Jiulong River Basin, China. J. Soils Sediments 21 (10), 3479–3492. doi:10.1007/s11368-021-03002-0
Kang, M., Tian, Y., Zhang, H., and Lan, Q. (2020). Distribution, Ecological Risk Assessment, and Source Identification of Heavy Metals in River Sediments from Hai River and its Tributaries, Tianjin, China. Water Air Soil Pollut. 231 (2), 1–14. doi:10.1007/s11270-020-4404-6
Karbassi, A. R., Monavari, S. M., Nabi Bidhendi, G. R., Nouri, J., and Nematpour, K. (2007). Metal Pollution Assessment of Sediment and Water in the Shur River. Environ. Monit. Assess. 147 (1-3), 107–116. doi:10.1007/s10661-007-0102-8
Ke, X., Gui, S., Huang, H., Zhang, H., Wang, C., and Guo, W. (2017). Ecological Risk Assessment and Source Identification for Heavy Metals in Surface Sediment from the Liaohe River Protected Area, China. Chemosphere 175, 473–481. doi:10.1016/j.chemosphere.2017.02.029
Kumar, V., Sharma, A., Bhardwaj, R., and Thukral, A. K. (2018). Temporal Distribution, Source Apportionment, and Pollution Assessment of Metals in the Sediments of Beas River, India. Hum. Ecol. Risk Assess. Int. J. 24 (8), 2162–2181. doi:10.1080/10807039.2018.1440529
Lee, H.-S., Lim, S.-J., Lim, B.-R., Kim, H.-S., Lee, H.-S., Ahn, T.-U., et al. (2022). Spatiotemporal Evaluation of Water Quality and Hazardous Substances in Small Coastal Streams According to Watershed Characteristics. Ijerph 19 (2), 634. doi:10.3390/ijerph19020634
Li, X., Liu, L., Wang, Y., Luo, G., Chen, X., Yang, X., et al. (2014). Integrated Assessment of Heavy Metal Contamination in Sediments from a Coastal Industrial Basin, N. E. China. Heavy Metal Contam. Water Soil, 157–182. doi:10.1201/b16566-10
Liang, X., Li, J., Guo, G., Li, S., Gong, Q., Zhang, F. Y., et al. (2021). Evaluation for Water Resource System Efficiency and Influencing Factors in Western China: A Two-Stage Network DEA-Tobit Model. J. Clean. Prod. 328 (6), 129674–129828. doi:10.1016/j.jclepro.2021.129674
Liao, J., Chen, J., Ru, X., Chen, J., Wu, H., and Wei, C. (2017). Heavy Metals in River Surface Sediments Affected with Multiple Pollution Sources, South China: Distribution, Enrichment and Source Apportionment. J. Geochem. Explor. 176, 9–19. doi:10.1016/j.gexplo.2016.08.013
Liu, J., Li, S., Zhu, J., Li, Z. J., Wang, P., and Wu, N. D. (2018). Discussion on the Harm to Human Body by Several Kinds of Heavy Metal Elements and Preventive Measures. China Resour. Compr. Util. 9, 2528–2531. doi:10.3969/j.issn.1008-9500.2018.03.064
Lu, T., Lin, Q., Ke, C., Sun, R., Pan, D. B., Hong, X. Y., et al. (2013). Polycyclic Aromatic Hydrocarbons and Risk Assessment in the Surface Sediments from Lingdingyang, Pearl River Estuary. J. Fish. Sci. China 19 (6), 336–347. doi:10.3724/sp.j.1118.2012.00336
MacDonald, D. D., Ingersoll, C. G., and Berger, T. A. (2000). Development and Evaluation of Consensus-Based Sediment Quality Guidelines for Freshwater Ecosystems. Archives Environ. Contam. Toxicol. 39 (1), 20–31. doi:10.1007/s002440010075
Malik, N., Biswas, A. K., Qureshi, T. A., Borana, K., and Virha, R. (2009). Bioaccumulation of Heavy Metals in Fish Tissues of a Freshwater Lake of Bhopal. Environ. Monit. Assess. 160 (1-4), 267–276. doi:10.1007/s10661-008-0693-8
Mohiuddin, K., Alam, M., Ahmed, I., and Chowdhury, A. (2016). Heavy Metal Pollution Load in Sediment Samples of the Buriganga River in Bangladesh. J. Bangladesh Agric. Univ. 13 (2), 229–238. doi:10.3329/jbau.v13i2.28784
Muller, G. (1981). The Heavy Metal Pollution of the Sediments of Neckars and its Tributary: a Stocktaking. Chem. Zeit 105, 157–164. doi:10.3406/bch.1981.1937
Nasrabadi, T., Nabi Bidhendi, G., Karbassi, A., and Mehrdadi, N. (2010). Evaluating the Efficiency of Sediment Metal Pollution Indices in Interpreting the Pollution of Haraz River Sediments, Southern Caspian Sea Basin. Environ. Monit. Assess. 171 (1-4), 395–410. doi:10.1007/s10661-009-1286-x
Nemerow, N. L. (1991). Stream, Lake, Estuary, and Ocean Pollution. New York, NY: Van Nostrand Reinhold.
Niu, H., Deng, W., Wu, Q., and Chen, X. (2009). Potential Toxic Risk of Heavy Metals from Sediment of the Pearl River in South China. J. Environ. Sci. 21 (8), 1053–1058. doi:10.1016/s1001-0742(08)62381-5
Omwene, P. I., Öncel, M. S., Çelen, M., and Kobya, M. (2018). Heavy Metal Pollution and Spatial Distribution in Surface Sediments of Mustafakemalpaşa Stream Located in the World's Largest Borate Basin (Turkey). Chemosphere 208, 782–792. doi:10.1016/j.chemosphere.2018.06.031
Salati, S., and Moore, F. (2009). Assessment of Heavy Metal Concentration in the Khoshk River Water and Sediment, Shiraz, Southwest Iran. Environ. Monit. Assess. 164 (1-4), 677–689. doi:10.1007/s10661-009-0920-y
Shafie, N. A., Aris, A. Z., and Haris, H. (2014). Geoaccumulation and Distribution of Heavy Metals in the Urban River Sediment. Int. J. Sediment Res. 29 (3), 368–377. doi:10.1016/s1001-6279(14)60051-2
Shi, C. Y., Liang, M., and Feng, B. (2016). Average Background Values of 39 Chemical Elements in Stream Sediments of China. Earth Sci. 41 (2), 234–251. doi:10.3799/dqkx.2016.018
Siddiqui, E., and Pandey, J. (2019). Assessment of Heavy Metal Pollution in Water and Surface Sediment and Evaluation of Ecological Risks Associated with Sediment Contamination in the Ganga River: a Basin-Scale Study. Environ. Sci. Pollut. Res. 26, 10926–10940. doi:10.1007/s11356-019-04495-6
Sutherland, R. A. (2000). Bed Sediment-Associated Trace Metals in an Urban Stream, Oahu, Hawaii. Environ. Geol. 39 (6), 611–627. doi:10.1007/s002540050473
Tang, W. Z., Wang, L. S., and Shan, B. Q. (2015). Speciation Distribution of Heavy Metal in the Surface Sediments of a Typical Urban River (Liangshui River System). Acta Scien Circum 35 (12), 3898–3905. doi:10.13671/j.hjkxxb.2015.0021
Vaezi, A. R., Karbassi, A. R., and Fakhraee, M. (2015). Assessing the Trace Metal Pollution in the Sediments of Mahshahr Bay, Persian Gulf, via a Novel Pollution Index. Environ. Monit. Assess. 187 (10). doi:10.1007/s10661-015-4833-7
Wei, B., and Yang, L. (2010). A Review of Heavy Metal Contaminations in Urban Soils, Urban Road Dusts and Agricultural Soils from China. Microchem. J. 94 (2), 99–107. doi:10.1016/j.microc.2009.09.014
Wei, X., Han, L., Gao, B., Zhou, H., Lu, J., and Wan, X. (2016). Distribution, Bioavailability, and Potential Risk Assessment of the Metals in Tributary Sediments of Three Gorges Reservoir: The Impact of Water Impoundment. Ecol. Indic. 61, 667–675. doi:10.1016/j.ecolind.2015.10.018
Wu, S.-S., Han, R.-M., Yang, H., Bi, F.-Z., Wang, Q.-J., and Wang, Y.-H. (2017). Characterization of Metals in Surface Sediments from Xiaoyang River, Jiangsu, China. Anal. Lett. 50 (10), 1669–1690. doi:10.1080/00032719.2016.1241800
Xiao, R., Bai, J., Huang, L., Zhang, H., Cui, B., and Liu, X. (2013). Distribution and Pollution, Toxicity and Risk Assessment of Heavy Metals in Sediments from Urban and Rural Rivers of the Pearl River Delta in Southern China. Ecotoxicology 22 (10), 1564–1575. doi:10.1007/s10646-013-1142-1
Xu, R., Ni, S. J., Tuo, X. G., and Zhang, C. J. (2008). Progress in Nanoparticles Characterization: Sizing and Zeta Potential Measurement. Particuology 6 (2), 112–115. doi:10.3969/j.issn.1003-6504.2008.02.03010.1016/j.partic.2007.12.002
Yao, X., Luo, K., Niu, Y., Li, Y., and Ren, B. (2021). Ecological Risk from Toxic Metals in Sediments of the Yangtze, Yellow, Pearl, and Liaohe Rivers, China. Bull. Environ. Contam. Toxicol. 107 (1), 140–146. doi:10.1007/s00128-021-03229-0
Yongming, H., Peixuan, D., Junji, C., and Posmentier, E. (2006). Multivariate Analysis of Heavy Metal Contamination in Urban Dusts of Xi'an, Central China. Sci. Total Environ. 355 (1-3), 176–186. doi:10.1016/j.scitotenv.2005.02.026
Yuan, X., Zhang, L., Li, J., Wang, C., and Ji, J. (2014). Sediment Properties and Heavy Metal Pollution Assessment in the River, Estuary and Lake Environments of a Fluvial Plain, China. CATENA 119, 52–60. doi:10.1016/j.catena.2014.03.008
Zhang, W. J. (2020). Analysis of Design Strategy of Agricultural Tourism Park in Western Guangdong. Contemp. Hortic. (20), 67–68. doi:10.3969/j.issn.1006-4958.2020.20.033
Zhang, Y. Y. (2013). Reflections on the Economic Development of Guangdong and the West of Guangdong. Sci-Tech Dev. Enterp. 13, 7–9. doi:10.3969/j.issn.1674-0688.2013.13.003
Zhao, G., Ye, S., Yuan, H., Ding, X., and Wang, J. (2016). Surface Sediment Properties and Heavy Metal Pollution Assessment in the Pearl River Estuary, China. Environ. Sci. Pollut. Res. 24 (3), 2966–2979. doi:10.1007/s11356-016-8003-4
Keywords: surface sediment quality, pollution indices, modified ecological risk index, principal component analysis, cluster analysis, spatial distribution, Jian and Moyang rivers, Western Guangdong
Citation: Feng J, Lin Y, Li M, Ouyang T and Yu M (2022) Characterization and Risk Assessment of Heavy Metals in Surface Sediments From Jian and Moyang Rivers in Western Guangdong. Front. Environ. Sci. 10:927765. doi: 10.3389/fenvs.2022.927765
Received: 25 April 2022; Accepted: 16 June 2022;
Published: 19 August 2022.
Edited by:
Zhenzhong Zeng, Southern University of Science and Technology, ChinaReviewed by:
Venkatramanan Senapathi, Alagappa University, IndiaOmowunmi H. Fred-Ahmadu, Covenant University, Nigeria
Copyright © 2022 Feng, Lin, Li, Ouyang and Yu. This is an open-access article distributed under the terms of the Creative Commons Attribution License (CC BY). The use, distribution or reproduction in other forums is permitted, provided the original author(s) and the copyright owner(s) are credited and that the original publication in this journal is cited, in accordance with accepted academic practice. No use, distribution or reproduction is permitted which does not comply with these terms.
*Correspondence: Mingjie Yu, eXVtakBtLnNjbnUuZWR1LmNu