 Stephanie N. Merbt1,2*
 Alexandra Kroll3
 Manu Tamminen4
 Patrick A. Rühs5Bettina Wagner1Linn Sgier1
 Olga Sembalova6Bernd Abel7,8
 Ahmed Tlili1
 Kristin Schirmer1,9,10*Renata Behra1,11
- 1Eawag–Swiss Federal Institute of Aquatic Science and Technology, Dübendorf, Switzerland
- 2CEAB.CSIC Centre d’Estudis Avançats de Blanes (CEAB-CSIC), Blanes, Spain
- 3Oekotoxzentrum, c/o Eawag–Swiss Federal Institute of Aquatic Science and Technology, Dübendorf, Switzerland
- 4Department of Biology, University of Turku, Turku, Finland
- 5Complex Materials, Department of Materials, ETH Zurich, Zurich, Switzerland
- 6Laboratory for Advanced Analytical Technologies, EMPA, Dübendorf, Switzerland
- 7Leibniz-Institute of Surface Engineering (IOM), Leipzig, Germany
- 8Wilhelm-Ostwald-Institut für Physikalische und Theoretische Chemie, Leipzig, Germany
- 9Institute of Biogeochemistry and Pollutant Dynamics, ETH Zürich, Zürich, Switzerland
- 10EPF Lausanne, School of Architecture, Civil and Environmental Engineering, Lausanne, Switzerland
- 11Aegetswil 4, Wila, Switzerland
Periphyton is a freshwater biofilm composed of prokaryotic and eukaryotic communities that occupy rocks and sediments, forming the base of the food web and playing a key role in nutrient cycling. Given the large surface that periphyton comprises, it may also act as a sink for a diverse range of man-made pollutants, including microplastics (MP). Here we investigated the effect of 1–4 μm and 63–75 µm sized, spherical polyethylene MP with native and ultraviolet (UV)-weathered surface on developing natural stream periphyton communities over 28 days. In order to ensure proper particle exposure, we first tested MP suspension in water or in water containing either Tween 80, extracellular polymeric substances – EPS, fulvic acids, or protein. We found the extract of EPS from natural periphyton to be most suitable to create MP suspensions in preparation of exposure. Upon exposure, all tested types of MP were found to be associated with the periphyton, independent of their size and other properties. While biomass accrual and phenotypic community structure of the photoautotrophs remained unchanged, the prokaryotic and eukaryotic communities experienced a significant change in composition and relative abundances. Moreover, alpha diversity was affected in eukaryotes, but not in prokaryotes. The observed changes were more prominent in periphyton exposed to UV-treated as compared with native surface MP. Mechanical properties, as assessed by compression rheology, showed that MP-exposed periphyton had longer filamentous streamers, higher stiffness, lower force recovery and a higher viscoelasticity than control periphyton. Despite the observed structural and mechanical changes of periphyton, functional parameters (i.e., photosynthetic yield, respiration and nutrient uptake efficiencies) were not altered by MP, indicating the absence of MP toxicity, and suggesting functional redundancy in the communities. Together, our results provide further proof that periphyton is a sink for MP and demonstrate that MP can impact local microbial community composition and mechanical properties of the biofilms. Consequences of these findings might be a change in dislodgement behavior of periphyton, a propagation through the food chains and impacts on nutrient cycling and energy transfer. Hence, taking the omnipresence, high persistence and material and size diversity of MP in the aquatic environment into account, their ecological consequences need further investigation.
Introduction
Microplastics (MP) are solid particles of polymeric matrix in the size range of 1 μm–5 mm. They are either intentionally produced (primary MP) for use, for example, in cosmetics and paints, or are generated as secondary MP from fragmentation of larger plastic debris, for example, by UV-oxidation, mechanical abrasion and/or biodegradation (Verschoor, 2015; Frias and Nash, 2019). Despite a persistent lack of standardized MP identification and quantification methods, which hampers comparability among data sets (Shim et al., 2017; Abdolahpur Monikh et al., 2022), many monitoring studies showed the ubiquitous abundance of MP in different environments. For instance, MP have been detected in freshwater (Li et al., 2018), marine (Galloway et al., 2017), and terrestrial environments (Rillig and Lehmann, 2020) and found to enter even the most remote areas (e.g., Alps, arctic (Bergmann et al., 2019), and deep-sea sediments (Van Cauwenberghe et al., 2013). However, impacts of the presence of MP on environmental and ecological processes remain largely unresolved (Ockenden et al., 2021).
MP reach the aquatic environment via aerial deposition, storm water runoff or wastewater treatment plant effluents (Horton and Dixon, 2018). Once in rivers and streams, MP can be retained in the river bed (Hurley et al., 2018) by entering the hyporheic zones (Drummond et al., 2020) and concentrating in stream biofilms (Huang et al., 2021). Such biofilm communities, also known as periphyton, are complex mixtures of prokaryotes and eukaryotes, including microalgae, cyanobacteria, and heterotrophic microorganisms, attached to submerged surfaces. Indeed, Sgier et al. (2016) detected MP in periphyton downstream of a wastewater treatment plant when examining stream biofilm composition using individual cell-based analysis. Yet, little is known about the interaction of MP and periphyton despite its importance as the base of the food web (Guo et al., 2022), nutrient cycling (Battin et al., 2003; Battin et al., 2016), and its role as early warning systems for contamination detection (Montuelle et al., 2010). The only prior study to examine the interactions of MP and periphyton reported negligible effects on certain periphyton parameters in short-term (3 h) exposures: chlorophyll a, photosynthetic yield, extracellular enzymatic activity of ß-glucosidase, leucine aminopeptidase, alkaline phosphatase (Miao et al., 2019). Only plastic particles in the nanosize (NP) in a high concentration (100 nm, 100 mg L−1) led to a decrease of chlorophyll a content and the activity of ß-glucosidase and leucine aminopeptidase, and induced oxidative stress (Miao et al., 2019). However, there are no reports on effects of MP on periphyton following long-term exposures, as was highlighted also by a recent review (Kalčíková and Bundschuh, 2021).
Peripyhton organisms form complex three-dimensional structures embedded in a matrix of extracellular polymeric substances (EPS) (Lock et al., 1984). These polymeric substances may aid in suspending MP (Balakrishnan et al., 2019). Next, MP can interact with periphyton organisms. Thus far, effects on periphyton communities are unknown; however, results from studies with microalgae showed lower growth rate (Yang et al., 2020) and photosynthetic efficiency (Mao et al., 2018) with decreasing MP size suggesting MP size as an important parameter ruling MP-cell interactions. Moreover, considering that the surface of MP can serve as a substrate or attachment of microorganisms (Zettler et al., 2013; McCormick et al., 2014), MP can be hypothesized to affect periphyton community composition by selecting for specific taxa. MP surface characteristics, for example, weathering state and with this hydrophobicity and roughness, have been also shown to impact the attachment of microorganisms (Kelly et al., 2020; Rummel et al., 2021). Different surface properties may therefore influence community composition differently. Finally, it can be envisioned that MP, when incorporated into periphyton, affect the mechanical properties of the biofilm, such as its stiffness and viscoelasticity. Both these properties are related to biofilm architecture. Architecture is defined by a base (substrate attached) and a streamer (floating in the water column) zone (Besemer et al., 2009), both of which comprise important factors for how periphyton breaks up and disperses under perturbations (Lopez-Sanchez et al., 2014; Battin et al., 2016).
In the present study, we set out to examine the interaction of MP with periphyton growing over 28 days from microorganisms stemming from a natural stream. Maturing periphyton was exposed to spherical polyethylene (PE) MP of two different size ranges (1–4 μm and 63–75 µm in diameter), in native and UV-weathered (aged) forms. Dispersion experiments identified EPS to be the most suitable to maintain a relatively homogeneous particle suspension for subsequent exposure experiments of the biofilm. At three time points, peripyhton structural (community composition and abundance of its members), functional (photosynthetic yield, respiration, nitrogen uptake rates), and mechanical (stiffness, viscoelasticity) properties were measured. This is the first long-term periphyton-MP interaction study revealing a variety of structural and mechanical changes in the periphyton while functional properties were found to be maintained.
Materials and Methods
Materials
Three spherical MP particle types were purchased from Cospheric (United States) as dry powder with characteristics and terminology as shown in Table 1. MP size ranges were selected to be either similar/smaller (sMP, rMP) or bigger (bMP) than periphyton organisms (Supplementary Figure S1). Fulvic acids (Suwannee River I standard) were purchased at the International Humic Substances Society (United States). All other chemicals were purchased from Sigma-Aldrich (Buchs SG, Switzerland) unless indicated otherwise.
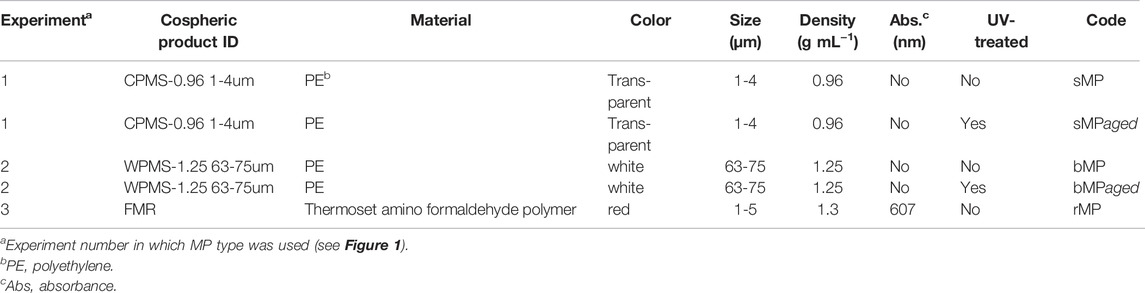
TABLE 1. Physical and chemical properties of the microplastic particles (MP) used in this study.
MP Aging, Dispersion, and Characterization
The surface of both smaller (sMP) and bigger (bMP) was altered by UV irradiation in closed glass Petri dishes placed in a weathering chamber (Q-Sun XE-3 Xenon Test Chamber, Q-Lab, Germany). The weathering chamber was equipped with a Xenon light source with a power of 0.55 W m−2 and a wavelength of 340 nm. UV irradiation was stopped after considerable surface changes were observable by electron microscopy (1248 h of UV irradiation). UV exposure lasted 1248 h at 65 ± 3°C (black standard temperature for polymers). To maintain humidity in the dishes, MP were moistened once a week with deionized water. In the following, sMPaged and bMPaged refers to the UV-treated sMP and bMP (Table 1).
The effect of UV exposure on sMP and bMP surface structure was characterized by scanning electron microscopy (SEM) and attenuated total reflectance Fourier transform infrared (ATR-FTIR) measurements. The SEM images were taken using an ULTRA 55 (Carl Zeiss SMT) microscope. An accelerating voltage of 2 kV was applied. The ATR-FTIR measurements were performed using a Cary 640 FTIR spectrometer (Agilent) with a diamond ATR accessory type IIa synthetic diamond crystal (penetration depth of ∼2 µm). The spectra were recorded in a frequency range of 4000–600 cm−1 with a spectral resolution of 4 cm−1. A total of 128 scans were co-added for every spectrum. The background was measured with the same settings against air. The spectrometer was controlled by Agilent Resolutions Pro software 5.2.0.
With the objective to disperse MP in aqueous solution, different suspension agents were tested for their ability to suspend and stabilize the particles in water: Tween 80 (0.01% w/w), bovine serum albumin (BSA, 5 mg mL−1), starch (5 mg mL−1), standard fulvic acids (FA, 40 mg mL−1), and an extract of periphyton extracellular polymeric substances (EPS, for isolation see section on Periphyton colonization and EPS extraction below) (Supplementary Figure S2). Briefly, 18 mg of bMP, and 10 mg of sMP and rMP were weighted into a 20 mL glass vial, and 10 mL of the respective medium was added to bMP and sMP. For rMP, only EPS extract was tested. The respective vials were sonicated for 30 s in an ultrasonic bath (45 kHz, 60 W, VWR Ultrasonic Cleaner) and vortexed. The vials were then sampled (20 µL) in reposing state at a fixed height after 10, 30, 60, and 300 s. To determine the MP behavior after a longer period, rMP concentrations in the EPS-derived suspensions were additionally measured after 15 and 80 min. To quantify the particle concentrations in the subsamples, two different instruments were used to account for the size restrictions of the respective hardware: a CASY cell counter Model TT (Roche 468 Innovatis AG) was used for sMP and rMP (smaller size range) while a Multisizer II (Beckmann Coulter, Fullerton, CA, United States) was used for bMP (larger size range). Since the resulting suspensions contained visible aggregates sticking to the glass walls of the vials, we calculated MP dispersion as the percentage of the initially weighted number of MP. Results showed that in all suspensions, no more than 12% of sMP and rMP and 36% of bMP of the initially weighted particles were dispersed (Supplementary Figure S2). Overall, EPS yielded the best dispersion in terms of % MP over time and was therefore used for all exposure experiments.
Periphyton Colonization and EPS Extraction
For the 1) inoculation of the MP exposure experiments and 2) the extraction of EPS as medium for MP suspensions, periphyton was grown from a natural stream water as described previously by Gil-Allué et al. (2015). Briefly, water from the Chriesbach in Dübendorf, Switzerland, was pumped through indoor, flow-through channels that held 80 microscope slides (76 × 26 mm) in vertical direction aligned with the water flow. After 21 days, the colonized slides were sampled and periphyton was scraped off the slides and transferred into a glass beaker (250 mL).
To create the stock suspension for the inoculation of the microcosms (see section on Design of exposure experiments below), periphyton was suspended in synthetic freshwater medium that was designed to closely mimic creek water elemental composition (PERIQUIL, Supplementary Table S1; Stewart et al., 2013). Periphyton concentration was adjusted to an optical density (OD) of 4 at a wavelength of λ = 645 nm (Cary 100 Thermo Fisher spectrophotometer, Kontron Instruments, Basel, Switzerland).
For the extraction of EPS, periphyton of three glass slides was dispersed in 3 mL of 2 mM sodium hydrogen carbonate, sonicated for 30 s in an ultrasonic bath, before adjusting the OD to four. Subsequently, this periphyton suspension was centrifuged at 1880 x g for 10 min and the supernatant filtered (0.2 µm pore size, Whatmann) into a sterile Falcon tube as previously described (Stewart et al., 2013). The remaining periphyton pellet was again suspended in 3 mL of 2 mM sodium hydrogen carbonate, sonicated, and centrifuged as described above. The supernatant of the second extraction step was filtered via 0.2 µm filters into a sterile Falcon tube. This suspension is subsequently referred to as “EPS”. The periphyton stock suspensions as well as the EPS were prepared freshly from the same periphyton source just before use in the exposure experiments (see below: Design of exposure experiments).
Design of Exposure Experiments
In three independent experiments, we grew periphyton in microcosms in the presence of sMP/sMPaged (Experiment 1), bMP/bMPaged (Experiment 2), and rMP (Experiment 3, Figure 1). Experiments 1, 2 aimed to characterize and quantify the effects of MP with native and UV-treated surface on the developing periphyton, and hence periphyton community structure (phenotypic composition, 16S and 18S community composition) and function (photosynthetic yield, respiration, nutrient uptake rates) were measured. Experiment 3 aimed to evaluate the effect of MP on the mechanical properties of the mature periphyton. All exposure experiments were carried out in glass microcosms (210 × 150 × 70 mm) that were filled with 500 mL PERIQUIL. For Experiments 1, 2, each microcosm was loaded with 12 clean glass slides (76 × 26 mm, Schott). Each treatment was replicated five times. For Experiment 3, microcosms were loaded with three glass slides and each treatment replicated three times. To start the experiments, microcosms were inoculated with periphyton stock suspension and the respective MP (see below). The MP concentrations were chosen so as to provide comparable plastic surface areas in each experiment.
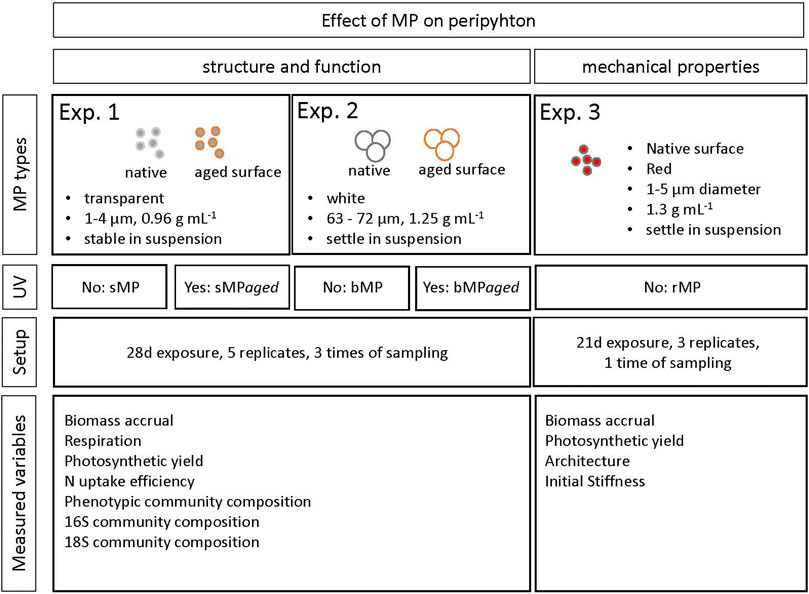
FIGURE 1. Overview of the study design, including indication on MP characteristics used in each experiment and measured variables.
Microcosms of Experiment 1 were inoculated with 10 mL of a freshly prepared periphyton stock suspension (obtained after colonization in the flow-through channels as described above) and 1 mL of either sMP or sMPaged stock suspension (1 mg mL−1) in EPS, resulting in 2 μg mL−1 MP in the microcosms. This concentration leads to a total MP surface of 8.0 × 106 μm2 within each microcosm, assuming smooth particle surface. Those values reflect the nominal concentrations, and exposure concentrations are expected to be lower due to the findings from the dispersion experiments (see: M&M, MP aging, dispersion, and characterization), which indicated lower concentrations of MP in dispersion than nominal concentrations because of agglomeration. Control microcosms received 1 mL EPS alone.
In Experiment 2, bMP or bMPaged were weighted into Erlenmeyer flasks and were dispersed in peripyhton stock suspension to a concentration of 1.4 mg mL−1. Then, the microcosms were inoculated with 10 mL periphyton-bMP and periphyton-bMPaged suspension resulting in 28 μg mL−1 exposure concentration in the microcosms. This concentration leads to a total MP surface of 3.0 × 106 μm2 within each microcosm, assuming smooth particle surface. Control microcosms were inoculated with 10 mL peripyhton stock suspension without bMP.
In Experiment 3, microcosms were inoculated with 10 mL periphyton and 1 mL of rMP stock suspension (1 mg mL−1) in EPS. Control microcosms received 1 mL EPS alone.
In each experiment, all microcosms were placed on a two-dimensional shaker at 18°C; a 12 h dark/light photoperiod was applied (LED light source). The experiments were run for 28 (Experiments 1, 2) and 21 (Experiment 3) days. After a 7 day period to allow periphyton to attach, medium was changed for the first time and then every 3 days in order to maintain nutrient levels (Gil-Allué et al., 2018). For this, the medium was taken out carefully using a syringe (50 mL), aiming to not disturb periphyton growth and to minimize the MP removal during water change. In order to compensate for the loss of dispersed sMP and sMPaged in Experiment 1, both were re-spiked to the microcosms after each medium change with concentrations similar as in the initial spiking. Re-spiking was not necessary in Experiments 2, 3 since the MP sedimented within 30 s (Supplementary Figure S2).
In Experiments 1, 2, periphyton was sampled for MP quantification and assessment of functional and structural parameters (see below) at day 7, 21, and 28 of exposure by randomly collecting three slides per microcosm. These sampling days were selected to cover microbial succession based on previous studies using the same experimental set up (Tlili et al., 2011b; Sgier et al., 2016). Periphyton was scraped off from each glass slide using a clean glass slide and samples from one microcosm were pooled and suspended in 13 mL PERIQUIL. After sampling the periphyton, the medium was collected from each microcosm and replaced by fresh medium to maintain nutrient levels. The collected medium was immediately filtered through a glass fiber filter (FVF, 0.7 µm nominal pore size, Whatmann) and stored at 4°C for the quantification of ammonium (N-NH4), nitrite (N-NO2), and nitrate (N-NO3) concentrations.
In Experiment 3, periphyton was sampled after 21 days. Periphyton of one of the three slides was scraped off and dispersed in 13 mL PERIQUIL as described above. From this suspension, rMP concentrations, periphyton dry weight, and photosynthetic yield were determined. The remaining two slides were used for rheological measurements.
MP Quantification
The number of sMP, sMPaged, and rMP in the periphyton were quantified using flow cytometry (FC, Beckman Coulter Gallios; capillary size: < 50 µm) combined with single-cell visualization by viSNE (visual stochastic network embedding) (Amir et al., 2013). ViSNE is a tool for nonlinear dimension reduction and visualization of high-dimensional data (e.g., FC data) and has been used earlier to determine the phenotypic community composition of phototrophs in periphyton (Sgier et al., 2016; Sgier et al., 2018b). The fluorescence and scattering properties of each cell and particle in the sample were measured individually and clustered into subpopulations following their similarities as described in Sgier et al. (2016). For these measurements, 3 mL of the periphyton suspensions from the exposure experiments were transferred into a Falcon tube (15 mL) and were sonicated for 1 min to break up the colonies. After filtration through 50 µm filters (Partec), samples were fixed (0.01% paraformaldehyde and 0.1% glutaraldehyde (w/v) in tap water) and left at 4°C overnight.
To identify the sMP, sMPaged and rMP particular fluorescence and scattering properties, suspensions (0.001 mg mL−1 in EPS) of each particle type were prepared. All samples were measured using the same laser settings as described by Sgier et al. (2016). The resulting FC data were then analyzed using the bh-SNE version of SNE (Amir et al., 2013; Van Der Maaten 2014), implemented as viSNE in cyt software (http://www.c2b2.columbia.edu/danapeerlab/html/cyt-download.html, downloaded in January 2015). The output is a 2D scatter plot (viSNE map) representing cells with similar fluorescence and scattering properties close to each other forming clusters, which are interpreted as subpopulations (Sgier et al., 2016; Sgier et al., 2018b). These allow to deduce, on the one hand, a phenotypic community composition (see section on Structural endpoints below). On the other hand, they allow to detect MP: the sMP/sMPaged exhibit a low fluorescence intensity at 695 nm, while rMP have high fluorescence intensity at 575 nm. These wavelengths were used to identify the sMP, sMPaged, and rMP in the viSNE maps resulting from the periphyton samples (Supplementary Figure S3). Respective clusters were quantified using Mat lab as previously described (Sgier et al., 2016). The method results in a relative abundance of MP compared with the total number of measured cells. The analysis of the data showed that with the applied laser settings, up to 0.2% of the measured cells fall into the MP cluster “false-positive” (Supplementary Figure S4) in the control treatment. This suggests a sensitivity for the detection of MP with the periphyton suspension of 80%. The 20% false-positive events have previously been determined as decaying, non-organic and not-assigned particles (see Supplementary Figure S23 in Sgier et al., 2016).
Inasmuch as bMP/bMPaged were too large (i.e., >50 μm) to be analyzed with FC and viSNE, they were counted visually, using a Neubaur chamber. Briefly, 10 µL of periphyton samples were pipetted onto the chamber, closed with a glass lid and examined using a microscope (DMI 6000 B, Leica). Results are represented as bMP and bMPaged per m2 glass slide surface.
To be able to compare exposure concentrations despite differences in MP quantification methods due to substantial size differences, we estimated the relative volume of sMP/sMPaged, bMP/bMPaged, and rMP in relation of periphyton volume (%). Equations are detailed in Supplementary Text S1.
Biomass Accrual and Microbial Structural Characteristics of Periphyton Upon MP Exposure
Periphyton biomass accrual (dry weight, DW) was determined by filtering 2 mL of periphyton suspension through pre-weighed glass fiber filters (GF/F, 25 mm diameter 0.7 μm average pore size; Whatman Ltd., Maidstone, United Kingdom). Filters were dried for 48 h at 60°C and weighted again to the nearest 0.01 mg. Dry weight was estimated as the mass difference between empty filters and dry filters and was reported per unit of surface area.
Phenotypic community composition of photoautotrophic organisms of Experiments 1, 2 was determined by analyzing the viSNE maps also used for sMP and sMPaged quantification (see above). In the viSNE maps, the subpopulations of interest were identified based on the visual separation between regions of the map and the distribution of the flow cytometry markers as previously explained (Sgier et al., 2018b). For quantification, number of the particles/cells that belonged to each subpopulation in each of the samples was counted.
Community structure (i.e., composition and relative abundance) of periphyton was also determined for prokaryotes (i.e., heterotrophic bacteria and phototrophic cyanobacteria) and microeukaryotes (i.e., green algae and diatoms) via amplification and sequencing of the16S and 18S rRNA genes, respectively. This was done in samples from Experiments 1, 2 at day 7 of exposure, considering that microbial composition and sensitivity to MP might be affected more strongly at early stages of colonization and development (Guo et al., 2015; Rummel et al., 2021). We applied amplicon sequencing at the MiSeq platform using a 2 x 300 bp kit. To do so, 1.5 mL periphyton suspension was transferred to 1.5 mL Eppendorf tubes and centrifuged at 13000 rpm for 10 min. The supernatant was discarded and the pellet stored at −80°C. DNA was extracted using MOBIO Biofilm DNA extraction kit (Quiagen) following the manufacturer’s instructions. Concentration and quality of the resulting DNA was checked with a Nanodrop 8000 Spectrophotometer. DNA extract was used for MiSeq sequencing when DNA:RNA ratio was ∼1.8.
The 16S and 18S regions were amplified using frameshift primers that resulted in 463bp and 558bp fragments, respectively (Supplementary Table S2). For the polymerase chain reaction (PCR), the appropriate annealing temperature and cycle number for each sample were previously determined using a gradient PCR and quantitative PCR approach. The final thermocycling conditions consisted of an initial denaturation of the DNA at 98°C for 3 min which was followed by 25 cycles of 98°C for 20 s, 55°C for 15 s, and 72°C for 15 s for the 16S primer set. For the 18S primers, amplification started with an initial denaturation of the DNA at 98°C for 3 min followed by 24 cycles of 98°C for 20 s, 56°C for 15 s, and 72°C for 15 s. Both programs were finalized with an elongation step at 72°C for 5 min. All reactions were performed in three technical replicates using KAPA HiFi HotStart ReadyMix, which includes the buffer, dNTPs, and the enzyme for the PCR reactions and 0.3 µM of each primer. PCR products were cleaned using AMPure beads (Beckmann Coulter). For MiSeq sequencing, the PCR products were indexed using Nextera XT index adaptors following manufacturer’s instructions. The resulting libraries were cleaned up and quantified using AMPure beads and the Spark fluorimeter following manufacturer’s instructions. The libraries were pooled to a final concentration of 4 nM using a pipette robot (Liquid Handling Station, Brand). After denaturation (0.2 N NaOH), the library was sequenced on an Illumina® MiSeq machine in a single flow cell in paired-end mode with 300bp-read-lengths. The sequences were deposited in the National Center for Biotechnology Information (NCBI) Sequence Read Archive database under BioProject ID PRJNA744749 (https://www.ncbi.nlm.nih.gov/bioproject/PRJNA744749).
The raw data were clustered into amplicon sequence variants (ASVs) using DADA2 (Callahan et al., 2016). The taxonomic affiliations of the ASVs were assigned using SILVA database release 138 (Quast et al., 2012). Subsequent analyses were conducted using R version 4.0.3 (R language core team 2021). Alpha diversities at each sampling site were estimated by Chao1 and Shannon indices using function estimate richness implemented in phyloseq 1.34.0 (McMurdie and Holmes, 2013). The variation of the p16S and 18S community composition in response to different treatments was analyzed by redundancy analysis (RDA) using the function capscale embedded in vegan 2.5-7 (Oksanen et al., 2013). The 16S and 18S ASV counts represented response variables while treatments were used as explanatory variables. The R code used for the analyses is available on Github at https://github.com/manutamminen/periphyton_microplastic_interactions.
Functional Characteristics of Periphyton on MP Exposure
N-NH4, N-NO2, N-NO3 concentrations in the medium were analyzed following standard colorimetric methods (APHA 2005) using a spectrophotometer (Cary 60, Alient) to derive the uptake rates (k) of ammonium (N-NH4), nitrite (N-NO2), and nitrate (N-NO3). These were calculated as the difference of nutrient concentration in the water column over the exposure time and expressed in mg day−1 using the following equation:
where t is time (in days), and c0 and ct are the concentrations of the nutrient at time zero and at the respective time point (i.e., time between medium changes). The 0.5 L represent the volume of the medium in the microcosms. Positive values indicate a net consumption and negative values indicate a net production of the respective nutrient.
Photosynthetic yield was assessed by measuring the quantum yield of photosystem II (ϕ′) with a a pulse-amplitude-modulated fluorimeter (PHYTO−PAM; Heinz Walz GmbH, Effeltrich, Germany) (Gil-Allué et al., 2015). Periphyton was acclimated for 15 min to ambient light conditions and measured subsequently. Quantum yield was calculated as follows:
with F`m being the background fluorescence and F`t the instantaneous fluorescence.
Respiration measurements were conducted using the MicroResp system according to Tlili et al. (2011a), which is based on a colorimetric method where color changes of a pH indicator dye are related to the release of CO2(g). A 500 μL periphyton suspension was used for the measurements. Incubations were carried out in triplicate in the dark to allow for the measurement of heterotrophic respiration. Absorbance of the detection gel was measured on a microplate reader (Tecan Trading AG, Männedorf, Switzerland). The average change in absorbance was normalized to the periphyton dry weight (DW) and expressed as mg CO2 per DW per day.
Mechanical Properties of the Periphyton Matrix
Compression rheology was used to measure mechanical properties and potential differences in architecture of periphyton matrix upon MP exposure in samples from Experiment 3 (rMP) (Lopez-Sanchez et al., 2014; Rühs et al., 2020). To meet the technical requirements of the rheometer (i.e., periphyton height > MP size), the measurements were exclusively carried out with periphyton containing MP in the smaller size range (1–4 μm, rMP, Table 1). The used glass slides were covered with intact, 21 days old periphyton. These were placed onto the rheometer (MCR502, Anton Paar, Austria), which was equipped with a sand blasted plate geometry to account for potential slip and increase attachment of the biofilm to the geometry. Axial compression measurements (using three technical replicates) with constant speed of 1 μm s−1 were carried out and stopped when a previously defined normal force (FN, expressed in N) compression of either 0.15 N or 1.5 N was reached. During this compression step (i.e., stress relaxation), an amplitude sweep was performed to measure the elastic (G′) and viscous (G″) moduli at a frequency of 1 rad s−1 and at strains of 0.01–100 % at a pre-determined compression (FN = 0.16 N).
The resulting compression curves were interpreted as follows: the top of the sample was reached as soon as the FN decreased below zero. When FN < 0 occurs, capillary forces predominate and pull the plate geometry of the rheometer toward the periphyton. When FN > 0 occurs, the geometry exhibits purely compression on the periphyton matrix. Under this compression regime, the water flows perpendicular to the direction of the applied compressive load across the periphyton matrix. The stiffness indicates the resistance that the water encounters by crossing the periphyton matrix and was calculated from the slope of the compression curves. The stress relaxation (force recovery) is the observed decrease of FN under fixed compression (i.e. 0,15 N or 1.5 N) and was calculated from the applied maximal FN divided by the FN after compression and expressed as (%). The dynamic yield point represents the strain needed to induce movement and potential displacement within the periphyton matrix and was determined as the crossover point between G′ and G″ from the strain-controlled amplitude sweeps measurements. In all measurements, the fluid movement was not constrained during compression and thus water could freely flow out of the sample. All measurements were done under ambient conditions.
Statistical Analysis
Differences between MP abundance in the periphyton over time were determined using one-way ANOVA. Differences between treatments over time for dry weight, respiration, photosynthetic activity, N-NH4, N-NO3 uptake rate and N-NO2 production rate were tested with mixed effect models with time and treatment as fixed value. Differences in algal community composition at phenotypic level (as measured by FC and viSNE data analysis) between treatments and time were analyzed using Adonis permutational ANOVA. The significance of the treatment effect on the 16S and 18S community composition was tested using permutational ANOVA. Differences among the treatments between relative abundances of the gene encoding for 16S and 18S ASV as measure of taxonomic community composition at day 7 were tested using a two-tailed t-test. All calculations were carried out in R (Version 3.6.1). p-values of ≤0.05 were considered significant.
Results
MP Surface Characteristics After Aging
As evidenced by electron microscopy, MP exposure to UV radiation induced visible surface alterations with cracks as well as grained surface structures on both, sMP and bMP (Supplementary Figure S5). In addition, in the FTIR spectra of UV-treated MP, an absorption band at 1712 and 1715 cm−1 appeared. These wavenumbers are assigned as carbonyl stretching mode of ketone functional groups (Gulmine et al., 2003), suggesting an increase in their abundance upon UV exposure. However, the breadth of the adsorption band suggests that other carbonyl-containing groups might be also present. Other FTIR active modes remained unchanged (Supplementary Figure S6).
Experiment 1. Effects Of Smaller MP (1–4 µm) with Aged and Native Surface On Structure and Function Of Developing Periphyton.sMP and sMPaged represented 0.002% of the total volume of the periphyton at day 28 in each microcosm (for calculations, see Supplementary Text S2). The sMP abundance was measured by FC & viSNE data analysis. At all time points, the sMP to cell ratio was constant with an average of 0.86% and 0.70% of the cells counted by FC identified as sMP and sMPaged, respectively (Table 2). Considering the biomass accrual at the same time points (Figure 2A), this indicates a continuous incorporation of the small particles in the biofilm proportional to biomass increase. This was also highlighted by the fact that sMP and sMPaged relative abundance was not correlated with periphyton growth rate at different time points (Supplementary Figure S7).Periphyton grown in the presence of sMP and sMPaged developed constantly over the study period up to 14.16 g m−2 dry weight (Figure 2A), with time playing a significant role while sMP and sMPaged treatments having no significant effect (Table 3). Photosynthetic yield ranged from 0.40 to 0.49 from day 7–28 with lowest levels at day 21 (Figure 2B). Respiration increased significantly by a factor of 4 and 3.25, respectively, from day 7 to day 28 (Figure 2C). N-NH4 uptake rate decreased from 7 to 21 days and increased at day 28 (Figure 2D). N-NO2 uptake increased by an order of magnitude from day 7 to day 28 (Figure 2E). In contrast, N-NO3 uptake rate was negative and decreased by factor 5 suggesting increasing N-NO3 demand with increasing biomass (Figure 2F).Based on the FC & viSNE data analysis, 23 different phenotypic groups were identified (CL1-23, Figure 3). In each sample, representatives of all cluster were found. The viSNE maps of each time point are provided in Supplementary Figure S8, optical scatter and fluorescence intensities at specific wavelengths in Supplementary Figure S9, and a heat map of the differences in scatter and fluorescence between the different clusters in Supplementary Figure S10. Statistical testing of the number of cells per phenotypic group yielded significant differences between phenotypic community composition of photoautotrophic organisms over time, but insignificant differences between treatments (Figure 3). A detailed description of the results concerning the influence of time is available in Supplementary Text S3.The 16S and 18S community composition was analyzed via MiSeq amplicon sequencing on day 7 of exposure. Growth of periphyton in the presence of sMP and sMPaged resulted in significantly different microbial communities as compared with the control (Figure 4). Redundancy analysis resulted in principle components 1 and 2 explaining 9.83% of the differences in 16S data and 28.95% in 18S data (Figure 4).With respect to alpha diversity, no significant differences were detected in the richness (Chao1 index) and diversity (Shannon index, H’) calculated for 16S communities (p ≤ 0.05) (Supplementary Figure S11). However, while alpha diversity was as well similar between control and sMP communities, significant differences were found between the Chao and Shannon indices of control and sMPaged 18S communities. In addition, sMPaged and sMP 18S communities differed significantly in their respective Shannon index (Supplementary Figure S11). When significantly different, indices were systematically lower in sMPaged communities than in control and sMP communities.With regard to 16S ASV, 704 ASV were identified with 382 above the threshold of 3 (relative abundance of ASV >1% listed in Supplementary Table S4, families/genera summarized in Supplementary Table S5). Overall, two-tailed t-test of relative abundances suggested significant differences (p ≤ 0.05) in 5% and 4.2% ASV between control and sMP or sMPaged communities, respectively, and in 6% ASV between sMP and sMPaged communities (Supplementary Table S3). The highest abundance was detected for cyanobacterium genus Chamaesiphon (ASV9) in control communities (3.1%) and was statistically significantly reduced in sMP (1.9%) and sMPaged (1.6%) communities. A statistically significant increase in abundance in sMPaged compared with the controls was detected in the genera Phreatobacter (ASV59), Flavobacterium (ASV117), Hyphomonas (ASV131), Elstera (ASV132), Haliscomenobacter (ASV152), while a decrease was detected in Methylotenera (ASV98) and another member of Haliscomenobacter (ASV213). Examples of increase in sMP communities as compared with the controls are in members of the genus Flavobacterium (ASV110), and the order Sphingobacteriales (ASV134) and of a decrease in a member of the genus Emticicia (ASV184).With regard to 18S communities, 281 ASV were identified with 251 above the threshold of 3 (relative abundance of ASV >1% listed in Supplementary Table S6, families/genera summarized in Supplementary Table S7). Approximately, 40 of these were only identified as eukaryotic without further phylogenetic information. Some 234 of these were accounted for less than 1% of the total number of ASV. Two-tailed t-test of relative abundances suggested statistically significant differences (p ≤ 0.05) in 11% and 22% ASV between control and sMP or sMPaged communities, respectively, and in 18% ASV between sMP and sMPaged communities (Supplementary Table S3). The detected ASV were dominated by members of the diatom genera Achnanthidium and Gomphona (ASV1-3, 5) and by members of the phylum Cryptomycota (ASV4), which represented about 50% of all ASV. Cryptomycota accounted for 4.65% of all ASV in control communities, and were significantly increased in sMP treatments (6.37%) but significantly decreased in sMPaged treatments (2.58%). At the same time, the sum of the strongly represented diatom ASV showed the opposite distribution in sMP (40.88%), sMPaged (48.91%), and control communities (42.65%). Part of the low abundance ASV (< 1%) was significantly reduced in sMP and sMPaged treatments vs. controls. Examples are members of the diatom genus Melosira (ASV24, decreased in sMPaged), Achnanthidium (ASV28, decreased in sMP and sMPaged), Planothidium (ASV48, decreased in sMP and sMPaged) and the ciliate genus Telotrochidium (ASV53, decreased in sMP and sMPaged). Overall, 13 of the 251 ASV were not identified in the sMPaged communities as opposed to 4 in the sMP communities. The frequency of detection of 72% of all ASV was reduced in sMPaged samples and of 42% of all ASV in sMP samples.
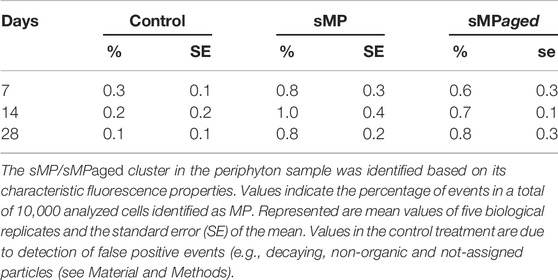
TABLE 2. Relative abundance of sMP/sMPaged in periphyton over time, measured by FC and viSNE.
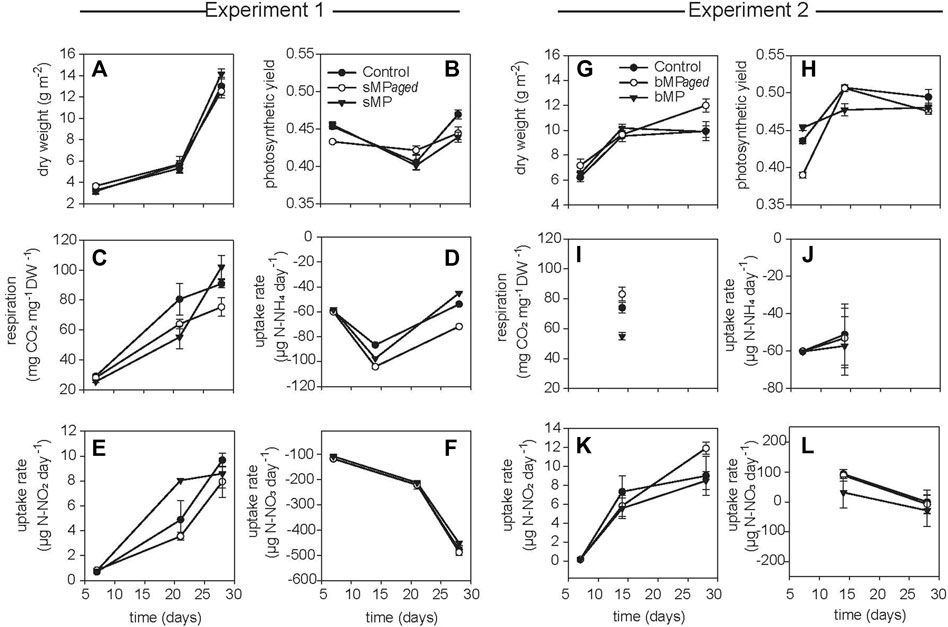
FIGURE 2. Periphyton descriptors resulting from experiment 1 (left panels, sMP/sMPaged) and 2 (right panels, bMP/bMPaged). Represented are dry weight (A,G), photosynthetic yield (B,H), respiration (C,I), and N-NH4+ (D,J), N-NO2- (E,K) and N-NO3- (F,L) uptake rates. The treatments are represented as black dots for control, white dots for UV-treated MP and black triangle for MP with native surface. Shown are the mean of five biological replicates; whiskers indicate the standard error of the mean.
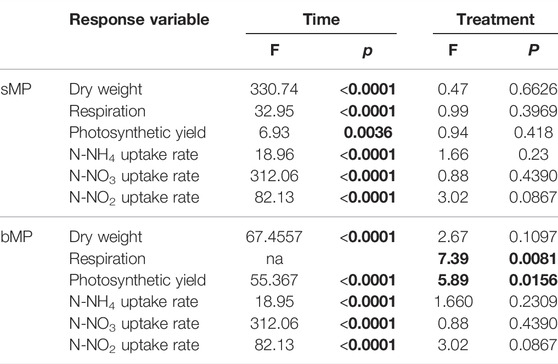
TABLE 3. Statistical results from mixed effects analysis with dry weight, respiration, photosynthetic yield, and nutrient uptake rates as dependent variable and experimental time and treatment as fixed variables. p values <0.05 in bold type indicate significant differences over time or among treatments. Calculations were carried out using the nlme package in R version 3.6.1.
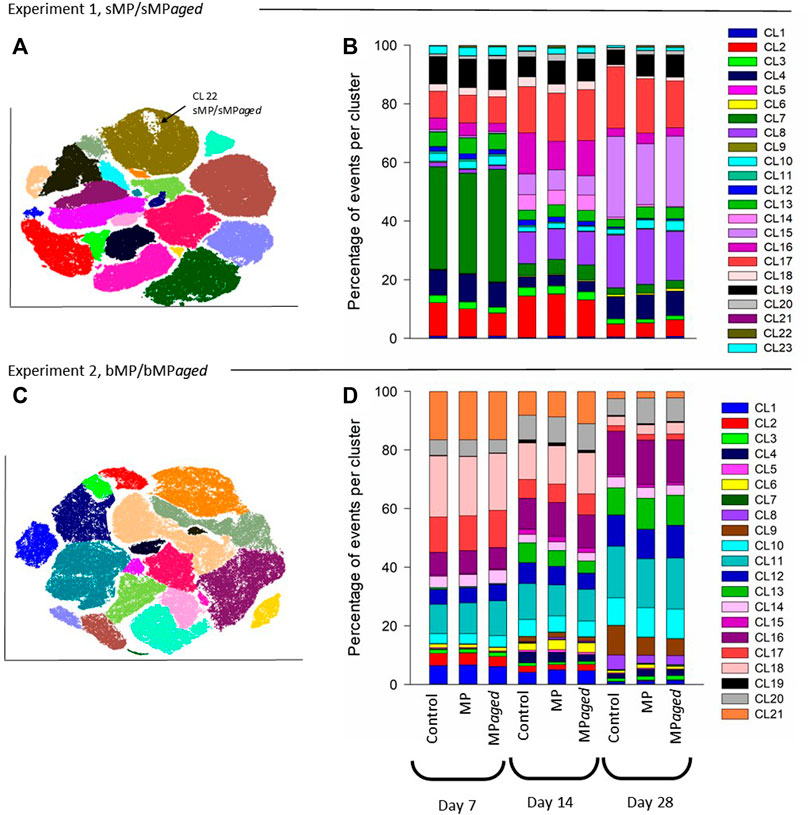
FIGURE 3. Effects of sMP/sMPaged (A,B) and bMP/bMPaged (C,D) on the photoautotrophic community composition at day 7, 14, and 21 days of exposure. Control indicates periphyton grown in the absence of MP. Differences in community composition between treatments and time were analyzed using Adonis permutational ANOVA in R. Results indicated no significant differences between treatments, while differences over time were significant in both experiments (experiment 1: p < 0.001, R2 = 0.63 F = 36 and for experiment 2: p = 0.001, R2 = 0.92, F = 282.3 in experiment 1 and 2, respectively).
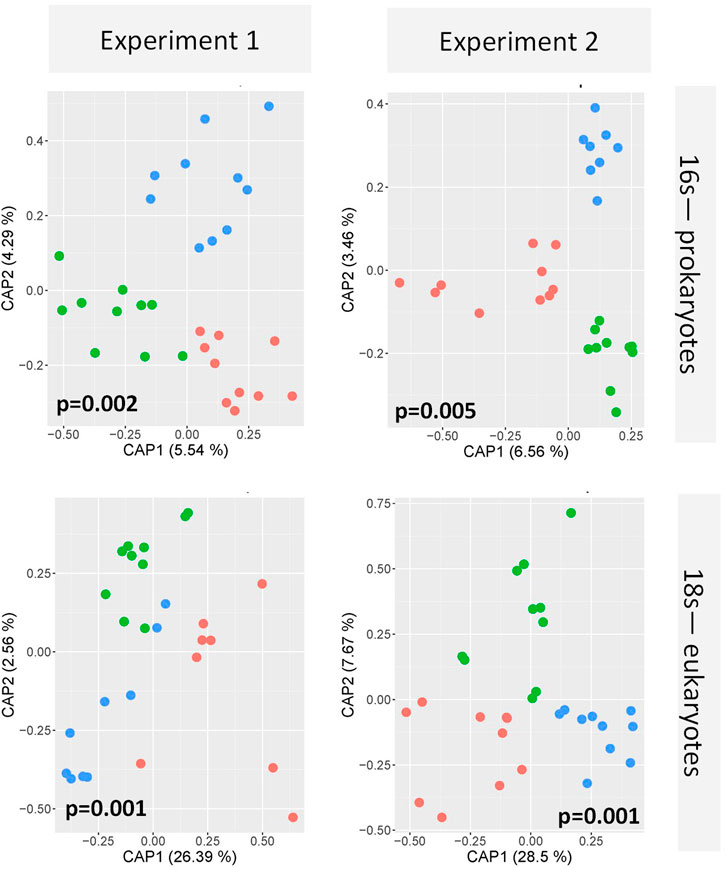
FIGURE 4. Microbial community composition of periphyton resulting from Experiment 1 (left column) and Experiment 2 (right column) based on 16S (upper panels) and 18S amplification (lower panels) at day 7 of the exposure. Green, red, and blue dots represent control, aged and native MP exposures, respectively. Five independent biological replicates and two technical replicates per sample were included in the redundancy analysis, which reveals a significant effect of the exposure on the community composition (p < 0.05; permutational ANOVA).
Experiment 2. Effects Of Bigger MP (65–75 µm) with Aged and Native Surface On Structure and Function Of Developing Periphyton.bMP and bMPaged represented 0.0025% of the total volume of the periphyton at day 28 in each microcosm (for calculations see Supplementary Text S2). These (big) particles were added only once at the beginning of the experiment because they were found to settle on the biofilm (Supplementary Figure S2) and hence were assumed to not be affected by the medium changes. Indeed, total abundance of bMP and bMPaged per m2 glass slide was constant over the study period and no statistical differences between bMP and bMPaged per m2 were detected at different time points (p > 0.05, ANOVA, Table 4). Considering the biomass accrual at the same time points (Figure 2G), the constant abundance of bMP and bMPaged indicates a dilution of the big particles in the biofilm proportional to biomass increase, and hence, a decrease of the exposure conditions. This is also highlighted by the observed significant decrease of the ratio of bMP:biomass and bMPaged:biomass over time (mixed effects analysis, p < 0.05, Supplementary Figure S12).Periphyton grown in the presence of bMP and bMPaged developed constantly over the study period up to 10.6 g m−2 dry weight (Figure 2G) with time playing a significant role while bMP and bMPaged treatments having no significant effect (Table 3). The photosynthetic yield ranged from 0.39 to 0.51 with significantly highest values measured at day 14 in bMPaged and control treatment (Figure 2H).Respiration was only measured on day 14 where it was lowest in periphyton grown in the presence of bMP (Figure 2I). The N-NH4 uptake rate was negative, indicating N-NH4 uptake, and increased slightly from day 7 to 21(Figure 2J). Similar to Experiment 1, N-NO2 uptake rate was positive, indicating N-NO2 production, and increased by one order of magnitude from day 7 to day 28 (Figure 2K). N-NO3 uptake rate was positive on day 14 and decreased to close to 0 on day 28 (Figure 2L). This indicates a change from N-NO3 production to N-NO3 assimilation between day 14 and 21.Based on FC & viSNE data analysis, 21 different phenotypic groups were identified (CL1-21, Figures 3C,D). In each sample, representatives of all clusters were found. The viSNE maps of each time point are shown in Supplementary Figure S13, optical scatter and fluorescence intensities at specific wavelengths in Supplementary Figure S14, and heat map of the differences in scatter and fluorescence between the different clusters in Supplementary Figure S15. Statistical testing of the number of cells per phenotypic group yielded significant differences between phenotypic community composition of photoautotrophic organisms over time, but no significant differences were observed between treatments (Figure 3). A more detailed description is available in Supplementary Text S4.The 16S and 18S community composition was analyzed via MiSeq amplicon sequencing on day 7 of exposure. Growth of biofilms in the presence of bMP and bMPaged resulted in significantly different microbial communities as compared with the control (Figure 4). Redundancy analysis resulted in principle components CPA 1 and 2 explaining 10.02% of the differences in 16S data and 36.17% in 18S data (Figure 4). No significant differences were detected in the richness (Chao1 index) and diversity (Shannon index, H’) calculated for 16S communities (p ≤ 0.05) (Supplementary Figure S11). Significant differences were found in the Shannon indices of bMP and bMPaged communities with lower values determined for MPaged communities (Supplementary Figure S11).With regard to 16S communities, 1170 ASV were identified with 875 above the frequency threshold of 3 (relative abundance of ASV > 1% listed in Supplementary Table S8, families/genera summarized in Supplementary Table S10). Two-tailed t-test of relative abundances suggested significant differences (p ≤ 0.05) in 3.4% and 5.5% ASV between control and bMP or bMPaged communities, respectively, and in 4.3% ASV between bMP and bMPaged communities (Supplementary Table S3). The highest abundance was detected for ASV1 (genus Inhella, around 1.5% in all communities) followed by the Chitinophagaceae genus Terrimonas (ASV2, around 1% in all communities). Cyanobacterial ASV 50 and 148 accounted for 0.7% on average.Examples of decrease in abundance in bMPaged communities are ASV 39 (Terrimonas), 47 (Sphingobacteriales), 135 (Solitalea, Sphingobacteriales), and 265 (Sphingopyxis), while an increase was observed in ASV 113 (Microscillaceae), 203 (Lacihabitans), 279 (Methylotenera), 354 (Flavobacterium), and 356 (Methylophilaceae). In the bMP communities, different ASV were decreased or increased in abundance, but were partially associated with the same phyla. Examples for decreased abundance are ASV 184 (Flavobacterium), 250 (Lacihabitans), 273 (Flavobacterium), 428 (Haliscomenobacter, Chitinophagales), while increased abundances were observed in ASV 267 (Flavobacterium) and 465 (Flavobacterium).With regard to 18S and 16S communities, 306 ASV were identified with all above the frequency threshold of 3 (relative abundance of ASV >1% listed in Supplementary Table S10, families/genera summarized in Supplementary Table S11). Of these, 28 were only identified as eukaryotic without further phylogenetic information. Two-tailed t-test of relative abundances suggested significant differences (p ≤ 0.05) in 13.7% and 10.5% ASV between control and sMP or sMPaged communities, respectively, and in 20% ASV between bMP and bMPaged communities (Supplementary Table S3). As opposed to the communities exposed in Experiment 1, the most abundant ASV were less dominant. The 16 most abundant ASV represented about 50% of all ASV. These were associated with members of the diatom genera Achnanthidium, Gomphona, Melosira, Ulnaria, Nitzschia, and Encynoma (ASV1, 3, 4, 7, 15, 16), ciliate family Oligohymenophorea (ASV 6, 9, 14), the environmental clone BOLA868 (Amoebozoa, Tubulinea, ASV10), class Thecofilosea (Cercozoa, ASV12), and four eukaryotic ASV (ASV2, 5, 8, 11) not further identified. Cryptomycota accounted for 0.3–0.4% of all ASV (ASV74, 170, 258; ASV74 being identical to ASV4) without significant differences between the treatments. As observed in Experiment 1, the sum of the strongly represented diatom ASV showed a distinct distribution in bMP (21.12%), bMPaged (28.63%) and control communities (27.85). Due to a larger heterogeneity of individual samples in this experiment, differences in the low abundance ASV were less often statistically significant. One exception is the higher abundance of Telotrochidium (ciliate, ASV22) in bMP communities (1.7 % vs 0.67% in bMPaged and 0.56% in control communities). Overall, 7 of the 306 ASV were not identified in the bMPaged communities and 8 in the bMP communities. The frequency of detection of 32% of all ASV was reduced in bMPaged samples and of 44% of all ASV in bMP samples.
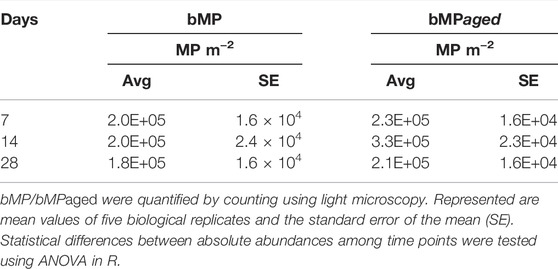
TABLE 4. Absolute abundance of bMP/bMPaged in peripyhton over time (MP m−2).
Experiment 3. Effects Of Smaller MP (1–4 µm) On Mechanical Properties Of Periphyton.rMP represented 0.002% of the total volume of the periphyton at day 21 in each microcosm (for calculations see Supplementary Text S2). Relative abundance of rMP in the periphyton was quantified using FC & viSNE. This analysis showed that 1.62% of the cells were identified as rMP. Dry weight and photosynthetic yield at day 21 of exposure were similar in periphyton grown in the presence and absence of rMP (p > 0.05, Student’s T-test), amounting to 9.79 ± 0.33 mg m−2 and 0.33 ± 0.01, respectively.To determine the mechanical differences between periphyton grown in the presence or absence of rMP, axial compression tests with oscillatory rheology were performed (as illustrated in Figure 5A). Axial compressions indicated that the height of control and rMP-exposed periphyton were at 1.5 and 1.4 mm, respectively (Figure 5B). Yet, the architecture and mechanical behavior upon compression differed. The architectural differences in the periphyton were derived from the shape of the compression curves. Here, the negative FN zone (N < 0) was larger for periphyton-rMP (0.62 ± 0.17 mm) than for control periphyton (0.32 ± 0.06 mm, Figure 5B). The mechanical properties, that is, stiffness and stress relaxation, were measured upon axial compression. Results showed higher initial stiffness for periphyton exposed to rMP than for control periphyton (Figure 5C). In contrast, the force recovery after compression was higher for control periphyton (Figure 5D). Here, the energy dissipation of the applied FN of 0.15 reached 30% for rMP-exposed periphyton, whereas control periphyton reached values of 40% of the applied FN (Figure 5D). This energy dissipation is a direct measure of the load-bearing capacity of the periphyton systems, revealing that both types of periphyton are able to store elastic energy.Both, control- and rMP-exposed periphyton were of viscoelastic character with an elastic modulus G′ and a viscous modulus G″. However, rMP-exposed periphyton had a higher viscoelasticity. This was indicated by a higher elastic modulus (G′, Figures 5E,F). At low strains (0.1–10%), both control periphyton and rMP-exposed periphyton behaved like a solid-like material (G′>G″). At strains > 10%, the periphyton became liquid-like (G″<G′). At higher compressions (0.3N), the elastic and viscous moduli increased in both periphyton types, due to a squeezing of the biofilm resulting in less water in the sample, while, at the same time, increasing the amount of connection points between the biofilm components.
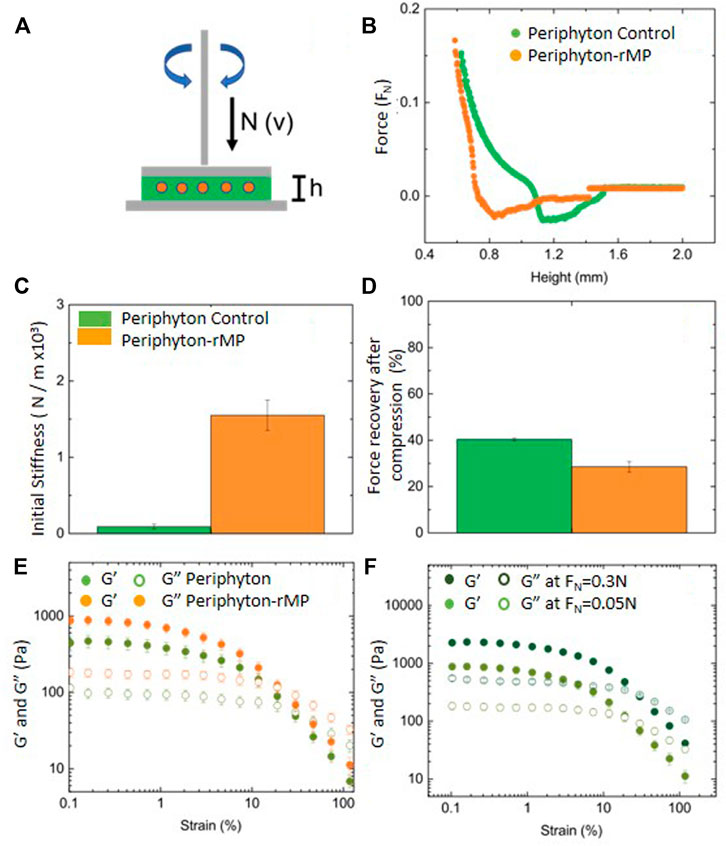
FIGURE 5. Mechanical properties of periphyton growing with MP (periphyton-rMP, orange) and without (periphyton-control, green). Represented is a sketch of the rheometer indicating the plate, gap, sample, and sample holder (A), the representative normal force (FN) dependence on the gap (B), initial stiffness (C), stress relaxation (D) and viscoelastic properties of the matrix of periphyton-rMP (orange) and (green) measured using amplitude sweeps with fixed FN (E) and for periphyton-rMP at two different FN (F).
Discussion
In this study, three independent microcosm exposure experiments shed light on the effect of MP on periphyton, an important component in freshwater ecosystems. In particular, exposures to small MP (1–4 μm, 0.96 g mL−1, Experiment 1) and big MP (63–75 μm, 1.25 g mL−1, Experiment 2) with aged and native surface aimed to test MP effect on periphyton biomass accrual, microbial community structure and function. Exposures to red fluorescent small MP (1–5 μm, 1.3 g mL−1, Experiment 3) aimed to test the effects on periphyton mechanical properties. The periphyton inoculum for each experiment was collected freshly, resulting in natural variability in the community composition of the respective starting inoculum. Hence, the results obtained in the three experiments cannot directly be compared. However, within each experiment, the results are discussed with respect to the unexposed control.
Periphyton Incorporates all MP Types
The quantification of MP either in relative abundances (sMP/sMPaged) or in absolute counts (bMP/bMPaged) was used as an indication for the MP incorporation into the periphyton. Especially, the finding that the relative abundance of sMP/sMPaged, being added after each medium change, remained constant over the study period, supports the notion of a continuous incorporation of the MP with increasing periphyton biomass. The bMP/bMPaged were added only once at the beginning of the experiment. The fact that their absolute counts remained constant over the study period and that they were not washed out during medium change again indicates a high affinity of the MP to periphyton, which was additionally supported by the immediate settlement of the bMP/bMPaged. These results suggest that both MP types were incorporated into the periphyton already at an early stage of biofilm development, that is, in less than 7 days according to our experimental design.
The MP settlement depends on their specific material properties, especially size and density. In experiments to identify the best MP suspension procedure, we found that bMP accumulated on the bottom of the glass vials within 30 s, whereas sMP did not settle within the 5 min observation period. Therefore, the bMP/bMPaged settlement in the periphyton was likely driven, at least initially, by the high material density of the particles themselves. However, other factors may have contributed to the settlement of both the bMP and the sMP. For instance, interactions with microorganisms and EPS either in the water column or on the periphyton surface might have favored MP incorporation. Such a phenomenon has been observed in streams were MP settlement was correlated with periphyton standing stock (Roche et al., 2017). In the case of the sMP, this process may have been driven specifically by the high surface area compared with the bMP. Importantly, UV treatment to age the particles did not influence incorporation of the MP with the biofilms.
MP Changes Periphyton Microbial Community Structure
The MP in periphyton interact with organic compounds of the matrix and the microbial cells. These latter direct interactions can provide advantages for certain types of cells, such as facilitated attachment and reproduction, while bringing disadvantages, such as stress and negative selection, for others. In the present study, however, not all periphyton cells will have directly interacted with MP because exposure concentrations resulted in a sMP/sMPaged and bMP/bMPaged volume of only 0.0002% and 0.0025% of the total periphyton volume, respectively. This indicates that the MP:cell interactions must have been far less occurring than the cell:cell interactions. Despite this presumably low MP:cell ratio, the presence of MP during periphyton development leads to a different genetic community structure, that is, composition and relative abundance, of the prokaryotic and eukaryotic communities after 7 days of exposure. This might be due to the enrichment of certain cell types on the MP and in their proximity, thereby shaping community composition (Datta et al., 2016).
These community shifts upon MP exposures were independent of MP size but dependent on the surface characteristics, which were altered by UV radiation-induced aging. The surfaces of both the sMPaged and bMPaged particles were cracked and keton-groups were more abundant on aged than on native (no UV treatment) surfaces. This is in line with the previous findings showing that UV radiation provokes chain scission, cross-linking, cracking and an increase of polar groups (Feldman 2002; Gulmine et al., 2003). These alterations must have led to a greater surface availability and possibly changes toward a more hydrophilic character of the surface of aged MP. Such changes in surface characteristics of MP have been shown to be a strong selective factor of organic compound adsorption (Rummel et al., 2021) and can partly drive direct MP:cell interaction via facilitating microbial attachment (Erni-Cassola et al., 2019).
The surface-dependence of community composition was also reflected in taxonomic alpha diversity. In particular, the alpha diversity of eukaryotic but not prokaryotic communities resulted to be less diverse upon exposures to aged but not to native MP. That biofilms developing on weathered MP in suspension had lower diversity than biofilms developing on natural particle substrates has been observed previously for both prokaryotic (McCormick et al., 2014; Miao et al., 2019) and eukaryotic (Kettner et al., 2019) communities. However, mechanisms (i.e., processes and pathways) leading to such a reduced diversity following MP:cell interactions are poorly understood.
Although alpha diversity was reduced in the presence of weathered MP, the relative abundance of some genera increased. Examples are Phreatobacter and Hyphomonas (both phylum Alphaproteobacteria), Inhella (phylum Betaproteobacteria) as well as Flavobacterium (phylum Bacterioidetes), all of which have also been found to enrich on suspended MP in the marine environment (Oberbeckmann and Labrenz, 2020), in rivers (McCormick et al., 2014; Kelly et al., 2020) and the Baltic sea (Ogonowski et al., 2018). Specific physiological traits, such as the ability of Hyphomonas to adhere firmly to surfaces by forming polysaccharides holdfast (Oberbeckmann and Labrenz, 2020), and the potential of Burkholderiales (Inhella sp.) to metabolize and use polycyclic hydrocarbons and other petroleate derivatives (Juhasz et al., 1997), have been suggested as factors favoring the enrichment of those species on plastic surfaces. Whether these factors also contribute to their abundance increase in the periphyton remains to be determined.
Aside from genera previously shown to thrive in the presence of MP, we found representatives of other genera to decrease in abundance instead. For instance, the cyanobacterium genus Chamaesiphon decreased in sMP/sMPaged treatments compared with control. This is surprising, since this genus occurs in a broad range of environmental conditions (Gutowski et al., 2015; Kurmayer et al., 2018). This might point toward an indirect MP effect on community composition. It is possible that material properties drive initial community composition within the first hours or days (Rummel et al., 2021) but that at later stages of biofilm formation, the community composition is rather shaped by cell:cell interactions via, e.g., nutrient competition (Datta et al., 2016).
Similarly, relative abundances of representatives of eukaryotes were affected upon MP exposure. For instance, our results indicated that while diatoms increased and decreased in abundance in aged and native sMP-exposed biofilms, respectively, Cryptomycota showed the reversed pattern. Both phyla have been shown to enrich on floating MP in the ocean (Kettner et al., 2017; Kettner et al., 2019). The particular cell shape of diatoms could favor their attachment (Sullivan, 2019) and the organic substances that are adsorbed to the MP surfaces in aquatic environments could attract Cryptomycota, as a heterotrophic decomposer (Grossart and Rojas-Jimenez, 2016). However, the very low MP:cell ratio in our experiments is rather indicative of indirect MP effects on cell:cell interactions.
The MP-induced shift of the phylogenetic community composition was not reflected at the phenotypic community level. This indicates that the phenotypes among the species that changed in abundance were redundant with respect to phenotypic properties. There was also no MP-induced increase in the fraction of decaying cells as observed upon periphyton exposure to, for example, the herbicide Diuron (Sgier et al., 2018a). This suggests that MP do not seem to have a specific mode of action for microorganisms toxic to cells leading to cell death, which is the case for micropollutants (e.g., pesticides). However, the phenotypic community profile showed time-dependent dynamics (Supplementary Text S5).
MP Do Not Affect Functional Parameters
Along with the consistency of community composition as judged from phenotype, all functional parameters assessed, that is, photosynthetic activity, microbial respiration as well as N-NH4+, N-NO2-, and N-NO3- uptake rates were not altered in periphyton upon MP exposure. We take this as an indication for functional redundancy, a common feature of microbial communities (Louca et al., 2018). Particularly, natural periphyton has been shown to change over space and time while maintaining ecosystem functions (Besemer et al., 2013; Wilhelm et al., 2015). However, functional effects may depend on the availability of MP surfaces for cell attachment. Previous studies have evidenced functional changes (e.g., alteration of N, carbon, and phosphate cycling) in periphyton grown on different plastic surfaces (polypropylene, polyvinyl chloride, and polyethylene terephthalate) for 25 days compared with natural substrates (Chen et al., 2020). Similarly, a different metabolic function (i.e., carbon cycling) was observed in mature biofilms (44 days old) growing on MP compared with glass, suggesting that plastic surfaces can provoke a shift in function (Miao et al., 2021). In our study, MP were present in periphyton in low concentrations. Possibly, higher MP concentrations, providing more colonizable plastic surface, could result in a shift of functional traits.
Small MP Containing Periphyton Differ in Mechanical Properties
Rheological measurements showed that periphyton containing small MP (rMP) gained similar height like control periphyton but differed in architecture and mechanical properties. In particular, a larger streamer zone was observed in MP-containing periphyton compared with control. This is interesting since the formation of streamers has only been linked with increased shear stress, for example, high water flow velocity and turbulences so far (Besemer et al., 2007). Our data suggest that MP have a similar effect on periphyton architecture. Streamer formation provides several advantages for the periphyton, such as increased oscillation, which can enhance the transfer of solutes into the base part of the biofilm (Battin et al., 2016). Moreover, streamers represent a microniche for photoautotrophs with higher light and nutrient availability than in the base part (Besemer et al., 2009).
Besides architectural differences, we observed higher stiffness, lower stress relaxation and higher viscoelasticity in small MP exposed periphyton compared with control. This suggests that MP containing periphyton has higher resistance to external forces, for example, hydraulic pressure. These mechanical properties result from the interactions between cells, organic substances, and MP within the matrix. Inasmuch as MP:MP interactions are negligible because rMP abundance was very low, being 2 out of 100 cells, the mechanical changes must rather result from how EPS components of the periphyton interact in terms of adhesion and cohesion than by the presence of the MP. The EPS has been suggested to protect from shear stress (Gloag et al., 2020) and several unique compounds were identified to increase elasticity, ductility, and malleability of Pseudomonas aeruginosa biofilms (Chew et al., 2014). In this study, we did not analyze the composition of the EPS. However, we observed a significant change of prokaryotic and eukaryotic community composition of the periphyton upon MP exposure. This might have also induced a shift in the EPS composition, both in quantity and quality. Together, our study is first to measure the mechanical properties of natural stream biofilms and the results point toward a stronger periphyton matrix when MP are present. This could lead to less dislodgment and clearance of MP-containing periphyton under a flood event. However, there is a need for more detailed insight on the effects of MP on mechanical properties, for example, the critical MP concentration and MP size. This could be tested by measuring the hydraulic resistance of model hydrogel systems containing different concentrations and sizes of MP.
Conclusion
This study showed that both smaller (1–4 µm) and bigger (∼ 63–75 µm) MP were incorporated into the periphyton matrix. Thus, with periphyton being a sink for MP but simultaneously serving as food source, MP might be transferred along the food chain with periphyton being the starting point. Whether MP in periphyton diminishes its nutritional value, or otherwise impacts on higher trophic levels, requires further investigation. The MP exposure also altered local community structure with as of yet unknown consequences on, for example, interspecific competition, flux of energy and nutrients or population recovery from other disturbances, especially upon long-term exposures to MP. Finally, exposure to small MP influenced the mechanical properties, leading to greater mechanical strength and increased periphyton stability, which may in turn reduce dislodgement and thereby affect biofilm renewal. These results point to the importance of further identifying the mechanisms underlying MP–periphyton interactions and exploring in how far they are transferable to the natural environment where periphyton grows on rocks and sediment material.
Data Availability Statement
The datasets presented in this study can be found in online repositories. The names of the repository/repositories and accession number(s) can be found in the article/Supplementary Material.
Author Contributions
SM, AT, KS, and RB contributed to conception and design of the study. SM and BW carried out the experiments. MT performed bioinformatics, PR carried out the rheological measurements, OS carried out the FTIR measurements, BA carried out the UV treatment and REM imaging. AK analyzed data from the community structure. SM wrote first draft of the manuscript. All authors contributed to manuscript revision, read, and approved the submitted version.
Funding
The study was financially supported by the Velux foundation, project number 1039, Switzerland. Additional lab work was funded by Tailwind grant of Eawag Switzerland. Open access funding was provided by Eawag–Swiss Federal Institute of Aquatic Science And Technology.
Conflict of Interest
The authors declare that the research was conducted in the absence of any commercial or financial relationships that could be construed as a potential conflict of interest.
Publisher’s Note
All claims expressed in this article are solely those of the authors and do not necessarily represent those of their affiliated organizations, or those of the publisher, the editors, and the reviewers. Any product that may be evaluated in this article, or claim that may be made by its manufacturer, is not guaranteed or endorsed by the publisher.
Acknowledgments
We thank Silvia Kobel (Genetic Diversity Center (GDC), ETH Zürich) for excellent support during the sequencing process. Data on molecular diversity produced and analyzed in this paper were generated in collaboration with the GDC, ETH Zürich. We also thank the AuA lab (Eawag) for nutrient analysis.
Supplementary Material
The Supplementary Material for this article can be found online at: https://www.frontiersin.org/articles/10.3389/fenvs.2022.928247/full#supplementary-material
References
Abdolahpur Monikh, F., Darbha, G. K., Vijver, M. G., and Peijnenburg, W. J. G. M. (2022). “An Overview of Methodologies for Tracing and Quantifying Microplastics in Environmental Samples,” in Advances in Toxicology and Risk Assessment of Nanomaterials and Emerging Contaminants. Editors L.-H. Guo, and M. Mortimer (Singapore: Springer), 21–46. doi:10.1007/978-981-16-9116-4_2
Amir, el-A. D., Davis, K. L., Tadmor, M. D., Simonds, E. F., Levine, J. H., Bendall, S. C., et al. (2013). viSNE Enables Visualization of High Dimensional Single-Cell Data and Reveals Phenotypic Heterogeneity of Leukemia. Nat. Biotechnol. 31, 545–552. doi:10.1038/nbt.2594
APHA (2005). Standard Methods for the Examination of Water and Wastewater. Washington, DC, USA: American Public Health Association.
Balakrishnan, G., Déniel, M., Nicolai, T., Chassenieux, C., and Lagarde, F. (2019). Towards More Realistic Reference Microplastics and Nanoplastics: Preparation of Polyethylene Micro/nanoparticles with a Biosurfactant. Environ. Sci. Nano 6, 315–324. doi:10.1039/c8en01005f
Battin, T. J., Besemer, K., Bengtsson, M. M., Romani, A. M., and Packmann, A. I. (2016). The Ecology and Biogeochemistry of Stream Biofilms. Nat. Rev. Microbiol. 14, 251–263. doi:10.1038/nrmicro.2016.15
Battin, T. J., Kaplan, L. A., Denis Newbold, J., and Hansen, C. M. E. (2003). Contributions of Microbial Biofilms to Ecosystem Processes in Stream Mesocosms. Nature 426, 439–442. doi:10.1038/nature02152
Bergmann, M., Mützel, S., Primpke, S., Tekman, M. B., Trachsel, J., and Gerdts, G. (2019). White and Wonderful? Microplastics Prevail in Snow from the Alps to the Arctic. Sci. Adv. 5, eaax1157. doi:10.1126/sciadv.aax1157
Besemer, K., Hödl, I., Singer, G., and Battin, T. J. (2009). Architectural Differentiation Reflects Bacterial Community Structure in Stream Biofilms. Isme J. 3, 1318–1324. doi:10.1038/ismej.2009.73
Besemer, K., Singer, G., Limberger, R., Chlup, A.-K., Hochedlinger, G., Hödl, I., et al. (2007). Biophysical Controls on Community Succession in Stream Biofilms. Appl. Environ. Microbiol. 73, 4966–4974. doi:10.1128/aem.00588-07
Besemer, K., Singer, G., Quince, C., Bertuzzo, E., Sloan, W., and Battin, T. J. (2013). Headwaters Are Critical Reservoirs of Microbial Diversity for Fluvial Networks. Proc. R. Soc. B 280, 20131760. doi:10.1098/rspb.2013.1760
Callahan, B. J., McMurdie, P. J., Rosen, M. J., Han, A. W., Johnson, A. J. A., and Holmes, S. P. (2016). DADA2: High-Resolution Sample Inference from Illumina Amplicon Data. Nat. Methods 13, 581–583. doi:10.1038/nmeth.3869
Chen, X., Chen, X., Zhao, Y., Zhou, H., Xiong, X., and Wu, C. (2020). Effects of Microplastic Biofilms on Nutrient Cycling in Simulated Freshwater Systems. Sci. Total Environ. 719, 137276. doi:10.1016/j.scitotenv.2020.137276
Chew, S. C., Kundukad, B., Seviour, T., van der Maarel, J. R., Yang, L., Rice, S. A., et al. (2014). Dynamic Remodeling of Microbial Biofilms by Functionally Distinct Exopolysaccharides. MBio 5, e01536–14. doi:10.1128/mBio.01536-14
Datta, M. S., Sliwerska, E., Gore, J., Polz, M. F., and Cordero, O. X. (2016). Microbial Interactions Lead to Rapid Microscale Successions on Model Marine Particles. Nat. Commun. 7, 11965. doi:10.1038/ncomms11965
Drummond, J. D., Nel, H. A., Packman, A. I., and Krause, S. (2020). Significance of Hyporheic Exchange for Predicting Microplastic Fate in Rivers. Environ. Sci. Technol. Lett. 7, 727–732. doi:10.1021/acs.estlett.0c00595
Erni-Cassola, G., Wright, R. J., Gibson, M. I., and Christie-Oleza, J. A. (2019). Early Colonization of Weathered Polyethylene by Distinct Bacteria in Marine Coastal Seawater. Microb. Ecol. 79 (3), 517–526. doi:10.1007/s00248-019-01424-5
Feldman, D. (2002). Polymer Weathering: Photo-Oxidation. J. Polym. Environ. 10, 163–173. doi:10.1023/a:1021148205366
Frias, J. P. G. L., and Nash, R. (2019). Microplastics: Finding a Consensus on the Definition. Mar. Pollut. Bull. 138, 145–147. doi:10.1016/j.marpolbul.2018.11.022
Galloway, T. S., Cole, M., and Lewis, C. (2017). Interactions of Microplastic Debris throughout the Marine Ecosystem. Nat. Ecol. Evol. 1, 116. doi:10.1038/s41559-017-0116
Gil-Allué, C., Schirmer, K., Tlili, A., Gessner, M. O., and Behra, R. (2015). Silver Nanoparticle Effects on Stream Periphyton during Short-Term Exposures. Environ. Sci. Technol. 49, 1165–1172. doi:10.1021/es5050166
Gil-Allué, C., Tlili, A., Schirmer, K., Gessner, M. O., and Behra, R. (2018). Long-term Exposure to Silver Nanoparticles Affects Periphyton Community Structure and Function. Environ. Sci. Nano 5, 1397–1407.
Gloag, E. S., Fabbri, S., Wozniak, D. J., and Stoodley, P. (2020). Biofilm Mechanics: Implications in Infection and Survival. Biofilm 2, 100017. doi:10.1016/j.bioflm.2019.100017
Grossart, H.-P., and Rojas-Jimenez, K. (2016). Aquatic Fungi: Targeting the Forgotten in Microbial Ecology. Curr. Opin. Microbiol. 31, 140–145. doi:10.1016/j.mib.2016.03.016
Gulmine, J. V., Janissek, P. R., Heise, H. M., and Akcelrud, L. (2003). Degradation Profile of Polyethylene after Artificial Accelerated Weathering. Polym. Degrad. Stab. 79, 385–397. doi:10.1016/s0141-3910(02)00338-5
Guo, F., Ebm, N., Fry, B., Bunn, S. E., Brett, M. T., Ouyang, X., et al. (2022). Basal Resources of River Food Webs Largely Affect the Fatty Acid Composition of Freshwater Fish. Sci. Total Environ. 812, 152450. doi:10.1016/j.scitotenv.2021.152450
Guo, J.-S., Zhang, P., Chen, Y.-P., Shen, Y., Hu, X., Yan, P., et al. (2015). Microbial Attachment and Adsorption–Desorption Kinetic of Tightly Bound Extracellular Polymeric Substances on Model Organic Surfaces. Chem. Eng. J. 279, 516–521. doi:10.1016/j.cej.2015.05.016
Gutowski, A., Foerster, J., Doege, A., and Paul, M. (2015). Chamaesiphon Species in Soft-Water Streams in Germany: Occurrence, Ecology and Use for Bioindication. algol_stud 148, 33–56. doi:10.1127/algol_stud/2015/0220
Horton, A. A., and Dixon, S. J. (2018). Microplastics: An Introduction to Environmental Transport Processes. Wiley Interdiscip. Rev. Water 5, e1268. doi:10.1002/wat2.1268
Huang, S., Peng, C., Wang, Z., Xiong, X., Bi, Y., Liu, Y., et al. (2021). Spatiotemporal Distribution of Microplastics in Surface Water, Biofilms, and Sediments in the World's Largest Drinking Water Diversion Project. Sci. Total Environ. 789, 148001. doi:10.1016/j.scitotenv.2021.148001
Hurley, R., Woodward, J., and Rothwell, J. J. (2018). Microplastic Contamination of River Beds Significantly Reduced by Catchment-wide Flooding. Nat. Geosci. 11, 251–257. doi:10.1038/s41561-018-0080-1
Juhasz, A. L., Britz, M. L., and Stanley, G. A. (1997). Degradation of Benzo[a]pyrene, Dibenz[a,h]anthracene and Coronene by Burkholderia Cepacia. Water Sci. Technol. 36, 45–51. doi:10.2166/wst.1997.0356
Kalčíková, G., and Bundschuh, M. (2021). Aquatic Biofilms—Sink or Source of Microplastics? A Critical Reflection on Current Knowledge. Environ. Toxicol. Chem. 41, 838–843. doi:10.1002/etc.5195
Kelly, J. J., London, M. G., Oforji, N., Ogunsola, A., and Hoellein, T. J. (2020). Microplastic Selects for Convergent Microbiomes from Distinct Riverine Sources. Freshw. Sci. 39, 281–291. doi:10.1086/708934
Kettner, M. T., Oberbeckmann, S., Labrenz, M., and Grossart, H. P. (2019). The Eukaryotic Life on Microplastics in Brackish Ecosystems. Front. Microbiol. 10, 538. doi:10.3389/fmicb.2019.00538
Kettner, M. T., Rojas-Jimenez, K., Oberbeckmann, S., Labrenz, M., and Grossart, H.-P. (2017). Microplastics Alter Composition of Fungal Communities in Aquatic Ecosystems. Environ. Microbiol. 19, 4447–4459. doi:10.1111/1462-2920.13891
Kurmayer, R., Christiansen, G., Holzinger, A., and Rott, E. (2018). Single Colony Genetic Analysis of Epilithic Stream Algae of the Genus Chamaesiphon Spp. Hydrobiologia 811, 61–75. doi:10.1007/s10750-017-3295-z
Li, J., Liu, H., and Paul Chen, J. (2018). Microplastics in Freshwater Systems: A Review on Occurrence, Environmental Effects, and Methods for Microplastics Detection. Water Res. 137, 362–374. doi:10.1016/j.watres.2017.12.056
Lock, M. A., Wallace, R. R., Costerton, J. W., Ventullo, R. M., and Charlton, S. E. (1984). River Epilithon: toward a Structural-Functional Model. Oikos 42, 10–22. doi:10.2307/3544604
Lopez-Sanchez, P., Rincon, M., Wang, D., Brulhart, S., Stokes, J. R., and Gidley, M. J. (2014). Micromechanics and Poroelasticity of Hydrated Cellulose Networks. Biomacromolecules 15, 2274–2284. doi:10.1021/bm500405h
Louca, S., Polz, M. F., Mazel, F., Albright, M. B. N., Huber, J. A., O’Connor, M. I., et al. (2018). Function and Functional Redundancy in Microbial Systems. Nat. Ecol. Evol. 2, 936–943. doi:10.1038/s41559-018-0519-1
Mao, Y., Ai, H., Chen, Y., Zhang, Z., Zeng, P., Kang, L., et al. (2018). Phytoplankton Response to Polystyrene Microplastics: Perspective from an Entire Growth Period. Chemosphere 208, 59–68. doi:10.1016/j.chemosphere.2018.05.170
McCormick, A., Hoellein, T. J., Mason, S. A., Schluep, J., and Kelly, J. J. (2014). Microplastic Is an Abundant and Distinct Microbial Habitat in an Urban River. Environ. Sci. Technol. 48, 11863–11871. doi:10.1021/es503610r
McMurdie, P. J., and Holmes, S. (2013). Phyloseq: An R Package for Reproducible Interactive Analysis and Graphics of Microbiome Census Data. PLOS ONE 8, e61217. doi:10.1371/journal.pone.0061217
Miao, L., Wang, P., Hou, J., Yao, Y., Liu, Z., Liu, S., et al. (2019). Distinct Community Structure and Microbial Functions of Biofilms Colonizing Microplastics. Sci. Total Environ. 650, 2395–2402. doi:10.1016/j.scitotenv.2018.09.378
Miao, L., Yu, Y., Adyel, T. M., Wang, C., Liu, Z., Liu, S., et al. (2021). Distinct Microbial Metabolic Activities of Biofilms Colonizing Microplastics in Three Freshwater Ecosystems. J. Hazard. Mater. 403, 123577. doi:10.1016/j.jhazmat.2020.123577
Montuelle, B., Dorigo, U., Bérard, A., Volat, B., Bouchez, A., Tlili, A., et al. (2010). “The Periphyton as a Multimetric Bioindicator for Assessing the Impact of Land Use on Rivers: an Overview of the Ardières-Morcille Experimental Watershed (France),” in Global Change and River Ecosystems—Implications for Structure, Function Ecosystem Services. Developments in Hydrobiology. Editors R. J. Stevenson, and S. Sabater (Dordrecht: Springer), 123–141. doi:10.1007/978-94-007-0608-8_9
Oberbeckmann, S., and Labrenz, M. (2020). Marine Microbial Assemblages on Microplastics: Diversity, Adaptation, and Role in Degradation. Annu. Rev. Mar. Sci. 12, 209–232. doi:10.1146/annurev-marine-010419-010633
Ockenden, A., Tremblay, L. A., Dikareva, N., and Simon, K. S. (2021). Towards More Ecologically Relevant Investigations of the Impacts of Microplastic Pollution in Freshwater Ecosystems. Sci. Total Environ. 792, 148507. doi:10.1016/j.scitotenv.2021.148507
Ogonowski, M., Motiei, A., Ininbergs, K., Hell, E., Gerdes, Z., Udekwu, K. I., et al. (2018). Evidence for Selective Bacterial Community Structuring on Microplastics. Environ. Microbiol. 20, 2796–2808. doi:10.1111/1462-2920.14120
Oksanen, J., Blanchet, F. G., Kindt, R., Legendre, P., Minchin, P. R., O’hara, R., et al. (2013). Package ‘vegan’. Community Ecology Package. version 2.9 2:1-295.
Quast, C., Pruesse, E., Yilmaz, P., Gerken, J., Schweer, T., Yarza, P., et al. (2012). The SILVA Ribosomal RNA Gene Database Project: Improved Data Processing and Web-Based Tools. Nucleic Acids Res. 41, D590–D596. doi:10.1093/nar/gks1219
Rillig, M. C., and Lehmann, A. (2020). Microplastic in Terrestrial Ecosystems. Science 368, 1430–1431. doi:10.1126/science.abb5979
Roche, K. R., Drummond, J. D., Boano, F., Packman, A. I., Battin, T. J., and Hunter, W. R. (2017). Benthic Biofilm Controls on Fine Particle Dynamics in Streams. Water Resour. Res. 53, 222–236. doi:10.1002/2016wr019041
Rühs, P. A., Malollari, K. G., Binelli, M. R., Crockett, R., Balkenende, D. W. R., Studart, A. R., et al. (2020). Conformal Bacterial Cellulose Coatings as Lubricious Surfaces. ACS Nano 14, 3885–3895. doi:10.1021/acsnano.9b09956
Rummel, C. D., Lechtenfeld, O. J., Kallies, R., Benke, A., Herzsprung, P., Rynek, R., et al. (2021). Conditioning Film and Early Biofilm Succession on Plastic Surfaces. Environ. Sci. Technol. 55, 11006–11018. doi:10.1021/acs.est.0c07875
Sgier, L., Behra, R., Schönenberger, R., Kroll, A., and Zupanic, A. (2018a). Evaluation of Phototrophic Stream Biofilms under Stress: Comparing Traditional and Novel Ecotoxicological Endpoints after Exposure to Diuron. Front. Microbiol. 9, 2974. doi:10.3389/fmicb.2018.02974
Sgier, L., Freimann, R., Zupanic, A., and Kroll, A. (2016). Flow Cytometry Combined with viSNE for the Analysis of Microbial Biofilms and Detection of Microplastics. Nat. Commun. 7, 11587. doi:10.1038/ncomms11587
Sgier, L., Merbt, S., Tlili, A., Kroll, A., and Zupanic, A. (2018b). Characterization of Aquatic Biofilms with Flow Cytometry. J. Vis. Exp. 136, 57655. doi:10.3791/57655
Shim, W. J., Hong, S. H., and Eo, S. E. (2017). Identification Methods in Microplastic Analysis: a Review. Anal. Methods 9, 1384–1391. doi:10.1039/c6ay02558g
Stewart, T. J., Traber, J., Kroll, A., Behra, R., and Sigg, L. (2013). Characterization of Extracellular Polymeric Substances (EPS) from Periphyton Using Liquid Chromatography-Organic Carbon Detection-Organic Nitrogen Detection (LC-OCD-OND). Environ. Sci. Pollut. Res. 20, 3214–3223. doi:10.1007/s11356-012-1228-y
Sullivan, T. (2019). Cell Shape and Surface Colonisation in the Diatom Genus Cocconeis-An Opportunity to Explore Bio-Inspired Shape Packing? Biomimetics 4, 29. doi:10.3390/biomimetics4020029
Tlili, A., Marechal, M., Montuelle, B., Volat, B., Dorigo, U., and Bérard, A. (2011a). Use of the MicroResp Method to Assess Pollution-Induced Community Tolerance to Metals for Lotic Biofilms. Environ. Pollut. 159, 18–24. doi:10.1016/j.envpol.2010.09.033
Tlili, A., Montuelle, B., Bérard, A., and Bouchez, A. (2011b). Impact of Chronic and Acute Pesticide Exposures on Periphyton Communities. Sci. Total Environ. 409, 2102–2113. doi:10.1016/j.scitotenv.2011.01.056
Van Cauwenberghe, L., Vanreusel, A., Mees, J., and Janssen, C. R. (2013). Microplastic Pollution in Deep-Sea Sediments. Environ. Pollut. 182, 495–499. doi:10.1016/j.envpol.2013.08.013
Van Der Maaten, L. (2014). Accelerating T-SNE Using Tree-Based Algorithms. J J. Mach. Learn. Res. 15, 3221–3245. doi:10.5555/2627435.2697068
Verschoor, A. (2015). Towards a Definition of Microplastics: Considerations for the Specification of Physico-Chemical Properties. The Netherlands: National Institute for Public Health and the Environment.
Wilhelm, L., Besemer, K., Fragner, L., Peter, H., Weckwerth, W., and Battin, T. J. (2015). Altitudinal Patterns of Diversity and Functional Traits of Metabolically Active Microorganisms in Stream Biofilms. Isme J. 9, 2454–2464. doi:10.1038/ismej.2015.56
Yang, W., Gao, X., Wu, Y., Wan, L., Tan, L., Yuan, S., et al. (2020). The Combined Toxicity Influence of Microplastics and Nonylphenol on Microalgae Chlorella Pyrenoidosa. Ecotoxicol. Environ. Saf. 195, 110484. doi:10.1016/j.ecoenv.2020.110484
Keywords: particles, community composition, microbial function, ecotoxicity, aquatic biofilms
Citation: Merbt SN, Kroll A, Tamminen M, Rühs PA, Wagner B, Sgier L, Sembalova O, Abel B, Tlili A, Schirmer K and Behra R (2022) Influence of Microplastics on Microbial Structure, Function, and Mechanical Properties of Stream Periphyton. Front. Environ. Sci. 10:928247. doi: 10.3389/fenvs.2022.928247
Received: 25 April 2022; Accepted: 26 May 2022;
Published: 06 July 2022.
Edited by:
Lingzhan Miao, Hohai University, ChinaReviewed by:
Guoxiang You, Hohai University, ChinaOmowunmi H. Fred-Ahmadu, Covenant University, Nigeria
Copyright © 2022 Merbt, Kroll, Tamminen, Rühs, Wagner, Sgier, Sembalova, Abel, Tlili, Schirmer and Behra. This is an open-access article distributed under the terms of the Creative Commons Attribution License (CC BY). The use, distribution or reproduction in other forums is permitted, provided the original author(s) and the copyright owner(s) are credited and that the original publication in this journal is cited, in accordance with accepted academic practice. No use, distribution or reproduction is permitted which does not comply with these terms.
*Correspondence: Stephanie N. Merbt, U3RlcGhhbmllLk1lcmJ0QGNlYWIuY3NpYy5lcw==; Kristin Schirmer, S3Jpc3Rpbi5TY2hpcm1lckBlYXdhZy5jaA==