Abstract
Waste electrical and electronic equipment is the fastest growing waste stream internationally. Due to its physical characteristics, e-waste is a suitable subject for the development of recovery, repair, and recycling policies, prolonging products’ life cycle for as long as possible, and is an objective pursued by the specific mechanisms of the circular economy. From the point of view of economic development models, e-waste management is one of the areas with significant potential for the implementation of the circular economy. The circular economy is analyzed through a set of 10 indicators that can be found in the Eurostat database. In this paper, we focus on the relationship between two main indicators with significance for this topic (e-waste recycling and eco-investment) and their evolution in European countries. An econometric model regarding the influence of eco-investment on e-waste recycling in EU member states will highlight the impact of circular economy indicators and the importance of promoting the reduce-reuse-recycle paradigm, especially for e-waste. A panel analysis was performed on data from European Union (EU) countries for the period (2008–2018). The analysis uses e-waste recycled per inhabitant as the determined variable and eco-investment per inhabitant as independent variable. The results of the econometric analysis performed show that, although all EU member states benefit from eco-investment, there is a group of countries that have already achieved a high capacity of e-waste recycling, while others should increase eco-investment further.
1 Introduction
Waste management pertaining to waste electrical and electronic equipment (WEEE) is an area with a high potential for the implementation of the circular economy. WEEE is one of the most suitable wastes for recovery, repair, and recycling, which is a main mechanism in the context of the circular economy.
The transition to the circular economy is one of the objectives stipulated in the European environmental and sustainable development policy framework. However, e-waste quantities are increasing from year to year (2% every year) due to digitization and IT&C expansion. Also, because of the international military conflict developing in North-Eastern Europe, there is a shortage of important raw materials required for electronic device production (neon, palladium). In this context, promoting the recycling and reusing of electronic devices has become more urgent and necessary than ever.
WEEE, also known as electronic waste, such as computers, TV sets, refrigerators and other household appliances, mobile phones, and electric tools, is one of the fastest growing waste streams in the world and, of course, in the European Union (EU). E-waste includes, among the parts of the discarded equipment, precious materials such as rare metals (platinum, gold), whose recycling should be improved.
E-waste contains a combination of many recyclables and hazardous components, and this is a serious concern that necessitates much attention in the future. Researchers are compelled to study the factors favorable to the progress of e-waste management.
It is important to highlight some of the most important socio-economic benefits streaming from circular e-waste management boosted by increased eco-investment.
There is a shortage of new materials for electronic device production. When recycling e-waste, all these materials can be reused (rare earths elements, platinum, cobalt, gold, and others). This is an opportunity to save raw materials from being excavated and also to reduce pollution (World Economic Forum, 2019).
E-waste can be a concerning source of pollution for the environment: discarded electronic devices can leak chemical components, polluting the soil and the groundwater. Also, countries that do not have sufficient recycling facilities for e-waste export the excess to developing countries such as India or Thailand. There, the informal e-waste recycling can be dangerous for workers, since they use rudimentary methods to dismantle the electronic devices (Purushothaman et al., 2020).
All these risks call for an increase of eco-investment in e-waste management in order to create new, safer, and greener technologies. At the same time, increasing e-waste management activities in EU countries would bring revenues and create employment in an organized and well-regulated sector of the green and circular economy (Platon et al., 2020).
The rapid growth of e-waste flow is a direct result of technological progress in the electronics industry that has led to an exponential growth in the variety and quantity of electrical and electronic equipment (EEE). E-waste management systems that are in place in EU countries are not yet able to cope with the scale of the e-waste problem, especially in new EU member countries (those joining the EU since 2004). Even if best practice has been transposed from developed member states, there is still a lack of efficiency and coherence in e-waste management.
In order to understand how e-waste management can be improved, this research focuses on finding a causality relationship between the e-waste statistical indicators and some of the other circular economy indicators analyzed at the international level. Several indicators were analyzed before establishing which one has the most significant influence on e-waste management.
The aim of this research is to determine the influence of eco-investments on the progress of e-waste management within the framework of the transition to the circular economy in the EU.
The main research objectives are to review, substantiate, and quantify the importance of eco-investment for e-waste collection, recycling, and reuse. There are also some associated collateral analysis objectives owing to the specifics of e-waste analysis, namely, the quantities of collected, recycled, and reused e-waste.
2 Materials and Methods
2.1 Literature Review
This research examines an extremely new and modern subject. For this reason, many interesting papers can be found debating several aspects of e-waste management, as well as the necessity of investment in this economic sector. The scientific literature discusses on one hand theoretical aspects and on the other hand practical experiences from European countries and from all over the world. Our literature review focuses on EU countries’ experiences but also presents experiences from other regions. Figure 1 presents a schematic synthesis of this endeavor.
FIGURE 1

Scientific literature development/Source: Created by the authors.
In the area of e-waste management, various papers have analyzed the respective processes and policies in order to identify the most significant factors and incentives for green development. The study of Roman (2012) is highly insightful regarding several good practices for WEEE management in Europe. This research analyzed and identified the successful experience of some European countries in the context of sustainable and efficient e-waste management, highlighting also the main issues to be tackled in a strategic sectoral approach (the legislative framework, the financing and logistic systems, the producer’s responsibility, etc.).
Another most interesting and useful approach to analyzing and comparing WEEE management systems of a EU member state (Germany) and a non-EU country (Serbia) was developed by Diedler et al. (2018). The research has important insights on the most important indicators, logistics, and legal framework gaps between the European states, which impact the lower collection and recycling rate in Serbia.
Sousa et al. (2018) discussed the adjustments made by countries to EEE fees as an effect of European policy in the area of WEEE. According to the authors, there are lower EEE fees in Portugal, Poland, Greece, and Norway, and the relations with fees are largely dependent on the WEEE category.
Andersson et al. (2019) analyzed the challenges of recycling scarce metals, emphasizing that the rise in recycling rates is an industry development issue. According to the authors, this requires a strategy related to the build-up of entire value chain.
Favot et al. (2022) discussed the degree of competition/regulation in the EU WEEE recycling industry. The authors emphasized that the impact of competition on the economic performance is positive.
Kumar et al. (2022) discussed in their latest study which are the most important enablers of sustainable WEEE management. Based on the large literature review presented, the authors identified 23 enablers that facilitate the implementation of sustainable WEEE management. The study used a combination of the gray theory and DEMATEL methods (decision making trial and evaluation laboratory) in order to minimize the limitations of both methodologies. The research reached the following conclusions: the top three enablers of e-waste management are research and development capabilities, digitization, and environmental regulation.
The authors from this research team also had some previous research outcomes in this area. Garg (2020) uses the DEMATEL technique to analyze the relationship between the e-waste mitigation strategies (MS) via cause/effect analysis. According to the authors, “top management initiation and commitment towards return management” is the most important strategy for e-waste management. Fetanat et al. (2021) used a fuzzy approach, integrating also the DEMATEL method, to find the key indicators influencing the sustainability selection of CE strategies in WEEE management. According to the authors, “the profit” was the most important indicator for ranking the CE strategies.
Sharma et al. (2021) examined the challenges of electronic waste urban mining (EWUM) management. The authors use the integrated multi-criteria-decision making method (MCDM), step-wise weight assessment ratio analysis (SWARA), and weighted aggregated sum product assessment method (WASPAS). The results emphasized that socio-economic issues are the most critical issues in EWUM.
Zlamparet et al. (2015) compared the e-waste management systems in two capital cities: Beijing (China); and Bucharest (Romania). These two cities are important centers, representative of circular economy development in each country. There are some similarities as well as differences in their e-waste management. For example, they both need to improve the application of extended manufacturers’ responsibility (EPR) for their products beyond the point of sale, up to end-of-product-life. As for the differences observed in the study, Romania has encouraged recycling for all WEEE categories, while China has focused on recycling only large household appliances. The conclusions of this study underline the importance of improving the policies regulating e-waste management.
Another recent study by Apostolescu et al. (2022) focused on the technologies, trends, and benefits of recovering precious metals form WEEE. They considered and analyzed several economic and environmental benefits of e-waste recycling, such as environmental and natural resource conservation, green job creation, energy saving, reducing CO2 emissions, and landfill disposal. Their conclusions support the fact that, by recycling e-waste, precious metals may be recovered in a less costly manner (13 times cheaper) than by extraction from mines.
Baxter et al. (2016) discussed the life cycle assessment of the collection, transport, and recycling of WEEE in Norway. According to the authors, many quality aspects of WEEE recycling cannot easily be driven and regulated by policy.
Dhir et al. (2021) studied e-waste recycling attitudes and intentions. The authors used behavioral reasoning theory (BRT) and structural equation modeling, with a focus on Japanese consumers. According to these authors, “reasons for” were positively associated with attitude and intentions, while consumer values had negative associations with “reasons against.”
Islam et al. (2021) used content analysis and reviewed various articles on consumer behavior regarding e-waste. The research emphasized that the consumers want important changes in e-waste management systems.
Cialani and Mortazavi (2020) analyzed the cost elasticity and marginal costs to determine if there are economies of scale for recycling urban waste in Italy. They addressed the gap in waste management demand-side aspects (reduction and discouragement of land disposal and promotion of recycling and recovery) by estimating the cost function of providing waste collection and recycling services for Italian municipalities during the years 2011–2017. The conclusions of this research paper suggested that increasing recycling rates would not substantially increase total costs for most municipalities, so recycling should be encouraged.
Maurice et al. (2021) focused on recycling strategies for increasing the recovery of chemical elements from waste printed circuit boards (WPCBs). The authors identified retrieval methods for elements that can be recovered in an environmentally friendly way.
Singh et al. (2020) investigated the drivers and barriers associated with e-waste management. The authors used a questionnaire-based survey and emphasized that the lack of awareness of environmental impact is an important problem for e-waste collection, and that the e-waste quantity and type are more important than the distance between the processing unit and the collection point.
Nowakowski et al. (2021) analyzed the use of container collection for small e-waste by individuals from the South of Poland. According to authors, there is a growing interest in the disposal of small e-waste, and a high percentage of respondents are aware of proper methods of e-waste disposal, but there is a lack of programs encouraging the population to adopt such behavior.
Mor et al. (2021) investigated the awareness level concerning e-waste management in educational institutions. The analysis was based on a questionnaire distributed among engineering students. The research showed that the awareness level regarding e-waste generation and processing was deficient, although the respondents understood the hazardous effects of e-waste.
Ardi and Leisten (2015) discussed informal operations in WEEE management systems using a system dynamics approach, focusing on India. The results emphasized the failure of formal collection and the growth of the informal sector. Llerena-Riascos et al. (2021) discussed sustainable WEEE management system policies. The authors used a system dynamics model and a mixed-integer nonlinear programming model. According to the authors, the replacement rate is an important element in increasing the performance of WEEE management systems.
Wang et al. (2020) discussed the interactions between the government and uncertified recyclers. According to the authors, the government should adopt the reward-penalty-supervision mechanism in the e-waste recycling sector. Abalansa et al. (2021) discussed the export of e-waste to developing countries. According to the authors, this activity is creating jobs, but there are some negative effects on the environment and human welfare. Woodard (2021) analyzed the level of resource leakage of recyclable and biowaste from SMEs into the household waste stream. The author presented some options to improve the management of waste from SMEs. Mihaliková et al. (2022) emphasized the relationship between public expenditure and the rate of recovery of municipal waste. According to the analysis, there is a positive influence on waste recycling from public administration expenditures related to the waste management. Murthy and Ramakrishna (2022) discussed best practices in the area of e-waste management, emphasizing the importance of policy implementation and social awareness for the sustainable and circular economy.
Various methods of analysis have been used in the literature. An important method is survey analysis, which was used by Wang et al. (2016) to investigate the factors influencing e-waste recycling behavior, with a focus on China. The indirect influencing factors were found to be environmental awareness, attitude towards recycling, perceptions of informal recycling, income and costs of recycling, and norms and publicity. Islam et al. (2016) analyzed WEEE management in Dhaka, Bangladesh, with a focus on the level of awareness, knowledge, the disposal method, and other aspects. The authors used a survey analysis and showed a low level of WEEE knowledge among households. Kumar (2019) investigated e-waste recycling behavior. The author employed a survey analysis, and the results revealed the influencing factors of e-waste recycling behavior, such as attitude, perceived control, subjective norms, and individual responsibility.
In addition to survey analysis, the following methods and models have also been used in the literature: exploratory analysis; logistic forecasting model; system dynamics; the DEMATEL method; the multi-criteria-decision making method; life cycle assessment; structural equation modeling; and content analysis. For example, Xavier et al. (2021) developed an exploratory analysis regarding e-waste management, with a focus on the American continent, to identify how legal, economic, and environmental criteria influence e-waste management options. The results indicated a direct correlation between e-waste generation and GDP.
Eco-investment, or green investment as it is often referred to in the scientific literature, concerns financial support for business practices that seek not to harm the natural environment. They are sometimes explained as socially responsible investing, encompassing environmental, social, and governance criteria. Green investments target projects or research committed to natural resource conservation, limiting pollution, or other environmentally conscious business practices. Because of its target and features, eco-investment is often found in the scientific literature analyzing innovation, eco-innovation, eco-efficiency, and sustainable development.
Khan et al. (2022) analyzed the impact of trilemma energy balance and clean energy transitions on economic expansion and environmental sustainability. According to the authors, environmental sustainability is affected by the depletion of natural resources.
Investment is an activity that usually associated with welfare, but not exclusively. As Wijaya and Efendi (2020) underlined in their paper, ensuring a good environmental condition is also important. In this context, an equilibrium must be found between profit and sustainability. This is where eco-investment comes into play, using an integrated policy system at the national or regional level. This paper presented an analysis of Indonesian laws and regulations governing the implementation of eco-investment.
Aldieri et al. (2021) proposed a systematic classification of the main circular economy features in order to identify the best intervention areas for sharing economy models and eco-innovation systems. Their three-step theoretical analysis was applied to seven particular case studies, highlighting one main conclusion: the main objective of policy makers must be increasing R&D investments focused on eco-innovations.
Ngwakwe and Ambe (2016) analyzed eco-investment as a basic condition for the eco-performance rating of a company. They stated that the “Eco-Ratio” trend analysis is significant and that it might provide a means of sustainability performance assessment for management and other interested stakeholders. Also, this type of analysis might refocus business sustainability to address ecological and social problems.
Awasthi et al. (2018) studied the connection between global e-waste generation and GDP. During their research, it became clear that there was a strong linear correlation between the analyzed indicators. The authors performed both environmental and economic assessments that showed that any kind of investment decision or market analysis must take into account the volumes of waste as well as the GDP dimension.
The study of Nandy et al. (2022) highlighted the importance of circular waste management in a green economy, focusing on the investment needs and challenges of three difficult sectors (plastics, electronics, and medical) in the context of waste management. Among the e-waste categories, the importance of the green management of portable batteries was analyzed in more detail, considering their increasing demand and that they contain precious but also potentially harmful elements (Ni-Cd, Li-Ion, Li-Po, etc.). The EU may become a leader in the sustainable management of batteries, through the creation of the “The European Battery Alliance” (EBA). This European industrial ecosystem has attracted more than €60 billion of eco-investments in 2019, creating a circular, competitive, and sustainable value chain (EU Industrial alliances).
From the research papers analyzed and the available policy documents, the importance of eco-innovation in the process of economic development is obvious. By developing eco-innovation abilities and practices, it is possible to enhance the commercial potential across all economic sectors. The second aspect that is worth mentioning is the fact that it reduces uncertainty concerning future market developments in the EU. This will help boost eco-investment and accelerate the introduction of environmentally friendly technologies, products, and services (Frone and Constantinescu, 2013).
2.2 Research Methodology
The main source of data identified for this paper’s objective was the Eurostat database, which provides data collected by the European Commission regarding the quantity of WEEE collected in tons per year and also in kg per inhabitant per year.
The chosen analysis period is 2008–2018, because statistical data are available for this interval in the Eurostat database for a large majority of the 28 EU member states.
In order to develop the analysis of eco-investment’s influence on e-waste management, the authors used several research methods: interrogation of available databases; comparative data analysis; data trend examination; basic desk research; processing the data; etc. Calculations were made using panel data for 24 EU member states (four member states did not provide data on investments: Irlanda, Malta, Luxembourg, and Czechia), covering a time interval between 2008 and 2018.
The main steps of the methodology used for modeling are presented in Figure 2.
FIGURE 2
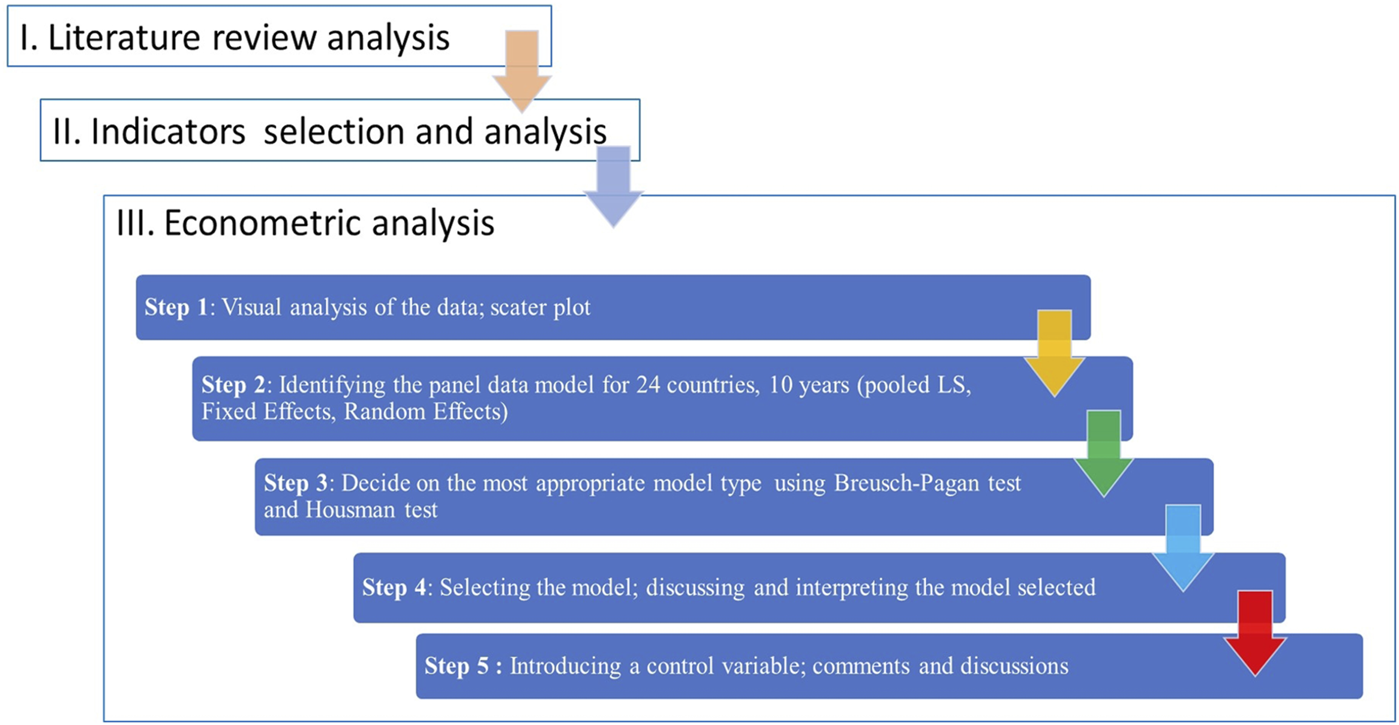
Methodology used for modeling e-waste recycling and eco-investment in EU countries/Source: Own contribution.
The Eurostat database is the most important source of data regarding e-waste management in the EU. The indicators considered for this research were selected among those present in Eurostat database in different categories of interest for the analyzed subject:
- “Waste electrical and electronic equipment by waste management operations.” This is a series of indicators that cover many aspects of e-waste management, from the collected e-waste to recycled and reused e-waste. This range of indicators is presented in the Environment and Energy category (https://appsso.eurostat.ec.europa.eu/nui/show.do?dataset=env_waselee&lang=en).
- “Private investments, jobs and gross value added related to circular economy sectors” is the statistical indicator used for eco-investment, which can be found in the Circular Economy indicators category of the Eurostat database, under the section Competitiveness and Innovation (https://ec.europa.eu/eurostat/databrowser/view/cei_cie010/default/table?lang=en).
In the following sections, we review these classes of indicators, taking into consideration also the several changes made in their categories and/or the reform of the indicators analyzing the process of e-waste management, followed by evolution analysis for the two main indicators used in this research, namely, e-waste recycling and eco-investment.
2.2.1 E-Waste Recycling in the EU: Evolution and Analysis
Data on WEEE available in Eurostat database are collected from EU member states and a few other countries in order to monitor compliance with the quantitative targets for the collection, preparing for reuse, recycling, and recovery of e-waste, according to the EU Directive 19/2012.
The definition of electronic equipment and of electronic waste, for the purpose of monitoring WEEE management, is as follows:
• “Electrical and electronic equipment (EEE) means equipment which is dependent on electric currents or electromagnetic fields in order to work properly as well as equipment for generation, transfer and measurement of this currents.”
• “Waste electrical and electronic equipment (WEEE) represent the above-mentioned machineries that have exceeded their lifetime expectancy, also including all components, sub-assemblies and consumables, which are part of the product at the time of discarding.”
The Eurostat classification, encompassing 10 major categories, was used for statistical purposes until 2018. However, since 2019, the electronic equipment has been divided into six categories: temperature exchange equipment; big screens and monitors; lamps; large household appliances and IT equipment; small household appliance and other electronic equipment; and small IT and telecommunication equipment.
There are a number of waste management operations considered by Eurostat for each of the above categories of electric and electronic equipment (EEE). The classification of these operations has also changed since 2018, expanding from six categories to nine categories: EEE placed on the market (POM); WEEE generated; WEEE collected; WEEE collection rate; WEEE preparing for re-use; WEEE recycling; WEEE preparing for re-use and recycling; WEEE recovery; and WEEE treated (in the member state, in another member state, and outside the EU).
For the purposes of this research, because the Eurostat database includes statistical updates since 2018, the authors have taken into consideration the first classification, with 10 categories of electronic equipment. For statistical purposes, a common methodology was established for the calculation of EEE weight placed on the market by each member state and for the calculation of e-waste quantity generated by weight in each member state.
In order to analyze the recovery targets, according to EU Directive 19/2012, the target achievement must be calculated for each category by dividing the e-waste weight at entry in the recovery (recycling/preparing for re-use) facility by the weight of total e-waste collected for each category, expressed as a percentage. The basic reporting unit is the company or institution performing the action (enterprises, producers, distributors, importers, local units, exporters, households, etc.) and may be different from one country to another.
All analyzed indicators—e-waste collected, e-waste treated, e-waste recycled and prepared for reuse—are expressed in kg per inhabitant based on the annual average size of the population. They are reported for every year, starting in 2005. Unfortunately, not all reporting countries have data for every year, so the analysis might have statistical gaps.
The first analyzed indicator, namely, e-waste collected, is expressed in kg per inhabitant per year. The data in Table 1 presents a selected number of EU countries in order to show the evolution of this indicator.
TABLE 1
| Country | 2009 | 2010 | 2011 | 2012 | 2013 | 2014 | 2015 | 2016 | 2017 | 2018 |
|---|---|---|---|---|---|---|---|---|---|---|
| EU 28 (2013–2020) | 6.9 | 6.9 | 6.7 | 6.8 | 6.06 | 6.2 | 6.91 | 7.99 | 8.02 | 7.84 |
| Bulgaria | 4.49 | 6.09 | 5.5 | 5.26 | 4.84 | 5.86 | 8.64 | 8.63 | 7.7 | 7.49 |
| Germany | 10.16 | 9.5 | 8.85 | 8.59 | 9.03 | 8.93 | 8.84 | 9.5 | 10.13 | 10.29 |
| Sweden | 16.53 | 17.21 | 18.69 | 17.71 | 18.39 | 14.94 | 14.69 | 16.45 | 14.06 | 14.19 |
| Spain | 2.96 | 3.39 | 3.29 | 3.38 | 4.49 | 3.98 | 4.97 | 5.38 | 6.16 | 6.85 |
| France | 6.1 | 6.69 | 7.22 | 7.19 | 7.29 | 7.88 | 9.28 | 10.82 | 11.1 | 12.16 |
| Italy | 8.82 | 9.83 | 9.17 | 8.35 | 7.26 | 5.17 | 5.67 | 5.96 | 6.3 | 6.97 |
| Poland | 2.8 | 2.95 | 3.77 | 4.61 | 4.51 | 4.55 | 5.24 | 6.13 | 6.49 | 6.73 |
| Romania | 1.9 | 1.3 | 1.04 | 1.15 | 1.66 | 1.62 | 2.06 | 2.37 | 2.54 | 3.28 |
Collected e-waste in some EU Countries (kg/inhabit./year)/Source: http://appsso.eurostat.ec.europa.eu/nui/show.do?dataset=env_waselee; Eurostat (2022).
Italics represents the highest values of the analysed indicator.
The average EU level of e-waste collected has a very slightly growing trend. There are some countries with a high e-waste collection level—Sweden, the United Kingdom, France, and Germany—with numbers above the EU average. Sweden has the highest values for every year in the analyzed period, although the national trend is downwards (from 16.53 kg/inhabitant in 2009 to 14.19 kg/inhabitant in 2018).
Also, it may be noticed there are many other member states with a low e-waste collection level: Spain; Bulgaria; and Romania. The trend of these countries is upward, but the value of the indicator is below the EU average. Romania is ranked in last place in the EU regarding the e-waste collected per inhabitant in each year of the analyzed period. It must be mentioned though that the trend is ascending and the collected e-waste quantity has doubled (from 1.9 kg per inhabitant in 2009 to 3.28 kg/inhabitant in 2018).
Figure 3 presents the evolution of the e-waste treatment in the EU and some selected member states. The trends of the e-waste collected indicator can be seen here as well: the same group of countries have figures above the EU average. Sweden has the highest values for the e-waste treatment indicator, but with a downward trend (from 16.45 kg/inhabitant in 2009 to 14.19 kg/inhabitant in 2018). Germany and France are above the EU average with a slightly growing trend, and the United Kingdom has a marked trend switching (increasing until 2016 and then decreasing).
FIGURE 3
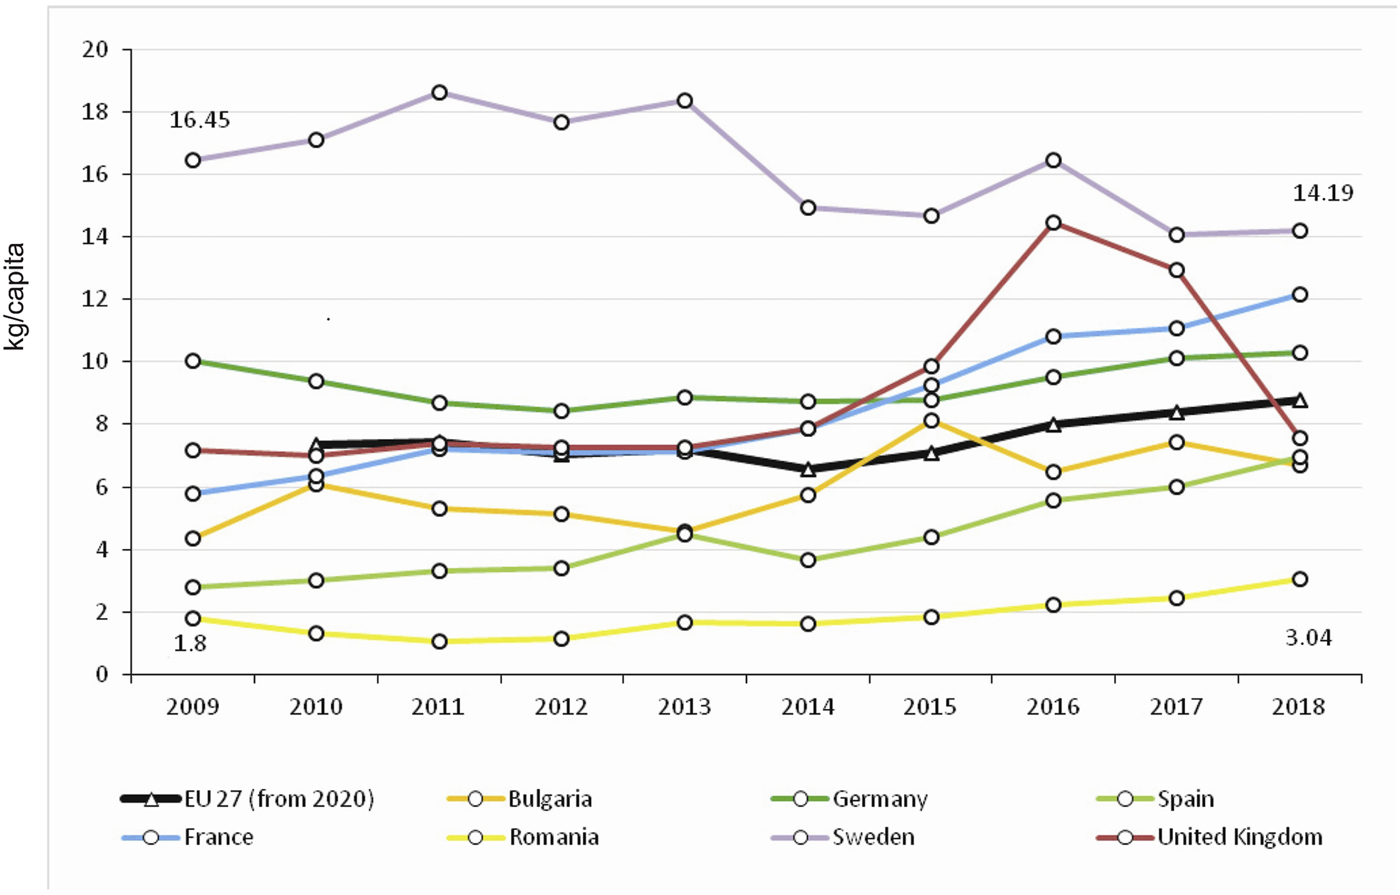
E-waste treatment in selected EU countries, kg/capita (2009–2018)/Source: Own compilation from Eurostat data.
The group of countries below the EU average are also similar to those from the previous indicator: Bulgaria; Spain; and Romania. For e-waste treatment, again, Romania is ranked in last position in the EU, although the value of the indicator has significantly increased by 68.9%, from 1.8 kg/inhabitant in 2009 to 3.04 kg/inhabitant in 2018 (Figure 3).
Figure 4 presents the evolution of the next important indicator (e-waste recycling and preparing for reuse) in selected EU member states. The indicator follows almost the same trend as e-waste collected and e-waste treatment.
FIGURE 4
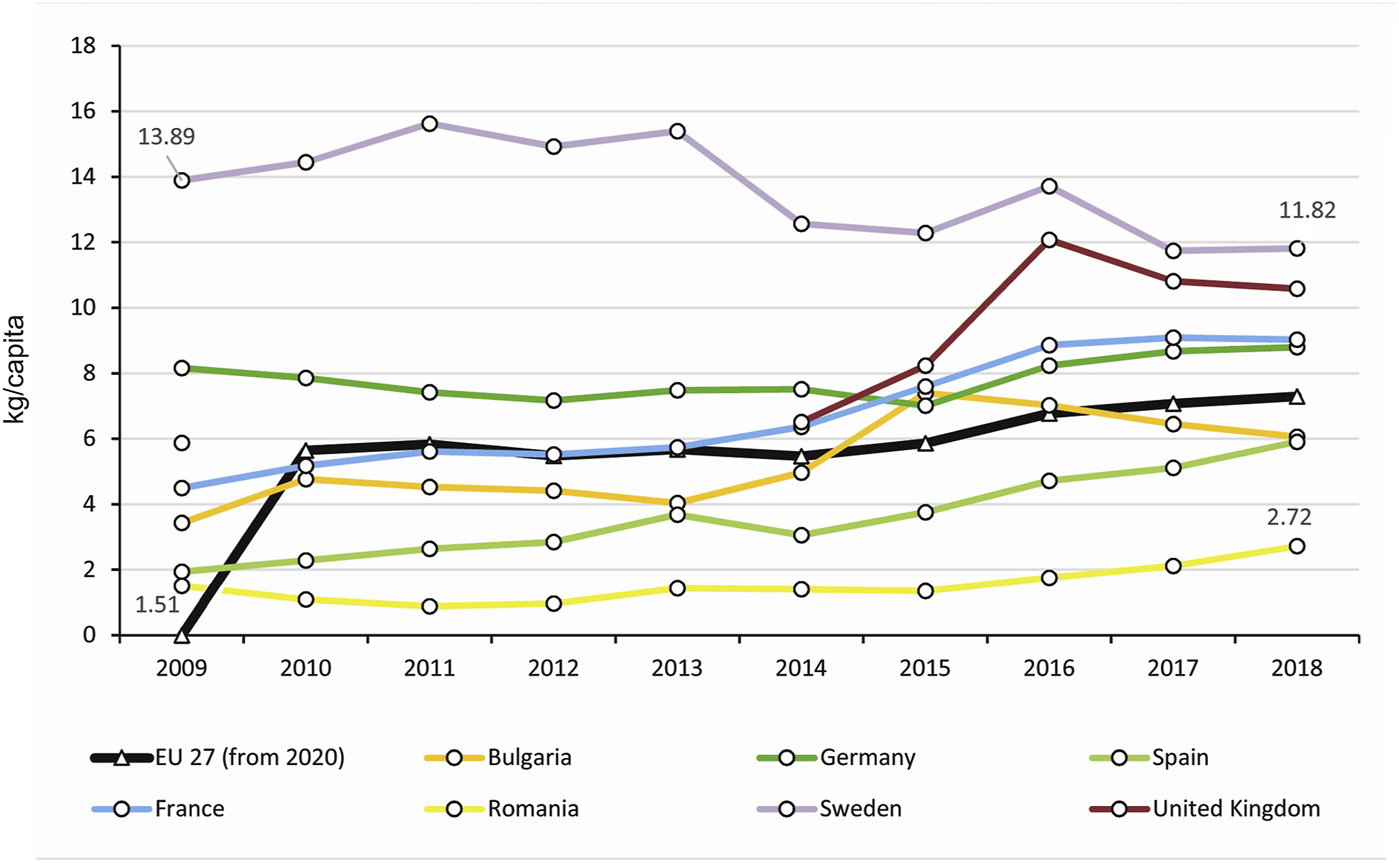
E-waste recycling and preparing for reuse in selected EU countries, kg/capita (2009–2018)/Source: Own compilation from Eurostat data.
Above the EU average levels are the same four countries (Sweden, the United Kingdom, Germany, and France), although it must be mentioned that the United Kingdom did not provide data for the 2010–2013 period.
Below the EU average can be found again Bulgaria, Spain, and Romania. Although the values are on an ascending trend and the values have almost doubled in the analyzed period (from 1.51 kg/capita in 2009 to 2.72 kg/capita in 2018), Romania is again ranked in last position in the EU.
2.2.2 Eco-Investment in the EU
The statistical indicator used here to analyze eco-investment is found in the Eurostat database under the label “Private investments, jobs and gross value added related to circular economy sectors.” It is found within the Circular Economy indicators and is used to monitor progress to achieve competitiveness and innovation targets.
Innovation and investments in areas such as recycling processes, industrial symbiosis, eco-design, or secondary raw materials are key elements of the transition to the circular economy. There are some specific sectors closely related to the circular economy, such as the recycling, repair, and reuse sectors. These are job-intensive economic sectors with important contributions to local employment, which is one of the most important EU circular economy goals.
The indicator “Private investments, jobs and gross value added related to circular economy sectors” includes several sub-sections, namely, gross investment in tangible goods, number of persons employed, and value added at factor costs, in two main sectors (the recycling sector and the repair and reuse sector). The data presented are collected within the frame of the Structural Business Statistics and, for statistical use, the following definitions are in use.
• Gross investment in tangible goods—represents investment during the reference year in all tangible goods. Investments in intangible and financial assets are not included.
• Jobs—represents the number of persons employed, also as a percentage of total employment.
• Value added at factor costs—is the gross income from operating activities after adjusting for operating subsidies and indirect taxes.
The unit of measurement for private investments and gross value added is million euros and the percentage of GDP. For jobs, the unit of measurement is the number of persons employed and the percentage of total employment.
The eco-investment indicator has a yearly frequency of dissemination, with new data being disseminated within two years after the reference year. However, the latest available data in the Eurostat database are from 2018.
For the eco-investment evolution analysis, this research has taken into account the statistical data present in the Eurostat database for the indicator named “Gross investment in tangible goods.” It is expressed in millions of euros and as a percentage of GDP. Some European countries have not provided data for this indicator.
For the analyzed period, 2008–2018, the authors chose four countries with complete data: Sweden; Germany; Spain; and Romania.
The two figures below present the situation for these countries, for the two units of measures. Spain and Sweden have average values in both graphics, both in absolute values and in percentage of GDP.
Looking at Figure 5, the graphic with absolute values, Germany has the highest level of eco-investment. For the percentage of GDP (Figure 6), Germany is in a lower position (lower than the EU average).
FIGURE 5
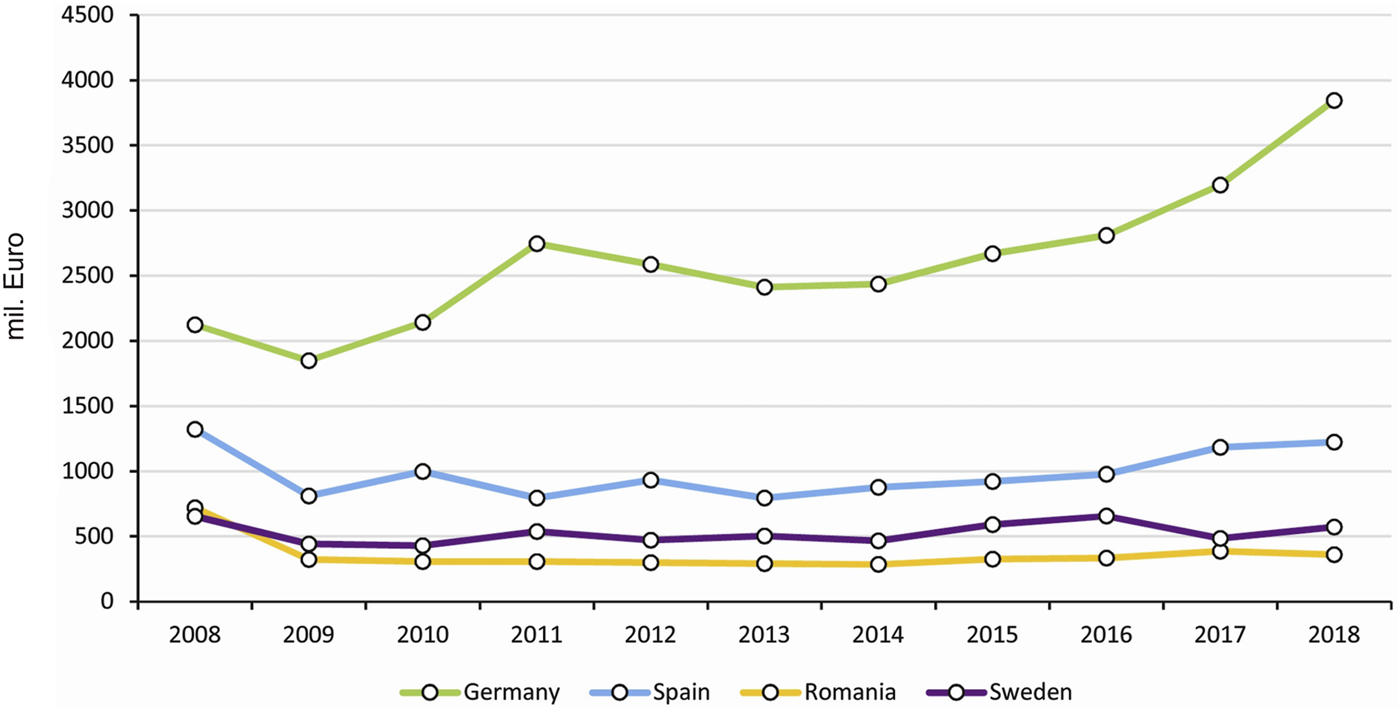
Gross investments in tangible goods in selected European countries (million euros, 2009–2018)/Source: Own compilation from Eurostat data.
FIGURE 6
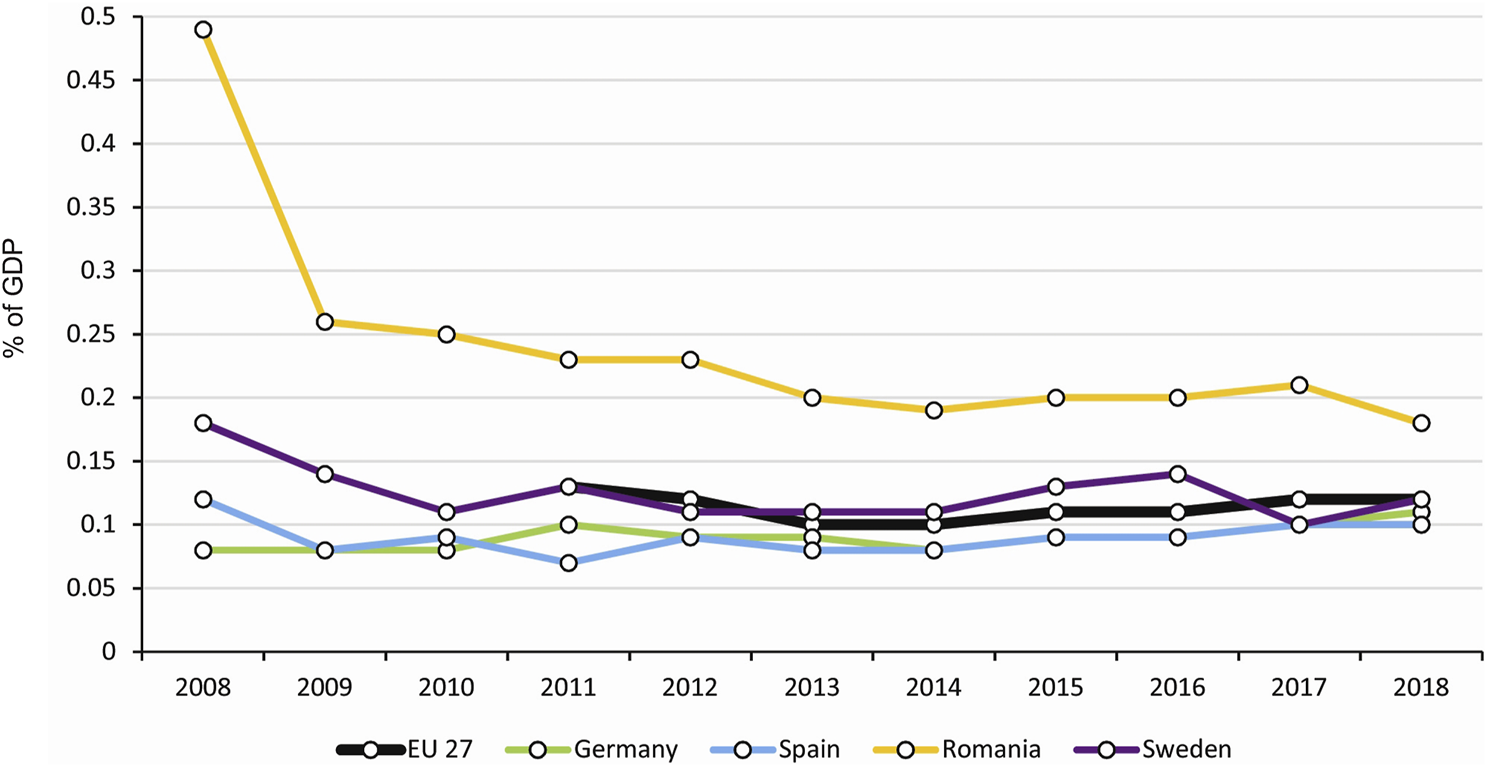
Gross investments in tangible goods in selected European countries (percentage of GDP, 2008–2018)/Source: Own compilation from Eurostat data.
Although, in absolute values, Romania is ranked in last place in the EU, as percentage of GDP, the gross investment in tangible goods places Romania higher than the EU average and also higher than most developed European countries. The analysis thus show that numbers can be misleading: Romania seems to be in a good position relative to other EU countries; it is just has a low national GDP.
2.2.3 Econometric Analysis: Method Used
All calculations are made using panel data for 24 countries and a time frame of 10 years (2009–2018). We use the notation presented in the Table 2.
TABLE 2
| Variables | Indicator | Notation used | Variables in model |
|---|---|---|---|
| Y it | E-waste recycling (kg/inhab.) | E-waste2 | E-waste2 |
| X it | Investment (€/inhab.) | Invest_recycl | Investment/capita |
Notations used in the panel data model/Source: Own compilation.
Step 1: Visual analysis of the data.
The first step is to draw a scatter plot (Figure 7) to see if there is any sort of relationship between the series selected (eco-investment and e-waste recycling).
FIGURE 7
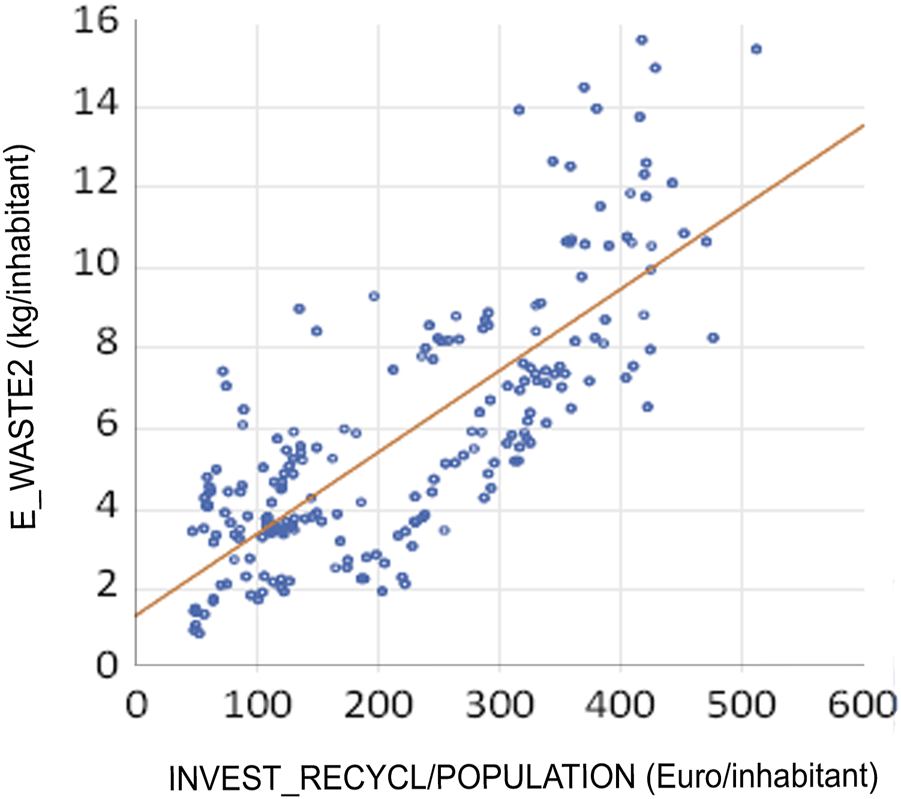
Scatter plot of the series selected for the model (e-waste recycling and eco-investment)/Source: Own processing data from Eurostat.
Step 2: Identifying the model.
We estimate a model for panel regression based on Eq. 1.
All estimations are carried out with the help of the EViews 11 software package. We use three types of panel data models: pooled model; fixed effect (FE) model; and random effect (RE) model.
In the pooled model, the coefficients of the two variables are specified as constant, which is the usual hypothesis for cross-sectional analysis.
Y it is the dependent variable and the matrix Xit includes the explanatory variables. The cross-section (countries) dimension is represented by i, the time dimension is represented by t, and uit is the error term.
Individual specific effects models take into account unobserved heterogeneity along cross-sections and include it in the term αi. If αi is correlated with the regressors Xit, we are dealing with a FE model. If the respective correlation is not detected, we are dealing with a RE model.
The FE model allows the individual specific effects (αi) to be correlated with the regressors; this term is included in the model as the intercept. The FE model is as follows:
The RE model is based on the assumption that the individual specific effects (αi) are distributed autonomously of regressors and are included in the error term. The RE model is as follows:
Step 3: Selecting the most appropriate model.
In order to select the most appropriate model, first we compare the pooled model with the FE model using Breusch–Pagan test. The null hypothesis for the test (H0) is: no effect of differences of cross-sections on the intercept. If the test rejects the null hypothesis, then we analyze the FE and RE models.
The RE estimation considers that the random effects are not correlated with the explanatory variables. A method for testing this assumption is to employ the Hausman test to compare the fixed and random effects estimates of coefficients. If the Hausman test is statistically significant (< 5%), we should use the FE model. If the test is not statistically significant, we should use the RE model (Wooldridge, 2002; Baltagi, 2005).
Step 4: Discussing and interpreting the model selected.
The last step is to discuss and interpret the model selected, as well as interpreting the heterogeneity among the countries within the model.
3 Results
In this section, we present and analyze the influence of eco-investment on e-waste recycling in the EU, in the period 2009–2018, in order to observe some of the main trends and developments.
3.1 Modeling the Influence of Eco-Investment on E-Waste Recycling
The first step is to draw a scatter plot in order to visualize the possible relationship between the independent variable (e-waste recycling, kg/inhabitant) and the regressor (investment/capita, €/cap.).
As can be seen in Figure 7, the regression line shows that a relation between the variables is present.
The next step is to draft the pooled model as described in the Eq. 1. First, we perform the Breusch–Pagan test (Table 3). The null hypothesis is that there are no cross-section effects. As we can see, the probability is almost zero for cross-section so we reject the null hypothesis and accept the alternate hypothesis, meaning that there are random or fixed effects in our model.
TABLE 3
| Lagrange multiplier tests for random effects | |||
| Null hypotheses: No effects | |||
| Alternative hypotheses: Two-sided (Breusch–Pagan) and one-sided | |||
| (All other) alternatives | |||
| Test hypothesis | |||
| Cross-section | Time | Both | |
| Breusch–Pagan | 442.3866 | 0.898578 | 443.2852 |
| (0.0000) | (0.3432) | (0.0000) | |
Breusch–Pagan test/Source: Own calculation using EViews 11.
The analysis continued by applying the Hausman test in order to identify the most appropriate model (FE or RE). The null hypothesis is: the RE model is appropriate.
As we can see in Table 4, the probability associated with the null hypothesis is zero (p < 0.0000), so we reject the null and accept the alternate hypothesis: the FE model is appropriate.
TABLE 4
| Correlated random effects—Hausman test | ||||
| Equation: Eq_ewaste2_invest | ||||
| Test cross-section random effects | ||||
| Test summary | Chi-sq. statistic | Chi-sq. df | Prob. | |
| Cross-section random | 17.521849 | 1 | 0.0000 | |
| Cross-section random effects test comparisons | ||||
| Variable | Fixed | Random | Var (diff.) | Prob. |
| Investment_recycl/population | 0.002529 | 0.000259 | 0.000000 | 0.0000 |
Hausman test/Source: Own calculation using EViews 11.
After applying the two tests, we conclude that a panel regression with fixed effects was appropriate, being supported by the Breush-Pagan test and the Hausman test. The estimations of the regression coefficients and the related statistical tests are presented in Table 5.
TABLE 5
| Dependent variable: E-waste2 | ||||
| Method: Panel least squares | ||||
| Sample: 2009–2018 | ||||
| Periods included: 10 | ||||
| Cross-sections included: 24 | ||||
| Total panel (unbalanced) observations: 212 | ||||
| Variable | Coefficient | Std. error | t-statistic | Prob. |
| C | 1.245711 | 0.606767 | 2.053030 | 0.0415 |
| Investment_recycl/population | 0.020780 | 0.002721 | 7.637057 | 0.0000 |
| Effects specification | ||||
| Cross-section fixed (dummy variables) | ||||
| Root MSE | 1.028788 | R-squared | 0.895129 | |
| Mean dependent var. | 5.843868 | Adjusted r-squared | 0.881669 | |
| SD dependent var. | 3.184371 | SE of regression | 1.095400 | |
| Akaike info. Criterion | 3.130488 | Sum squared resid. | 224.3816 | |
| Schwarz criterion | 3.526312 | Log likelihood | −306.8317 | |
| Hannan–Quinn criterion | 3.290471 | F-statistic | 66.50561 | |
| Durbin–Watson stat. | 0.653771 | Prob. (F-statistic) | 0.000000 | |
Parameters of the fixed effect (FE) model (FEM)/Source: Own calculation using EViews 11.
From Table 5, we conclude that coefficients of the model are statistically significant, so investment is a significant predictor. The intercept has the value of 1.245711 and it is statistically significant (p = 0.0415 < 0.05). The coefficient for the regressor has the value of 0.02 and is statistically significant (p < 0.0000). The positive value indicates that, when the independent variable increases by 10 units (€/inhab.), the dependent variable has a moderate increase of 0.2%.
We note that the FE model has an R-squared value of 0.895129, which means that the regressors explain a significant part of the variation of the dependent variable (89.5%). The F test has zero probability [Prob(F-statistic) = 0.000000], so we conclude that all coefficients in the model are different from zero and the model is valid.
The final form of the FE model is as follows:
Figure 8 is the graphical representation of Eq. 2.
FIGURE 8
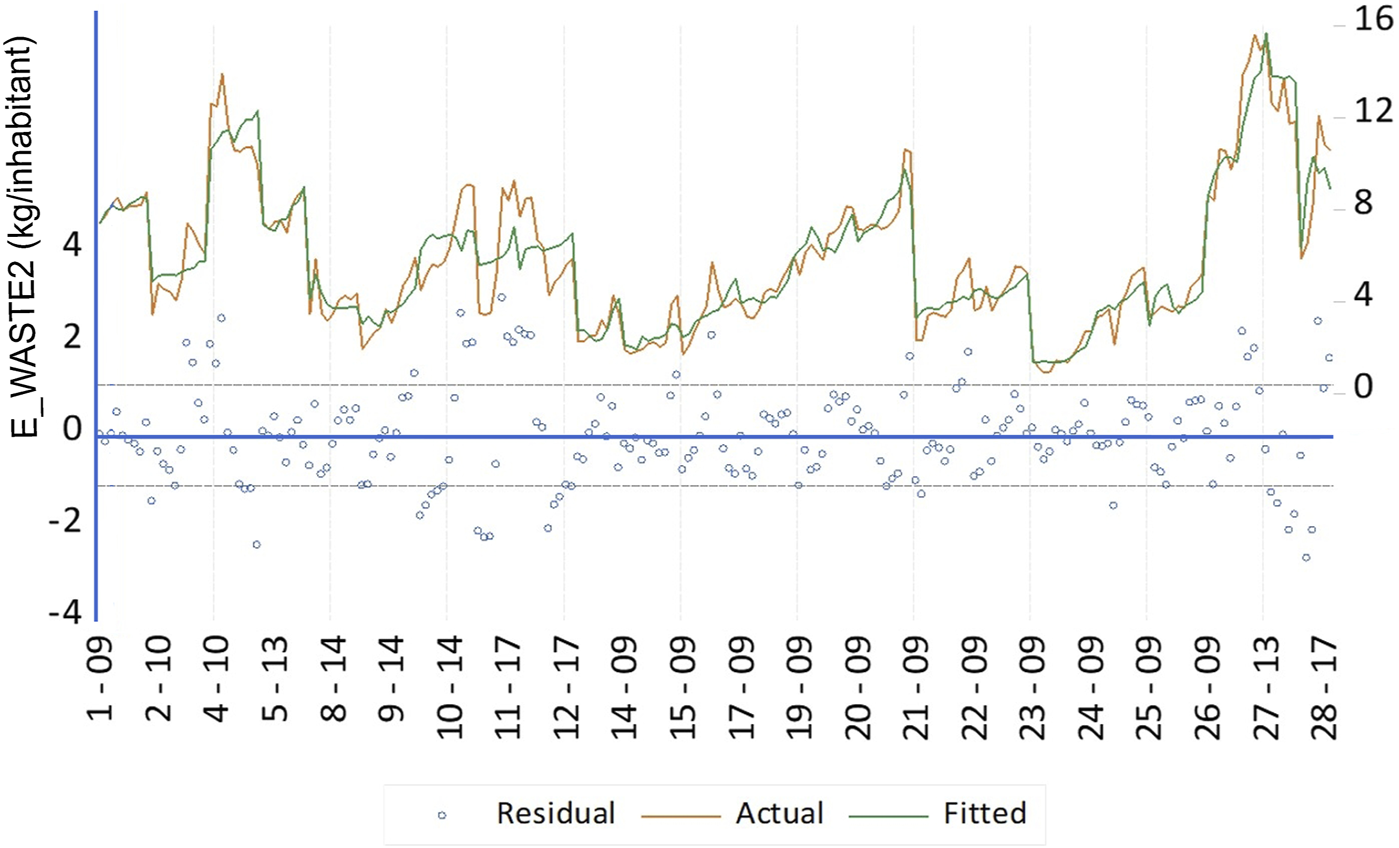
Influence of eco-investment on e-waste recycling in the EU (kg/inhab/year, 2008–2018)/Source: Own calculation using EViews 11.
The FE model accounts for heterogeneity among the 24 countries used in the analysis. Table 6 presents the intercepts for all 24 countries within the model.
TABLE 6
| Country | Intercept |
|---|---|
| Spain | −1.2181 |
| Cyprus | −1.1591 |
| Slovenia | −0.9753 |
| Netherlands | −0.2506 |
| Latvia | −0.0859 |
| Austria | −0.0736 |
| France | 0.1338 |
| Germany | 0.2790 |
| Italy | 0.3017 |
| Romania | 0.3200 |
| The United Kingdom | 0.3731 |
| Lithuania | 1.1132 |
| Poland | 1.3802 |
| Estonia | 1.3945 |
| Slovakia | 1.5560 |
| Portugal | 1.8110 |
| Hungary | 2.3622 |
| Greece | 2.5237 |
| Finland | 2.5811 |
| Belgium | 2.9895 |
| Croatia | 3.1411 |
| Denmark | 3.4556 |
| Bulgaria | 3.8878 |
| Sweden | 5.0333 |
Intercept for the countries within the FEM/Source: Own calculation using EViews 11.
In the FE model, the slope is 0.02078 and is constant for all countries, but the intercepts are different for each country and are fixed in time. The intercept shows what the e-waste recycling (kg/capita) in a country would be when eco-investment is zero. This parameter can be interpreted as the existing recycling capacity before investment in recycling is made. For the group of 24 countries included in the FE model, the average intercept is positive (1.245 kg/capita—Eq. 2), meaning that without investment we still have some recycling in the group.
The situation when the intercept is negative is more complicated. There is a group of countries (Spain, Cyprus, Slovenia, and Netherlands) that have negative intercepts, meaning that without investment in recycling the quantity of e-waste recycled is negative (the stock of e-waste will increase). Latvia and Austria have intercepts near zero, so without investment the recycling quantity will not change much.
At the other end are countries like Sweden, which has the highest intercept, so it should have significant recycling capacities for e-waste (5.033 kg/capita). Sweden is followed by Belgium, Denmark, Finland, Croatia, and Bulgaria. These countries have higher values for the intercept, showing higher capacities in e-waste recycling than average. Other countries showed an intercept in the interval [1; 3 (kg/inhab.)], which means a moderate recycling capacity.
There is a group of countries (France, Germany, Italy, Romania, and the United Kingdom) with intercepts between [0; 1]. These values indicate that the capacity of recycling is still low and further investment would increase the e-waste recycling effectiveness.
The model adopted has some limits and boundaries. For instance, the negative values for the intercept could be the result of waste trade among member states. It is a reality that some countries have greater recycling capacities for electric and electronic waste, while other countries, with low capacities, just export the waste.
3.2 Introducing a Control Variable
The model presented and analyzed earlier uses only one independent variable, therefore potentially ignoring some impacts that could be important outside of the framework of eco-investment policy. To compensate for this, a control variable is included in the model to ensure that the model fits the policy practice context better. Usually, a control variable is introduced in a model in order to avoid or reduce the risk of attributing exclusive explanatory power to a single predictor.
The control variable is Internet access, which measures the spread of the Internet in the society. The indicator measures the percentage of households that have access to the Internet (2011–2020). Expanding Internet access in the society has many benefits in reducing transaction costs. At the same time, Internet access can be considered a driver for more computers, phones, TV sets, servers, modems, and other electric and electronic equipment that individuals and firms may acquire in areas that have improved Internet connections. Increasing the stock of electric and electronic equipment may have a significant impact on e-waste generated over time. It is also important to mention that Internet access may contribute to the better recycling of e-waste.
Therefore, we modify the model described in Eq. 2 by adding the new variable Internet (%), which is provided by the Eurostat database. The outcome is presented in Table 7.
TABLE 7
| Dependent variable: E-waste_WASTE2 | ||||
| Method: Panel least squares | ||||
| Sample: 2000–2018 if Ireland = 0 and Malta = 0 and Luxembourg = 0 | ||||
| And Czechia = 0 | ||||
| Periods included: 8 | ||||
| Cross-sections included: 24 | ||||
| Total panel (unbalanced) observations: 173 | ||||
| Variable | Coefficient | Std. error | t-statistic | Prob. |
| C | −2.078761 | 1.037862 | −2.002926 | 0.0470 |
| Investment_recycl/population | 0.014520 | 0.004185 | 3.469855 | 0.0007 |
| Internet | 0.061497 | 0.015731 | 3.909297 | 0.0001 |
| Effects specification | ||||
| Cross-section fixed (dummy variables) | ||||
| Root MSE | 0.939752 | R-squared | 0.906364 | |
| Mean dependent var. | 5.993064 | Adjusted r-squared | 0.890439 | |
| SD dependent var. | 3.079998 | SE of regression | 1.019477 | |
| Akaike info. criterion | 3.014176 | Sum squared resid. | 152.7821 | |
| Schwarz criterion | 3.488081 | Log likelihood | −234.7262 | |
| Hannan–Quinn criterion | 3.206437 | F-statistic | 56.91631 | |
| Durbin–Watson stat. | 0.858951 | Prob. (F-statistic) | 0.000000 | |
Introducing the Internet variable into the model/Source: Own calculation using EViews 11.
The model is now described by the following equation:
First, we notice that both predictors (investment and Internet) are statistically significant, and the coefficients have positive values. The intercept is negative and statistically significant. Second, we see that the coefficient for investment diminishes from 0.020 in Eq. 2 to 0.0145 in Eq. 3 (a decrease of 7.25%).
The R-squared value for Eq. 2 (0.89) is close to the value for Eq. 3 (0.90), indicating that both equations have an adequate fit. This outcome shows that, after introducing the control variable, the initial relationship (Eq. 2) remains at about the same level of intensity and in the same direction (positive) for the investment regressor. Therefore, we conclude that the initial relationship is valid.
3.3 Policy Suggestions
Although this was not among the primary goals of our research, the outcomes may allow us to also outline some policy suggestions.
Investment in e-waste recycling is important in building and modernizing recycling capacities. So far, the markets for e-waste recycling are fragmentated and confined around cities with a high concentration of electric and electronic equipment. Therefore, it is important to note that that policy and administrative measures do not interfere much in the e-waste market for recycling.
Moreover, some European countries already have significant capacities for e-waste recycling (Sweden, the United Kingdom, Germany, and others). Therefore, it is not appropriate and efficient for the other EU countries to develop more e-waste recycling infrastructure. Instead, it is more suitable to eliminate the existing barriers that hinder e-waste trade.
Further, the use of economic instruments, such as deposit-refund or green stamps, should be expanded in order to encourage people to eliminate e-waste in a rational manner.
Last but not least, in order to reduce the quantity of e-waste, more measures are needed to reduce the amount of generated e-waste at the source.
4 Discussion and Conclusion
This paper has presented an extended analysis of selected circular economy indicators, namely, e-waste recycling and eco-investment, in particular EU countries. In order to analyze the recycling of e-waste, the authors presented the evolution of collected and treated e-waste. The research revealed a constant but very slow increase in all e-waste management activities. The EU trend shows a very slow increase for the analyzed period (2008–2018). The countries analyzed in this research are following slightly different trends, depending on their development level (measured by GDP): the developed countries (Sweden, Germany, France, the United Kingdom) have higher levels of e-waste collection and recycling, while the less developed countries are struggling to catch up, with very low levels of e-waste recycling (Romania, Cyprus). The eco-investment analysis also showed an increasing trend in most of the countries found in the Eurostat database for the analyzed period.
For the econometric analysis, the authors performed calculations on panel data for 24 countries and the period (2008–2018). The model was realized for two indicators: e-waste recycling (kg/inhabitant); and eco-investment (Euro/inhabitant). The four-steps analysis followed these stages: first—visual analysis of the data and drawing a scatter plot; second—identification of the proper model type to use (pooled model, FE model, RE model); third—selection of the most appropriate model for these indicators; and fourth—introducing a control variable. This was followed by the discussion and interpretation of the results.
The most appropriate model for this research was found to be the FE model, which accounts for heterogeneity among the 24 countries used in the analysis. The analysis showed what the level of e-waste recycling will be in each country with and without investments. For the 24 member states included in the FE model, the average intercept was positive (1.245 kg/inhabitant), which shows that, overall, even without eco-investment, there would still be some degree of e-waste recycling.
The analysis of heterogeneity showed that Sweden has the highest intercept value. This means that Sweden has a significant e-waste recycling capacity (5 kg/capita). Sweden was followed by Belgium, Denmark, Finland, Croatia, and Bulgaria, all of which showed high values for the intercept, indicating higher than average capacities in e-waste recycling. Other countries (Lithuania, Poland, Estonia, Slovakia, Hungary, Portugal, Greece, and Finland) showed an intercept in the interval [1; 3], which means a moderate recycling capacity. The next group of countries (France, Germany, Italy, Romania, and the United Kingdom) also had positive intercepts, but with low values, between [0; 1]. This may indicate that they have a low e-waste recycling capacity that requires further investment in order to increase e-waste recycling.
The situation is different when the intercept is negative. For Austria and Latvia, which have negative but close to zero intercepts, the results mean that no eco-investment will not greatly influence e-waste recycling. For the last group of countries with the lowest negative intercept (Spain, Cyprus, Slovenia, and Netherlands), the result means that with no investment in recycling, the quantity of e-waste recycled will decrease.
These results should be read with caution due to the fact that there is a significant e-waste trade among member states, which was not taken into account. A country may export its e-waste to a country specialized in recycling instead of investing in its own capacities. This trade could influence the final results, so future research should take this into consideration.
By introducing a control variable (Internet), it was possible to show that the selected model (Eq. 2) is valid. The intensity and direction of the interaction between e-waste recycling and eco-investment did not change much. Introducing the new variable (Eq. 3) slightly improve the overall performance indicators of the model.
This also shows that there is a robust direct correlation between the increase in eco-investment and the performance of e-waste management.
The overall results of the research show that there is a real connection between eco-investment and the e-waste recycling level in EU countries. An eco-investment increase would give a boost to e-waste collection and recycling, helping to reach the EU targets and to progress towards a more sustainable and circular economy. Future research in this direction is needed, as e-waste quantities are increasing rapidly due to the penetration of Internet technologies and eco-investment having a much slower growth rate. Further, the importance of other indicators, such as eco-innovation and e-waste trade, should be considered to expand this research.
Statements
Data availability statement
The original contributions presented in the study are included in the article/Supplementary Material, and further inquiries can be directed to the corresponding author.
Author contributions
AC and VP conceived the study and were responsible for the design and development of the data analysis. VP and SF were responsible for data interpretation. AC wrote the first draft of the article. MS and RM were responsible for data collection, analysis and for reviewing first draft of the article. DA and SF were responsible for general assembly of the article, English translation, template compliance and other proofreading corrections and syntax modifications.
Funding
This paper received financial support through the project entitled DECIDE—Development through entrepreneurial education and innovative doctoral and postdoctoral research, project code POCU/380/6/13/125031, a project co-financed from the European Social Fund through the Operational Program Human Capital 2014–2020.
Conflict of interest
The authors declare that the research was conducted in the absence of any commercial or financial relationships that could be construed as a potential conflict of interest.
Publisher’s note
All claims expressed in this article are solely those of the authors and do not necessarily represent those of their affiliated organizations, or those of the publisher, the editors and the reviewers. Any product that may be evaluated in this article, or claim that may be made by its manufacturer, is not guaranteed or endorsed by the publisher.
References
1
Abalansa S. El Mahrad B. Icely J. Newton A. (2021). Electronic Waste, an Environmental Problem Exported to Developing Countries: The GOOD, the BAD and the UGLY. Sustainability13, 5302. 10.3390/su13095302
2
Aldieri L. Brahmi M. Bruno B. Vinci C. P. (2021). Circular Economy Business Models: The Complementarities with Sharing Economy and Eco-Innovations Investments. Sustainability13, 12438. 10.3390/su132212438
3
Andersson M. Ljunggren Söderman M. Sandén B. A. (2019). Challenges of Recycling Multiple Scarce Metals: The Case of Swedish ELV and WEEE Recycling. Resour. Policy63, 101403. 10.1016/j.resourpol.2019.101403
4
Apostolescu N. Vizitiu M. A. Cernătescu C. Tătaru-Fărmuș R. E. Cobzaru C. Apostolescu G. A. (2022). Current Trends in the Recovery of Precious Metals from Electrical and Electronic Waste, Bul. Institutului Politehnic Iaşi68, 52. Nr.1. Available at: http://www.bipcic.icpm.tuiasi.ro/pdf/2022/1/bipi_cic_2022_1_04.pdf?fbclid=IwAR0hznvw7012pvdSeXmMOULVLC89gEi-PMCagMyoU4tyeMhFEAFD6qcC5fo.
5
Ardi R. Leisten R. (2016). Assessing the Role of Informal Sector in WEEE Management Systems: A System Dynamics Approach. Waste Manag.57, 3–16. 10.1016/j.wasman.2015.11.038
6
Awasthi A. K. Cucchiella F. D'Adamo I. Li J. Rosa P. Terzi S. et al (2018). Modelling the Correlations of E-Waste Quantity with Economic Increase. Sci. Total Environ.613-614, 46–53. 10.1016/j.scitotenv.2017.08.288
7
Baltagi B, H. (2005). Econometric Analysis of Panel Data. Third Edition. London, England: John Wiley & Sons.
8
Baxter J. Lyng K. A. Askham C. Hanssen O. J. (2016). High-quality Collection and Disposal of WEEE: Environmental Impacts and Resultant Issues. Waste Manag.57, 17–26. 10.1016/j.wasman.2016.02.005
9
Cialani C. Mortazavi R. (2020). The Cost of Urban Waste Management: An Empirical Analysis of Recycling Patterns in Italy. Front. Sustain. Cities2, 8. 10.3389/frsc.2020.00008
10
Dhir A. Koshta N. Goyal G. R. Sakashita M. Almotairi M. (2021). Behavioral Reasoning Theory (BRT) Perspectives on E-Waste Recycling and Management. J. Clean. Prod.280, 124269. 10.1016/j.jclepro.2020.124269
11
Diedler S. HobohmBatinic J. B. Kalverkamp M. RheinMain H. Kuchta K. (2018). WEEE Data Management in Germany and Serbia. Glob. Nest J.20, 751–757. 10.30955/gnj.002657
12
Eurostat (2022). Waste Electrical and Electronic Equipment (WEEE) by Waste Management Operations [Internet]. Available from: https://appsso.eurostat.ec.europa.eu/nui/show.do?dataset=env_waselee<=en (Accessed April 20, 2022).
13
Favot M. Grassetti L. Massarutto A. Veit R. (2022). Regulation and Competition in the Extended Producer Responsibility Models: Results in the WEEE Sector in Europe. Waste Manag.145, 60–71. 10.1016/j.wasman.2022.04.027
14
Fetanat A. Tayebi M. Shafipour G. (2021). Management of Waste Electrical and Electronic Equipment Based on Circular Economy Strategies: Navigating a Sustainability Transition toward Waste Management Sector. Clean. Techn Environ. Policy23, 343–369. 10.1007/s10098-020-02006-7
15
Frone S. Constantinescu A. (2013). The Role of Technological Innovation in Sustainable Economic Development. J. Knowl. Manag. Econom. Inf. Technol.4, 1–13.
16
Garg C. P. (2021). Modeling the E-Waste Mitigation Strategies Using Grey-Theory and DEMATEL Framework. J. Clean. Prod.281, 124035. 10.1016/j.jclepro.2020.124035
17
Islam M. T. Abdullah A. B. Shahir S. A. Kalam M. A. Masjuki H. H. Shumon M. R. et al (2016). A Public Survey on Knowledge, Awareness, Attitude and Willingness to Pay for WEEE Management: Case Study in Bangladesh. J. Clean. Prod.137, 728–740. 10.1016/j.jclepro.2016.07.111
18
Islam M. T. Huda N. Baumber A. Shumon R. Zaman A. Ali F. et al (2021). A Global Review of Consumer Behavior towards E-Waste and Implications for the Circular Economy. J. Clean. Prod.316, 128297. 10.1016/j.jclepro.2021.128297
19
Khan I. Zakari A. Zhang J. Dagar V. Singh S. (2022). A Study of Trilemma Energy Balance, Clean Energy Transitions, and Economic Expansion in the Midst of Environmental Sustainability: New Insights from Three Trilemma Leadership. Energy248, 123619. 10.1016/j.energy.2022.123619
20
Kumar A. (2019). Exploring Young Adults’ E-Waste Recycling Behaviour Using an Extended Theory of Planned Behaviour Model: A Cross-Cultural Study. Resour. Conservation Recycl.141, 378–389. 10.1016/j.resconrec.2018.10.013
21
Kumar A. Gaur D. Liu Y. Sharma D. (2022). Sustainable Waste Electrical and Electronic Equipment Management Guide in Emerging Economies Context: A Structural Model Approach. J. Clean. Prod.336, 130391. ISSN 0959-6526. 10.1016/j.jclepro.2022.130391
22
Llerena-Riascos C. Jaén S. Montoya-Torres J. R. Villegas J. G. (2021). An Optimization-Based System Dynamics Simulation for Sustainable Policy Design in WEEE Management Systems. Sustainability13, 11377. 10.3390/su132011377
23
Maurice A. A. Dinh K. N. Charpentier N. M. Brambilla A. Gabriel J. C. P. (2021). Dismantling of Printed Circuit Boards Enabling Electronic Components Sorting and Their Subsequent Treatment Open Improved Elemental Sustainability Opportunities. Sustainability13, 10357. 10.3390/su131810357
24
Mihaliková E. Taušová M. Čulková K. (2022). Public Expenses and Investment in Environmental Protection and its Impact on Waste Management. Sustainability14, 5270. 10.3390/su14095270
25
Mor R. S. Sangwan K. S. Singh S. Singh A. Kharub M. (2021). E-Waste Management for Environmental Sustainability: an Exploratory Study. Procedia CIRP98, 193–198. 10.1016/j.procir.2021.01.029
26
Murthy V. Ramakrishna S. (2022). A Review on Global E-Waste Management: Urban Mining towards a Sustainable Future and Circular Economy. Sustainability14, 647. 10.3390/su14020647
27
Nandy S. Fortunato E. Martins R. (2022). Green Economy and Waste Management: An Inevitable Plan for Materials Science. Prog. Nat. Sci. Mater. Int.32, 1–9. 10.1016/j.pnsc.2022.01.001
28
Ngwakwe C. C. Ambe C. M. (2016). Business Sustainability Performance Measurement: Eco-Ratio Analysis. Risk Gov. control financial Mark. institutions6 (4): 516. Special issue "Macroeconomic Risks and State Governance" https://virtusinterpress.org/IMG/pdf/10-22495_rgcv6i4siart10-2.pdf.
29
Nowakowski P. Kuśnierz S. Płoszaj J. Sosna P. (2021). Collecting Small-Waste Electrical and Electronic Equipment in Poland-How Can Containers Help in Disposal of E-Waste by Individuals?Sustainability13, 12422. 10.3390/su132212422
30
Platon V. Frone S. Frone A. Constantinescu S. Jurist S. (2020). Economic Instruments for WEEE Recycling in Romania. LUMEN Proc.14, 509–523. 10.18662/lumproc/ibmage2020/37
31
Purushothaman M. Inamdar M. G. Muthunarayanan V. (2021). Socio-economic Impact of the E-Waste Pollution in India. Mater. Today Proc.37, 280–283. 10.1016/j.matpr.2020.05.242
32
Roman E. (2012). “WEEE Management in Europe: Learning from Best Practice,” in Book: Waste Electric and Electronic Equipment (WEEE) Handbook. Editors GoodshipV.StevelsA. (Cambridge: Woodhead Publishing), 493–525. Chapter: 22. 10.1533/9780857096333.5.493
33
Sharma M. Joshi S. Govindan K. (2021). Issues and Solutions of Electronic Waste Urban Mining for Circular Economy Transition: An Indian Context. J. Environ. Manag.290, 112373. 10.1016/j.jenvman.2021.112373
34
Singh A. Panchal R. Naik M. (2020). Circular Economy Potential of E-Waste Collectors, Dismantlers, and Recyclers of Maharashtra: a Case Study. Environ. Sci. Pollut. Res.27, 22081–22099. 10.1007/s11356-020-08320-3
35
Sousa R. Agante E. Cerejeira J. Portela M. (2018). EEE Fees and the WEEE System - A Model of Efficiency and Income in European Countries. Waste Manag.79, 770–780. 10.1016/j.wasman.2018.08.008
36
Wang Q. Kong L. Li J. Li B. Wang F. (2020). Behavioral Evolutionary Analysis between the Government and Uncertified Recycler in China's E-Waste Recycling Management. Int. J. Environ. Res. Public Health17, 7221. 10.3390/ijerph17197221
37
Wang Z. Guo D. Wang X. (2016). Determinants of Residents' E-Waste Recycling Behaviour Intentions: Evidence from China. J. Clean. Prod.137, 850–860. 10.1016/j.jclepro.2016.07.155
38
Wijaya Y. Y. Effendi S. M. (2020). Implementasi Kebijakan Eco-Investment Pada Sebagai Perwujudan Pelaksanaan Pembangunan Berkelanjutan Berbasis Teknologi Dan Kesejahteraan. Jurist-Diction3, 365. Implementation of Eco-Investment Policy as a Realization of the Implementation of Technology-Based Sustainable Development and Welfare. 10.20473/jd.v3i1.17641
39
Woodard R. (2021). Waste Management in Small and Medium Enterprises (SMEs): Compliance with Duty of Care and Implications for the Circular Economy. J. Clean. Prod.278, 123770. 10.1016/j.jclepro.2020.123770
40
Wooldridge Jeffrey M. (2002). Econometric Analysis of Cross Section and Panel Data. Cambridge, MA: The MIT Press.
41
World Economic Forum (2019). A New Circular Vision for Electronics Time for a Global RebootGeneva, Switzerland. Available at: https://www3.weforum.org/docs/WEF_A_New_Circular_Vision_for_Electronics.pdf.
42
Xavier L. H. Ottoni M. Lepawsky J. (2021). Circular Economy and E-Waste Management in the Americas: Brazilian and Canadian Frameworks. J. Clean. Prod.297, 126570. 10.1016/j.jclepro.2021.126570
43
Zlamparet G. I. Li J. H. Stan S. D. Zheng l. X. (2015). Situation of WEEE in Two Capitals Beijing, China and Bucharest, Romania: A Comparison. Appl. Mech. Mater.768, 758–765. 10.4028/www.scientific.net/amm.768.758
Summary
Keywords
e-waste management, eco-investment, e-waste recycling, panel regression model, fixed effects
Citation
Constantinescu A, Platon V, Surugiu M, Frone S, Antonescu D and Mazilescu R (2022) The Influence of Eco-Investment on E-Waste Recycling-Evidence From EU Countries. Front. Environ. Sci. 10:928955. doi: 10.3389/fenvs.2022.928955
Received
26 April 2022
Accepted
21 June 2022
Published
22 July 2022
Volume
10 - 2022
Edited by
Muhlis Can, Beta Akademi-SSR Lab, Turkey
Reviewed by
Vishal Dagar, Great Lakes Institute of Management, India
Zhe Liu, Xi’an Jiaotong University, China
Updates
Copyright
© 2022 Constantinescu, Platon, Surugiu, Frone, Antonescu and Mazilescu.
This is an open-access article distributed under the terms of the Creative Commons Attribution License (CC BY). The use, distribution or reproduction in other forums is permitted, provided the original author(s) and the copyright owner(s) are credited and that the original publication in this journal is cited, in accordance with accepted academic practice. No use, distribution or reproduction is permitted which does not comply with these terms.
*Correspondence: Andreea Constantinescu, andreea_constantinescu07@yahoo.com
This article was submitted to Environmental Economics and Management, a section of the journal Frontiers in Environmental Science
Disclaimer
All claims expressed in this article are solely those of the authors and do not necessarily represent those of their affiliated organizations, or those of the publisher, the editors and the reviewers. Any product that may be evaluated in this article or claim that may be made by its manufacturer is not guaranteed or endorsed by the publisher.