 Yu Liu
 Xi Kuai
 Fei Su4
- 1Institute of Environment and Development, Guangdong Academy of Social Sciences, Guangzhou, China
- 2Shenzhen Key Laboratory of Spatial Information Smart Sensing and Services, Research Institute for Smart Cities, Shenzhen University, Shenzhen, China
- 3Peng Cheng Laboratory, Shenzhen, China
- 4School of Surveying and Geo-Informatics, Shandong Jianzhu University, Jinan, China
- 5School of Resource and Environmental Sciences, Wuhan University, Wuhan, China
- 6Key Laboratory of Regional Development and Environmental Response, Hubei University, Wuhan, China
The development of remote sensing technology largely reflects the scientific research level of a country or region. Given that the quantity and quality of research works are important indicators for scientific prowess evaluation, exploratory spatial data analysis and scientometric analysis of remote sensing work published from 2012 to 2021 were performed in this study, utilizing the Web of Sciences database. This study probed the spatial distribution and spatiotemporal evolution at the country/regional level to reveal the spatiotemporal characteristics of knowledge spillover in remote sensing. According to the results, the global spatial distribution of research output in remote sensing presented a significant dispersion; the United States and China were the most active countries. During the study period, Transferring Deep Convolutional Neural Networks for the Scene Classification of High-Resolution Remote Sensing Imagery was one of the most influential studies, both in the field of remote sensing and in the whole scientific community. With respect to the spatial evolution of research output in remote sensing, the gap between continents and the regional imbalance showed a downward trend, while Asia ranked first in the intracontinental disparity and Europe ranked last. For relevant countries/regions and institutions trying to optimize the spatial allocation of scientific and technological resources to narrow regional disparities, this study provides fundamental data and decision-making references.
1 Introduction
Remote sensing is a technology used to observe and explore target objectives and natural phenomena over long distances (Weng, 2012; Han et al., 2014; Cheng et al., 2017). Remote sensing technology can be used to objectively and accurately obtain timely information about various targets. Over the past few decades, remote sensing has been utilized to observe natural resources and Earth’s environment from multiple layers to collect data from areas of Earth to space for application in diverse fields, such as the atmosphere, ocean, resources, environment, economy, agriculture, forestry, urban areas, disaster rescue, and the military (Chen et al., 2006; Chang et al., 2011; Jewiss et al., 2020). Moreover, remote sensing is a new interdisciplinary subject that is integrated with surveying and mapping, space science, electronic science, geosciences, and computer science (Fuentes, 2006; Lary et al., 2016; Tapete, 2018). The development level of remote sensing represents the level of scientific research in a country/region (Soille and Pesaresi, 2002; Andrefouet and Riegl, 2004). Therefore, an increasing number of countries are investing increasing amounts of money and effort in remote sensing research.
Over the past decades, some countries/regions have been in leading positions in remote sensing-related research, and their research results have influenced the development trend of the industry (Kussul et al., 2017; Mikhaylov et al., 2021). Some countries/regions have come to the forefront and have become a new force in remote sensing-related research and are expanding their field. Other countries have turned from field leaders to followers for various reasons (Zhu et al., 2017; Goga et al., 2019). These phenomena reflect the change in scientific research power in remote sensing among countries and the changes in national scientific and technological strength (Nogueira et al., 2016; Zhang et al., 2016). An in-depth study of the phenomena is required not only for researchers to get a quick overview of the history and current situation of remote sensing research but also for related countries/regions to better predict the trend of remote sensing research development and then make remote sensing development plans that really meet their national conditions (Zou et al., 2015; Nogueira et al., 2016). However, the broadness of remote sensing research fields, the diversity of subfields, the differences in disciplinary backgrounds, and the limited personal energy of scholars make it quite difficult to systematically and comprehensively summarize the national/regional strength changes in remote sensing research without high-quality data sources and reliable quantitative analysis methods.
Fortunately, tens of thousands of remote sensing-related research works have been published by researchers in the past few decades. These research works are important carriers and the main transmitters for research achievement, providing information about the research history, current situation, and development trends of the realm and sub-realms (Guarino, 1995; Qiu and Shen, 2021). Previous studies show that the output and quality of research are important indicators to measure the level of national science and technology (Price, 1963; Bourdieu, 2004). Research work data are characterized by easy accessibility and massive volume. In addition, the existing academic databases have collated the research data so that researchers can easily access high-quality studies. On the other hand, quantitative analysis is a mathematical method in scientometrics to measure research results, describe the scientific system structure and analyze the inner operating mechanism of the scientific system. This method can be employed to reveal the spatial and temporal characteristics of scientific development and explore the quantitative regular characteristics of scientific activities in human society. And in the field of spatial data analysis, exploratory spatial data analysis methods have been introduced into fields such as library intelligence and scientometrics in recent years, demonstrating their applicability in the exploration of the spatial differences and evolution of research in related disciplines/fields. More importantly, according to recent studies, research on the spatial distribution of research output can not only help discover the spatial distribution of professional knowledge but also unearth the external causes of regional gaps in research output (Ma et al., 2019a).
In summary, based on the Web of Science (WoS) database, this study presents a study focusing on the output of research works in remote sensing at different levels, such as the distribution of, spatial differences in the aggregation of the global level, differential evolution, and polarization and spatial aggregation between different local areas. The results of this study can not only provide an important basis for related resource allocation and decisive references for scientific macro arrangement in relevant countries/regions, which is conducive to regional science development and thus reduce the regional gap in remote sensing fields. The rest of this study is organized as follows. Section 2 describes the data collection and preparation. Then, the research methodology and analysis of the experimental results are introduced. The conclusion is summarized in the final section.
2 Data collection
On the basis of a web development platform, the WoS is a large, comprehensive citation indexing database developed by Thomson Reuters. Through this database, users can retrieve information about literature in the natural sciences, social sciences, arts, and humanities (Mongeon and Paul-Hus, 2016). The WoS provides relatively complete bibliographic and citation information, including the title, author, abstract, keywords, date, author address, subject category, and reference list (Harzing and Alakangas, 2016). Importantly, bibliographic and citation data in the WoS can be downloaded to track the history and reveal the characteristics of a research field. Given the above, the WoS has been adopted as a data source for many scientometric studies.
The data used in this study were collected from the WoS to investigate the spatial distribution and evolution pattern of the research work output in remote sensing. The data acquisition process was as follows: First, the search function of the WoS database was utilized, and “remote sensing” was selected as the search term. Second, the publication time was set as 2012–2021 (download date: 2 November 2021), the literature type was set as “article,” and the language category was set as English. Finally, 13,057 pieces of data were obtained after removing duplicate data.
3 Method
In this study, the standard deviation and coefficient of variation were used to measure the absolute and relative differences between countries/regions and the Gini coefficient was used to explore intra- and intercontinental differences. Exploratory spatial data analysis (ESDA) was performed to reveal the spatial and temporal characteristics of knowledge spillover in remote sensing fields.
3.1 Coefficient of variation
The standard deviation is the arithmetic square root of the variance, which is an absolute indicator of the degree of dispersion of each observation (Lee et al., 2015). The calculation formula is as follows:
The coefficient of variation (CV) is the ratio of the standard deviation to the mean value, which is a relative index reflecting the dispersion of observed values (Shechtman, 2013). The mathematical expression is as follows:
where
3.2 Gini coefficient
The Gini coefficient is an index originally used in economics that is mainly used for income gap measurement. The value of the Gini coefficient is in the range of 0–1. The closer the value is to 1, the larger the income gap is, while the closer it is to 0, the smaller the gap is. The Gini coefficient has been widely used in fields such as medicine, geography, and computing (Chen et al., 1982). The Gini coefficient decomposition model was put forward by Dagum C in 1997; this model can describe the spatial differences of the remote sensing research output as a whole and quantify differences within and between regions compared with the ordinary Gini coefficient model (Dagum, 1997). The total Gini coefficient calculation formula is as follows:
where
According to the Gini coefficient decomposition model of Dagum C, the total Gini (G) can be decomposed as follows:
where
where
where
3.3 ESDA
ESDA is the application of exploratory data analysis (EDA) to spatial data analysis (SDA). It includes global spatial autocorrelation analysis and local spatial autocorrelation analysis. Different from global spatial autocorrelation describing the spatial aggregation degree of the research object in the whole research region (Griffith et al., 2003), local spatial autocorrelation describes the similarity between research objects, which can be used to measure the degree of local units obeying the whole (Flahaut et al., 2003; Jing et al., 2021). Generally, local spatial autocorrelation analysis can reveal the location of the research object that has local spatial autocorrelation when the global spatial autocorrelation is not significant. When the global spatial autocorrelation is significant, local spatial autocorrelation analysis can reveal the spatial heterogeneity of the study object.
3.3.1 Global spatial autocorrelation
In this study, the global
where
3.3.2 Local spatial autocorrelation
Taking
The formula for the significance level of the local
Under a certain significance level, the local spatial correlation can be classified into four types: High–High, Low–Low, High–Low, and Low–High by calculating the values with I and Z (I) (Table 1). Among them, both High–High and Low–Low indicate positive spatial correlation, implying large spatial similarity between neighboring countries/regions, i.e., spatial aggregation, while High–Low and Low–High indicate negative spatial correlation, implying large spatial differences between neighboring countries/regions, i.e., spatial dispersion.
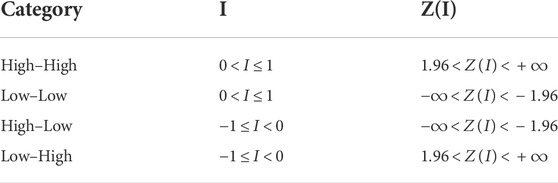
TABLE 1. Classification of local spatial correlation.
4 Results
4.1 Overview
In this study, the national research production statistics are based on the country/region where the institutions are located, in which authors complete related research. In addition, many articles are finished under the international collaboration. In order to be consistent with existing related studies, we counted the collaborative articles for each involved country once. For example, if an article is completed by researchers from the United States, China, and the United Kingdom, this article will be counted for all three countries (Lin et al., 2016; Leung et al., 2017).
A total of 153 countries/regions published remote sensing studies during 2012–2021, 19 of which contributed only one (Figure 1). Figure 1 shows that the top 30 cities with high research output were those with large populations. The 10 most productive countries/regions contributed 68.78% of the total studies, with the United States and China being the two most active countries/regions in remote sensing research (Figure 1). China and the United States had the largest numbers of research publications, 5,389 and 2,649 research, respectively. Developed countries such as the United Kingdom, Italy, France, Canada, and Spain also had high output. Large emerging countries, including India (947), Brazil (331), Iran (310), and Egypt (260), have large populations or are large energy consumers. Articles from these countries mostly focused on society, the environment, and energy. To some extent, this indicates that the economic level plays a vital role in scientific input in remote sensing (Li et al., 2016; Lukac et al., 2016; Mikhaylov et al., 2021). Furthermore, for countries/regions with large populations, especially emerging developing countries/regions, new methods based on remote sensing technologies have been sought to solve social problems (such as traffic congestion, environmental pollution, etc.) caused by population growth or develop new technologies for energy surveys (for mineral exploration, etc.) to reduce costs and improve the efficiency of energy exploration (Duane et al., 2021; Chen et al., 2022; Wu et al., 2022).
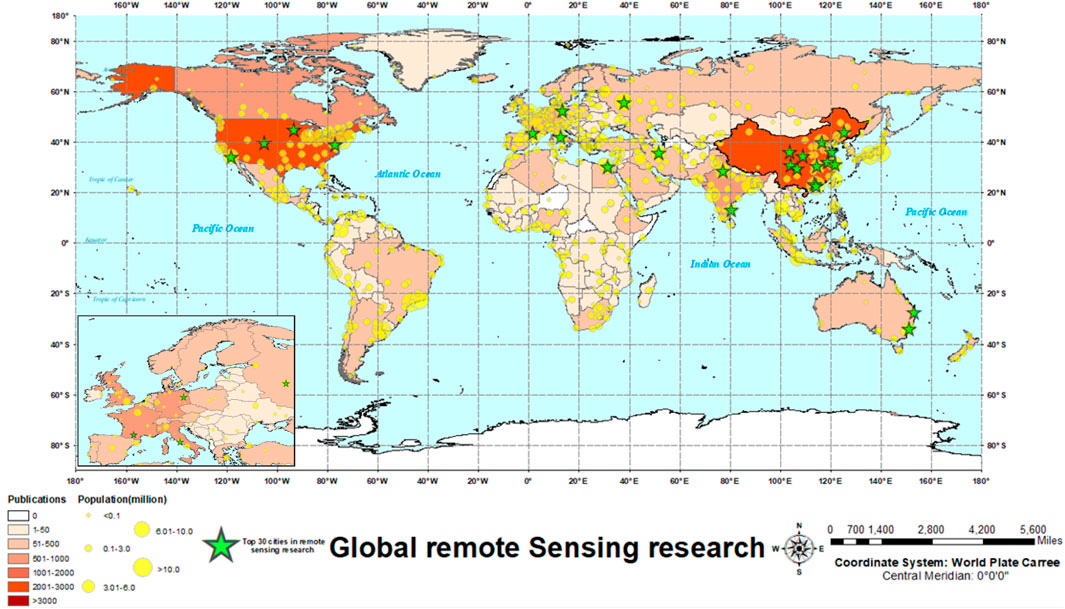
FIGURE 1. Geographic distribution of the global remote sensing research paper output.
4.2 Annual publication
Figure 2 describes the annual output of remote sensing research. In Figure 2, the total global citation score (TGCS) indicates the total citations of a remote sensing research by study in the whole database, representing the influence of that research on the academic community, while the total local citation score (TLCS) indicates the citations in the field of this study, which showcases its influence within the field. It can also be seen that 12,549 studies were produced in the field during 2012–2021. 2012 was the year with the lowest yield, with 709 published research, while 2021 had the highest yield, with the publication of 2,576 research. An average of 1,331.8 research was published per year, with an average of 2,105 citations per year (21,050 citations in total in research in the field). The total number of citations in the whole database reached 181,944, an average of 18,194.4 citations per year.
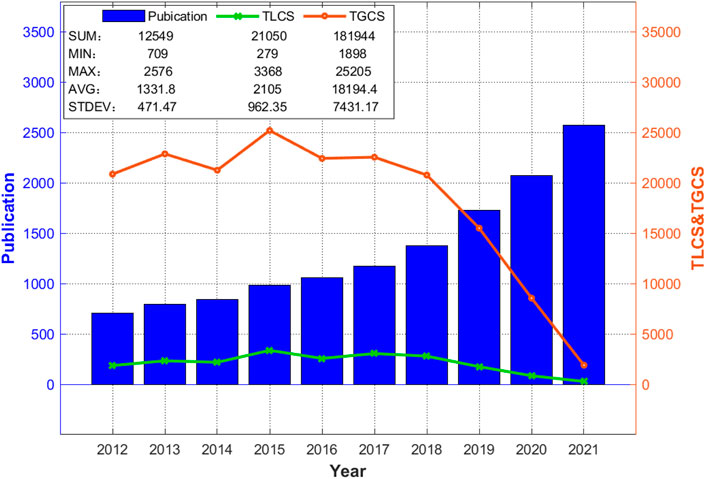
FIGURE 2. Temporal distribution of the output of remote sensing research from 2012 to 2021.
During 2012–2021, the first peaks of the TLCS and TGCS emerged in 2013. In 2013, the study The detection of “hot regions” in the geography of science—A visualization approach by using density maps and Automatic landslide detection from remote-sensing imagery using a scene classification method based on BoVW and pLSA had the highest TGCS and TLCS, respectively (Bornmann and Waltman, 2011; Cheng et al., 2013). After a temporary rebound in 2014, the TGCS and TLCS reached the peak of their research duration in 2015 simultaneously, demonstrating that the academic achievements of this year attracted high attention from both the respective fields and the whole academic community (Figure 2). Transferring deep convolutional neural networks for the scene classification of high-resolution remote sensing imagery was the research with the highest TGCS and TLCS during 2012–2021 (Hu et al., 2015). After 2016, the TLCS and TGCS continuously declined; however, remote sensing research output displayed an upward trend. This result does not suggest that the research conducted after 2016 is not important or that the academic community has lost interest in remote sensing. It is more like a reflection of the delayed citation window effect (O'Leary et al., 2015; Chi, 2016; Gonzalez and Gonzalez, 2016; Hu et al., 2019), which means that it takes time from publication to citation (Campanario, 2011; Chi, 2016). In general, the citation of research is directly related to its publication time. The earlier the article is published, the more times it will be cited (Leung et al., 2017; Hu et al., 2019). Conversely, the research output in remote sensing has been increasing since 2016, which indicates that research in remote sensing has attracted ongoing attention from both its own field and the global community (Figure 2) (Weng, 2009; Zhuang et al., 2013).
4.3 Spatial characteristics
The standard deviation of the research output in remote sensing has been on the rise from 2012 to 2021, and that in 2021 was 82.1665, which was 240.11% higher than that in 2012. In addition, its coefficient variation has been increasing significantly since 2012 (Figure 3), and it was 4.6503, 29.26% higher than that of 2012 (Table 2). This indicates a significant dispersion of research output in remote sensing during the time period, especially after 2017. One major reason is that the number of countries/regions involved in remote sensing increased yearly, and the annual research output of the original high-producing countries/regions increased quickly. In the initial stage, the publication of newly involved countries/regions is usually less than that of developed countries/regions, thus leading to an increase in the values of the standard deviation and coefficient of variation year by year. To a certain extent, this result reflects that remote sensing has attracted the attention of scholars in an increasing number of countries/regions (Zhuang et al., 2013; Schmitt et al., 2017; Morales-Barquero et al., 2019). However, it is worth noting that this phenomenon may lead to a decrease in the spatial aggregation of remote sensing studies (Zhuang et al., 2013; Ma et al., 2019b; Jin and Li, 2019; Xu and Yang, 2020).
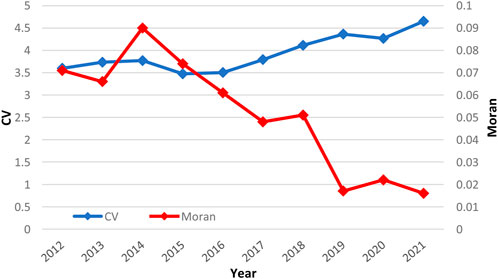
FIGURE 3. Line graph of the annual index change of remote sensing research output.
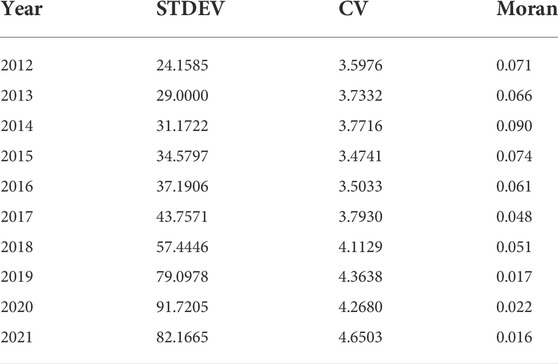
TABLE 2. Annual index of remote sensing research output.
During 2012–2021, the Moran index was above 0. There was a positive spatial correlation in the remote sensing research output, indicating spatial clustering in the sensing field, which is consistent with the conclusion of Figure 1. In addition, from 2012 to 2014, the Moran index increased and then decreased, which suggests the same trend of remote sensing research output agglomeration (Figure 3). After 2015, the Moran index continued to decline and fell to 0.016 in 2021, meaning that the research output was still spatially aggregated to a significantly lower degree than in the last 3 years. One important reason is that collaborative research before 2018 was mostly among countries/regions that are geographically close to each other or among institutions within countries/regions (Fuentes, 2006; Weng, 2012; Zhuang et al., 2013). After 2019, it became more international, involving more countries/regions and regions (Ma et al., 2019b; Morales-Barquero et al., 2019; Wu et al., 2022).
4.4 Spatial evolution
4.4.1 Regional differences
Based on the continental division of geography (Asia, Europe, Oceania, Africa, North America, and South America) and the Dagum C algorithm, this study calculated the Gini coefficients of six continents to analyze the intra and intercontinental differences in research output in remote sensing.
The Gini coefficient of the remote sensing research output decreased, and the smaller indicator shows the research convergence. In addition, the regional imbalance decreased (Table 3). As shown in Figure 4, the largest intracontinental disparity in remote sensing research output during 2012–2021 was observed in Asia (Gw was the largest), while Europe showed the smallest intracontinental disparity (Gw was the smallest), and North America was relatively stable, fluctuating at approximately 0.83. In Africa, the Gini coefficient of intracontinental differences decreased dramatically, indicating that the intracontinental differences in the research output on the continent have significantly declined.
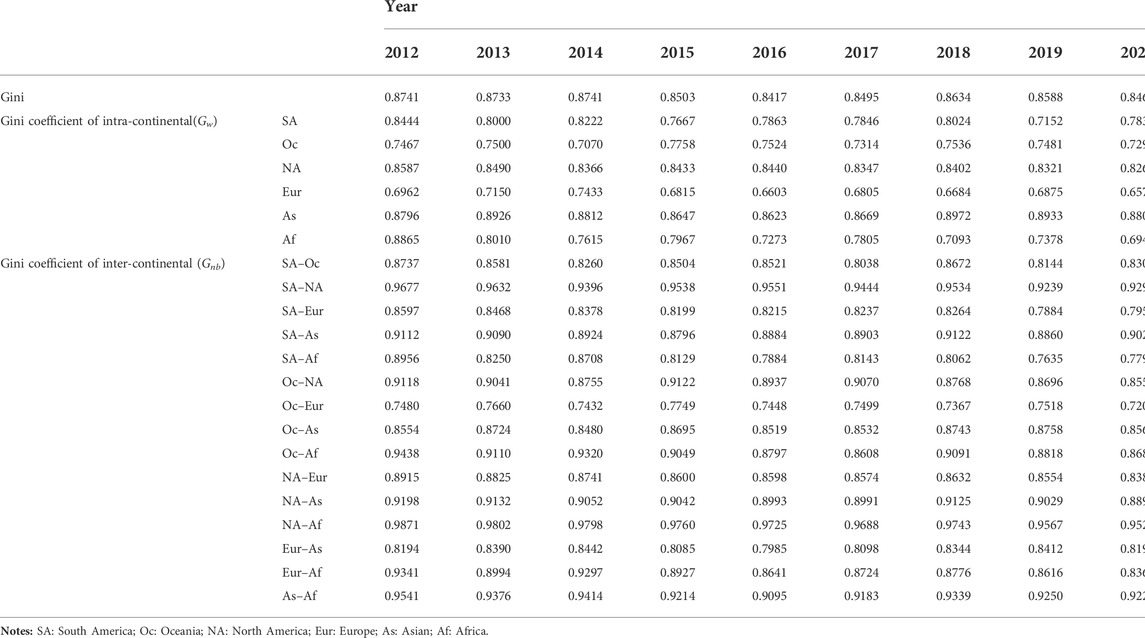
TABLE 3. Gini coefficient and decomposition results of the output of remote sensing research.

FIGURE 4. Evolution of the intracontinental variation in the output of remote sensing research. (Notes.: SA: South America; Oc: Oceania; NA: North America; Eur: Europe; As: Asian; Af: Africa).
Asia, the continent with the largest intracontinental disparity of research output in remote sensing fields, had the largest intercontinental Gini coefficient with Africa and the smallest with Europe (Figure 5A); Europe, the continent with the smallest intracontinental disparity, also had the largest with Africa and the smallest with Oceania (Figure 5B). In the Americas, South America had the largest intercontinental Gini coefficient with North America and the smallest with Africa (Figure 5C); North America had the largest with Africa and the smallest with Europe (Figure 5D). Overall, the intercontinental disparity is dropping. Taking 2012 as the base period, most of the six intercontinental Gini coefficients declined, with Europe-Africa decreasing the most (by 10.4%) and South America-Asia the least (by 1.11%). The regional differences in research output decreased.
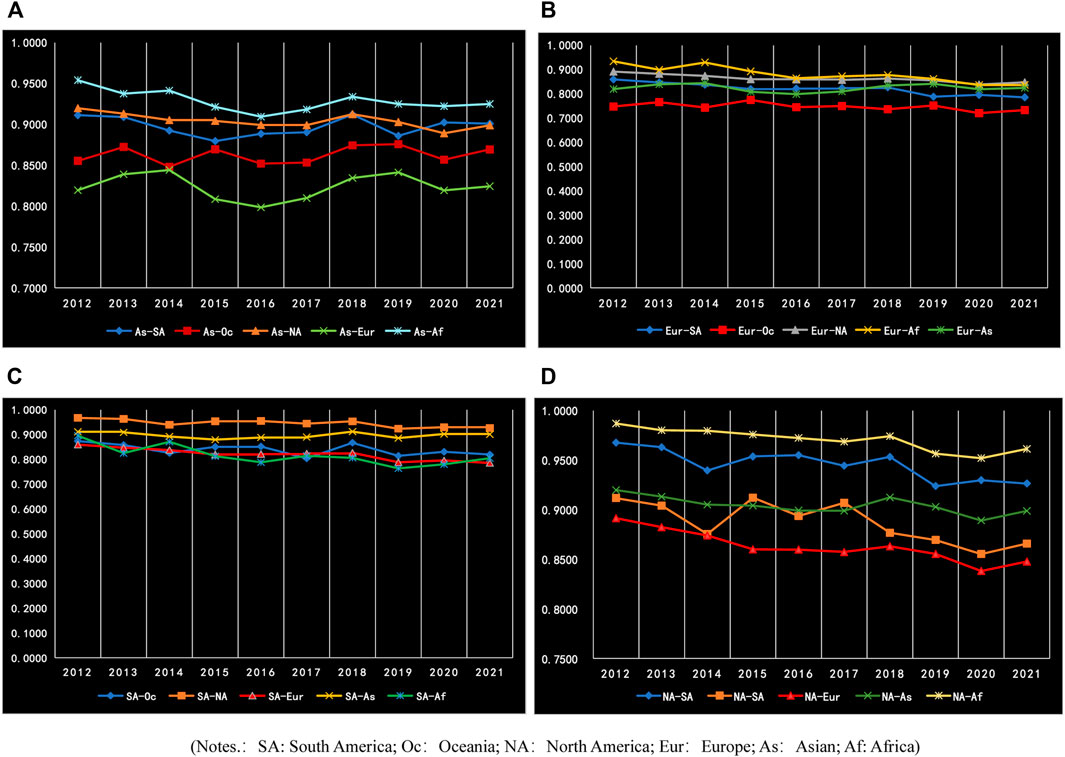
FIGURE 5. (A–D) respectively show the evolution of intercontinental differences in remote sensing research output between Asia, Europe, South America, and North America and other continents. (Notes.: SA: South America; Oc: Oceania; NA: North America; Eur: Europe; As: Asian; Af: Africa).
4.4.2 Spatial patterns
Figure 6 shows the 30 countries/regions with the most active research output in remote sensing during 2012–2021. As shown in Figure 6, the number of involved Asian countries/regions increased from 6 to 10 in 2012, while the number of involved European countries/regions decreased from 16 to 12. In 2012, the United States was the largest country/region in terms of research output, with China, India, Germany, and the United Kingdom ranking 2–5. China became the country/region with the largest scientific research work output during 2013–2021, and India moved up to the top three after 2018.
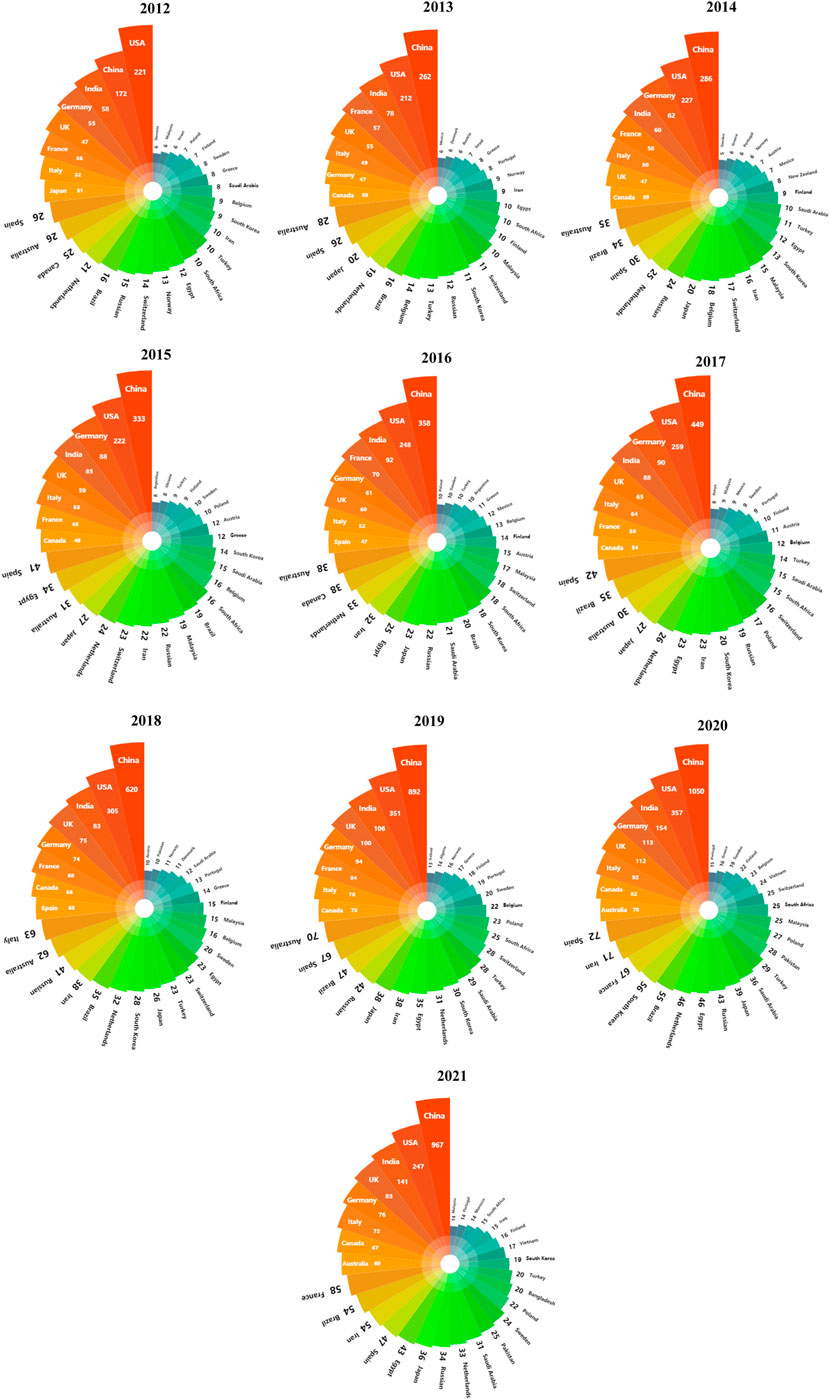
FIGURE 6. Top 30 countries with the most active output of remote sensing research.
The changes in quadrants in Figure 7 reflect the local spatial evolutionary characteristics of the output of research work related to remote sensing. Table 4 presents the countries/regions included in each quadrant in Figure 5. As seen from Table 4, a total of 6 countries/regions entered the high–high cluster from 2012 to 2021, with low–high, low–low, and high–low comprising 16, 12, and 2 countries, respectively. Moreover, two countries/regions (Canada and Russia) are in the High–High cluster, indicating that the outputs of research work related to remote sensing in these countries/regions and their neighboring countries/regions were at a relatively high level and stable. In addition, 9 countries/regions are in the low–high category. In general, the countries/regions located in each quadrant were relatively stable in the research period, and only a few countries/regions underwent quadrant location changes. For example, Pakistan moved from the second quadrant (low–high) to the first quadrant (high–high), which demonstrates the output of scientific research work in Pakistan and its neighboring countries/regions or regions improved.
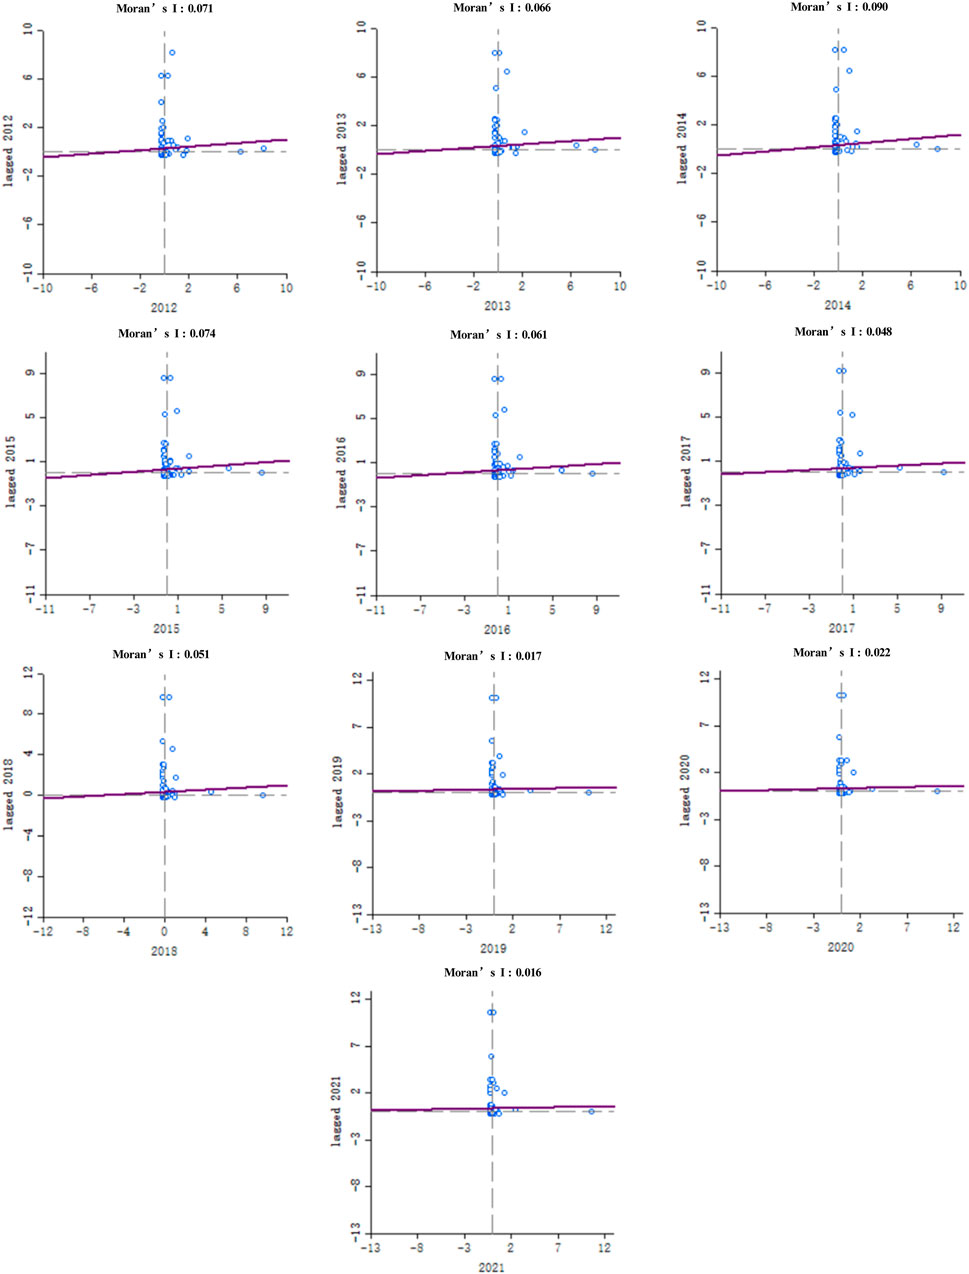
FIGURE 7. Scatterplot of the Moran index of the output of remote sensing research.
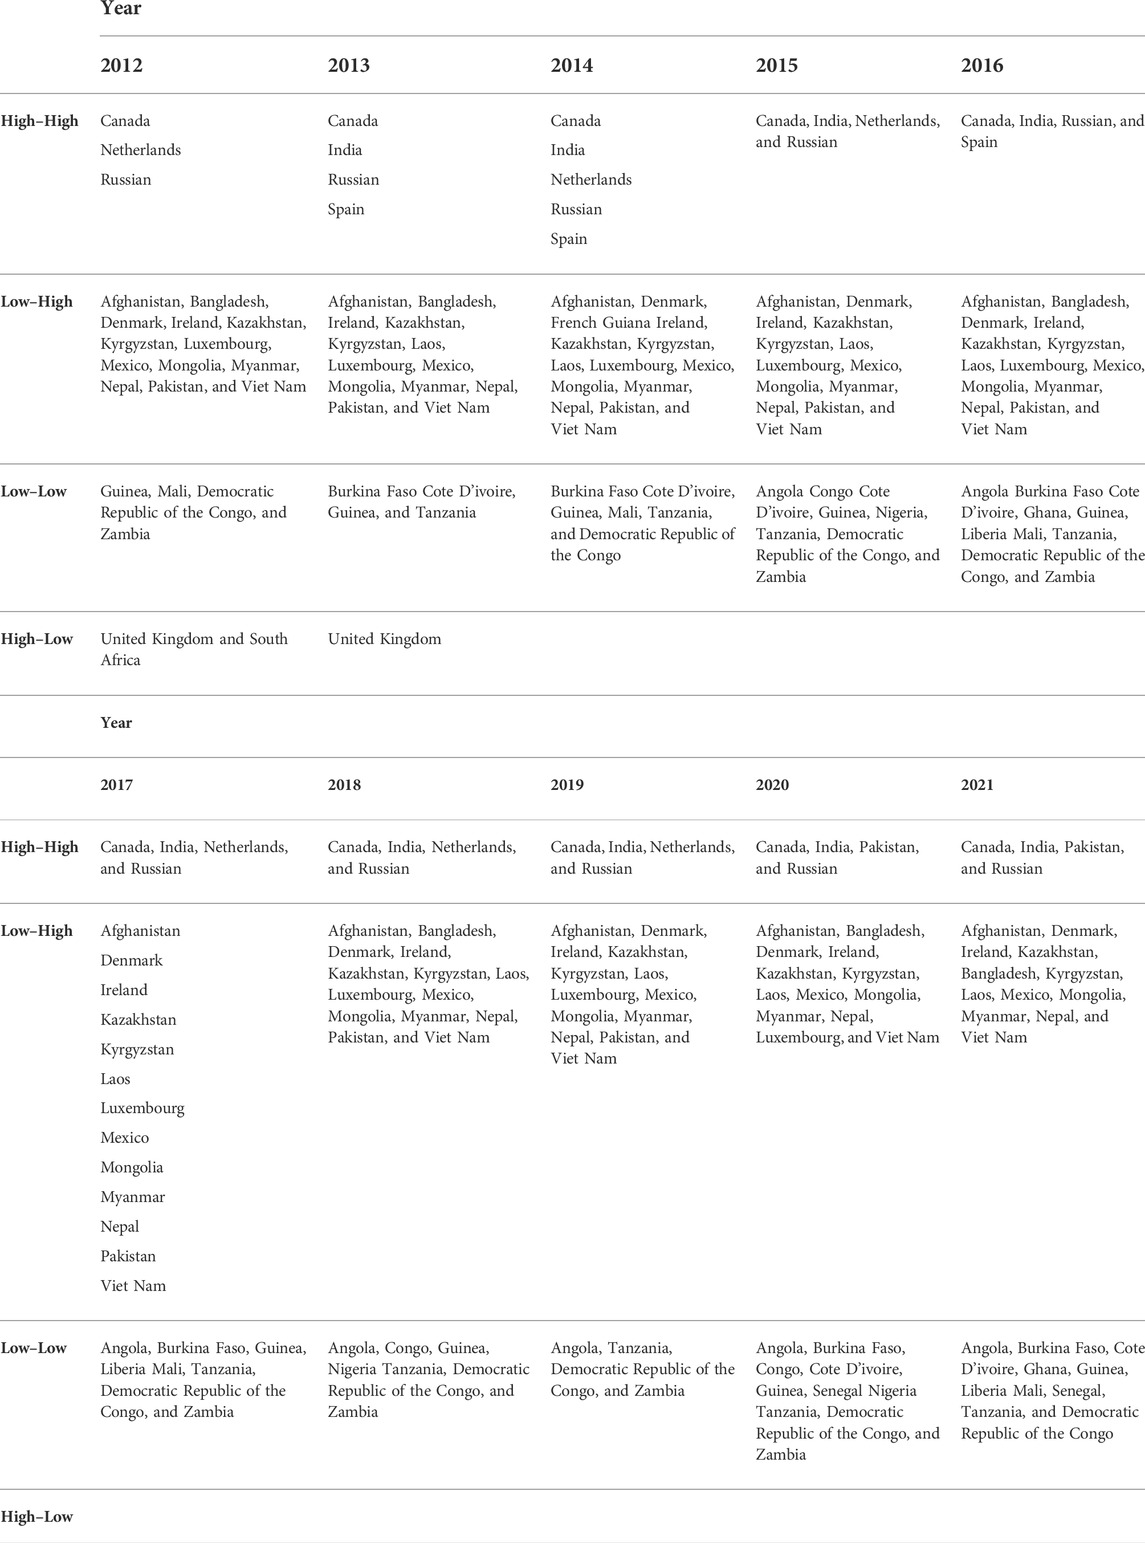
TABLE 4. Corresponding countries/regions of the Moran scatterplot for the output of remote sensing research.
5 Discussion
According to the previous analysis, the gap in the research work output regarding global remote sensing between the different continents decreased, and the spatial aggregation was obviously reduced. The top 10 countries/regions with the largest amount of published research were not the top 10 countries/regions with the largest gross domestic product (GDP). Similarly, the ranking of GDP was not consistent with the research output of the country/region. Meanwhile, almost all the top 30 cities with the largest research work output were among the top 30 in terms of urban populations; however, some cities with large populations like Tokyo and So Paulo fail to make top -30 listed countries with their research output. To some extent, although not decisively, regional economic development and the population have significant impacts on the output of research work in relevant fields of remote sensing (Li et al., 2016; Lukac et al., 2016; Ma et al., 2019a; Ma et al., 2019b).
During the past decade, the output of research work on remote sensing has increased sharply. With more countries/regions concerned about remote sensing and the wider geographic distribution of the nations, the most active countries/regions in the remote sensing research involved the main developed countries/regions as well as emerging developing countries/regions. Tables 5 and 6 show remote sensing research published from 2012 to 2021 with the top 10 TLCS and TGCS values. Most of the study with high TLCS and TGCS was published after 2016, representing the most cutting-edge studies on remote sensing. During this period, studies with a higher TGCS were published in 2013. Interestingly, the ranking of TLCS in Table 6 was not identical to that of TGCS. Generally, published research will be cited by work in this field first, and then cited by studies in other fields after a period of time. During this period, two situations may occur: first, the method or idea proposed in this study may be refuted or optimized by other research in this field but is being borrowed and used by other fields; therefore, this study gets a low TLCS ranking and a high TGCS ranking; second, the method or idea proposed in this study is only applicable to this field, so it is ranked high in TLCS but low in TGCS (Hu et al., 2019; Jin and Li, 2019).
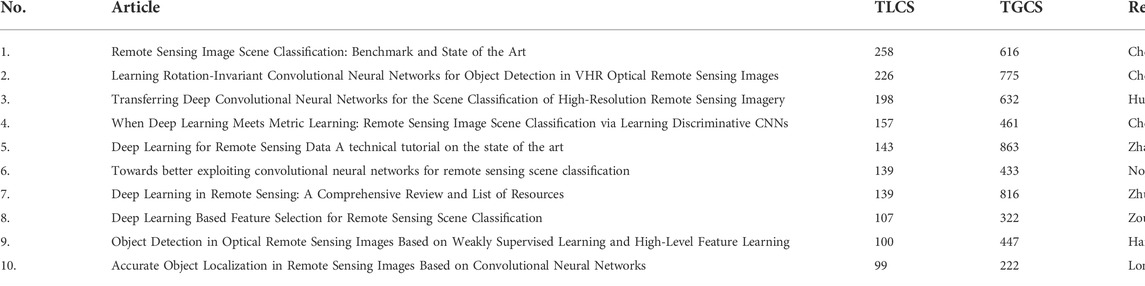
TABLE 5. Top10 articles of remote sensing with the highest TLCS.
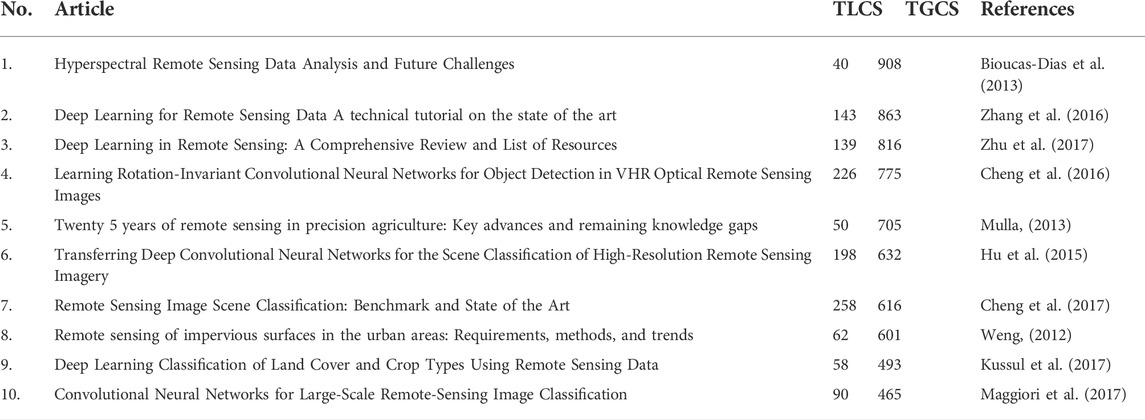
TABLE 6. Top 10 articles of remote sensing with the highest TGCS.
As shown in Tables 5 and 6, there were five study associated with deep learning and focused on target detection, scene understanding, and autonomous exploration. Meanwhile, the number of remote sensing research related to in-depth learning increased from 3 in 2015 (accounting for 0.3% of the total number of research) to 98 in 2021 (5.43%), showing a significant upward trend (Figure 8). In recent years, with the soaring development of computer vision, such as image classification, target identification, and semantic segmentation, deep learning has been widely applied to remote sensing and has become an important innovation driver for remote sensing research (Zhang et al., 2016; Leung et al., 2017; Kozlowski et al., 2020).
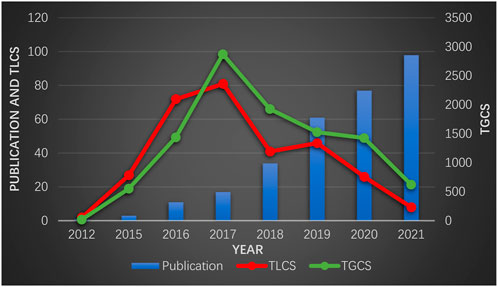
FIGURE 8. Annual yield of remote sensing research to deep learning.
The continental imbalance in the output of remote sensing research work decreased. The continental gap in output in Asia was the largest, while the gap in Europe was the smallest (Table 3; Figure 4). In Asia, there were nations with advanced academic institutions, talented scientific researchers, and large research work output as well as nations with unfavorable research conditions, few scientific researchers, and small study output (Klein et al., 2014; de Beurs et al., 2015; Vadrevu et al., 2019). Thus, the gap in research work output in Asia was larger than that in Europe (Goga et al., 2019; Chen et al., 2020; Mikhaylov et al., 2021). Moreover, the continental gap in Africa has obviously narrowed due to the increasing investment in scientific research in the current decade (Khechba et al., 2021; Mngadi et al., 2022; Sebola, 2022). Regarding the continental gap between Asia and other continents, the gap between Asia and Africa was the largest, and the gap between Asia and Europe was the smallest (Figure 5A), showing that the gap between the two continents with high research output was not large. The gaps between Europe and other continents were all smaller than those between Asia and other continents. In contrast, the gap between Europe and Africa was the largest (Figure 5B), suggesting a large imbalance between Africa and other continents with high research output, such as Asia and Europe.
With the development of communication technology, the cost of cross-regional cooperation decreased, thus promoting international cooperation (Figure 5). Recently, with the help of artificial intelligence, deep learning, and blockchain technologies, remote sensing has been widely and deeply applied to national defense, the economy, and people’s daily lives (Zhu et al., 2017; Kocaman and Ozdemir, 2020; Jung et al., 2021). With an increasing number of countries/regions paying attention to remote sensing, some with lower output will become high-output countries/regions, and some less developed countries/regions will no longer have low output, so the spatial aggregation of the professional research work on remote sensing will decrease.
Despite the above discoveries, due to the limitations of the data, there is an inevitable deficiency in the methodological universality of this exploratory research. Initially, because of data availability and the heterogeneity of the different databases, data from the WoS core database were used in this study. Although the data have high authority, its lack of comprehensiveness cannot be ignored. During the over 10-year research, the name of some institutions may have changed or even become defunct. Secondly, the same university, organization, and institution might be in different cities, so we decided to analyze the research output at the national level. Lastly, the weight impacts and author priority in the cooperation were not taken into account in the research output analyses. In future studies, we will improve the availability and scientific rigor of the results by considering the above limitations.
6 Conclusion
Based on 13,057 research articles included in the WoS from 2012–2021, this study probed the spatiotemporal distribution and evolutionary characteristics of research work output in remote sensing by utilizing scientometric and exploratory spatial analysis. The conclusions are as follows:
Over the last decade, the output of remote sensing research has increased significantly, and its spatial distribution presents a significant dispersion trend. Countries/regions actively participating in remote sensing research included both developed and emerging developing countries/regions, among which the United States and China were the most active. Although the regional economic level and population size play important roles in the remote sensing research work output, neither factor is a determinant. Nearly half of the top ten studies with the highest TGCS and TLCS values were related to deep learning, suggesting that deep learning technology will be one of the most important drivers of innovation in future remote sensing application models. The regional imbalance of the research work output in remote sensing generally dwindled. Although both Asia and Europe had the largest remote sensing research work output, the intracontinental disparity in Asia was the largest, and that in Europe was the smallest, which is related to uneven regional development. The continuous development of telecommunication and other technologies reduces the cost of cross-regional cooperation, and international cooperation in remote sensing has become more frequent. As a result, massive incorporation can bring new technologies and methods. Moreover, remote sensing technology has been widely applied to various fields, such as national defense and economics. More national attention has been given to remote sensing, resulting in mitigation of the clustering of research work output in remote sensing fields.
The results of this study can help countries/regions and institutions understand the overall situation of research output and the continental research gaps in remote sensing as well as improve understanding of the evolution trend of research output. By exploring the essential features of national/regional gaps, the results also serve as important sources of fundamental data and decision-making references for the spatial allocation optimization of scientific and technological resources and regional gap reduction. However, a few limitations and shortcomings should be noted, and future efforts are needed. 1) Although the adopted data source is sufficiently authoritative, it is relatively simplistic and not comprehensive. 2) Due to various reasons, the research work output in remote sensing fields was only analyzed at the national/regional scale, leading to a lack of universality of the conclusions. 3) The absence of weight calculation and priority analysis of institutional importance also affects the rigor of the results.
Data availability statement
Publicly available datasets were analyzed in this study. These data can be found at: Web of Science.
Author contributions
Conceptualization: YL, XK, and LX; software: FS and KW; visualization: YL and SW; writing—original draft preparation: YL and LX; and review and editing: SW, FS, and XK. All authors have read and agreed to the published version of the manuscript.
Funding
This work was supported by the Guangdong Planning Office of Philosophy and Social Science (GD21CTS01 and GD19CYJ04), National Natural Science Foundation of China (Grant No. 41901325), Guangdong Basic and Applied Basic Research Foundation (2022A1515010117 and 2021A1515011448), Open Fund of Key Laboratory of Urban Land Resources Monitoring and Simulation, Ministry of Land and Resources (KF-2021-06-123), and Natural Science Foundation of Hubei Province (2020CFB483).
Acknowledgments
The authors would like to thank the editors and the reviewers for their valuable comments and suggestions.
Conflict of interest
The authors declare that the research was conducted in the absence of any commercial or financial relationships that could be construed as a potential conflict of interest.
Publisher’s note
All claims expressed in this article are solely those of the authors and do not necessarily represent those of their affiliated organizations, or those of the publisher, the editors, and the reviewers. Any product that may be evaluated in this article, or claim that may be made by its manufacturer, is not guaranteed or endorsed by the publisher.
References
Andrefouet, S., and Riegl, B. (2004). Remote sensing: A key tool for interdisciplinary assessment of coral reef processes. Coral Reefs 23, 1–4. doi:10.1007/s00338-003-0360-z
Bioucas-Dias, J. M., Plaza, A., Camps-Valls, G., Scheunders, P., Nasrabadi, N., Chanussot, J., et al. (2013). Hyperspectral remote sensing data analysis and future challenges. IEEE Geosci. Remote Sens. Mag. 1, 6–36. doi:10.1109/mgrs.2013.2244672
Bornmann, L., and Waltman, L. (2011). The detection of "hot regions" in the geography of science—a visualization approach by using density maps. J. Inf. 5, 547–553. doi:10.1016/j.joi.2011.04.006
Campanario, J. M. (2011). Empirical study of journal impact factors obtained using the classical two-year citation window versus a five-year citation window. Scientometrics 87, 189–204. doi:10.1007/s11192-010-0334-1
Chang, A., Eo, Y., Kim, S., Kim, Y., and Kim, Y. (2011). Canopy-cover thematic-map generation for Military Map products using remote sensing data in inaccessible areas. Landsc. Ecol. Eng. 7, 263–274. doi:10.1007/s11355-010-0132-1
Chen, C.-N., Tsaur, T.-W., and Rhai, T.-S. (1982). The Gini coefficient and negative income. Oxf. Econ. Pap. 34, 473–478. doi:10.1093/oxfordjournals.oep.a041563
Chen, C. L., Qian, J., Chen, X., Hu, Z. Y., Sun, J. Y., Wei, S. J., et al. (2020). Geographic distribution of desert locusts in Africa, Asia and Europe using multiple sources of remote-sensing data. Remote Sens. 12, 3593. doi:10.3390/rs12213593
Chen, F. N., Zhang, Y., Zhang, J. C., Liu, L. M., and Wu, K. H. (2022). Rice false smut detection and prescription map generation in a complex planting environment, with mixed methods, based on near Earth remote sensing. Remote Sens. 14, 945. doi:10.3390/rs14040945
Chen, X. L., Zhao, H. M., Li, P. X., and Yin, Z. Y. (2006). Remote sensing image-based analysis of the relationship between urban heat island and land use/cover changes. Remote Sens. Environ. 104, 133–146. doi:10.1016/j.rse.2005.11.016
Cheng, G., Guo, L., Zhao, T. Y., Han, J. W., Li, H. H., Fang, J., et al. (2013). Automatic landslide detection from remote-sensing imagery using a scene classification method based on BoVW and pLSA. Int. J. Remote Sens. 34, 45–59. doi:10.1080/01431161.2012.705443
Cheng, G., Han, J., and Lu, X. (2017). Remote sensing image scene classification: Benchmark and state of the art. Proc. IEEE 105, 1865–1883. doi:10.1109/jproc.2017.2675998
Cheng, G., Yang, C., Yao, X., Guo, L., and Han, J. (2018). When deep learning meets metric learning: Remote sensing image scene classification via learning discriminative CNNs. IEEE Trans. Geosci. Remote Sens. 56, 2811–2821. doi:10.1109/tgrs.2017.2783902
Cheng, G., Zhou, P., and Han, J. (2016). Learning rotation-invariant convolutional neural networks for object detection in VHR optical remote sensing images. IEEE Trans. Geosci. Remote Sens. 54, 7405–7415. doi:10.1109/tgrs.2016.2601622
Chi, S. (2016). Differing disciplinary citation concentration patterns of book and journal literature? J. Inf. 10, 814–829. doi:10.1016/j.joi.2016.05.005
Dagum, C. A. (1997). A new approach to the decomposition of the Gini income inequality ratio. Empir. Econ. 22, 515–531. doi:10.1007/bf01205777
de Beurs, K. M., Henebry, G. M., Owsley, B. C., and Sokolik, I. (2015). Using multiple remote sensing perspectives to identify and attribute land surface dynamics in Central Asia 2001-2013. Remote Sens. Environ. 170, 48–61. doi:10.1016/j.rse.2015.08.018
Duane, D., Godo, O. R., and Makris, N. C. (2021). Quantification of wide-area Norwegian spring-spawning herring population density with Ocean acoustic waveguide remote sensing (OAWRS). Remote Sens. 13, 4546. doi:10.3390/rs13224546
Flahaut, B., Mouchart, M., San Martin, E., and Thomas, I. (2003). The local spatial autocorrelation and the kernel method for identifying black zones. Accid. Analysis Prev. 35, 991–1004. doi:10.1016/s0001-4575(02)00107-0
Fuentes, M. V. (2006). Remote sensing and climate data as a key for understanding fasciolosis transmission in the andes: Review and update of an ongoing interdisciplinary project. Geospat. Health 1, 59–70. doi:10.4081/gh.2006.281
Goga, T., Feranec, J., Bucha, T., Rusnak, M., Sackov, I., Barka, I., et al. (2019). A review of the application of remote sensing data for abandoned agricultural land identification with focus on central and eastern Europe. Remote Sens. 11, 2759. doi:10.3390/rs11232759
Gonzalez, M. I. D., and Gonzalez, P. D. (2016). Do fixed citation windows match impact maturation rates of scientific journals? Investig. Bibl. Arch. Bibl. Inf. 30, 73–89. doi:10.1016/j.ibbai.2016.02.004
Griffith, D. A., Wong, D. W. S., and Whitfield, T. (2003). Exploring relationships between the global and regional measures of spatial autocorrelation. J. Regional Sci. 43, 683–710. doi:10.1111/j.0022-4146.2003.00316.x
Guarino, N. (1995). Formal ontology, conceptual analysis and knowledge representation. Int. J. Human-Computer Stud. 43, 625–640. doi:10.1006/ijhc.1995.1066
Han, J., Zhang, D., Cheng, G., Guo, L., and Ren, J. (2014). Object detection in optical remote sensing images based on weakly supervised learning and high-level feature learning. IEEE Trans. Geosci. Remote Sens. 53, 3325–3337. doi:10.1109/tgrs.2014.2374218
Harzing, A. W., and Alakangas, S. (2016). Google scholar, scopus and the web of science: A longitudinal and cross-disciplinary comparison. Scientometrics 106, 787–804. doi:10.1007/s11192-015-1798-9
Hu, F., Xia, G. S., Hu, J. W., and Zhang, L. P. (2015). Transferring deep convolutional neural networks for the scene classification of high-resolution remote sensing imagery. Remote Sens. 7, 14680–14707. doi:10.3390/rs71114680
Hu, K., Liu, J., Li, B., Liu, L., Gharibzahedi, S., Su, Y., et al. (2019). Global research trends in food safety in agriculture and industry from 1991 to 2018: A data-driven analysis. Trends Food Sci. Technol. 85, 262–276. doi:10.1016/j.tifs.2019.01.011
Jewiss, J. L., Brown, M. E., and Escobar, V. M. Satellite remote sensing data for decision support in emerging agricultural economies: How satellite data can transform agricultural decision making perspectives. IEEE Geosci. Remote Sens. Mag. 2020, 8, 117–133. doi:10.1109/mgrs.2020.3023343
Jin, Y. R., and Li, X. (2019). Visualizing the Hotspots and emerging trends of Multimedia big data through scientometrics. Multimed. Tools Appl. 78, 1289–1313. doi:10.1007/s11042-018-6172-5
Jing, Y., Shu, J., Wang, R., and Zhang, X. (2021). Tempo-spatial variability of urban leisure functional zones: An analysis based on geo-big data. Growth Change, 52, 1852–1865. doi:10.1111/grow.12526
Jung, J. H., Maeda, M., Chang, A. J., Bhandari, M., Ashapure, A., Landivar-Bowles, J., et al. (2021). The potential of remote sensing and artificial intelligence as tools to improve the resilience of agriculture production systems. Curr. Opin. Biotechnol. 70, 15–22. doi:10.1016/j.copbio.2020.09.003
Khechba, K., Laamrani, A., Dhiba, D., Misbah, K., and Chehbouni, A. (2021). Monitoring and analyzing yield gap in Africa through soil attribute best management using remote sensing approaches: A review. Remote Sens. 13, 4602. doi:10.3390/rs13224602
Klein, I., Dietz, A. J., Gessner, U., Galayeva, A., Myrzakhmetov, A., Kuenzer, C., et al. (2014). Evaluation of seasonal water body extents in Central Asia over the past 27 years derived from medium-resolution remote sensing data. Int. J. Appl. Earth Obs. Geoinf. 26, 335–349. doi:10.1016/j.jag.2013.08.004
Kocaman, S., and Ozdemir, N. (2020). Improvement of disability rights via geographic information science. Sustainability 12, 5807. doi:10.3390/su12145807
Kozlowski, D., Dusdal, J., Pang, J., and Zilian, A. (2020). Semantic and relational spaces in science of science: Deep learning models for article vectorisation. Scientometrics 126, 5881–5910.
Kussul, N., Lavreniuk, M., Skakun, S., and Shelestov, A. (2017). Deep learning classification of land cover and crop types using remote sensing data. IEEE Geosci. Remote Sens. Lett. 14, 778–782. doi:10.1109/lgrs.2017.2681128
Lary, D. J., Alavi, A. H., Gandomi, A. H., and Walker, A. L. (2016). Machine learning in geosciences and remote sensing. Geosci. Front. 7, 3–10. doi:10.1016/j.gsf.2015.07.003
Lee, D. K., In, J., and Lee, S. (2015). Standard deviation and standard error of the mean. Korean J. Anesthesiol. 68, 220. doi:10.4097/kjae.2015.68.3.220
Leung, X. Y., Sun, J., and Bai, B. (2017). Bibliometrics of social media research: A co-citation and co-word analysis. Int. J. Hosp. Manag. 66, 35–45. doi:10.1016/j.ijhm.2017.06.012
Li, X. X., Li, W. W., Middel, A., Harlan, S. L., Brazel, A. J., Turner, B. L., et al. (2016). Remote sensing of the surface urban heat island and land architecture in Phoenix, Arizona: Combined effects of land composition and configuration and cadastral-demographic-economic factors. Remote Sens. Environ. 174, 233–243. doi:10.1016/j.rse.2015.12.022
Lin, L., Yu, L., Zhu, H., Shen, Y., Hang, S., Luo, H., et al. (2016). A bibliometric and visual analysis of global geo-ontology research. Comput. Geosciences 99, 1–8. doi:10.1016/j.cageo.2016.10.006
Long, Y., Gong, Y., Xiao, Z., and Liu, Q. (2017). Accurate object localization in remote sensing images based on convolutional neural networks. IEEE Trans. Geosci. Remote Sens. 55, 2486–2498. doi:10.1109/tgrs.2016.2645610
Lukac, N., Seme, S., Dezan, K., Zalik, B., and Stumberger, G. (2016). Economic and environmental assessment of rooftops regarding suitability for photovoltaic systems installation based on remote sensing data. Energy 107, 854–865. doi:10.1016/j.energy.2016.04.089
Ma, C., Li, G., Mao, J., and Gu, Y. (2019). Research on the spatial distribution of scientific research output: Taking the computer software and application field as an example. Libr. Inf. Serv. 63, 9.
Ma, Q., Li, Y., Chen, J., Li, X., Liu, B. Y., Li, J. Z., et al. (2019). “Undergraduate education of remote sensing science and technology in China: A case of study in jiangsu normal university[C],” in IGARSS 2019—2019 IEEE International Geoscience and Remote Sensing Symposium, Piscataway, NJ: IEEE, 2019.
Maggiori, E., Tarabalka, Y., Charpiat, G., and Alliez, P. (2017). Convolutional neural networks for large-scale remote-sensing image classification. IEEE Trans. Geosci. Remote Sens. 55, 645–657. doi:10.1109/tgrs.2016.2612821
Mikhaylov, A., Mikhaylova, A., Alsynbaev, K., Bryksin, V., and Hvaley, D. (2021). Remote-sensing technology in mapping socio-economic divergence of Europe. Bull. Geogr. Ser. 52, 69–84. doi:10.2478/bog-2021-0014
Mngadi, M., Odindi, J., Mutanga, O., and Sibanda, M. (2022). Quantitative remote sensing of forest ecosystem services in sub-saharan africa's urban landscapes: A review. Environ. Monit. Assess., 194, 242. doi:10.1007/s10661-022-09904-x
Mongeon, P., and Paul-Hus, A. (2016). The journal coverage of web of science and scopus: A comparative analysis. Scientometrics 106, 213–228. doi:10.1007/s11192-015-1765-5
Morales-Barquero, L., Lyons, M. B., Phinn, S. R., and Roelfsema, C. M. (2019). Trends in remote sensing accuracy assessment approaches in the context of natural resources. Remote Sens. 11, 2305. doi:10.3390/rs11192305
Mulla, D. J. (2013). Twenty five years of remote sensing in precision agriculture: Key advances and remaining knowledge gaps. Biosyst. Eng. 114, 358–371. doi:10.1016/j.biosystemseng.2012.08.009
Nogueira, K., Penatti, O., and Santos, J. (2016). Towards better exploiting convolutional neural networks for remote sensing scene classification. Pattern Recognit. 61, 539–556. doi:10.1016/j.patcog.2016.07.001
O'Leary, J. D., Crawford, M. W., Jurczyk, E., and Buchan, A. (2015). Benchmarking bibliometrics in biomedical research: Research performance of the university of toronto’s faculty of medicine, 2008–2012. Scientometrics 105, 311–321. doi:10.1007/s11192-015-1676-5
Price, D. J. d. S. (1963). “Little science, big science,” in Little science, Big science (Columbia University Press). New York, New York, United States
Qiu, J., and Shen, C. (2021). Analysis of hot topics in domestic big data research based on LDA model. J. Mod. Inf. 41 (9), 22–31. doi:10.3969/j.issn.1008-0821.2021.09.003
Schmitt, M., Tupin, F., and Zhu, X. X. (2017). “Ieee. Fusion of sar and optical remote sensing data - challenges and recent trends,” in Proceedings of the IEEE International Geoscience & Remote Sensing Symposium, Fort Worth, TX, Jul 23-28, 2017, 5458–5461.
Sebola, M. P. South (2022). South Africa’s public higher education institutions, University research outputs, and contribution to national human capital. Hum. Resour. Dev. Int., 1–15. doi:10.1080/13678868.2022.2047147
Shechtman, O. (2013). “The coefficient of variation as an index of measurement reliability,” in Methods of clinical epidemiology (Springer), Berlin/Heidelberg, Germany, 39–49.
Soille, P., and Pesaresi, M. (2002). Advances in mathematical morphology applied to geoscience and remote sensing. IEEE Trans. Geosci. Remote Sens. 40, 2042–2055. doi:10.1109/tgrs.2002.804618
Tapete, D. (2018). Remote sensing and geosciences for archaeology. Geosciences 8, 41. doi:10.3390/geosciences8020041
Vadrevu, K. P., Dadhwal, V. K., Gutman, G., and Justice, C. (2019). Remote sensing of agriculture – South/Southeast Asia research initiative special issue. Int. J. Remote Sens. 40, 8071–8075. doi:10.1080/01431161.2019.1617507
Weng, Q. H. (2009). Thermal infrared remote sensing for urban climate and environmental studies: Methods, applications, and trends. Isprs J. Photogrammetry Remote Sens. 64, 335–344. doi:10.1016/j.isprsjprs.2009.03.007
Weng, Q. (2012). Remote sensing of impervious surfaces in the urban areas: Requirements, methods, and trends. Remote Sens. Environ. 117, 34–49. doi:10.1016/j.rse.2011.02.030
Wu, S. P., Gao, X., Lei, J. Q., Zhou, N., Guo, Z. K., Shang, B. J., et al. (2022). Ecological environment quality evaluation of the Sahel region in Africa based on remote sensing ecological index. J. Arid. Land 14, 14–33. doi:10.1007/s40333-022-0057-1
Xu, L., and Yang, J. (2020). Research on spatial-temporal distribution and evolution law of domestic journal paper output. J. Mod. Inf. 40, 9. doi:10.3969/j.issn.1008‒0821.2020.04.015
Zhang, L., Zhang, L., and Du, B. (2016). Deep learning for remote sensing data: A technical tutorial on the state of the art. IEEE Geoscience Remote Sens. Mag. 4, 22–40. doi:10.1109/MGRS.2016.2540798
Zhu, X. X., Tuia, D., Mou, L., Xia, G. S., Zhang, L., Xu, F., et al. (2017). Deep learning in remote sensing: A comprehensive review and list of resources. IEEE Geosci. Remote Sens. Mag. 5, 8–36. doi:10.1109/mgrs.2017.2762307
Zhuang, Y. H., Liu, X. J., Nguyen, T., He, Q. Q., and Hong, S. (2013). Global remote sensing research trends during 1991-2010: A bibliometric analysis. Scientometrics 96, 203–219. doi:10.1007/s11192-012-0918-z
Keywords: remote sensing, spatiotemporal distribution, research paper, regional disparity, paper output
Citation: Liu Y, Kuai X, Su F, Wang S, Wang K and Xing L (2022) Research on the spatiotemporal distribution and evolution of remote sensing: A data-driven analysis. Front. Environ. Sci. 10:932753. doi: 10.3389/fenvs.2022.932753
Received: 30 April 2022; Accepted: 27 June 2022;
Published: 08 August 2022.
Edited by:
Ying Jing, Zhejiang University, ChinaReviewed by:
Liangzhi Li, Chang’an University, ChinaMengling Qiao, The Chinese University of Hong Kong, China
Jiawei Zhu, Central South University, China
Copyright © 2022 Liu, Kuai, Su, Wang, Wang and Xing. This is an open-access article distributed under the terms of the Creative Commons Attribution License (CC BY). The use, distribution or reproduction in other forums is permitted, provided the original author(s) and the copyright owner(s) are credited and that the original publication in this journal is cited, in accordance with accepted academic practice. No use, distribution or reproduction is permitted which does not comply with these terms.
*Correspondence: Lijun Xing, bGp4aW5nMjAxOUBodWJ1LmVkdS5jbg==