 Maryam Ishaq1
 Ghulam Ghouse1Raquel Fernández-González2
 Félix Puime-Guillén3*
 Natasa Tandir4Helena Maria Santos de Oliveira5
- 1Department of Economics, The University of Lahore, Lahore, Pakistan
- 2ECOBAS, ERENEA, Department of Applied Economics, University of Vigo, Vigo, Spain
- 3Department of Business, University of A Coruña, A Coruña, Spain
- 4Management Department, International Burch University, Sarajevo, Bosnia and Herzegovina
- 5Polytechnic Institute of Porto (IPP), School of Accounting and Administration of Porto (ISCAP), Porto, Portugal
For decades, renewable energy consumption has been presented as the ultimate solution to reduce pollutant gas emissions. However, their production, marketing, and, above all, consumption are not entirely climate neutral, so society needs new practices, such as circular energy, to achieve a more efficient energy transition (Khan et al., 2021a; Khan et al., 2021d). This study aims at exploring the effects of energy intensity, renewable energy consumption and forestation on
Introduction
It is an acknowledged fact that world atmospheric conditions are changing abruptly, posing a serious challenge to the world and its population (Hansen et al., 2006; MacCracken, 2008; Rahman, 2009). The primary reason for environmental degradation and global warming is greenhouse gases (GHGs), including methane (CH4), nitrous oxide (N2O), and carbon dioxide (
As proven scientifically, GHG emissions largely originate from the use of fossil fuels as a source of energy (IPCC, 2007). About 81% of all primary energy sources worldwide are derived from fossil fuels; this has not changed over the past 25 years (IEA, 2017). Under the world energy situation, it is expected that almost 85–90% of the world’s primary energy consumption will continue to be based on fossil fuels until 2030 (EIA, 2010). World energy-related
According to the State of the World’s Forests (FAO, 2016), forests are considered the largest terrestrial carbon sink, absorbing approximately two billion tons of carbon dioxide every year (FAO, 2016). The IPCC’s Fifth Assessment Report states that for forestry, the most cost-effective mitigation options are planting of trees, sustainable forest management, and reduction of deforestation, which differ widely in their relative importance. (IPCC, 2014). Almost 31% of the world’s zone comprises forests, and over 1.5 billion people get their living from these forests. Besides, forests enhance environmental quality and reduce the greenhouse effect by avoiding
Keeping in view the growing concerns about carbon-related emissions, the article primarily aims to validate/invalidate the importance of renewable energy consumption (as an alternative to nonrenewable ones) and forestation in the context of mitigating the harmful effects of carbon emissions released into the environment. The key contribution of this study is to empirically determine the explanatory power of proposed determinants against carbon emissions using world-level data. To our knowledge, only a handful of studies so far have statistically tested the effectiveness of subject variables using global data sets (Zoundi, 2017). While investigating the subject relationship, our approach of disaggregating sample countries into distinct income groups is likely to bring forth some very interesting revelations also. Following the World Bank’s country classification scheme, the overall sample of countries (79 countries) is categorized into four distinct income groups, i.e., low-income, lower-middle-income, upper-middle-income, and high-income countries from 1980 to 2018. Disparate income levels may significantly impact the plausible linkage of carbon emission with forestation and/or renewable energy consumption. The idea stems from the famous postulation of growth-income inequality, proposed by Kuznets, 1991, and its popular variant, the environmental Kuznets curve (EKC), has been widely adopted in the environmental economics literature since the 1990s. For holding a thorough investigation around the hypothesized relationship, a rigorous empirical approach is followed, involving multiple testing methods. The estimation and testing of a long-run (co-integrating) relationship between carbon-based emissions and their determinants is performed in a single equation framework (i.e., Pedroni residual-based cointegration framework) as well as in a multivariate (VAR-based) framework (i.e., Johansen-Fisher combined maximum likelihood-based cointegration procedure). The two types of cointegration models have their own strengths. Employing two distinctively different testing methods will help us to assess if our results obtained from one approach survive the other, besides serving the purpose of establishing the robustness and consistency of our estimates yielded against alternative econometric procedures.
Our results speak in advocacy of hypothesized relationship between
The organization of the paper is as follows: Section 2 of the paper critically reviews the prior literature produced on the subject. Special attention is given to research focused on the inter-linkage between growth performance of economies and environmental quality, optimizing energy intensity levels for controlling the growing levels of carbon emission, and the role of forestation and renewable energy sources in defining the existing levels of carbon-related environmental contamination. Section 3 lays down the methodological and econometric framework for empirically analyzing the hypothesized relationship between carbon-related emissions and their long-run determinants, besides discussing in detail the associated results and their economic implications. Section 4 of the paper brings forth the concluding remarks and the consequent policy recommendations, which can potentially be considered as action tools to combat the gravity of the situation.
Literature Review
The continuous deterioration in the state of the climate has raised serious concerns about mitigating its harmful effects (Khan et al., 2021c). It has now become imperative to discuss the causes and the possible solutions for curtailing the current levels of environmental contamination, which otherwise may cause irreparable damage to the world’s environment, resources, and population. A sufficiently large amount of research has been produced so far, discussing the state of environmental quality against numerous economic and political determinants; nevertheless, the work done by Grossman and Krueger (1991) is always recognized as a pioneer study in this subject. They theorized a relationship between economic growth (measured through productivity) and the state of environmental quality for NAFTA. Their findings match the growth-income inequality theorem of Simon Kuznets (1991) suggested that productivity expansion is proven to be good for the environment, but only up to certain levels of growth. Once this threshold level of output growth is achieved, further growth of productivity entails the deterioration of environmental quality. The study received much attention and therefore, thereafter, the growth-environment linkage is popularly known as the EKC.
However, EKC gained much more attention afterward, starting from Shafik and Bandyopadhyay’s (1992) study done for World Bank, analyzing the linkage between environmental transformation (measured through eight different indicators) induced by economic growth for countries subject to varying income levels. Their results showed interesting revelations since income turned out to be consistently significant for all employed measures of environmental quality. Shukla and Parikh (1992), while studying the consequences of urbanization, find a statistically significant association between city size and air quality; however, the relationship is found to be less pronounced for developing economies. Grossman and Krueger (1991) also confirm the significance of growth (enhanced production volumes motivated by less restrictive trade patterns) against air pollution concentration levels, more prominently existing for countries with low GDP. Tucker (1995) observed a positive co-movement between per capita GDP growth and carbon emissions, followed by subsequent reduction since higher income levels may raise increased demand for a clean environment. Ansuategi et al. (1998) emphasize that post-World War II economic growth patterns have not been sustainable and are intensively featured by the exhaustibility of rare natural resources. In contrast to a large number of studies that tend to test the EKC hypothesis for a pool or cross-section of the set of countries, Friedl and Getzner (2003) sought empirical evidence against EKC for the small open high-income industrialized economy of Austria. Their results yield a cubic (N-shaped) relationship between GDP and
The varying intensity of
Earlier research done on studying the growth-environment nexus recognizes the significance of a variety of growth-related indicators responsible for affecting global environmental quality. However, a few of these determinants received special attention, owing to their proven role in explaining the status of the environment and its resources. Growth in real income, forestation volumes, energy consumption (both nonrenewable and the renewable), energy intensity, agriculture, industry, and service sector growth, degree of urbanization and open of economies toward external world are those important growth-related determinants that have remained under focused for a large majority of studies done in last 10 years.
Starting from real income growth, an extensive number of studies have found the proven explanatory power of this key determinant in determining the trend patterns of environmental quality. However, keeping in view the theoretical predications of EKC, the low- and lower-middle-income countries demonstrate the mixed role of economic growth in the pursuit of
Upper-middle- and high-income countries have made significant advancements in mitigating the effects of
The significance of forestation in the discussions of a clean environment is indispensable. This owes to their natural capability of storing, capturing, and releasing carbon dioxide. The biological growth process of the forest captures carbon from the atmosphere. Also, due to their long life and considerable mass, the forest can hold large volumes of carbon in its cells. According to Malhi et al. (2002), forest stores approximately 47% of the global carbon. In residential and urban centers, the forest also provides shade for buildings, which helps reduce the energy required for heating and cooling. This means that increasing the forest cover in the region will generate positive environmental outcomes. The empirical connection between forestation volumes and
In the discussion of climate change, the use of renewable energy sources is well-recognized to maintain environmental quality and culminate the levels of GHGs. Owing to the energy efficiency level they offer and their ability to protect the environment from carbon-related degradation for the last two decades, renewable energy sources have received much attention in the role of policy solutions to combat pollution. A considerable amount of research studies has analyzed the long-run explanatory power of subject variables toward controlling
On the whole, an ample amount of contradictory evidence in support of our hypothesized relationship between forestation, renewable energy consumption, and
Empirical Methodology
This section of the paper serves the purpose of validating/invalidating our proposed hypothesis empirically. The long-run causal relationship between energy intensity, renewable energy consumption, forestation, and
In its simplest form, the hypothesis under investigation posits the following empirical relationship to estimate the long-run (equilibrium) relationship for
The estimable (econometric) specification of Eqs (3.5-a), therefore, is given as:
where t = time series subscript and t ranges from 1990 to 2018.
X = vector of model regressors and includes forestation, rec, ei, and GDP.
Eqs (3.5-b) is the starting point for investigating ei, rec, forestation, and GDP as potential long-run determinants of
Determining the Order of Integration of Model Panels Using Common Root-Levin, Lin, Chu Panel Unit Root Test
Levin and Lin (1992), Levin and Lin (1993), Levin et al. (2002) (LLC thereafter) provide some new results on panel unit root tests. They generalize Quah’s model to allow for heterogeneity of individual deterministic effects (constant and/or linear time trend) and heterogeneous serial correlation structure of the error terms assuming homogeneous first-order autoregressive parameters. They assume that both N and T tend to infinity, but T increases at a faster rate, such that N/T→0.
They developed a procedure using pooled t-statistic of the estimator to evaluate the hypothesis that each individual time series contains a unit root against the alternative hypothesis that each time series is stationary. Thus, referring to the model (3.5-c), LLC assumes homogeneous autoregressive coefficients between individual, i.e., ρ_i = ρ for all i, and test the null hypothesis
Imposing a cross-equation restriction on the first-order partial autocorrelation coefficients under the null, this procedure leads to a test of much higher power than performing a separate unit root test for each individual. The structure of the LLC analysis may be specified as follows:
where a time trend (
The results of the panel unit root test (at levels) for all four country groups (low-income, lower-middle-income, upper-middle-income, and high-income) at levels are reported in the upper panel of Table 1. It is clear that none of the model series hold any definite time trend (decreasing or increasing), and, as such, unit root regression equations should include only an intercept as the model deterministic regressors.
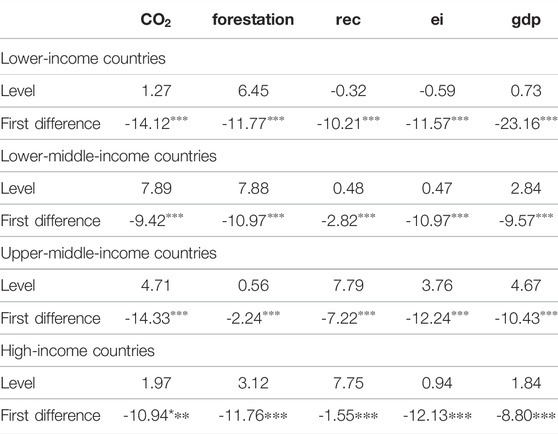
TABLE 1. Results of levin, lin, chu panel unit root test.
From the results above in Table 1, it can obviously be seen that all the model panels display unit roots in levels. The results at first difference show that all the variables in all groups are stationary. The variables turn out to be integrated of order one with very high statistical significance, i.e., at a better than one percent significance level. This implies that the subject variables are appropriate to be modeled for cointegration testing.
Panel Cointegration Testing
After having determined the order of integration of our model panels [which turned out to be I (1)], we now are capable of testifying a long-run co-integrating relationship (if there exists any). Here, our scheme of econometric testing involves residual-based single equation cointegration modeling (i.e., Pedroni cointegration estimator) and a maximum-likelihood-based multivariate cointegration approach (i.e., Johansen-Fisher combined cointegration test). The significance of using two distinct approaches toward cointegration modeling rests with their varying capability of recognizing the existence/inexistence of valid cointegration vector(s). The dynamics of the Pedroni panel cointegration test rely on residual-based deviations from long-run equilibrium between model variables. On the other hand, the Johansen-Fisher panel cointegration estimator follows maximum likelihood mechanisms to reach the actual number of co-integrating vectors arising within a system of equations. The later test allows for identifying situations where more than one variable adjusts to restore long-run equilibrium. In other words, it does not impose the condition of weak exogeneity. This characteristic of the maximum likelihood methodology stands in contrast to the single equation cointegration approach, which assumes that the set of model regressors does not change in a reaction to divergence from long-run equilibrium with the regressand.
Let’s discuss each of the two cointegration approaches individually.
i) Pedroni Residual-Based Cointegration Test
Developed by Pedroni (1999), the heterogeneous panel cointegration test allows cross-sectional interdependence with individual effects. Provided the data series are unit root in levels, that is, I (1), the Pedroni residual-based cointegration test is a widely used instrument to examine if a long-run co-integrating association occurs among model variables. The following time series panel formulation is proposed by Pedroni:
where
Under the Pedroni cointegration model, there are actually two sets of residual-based tests. The first set of tests involves pooling the residuals obtained from within-group regressions. The statistics of the tests are standard, normal, and asymptotically distributed. This first set of tests includes panel v-statistics, panel ρ-statistics, panel PP-statistics (or t-statistics, non-parametric) and panel ADF-statistics (or t-statistics, parametric). The other group of tests is also standard, normal, and asymptotically distributed, but dissimilar to the first set of tests, these tests consist of pooling the residuals between the groups. This set consists of group ρ-statistics, group PP-statistics (or t-statistics, non-parametric) and group ADF-statistics (or t-statistics, parametric). All of these seven tests consist of estimators that average the estimated coefficients of individual members of the panel. Each of these tests is capable of accommodating individual specific short run dynamics, individual specific fixed effects and deterministic trends, and individual specific slope coefficients (Pedroni, 2004). In the case of rejection of the null hypothesis by all seven tests, one can simply draw a conclusion. However, unfortunately, this does not frequently happen. One commonly meets a situation where there is a mix of evidence. If this happens, there is a need to look for a test that will explain the power of the cointegration model. As expanded by Pedroni (2004), in case of an adequately large panel, where the issue of size distortion is of little significance, panel v-statistics shows the best influence in contrast to the other six tests. The panel v-statistics is a one-sided test where the large positive values tend to reject the null hypothesis (Pedroni, 2004). On the other hand, in the case of very small-sized panels, group ρ-statistics are expected to reject the null hypothesis. One can be assured enough of the group ρ-statistics as the tests are purposely built for smaller samples and they are considered as the most conventional of all the seven tests. The rest of the five tests lie somewhere in between the two extreme cases of panel v-statistics and group ρ-statistics. However, they have advantages over a range of large, medium, or small-sized samples. One visible fact is that other than panel v-statistics, the rest of the six tests diverge to negative infinity; that is, the large negative values tend to reject the null hypothesis.
For this study, the valid long-co-movement between model variables will be concluded only if (at least) four out of seven test statistics raise evidence in favor of valid cointegration, i.e., four out of seven test statistics turn out to be statistically significant at ten percent or better significance level. In the event of failing to get the desired amount of statistical evidence in support of valid cointegration, the test results will be concluded as no cointegration existing between model variables.
ii) Fisher-Johansen Combined Panel Cointegration Test
Fisher 1932) derived a combined test that uses the results of individual independent tests. Maddala and Wu (1999) use Fisher’s result to propose an alternative approach to testing cointegration in panel data by combining tests from individual cross-sections to obtain a test statistic for the full panel. If
Maddala and Wu proposed two statistics: the Fisher statistic from the Trace test and the Fisher statistic from the Maximum Eigenvalue test. By default, the χ2 value based on the MacKinnon et al. (1999) p-value is used for Johansen’s cointegration Trace test and Maximum Eigenvalue test. Following Johansen’s cointegration method, cointegration necessitates the rank to be less than the number of variables in the LR equation. By using this test one can examine the linear combination of variables for a unit root. If there is more than two model variables, Johansen’s maximum likelihood estimation approach can categorize all possible co-integrating vectors. Being multivariate in nature, the test allows for reverse causality between model variables, i.e., changes in the dependent variable may cause changes in model-independent variables. For instance, if there are n variables that all have unit roots, there can be at most n-1 valid co-integrating vectors. For a given value of
For all of our four income groups, the test results for Pedroni residual-based cointegration estimator and Johansen-Fisher combined cointegration test are reported in Tables 2, 3, respectively.
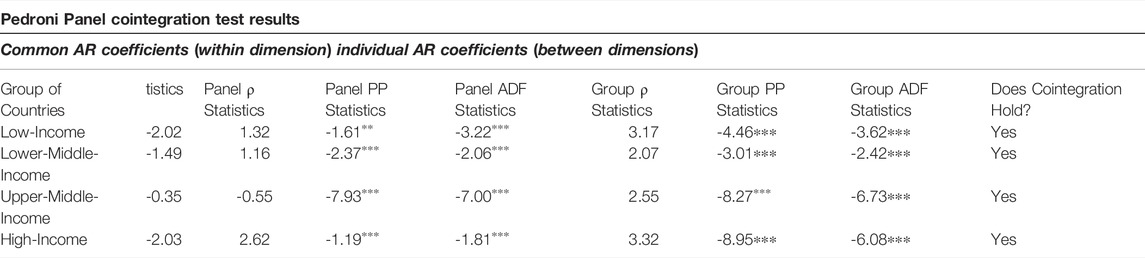
TABLE 2. Summary of results for the Pedroni panel cointegration test.
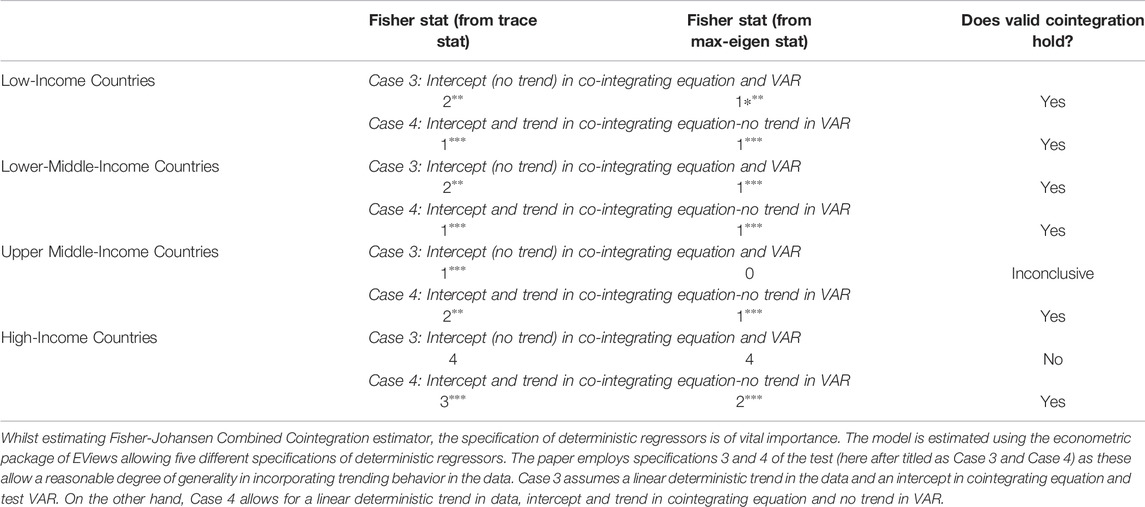
TABLE 3. Summary of Johansen-Fisher panel cointegration test results.
In Table 2, discussing the test statistics obtained from the Pedroni cointegration test, I first opted for automatic lag selection through Schwarz Information Criterion (SIC). For all income groups, SIC suggested the inclusion of one lag. Looking at Pedroni test results, a dominant number of test statistics (four out of seven) are in favor of rejecting the null hypothesis of “No Cointegration.” This is true for all four sets of country groups. I, therefore, interpret these results as supporting the valid existence of the long-run co-movement between carbon emissions, forestation, and renewable energy consumption against the cross-sectional data set of my subject economies.
As regarding the test results obtained from the Johansen-Fisher panel cointegration test in Table 3, similar to the Pedroni cointegration estimator, the results are once again (largely) supportive of a valid long-run association between the model variables. As the test requires the user to specify lag lengths, I selected the lag length through Panel VAR, following the lag suggestion of one lag, raised through SIC. However, the two individual test specifications yield different results. For the group of low-income counties both Trace and Maximum Eigenvalue statistics generates the rank of the test as 1. This indicates the existence of one valid co-integrating vector against specification three of the test with five percent or better statistical significance level
In the case of upper-middle- and high-income countries, the long-run co-movement between model variables is (relatively) less evident. Under two individual specifications of the test, we receive partial support for the cointegration of the two income groups. For the upper-middle-income group, only Trace statistics of specification three of the test found significant evidence of a valid co-integrating vector. On the contrary, one valid co-integrating vector is evident from specification four of the test, the rank of the test being 2 and 1, respectively, for Trace and Maximum Eigenvalue statistics. Similar to the case of the upper-middle-income group, the group of high-income countries is also yielding contrasting results under two test specifications. Under specification 3, the two test statistics (Trace and the Maximum Eigenvalue) commonly produce a rank of 4, challenging my unit root test findings, proving the model variables to be level stationary (since
In a nutshell, we take the statistical evidence yielded through two cointegration estimators sufficient to proceed further with estimating the long-run coefficients (elasticities) of the model regressors. Though not absolute, a decent amount of statistical evidence is acquired through both Pedroni cointegration and Johansen-Fisher combined cointegration estimators, the test statistics of two estimators (largely) favor the valid long-run co-movement between
Estimating the Degree of Long-Run Association Between
Having established the possibility of cointegration from the two cointegration tests, the next and the final step of the cointegration procedure, serving both the single equation (Pedroni residual-based) and multivariate (Johansen-Fisher) cointegration approach, requires the estimation of long-run coefficients (elasticities) of model regressors. The said coefficient will be estimated by using the panel for, being efficient enough to accommodate considerable heterogeneity across individual members of the panel.
The long-run elasticities produced by the Panel FMOLS estimator in Table 4 bring forth energy intensity (ei) as the most influential long-run determinant of
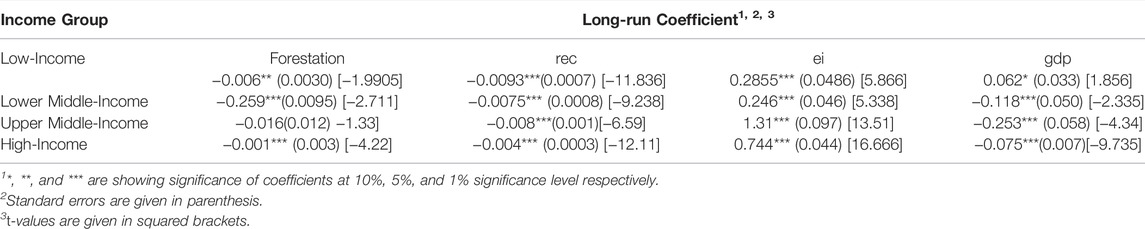
TABLE 4. Estimating Long-Run Coefficients of FMOLS.
Gross domestic product (gdp) turns out to be the second most important long-run determinant of
On the part of renewable energy consumption
Regarding forestation, the variable yields mixed evidence. The series is imparting (statistically) significant long-run effects only for lower- and upper-middle-income countries. However, for the upper-middle-income group, this effect is meager as the series yields a long-run coefficient of value −0.016, thus defying the practical importance of the series as a long-run determinant of
We have done an extensive econometric practice in the hope of identifying the (plausible) long-run explanatory power of renewable energy consumption, forestation, energy intensity, and country income status toward determining the trend patterns of carbon-based emissions for four different income groups of the world. A sufficient amount of statistical evidence in support of our hypothesized relationship is yielded, therefore. Both single equation and multivariate panel estimators (largely) came up with establishing (statistically) significant long-run association between carbon-related emission and its four determinants. However, the magnitude of this effect is less substantial, as proven by the long-run elasticities of model regressors (the PFMOLS estimates), particularly for the last two income groups. This is particularly true for the series of forestation and renewable energy consumption. These findings (marginally) back the idea of exploring the ways through which energy intensity levels could be optimized. Devising means of ensuring more efficient use of energy in production activities and bringing a cut down to the existing levels of energy consumption can certainly be pursued as an effective policy tool against controlling the prevalent situation of carbon-based emissions in our subject group of countries.
Conclusion and Discussions
This study undertakes a detailed examination of
A careful and comprehensive examination of the subject proposition is done to verify the long-run association between
From these results, we tend to accept the hypothesized relationship between
In a nutshell, my findings back the idea of cutting down the existing levels of energy intensity as a policy tool against controlling the prevalent situation of carbon emissions in subject economies to a larger extent and encouraging the exploration and the use of renewable energy sources, but to a lesser extent. A number of serious initiatives have already been taken on this front by many countries of the world. The high-income European countries stand at the forefront in this context as Ireland, Sweden and Denmark reportedly charge the highest tax rates on carbon-releasing industrial, transportation, and fuel production activities. In addition to taxes and charges, other important initiatives taken for curtailing the volumes of carbon emissions include tradable permits, voluntary agreements, subsidies and incentives, and research and development (R&D). Addressing climate change and ensuring green growth requires urgent policy actions to drive an unprecedented global infrastructure and technological transformation. Implementation of core climate policies: carbon pricing and market-based instruments, regulatory intervention, and targeted support to innovation in low-carbon sustainable technologies are those broad measures that are being practiced by many countries of the world.
Nevertheless, global greenhouse gas emissions have risen rapidly and remained too high to avoid severe and irreversible climate change impacts, seriously hindering their efforts toward sustainable economic growth. Therefore, a few important policy tools can be aligned to ensure their smooth transition to low-carbon economies. In the first place, governments should take serious initiatives toward altering the modes of energy structure by substituting nonrenewable energy for renewable energy such as hydropower, wind, and solar. For example, Germany and Spain are producing a significant amount of energy by using the mentioned sources. This certainly involves huge amounts of funds, technical expertise, and many other resources. Therefore, governments should plan the provision of all such essentials so that exiting producers and new investors can make a smooth transition. Furthermore, short-, medium- and long-term policies aimed at encouraging the production and consumption of renewable forms of energy can be used. This may include different forms of tax incentives and subsidies for energy sources that emit fewer and/or less hazardous emissions, like the production/use of biomass in the agriculture sector. Government should phase out fossil fuel subsidies and formulate a carbon pricing system. As time goes on, carbon prices will continue to rise.
Looking for policy solutions around energy intensity, there is a dire need to transform the economic structures from the high energy-intensive to the low energy-intensive sector will help to alleviate the negative impact of the production expansion on the environmental quality. For this purpose, energy efficiency must be improved to decrease energy intensity as well as
Data Availability Statement
The original contributions presented in the study are included in the article/Supplementary Materials, further inquiries can be directed to the corresponding author.
Author Contributions
Conceptualization, MI and GG, RF-G, and HMSO; methodology, MI, GG, FP-G, and NT; validation, RF-G, PG, MI, and GG; formal analysis, MI and GG; investigation, MI, GG, and RF-G; resources, MI and GG; data curation, MI, GG, and FPG; writing - original draft preparation, MI, GG, and RF-G; writing - review and editing, MI, GG, RF-G, FPG, HMSO, and NT; visualization, MI, GG, RF-G, FPG, HMSO, and NT. All authors have read and agreed to the published version of the manuscript.
Funding
This research has been funded by the Consellería de Cultura, Educación e Ordenación Universitaria of the Xunta de Galicia in Spain the postdoctoral grant ED481B2018/095 and the following grants: ED431C2018/48 and ED431E2018/07. In addition, this publication is part of the Spanish R&D&I project RTI 2018–099225-B-100, funded by MCIN/AEI/10.13039/501100011033/and FEDER “A way of doing Europeˮ.
Conflict of Interest
The authors declare that the research was conducted in the absence of any commercial or financial relationships that could be construed as a potential conflict of interest.
Publisher’s Note
All claims expressed in this article are solely those of the authors and do not necessarily represent those of their affiliated organizations or those of the publisher, the editors, and the reviewers. Any product that may be evaluated in this article, or claim that may be made by its manufacturer, is not guaranteed or endorsed by the publisher.
Acknowledgments
The authors are also grateful for the valuable contributions made by Juan Carlos López Rodríguez.
References
Adom, K. P., Bekoe, W., Amuakwa-Mensah, F., Mensah, J. T., and Botchway, E. (2012). Carbon Dioxide Emissions, Economic Growth, Industrial Structure, and Technical Efficiency: Empirical Evidence from Ghana, Senegal, and Morocco on the Causal Dynamics. Energy 47 (1), 314–325. doi:10.1016/j.energy.2012.09.025
Ahmed, K., and Long, W. (2012). Environmental Kuznets Curve and Pakistan: An Empirical Analysis. Procedia Econom. Financ. 1, 4–13.
Akhmat, G., Zaman, K., Shukui, T., Irfan, D., and Khan, M. M. (2014). Does Energy Consumption Contribute to Environmental Pollutants? Evidence from SAARC Countries. Environ. Sci. Pollut. Res. 21 (9), 5940–5951. doi:10.1007/s11356-014-2528-1
Al Mamun, M., Sohag, K., Hannan Mia, M. A., Salah Uddin, G., and Ozturk, I. (2014). Regional Differences in the Dynamic Linkage between CO2 Emissions, Sectoral Output and Economic Growth. Renew. Sustain. Energy Rev. 38, 1–11. doi:10.1016/j.rser.2014.05.091
Amuakwa-Mensah, F., and Adom, P. K. (2017). Quality of Institution and the FEG (Forest, Energy Intensity, and Globalization) -environment Relationships in Sub-saharan Africa. Environ. Sci. Pollut. Res. 24 (21), 17455–17473. doi:10.1007/s11356-017-9300-2
Ansuategi, A., Barbier, E., and Perrings, C. (1998). “The Environmental Kuznets Curve,” in Theory and Implementation of Economic Models for Sustainable Development (Dordrecht: Springer), 139–164. doi:10.1007/978-94-017-3511-7_7
Anwar, A., Sarwar, S., Amin, W., and Arshed, N. (2019). Agricultural Practices and Quality of Environment: Evidence for Global Perspective. Environ. Sci. Pollut. Res. 26 (15), 15617–15630. doi:10.1007/s11356-019-04957-x
Apergis, N., and Payne, J. E. (2014). The Causal Dynamics Between Renewable Energy, Real GDP, Emissions and Oil Prices: Evidence From OECD Countries. Appl. Econom. 46 (36), 4519–4525. doi:10.1080/00036846.2014.964834
Arrow, K., Bolin, B., Costanza, R., Dasgupta, P., Folke, C., Holling, C. S., et al. (1995). Economic Growth, Carrying Capacity, and the Environment. Ecol. Econ. 15 (2), 91–95. doi:10.1016/0921-8009(95)00059-3
Azhar Khan, M., Zahir Khan, M., Zaman, K., and Naz, L. (2014). Global Estimates of Energy Consumption and Greenhouse Gas Emissions. Renew. Sustain. Energy Rev. 29, 336–344. doi:10.1016/j.rser.2013.08.091
Aziz, M. A. A., Jalil, A. A., Wongsakulphasatch, S., and Vo, D. V. N. (2020). Understanding the Role of Surface Basic Sites of Catalysts in CO2 Activation in Dry Reforming of Methane: A Short Review. Catal. Sci. Technol. 10 (1), 35–45. doi:10.1039/C9CY01519A
Baek, J. (2016). A New Look at the FDI-Income-Energy-Environment Nexus: Dynamic Panel Data Analysis of ASEAN. Energy Policy 91, 22–27. doi:10.1016/j.enpol.2015.12.045
Ben Jebli, M., Ben Youssef, S., and Ozturk, I. (2015). The Role of Renewable Energy Consumption and Trade: Environmental Kuznets Curve Analysis for Sub-saharan Africa Countries. Afr. Dev. Rev. 27 (3), 288–300. doi:10.1111/1467-8268.12147
Ben Jebli, M., and Ben Youssef, S. (2017). The Role of Renewable Energy and Agriculture in Reducing CO 2 Emissions: Evidence for North Africa Countries. Ecol. Indic. 74, 295–301. doi:10.1016/j.ecolind.2016.11.032
Ben Jebli, M., Farhani, S., and Guesmi, K. (2020). Renewable Energy, CO2 Emissions and Value Added: Empirical Evidence from Countries with Different Income Levels. Struct. Change Econ. Dyn. 53, 402–410. doi:10.1016/j.strueco.2019.12.009
Bilgili, F., Koçak, E., and Bulut, Ü. (2016). The Dynamic Impact of Renewable Energy Consumption on CO2 Emissions: A Revisited Environmental Kuznets Curve Approach. Renew. Sustain. Energy Rev. 54, 838–845. doi:10.1016/j.rser.2015.10.080
Caputo, J. (2009). Sustainable Forest Biomass: Promoting Renewable Energy and Forest Stewardship. Washington, DC: Environmental and Energy Study Institute.
Chandio, A. A., Akram, W., Ahmad, F., and Ahmad, M. (2020). Dynamic Relationship Among Agriculture-Energy-Forestry and Carbon Dioxide (CO2) Emissions: Empirical Evidence from China. Environ. Sci. Pollut. Res. 27 (27), 34078–34089. doi:10.1007/s11356-020-09560-z
Cherni, A., and Essaber Jouini, S. (2017). An ARDL Approach to the CO2 Emissions, Renewable Energy and Economic Growth Nexus: Tunisian Evidence. Int. J. Hydrogen Energy 42 (48), 29056–29066. doi:10.1016/j.ijhydene.2017.08.072
Chiu, C. L., and Chang, T. H. (2009). What Proportion of Renewable Energy Supplies is Needed to Initially Mitigate CO2 Emissions in OECD Member Countries?. Renew. Sustain. Energy Rev. 13 (6–7), 1669–1674. doi:10.1016/j.rser.2008.09.026
Coondoo, D., and Dinda, S. (2008). Carbon Dioxide Emission and Income: A Temporal Analysis of Cross-Country Distributional Patterns. Ecol. Econ. 65 (2), 375–385. doi:10.1016/j.ecolecon.2007.07.001
Dar, J. A., and Asif, M. (2019). Do agriculture-based Economies Mitigate Emissions?: Empirical Evidence from Five SAARC Countries. Int. J. Energy Sect. Manag. 14 (3), 638–652.
Demir, M., Dindaroğlu, T., and Yılmaz, S. (2014). Effects of Forest Areas on Air Quality; Aras Basin and its Environment. J. Environ. Health Sci. Eng. 12 (1), 60. doi:10.1186/2052-336x-12-60
Dogan, E., and Seker, F. (2016). Determinants of CO2 Emissions in the European Union: The Role of Renewable and Non-renewable Energy. Renew. Energy 94, 429–439. doi:10.1016/j.renene.2016.03.078
EIA (2010). US Product Supplied for Crude oil and Petroleum Products, and US Total Crude Oil and Products Imports. Available at: http://www.eia.doe.gov/oil_gas/petroleum/info_glance/petroleum.html. (Accessed June 30, 2022).
FAO (2016). Forestry Paper; Forestry For a Low-Carbon Future. Rome: Food and Agriculture Organization of the United States.
Farooq, M. S., Riaz, S., Abid, A., Abid, K., and Naeem, M. A. (2019). A Survey on the Role of IoT in Agriculture for the Implementation of Smart Farming. Ieee Access 7, 156237–156271. doi:10.1109/ACCESS.2019.2949703
Fedoroff, N. V., and Cohen, J. E. (1999). Plants and Population: Is There Time? Proc. Natl. Acad. Sci. U.S.A. 96 (11), 5903–5907. doi:10.1073/pnas.96.11.5903
Friedl, B., and Getzner, M. (2003). Determinants of CO2 Emissions in a Small Open Economy. Ecol. Econ. 45 (1), 133–148. doi:10.1016/s0921-8009(03)00008-9
Green, R. E., Cornell, S. J., Scharlemann, J. P. W., and Balmford, A. (2005). Farming and the Fate of Wild Nature. science 307 (5709), 550–555. doi:10.1126/science.1106049
Grossman, G. M., and Krueger, A. B. (1991). Environmental Impacts of a North American Free Trade Agreement.
Hanif, I., Aziz, B., and Chaudhry, I. S. (2019). Carbon Emissions across the Spectrum of Renewable and Nonrenewable Energy Use in Developing Economies of Asia. Renew. Energy 143, 586–595. doi:10.1016/j.renene.2019.05.032
Hansen, J., Sato, M., Ruedy, R., Lo, K., Lea, D. W., and Medina-Elizade, M. (2006). Global Temperature Change. Proc. Natl. Acad. Sci. U.S.A. 103 (39), 14288–14293. doi:10.1073/pnas.0606291103
Harris, J. M., and Feriz, M. B. (2011). Forests, Agriculture, and Climate: Economics and Policy Issues. Medford: Global Development and Environment Istitute, Tufts University.
Heidari, H., Turan Katircioğlu, S., and Saeidpour, L. (2015). Economic Growth, CO2 Emissions, and Energy Consumption in the Five ASEAN Countries. Int. J. Electr. Power & Energy Syst. 64, 785–791. doi:10.1016/j.ijepes.2014.07.081
Huang, J., Pray, C., and Rozelle, S. (2002). Enhancing the Crops to Feed the Poor. Nature 418 (6898), 678–684. doi:10.1038/nature01015
Hussain, I., and Rehman, A. (2021). Exploring the Dynamic Interaction of CO2 Emission on Population Growth, Foreign Investment, and Renewable Energy by Employing ARDL Bounds Testing Approach. Environ. Sci. Pollut. Res. 28 (29), 39387–39397. doi:10.1007/s11356-021-13502-8
IPCC (2014). Climate Change 2014: Synthesis Report. Contribution of Working Groups I, II and III to the Fifth Assessment Report of the. Geneva, Switzerland.
IPCC (2007). Climate Change 2007: The Scientific Basis. Contribution of Working Group I to the Fourth Assessment Report of the Intergovernmental Panel on Climate Change. New York, NY: Cambridge Univ. Press.
Kais, S., and Sami, H. (2016). An Econometric Study of the Impact of Economic Growth and Energy use on Carbon Emissions: Panel Data Evidence From Fifty Eight Countries. Renew. Sustain. Energy Rev. 59, 1101–1110. doi:10.1016/j.rser.2016.01.054
Khan, M. T. I., Ali, Q., and Ashfaq, M. (2018). The Nexus between Greenhouse Gas Emission, Electricity Production, Renewable Energy and Agriculture in Pakistan. Renew. Energy 118, 437–451. doi:10.1016/j.renene.2017.11.043
Khan, S. A. R., Godil, D. I., Jabbour, C. J. C., Shujaat, S., Razzaq, A., and Yu, Z. (2021a). Green Data Analytics, Blockchain Technology for Sustainable Development, and Sustainable Supply Chain Practices: Evidence from Small and Medium Enterprises. Ann. Operations Res, 1–25. doi:10.1007/s10479-021-04275-x
Khan, S. A. R., Godil, D. I., Quddoos, M. U., Yu, Z., Akhtar, M. H., and Liang, Z. (2021b). Investigating the Nexus between Energy, Economic Growth, and Environmental Quality: A Road Map for the Sustainable Development. Sustain. Dev. 29 (5), 835–846. doi:10.1002/sd.2178
Khan, S. A. R., Ponce, P., Thomas, G., Yu, Z., Al-Ahmadi, M. S., and Tanveer, M. (2021c). Digital Technologies, Circular Economy Practices and Environmental Policies in the Era of COVID-19. Sustainability 13 (22), 12790. doi:10.3390/su132212790
Khan, S. A. R., Ponce, P., and Yu, Z. (2021d). Technological Innovation and Environmental Taxes toward a Carbon-free Economy: An Empirical Study in the Context of COP-21. J. Environ. Manag. 298, 113418. doi:10.1016/j.jenvman.2021.113418
Khan, S. A. R., Razzaq, A., Yu, Z., and Miller, S. (2021e). Industry 4.0 and Circular Economy Practices: A New Era Business Strategies for Environmental Sustainability. Bus. Strat. Env. 30 (8), 4001–4014. doi:10.1002/bse.2853
Khan, S. A. R., Yu, Z., and Sharif, A. (2021f). No Silver Bullet for De-carbonization: Preparing for Tomorrow, Today. Resour. Policy 71, 101942. doi:10.1016/j.resourpol.2020.101942
Kohler, M. (2013). CO2 Emissions, Energy Consumption, Income and Foreign Trade: A South African Perspective. Energy policy 63, 1042–1050. doi:10.1016/j.enpol.2013.09.022
Levin, A., Lin, C.-F., and James Chu, C.-S. (2002). Unit Root Tests in Panel Data: Asymptotic and Finite-Sample Properties. J. Econ. 108 (1), 1–24. doi:10.1016/s0304-4076(01)00098-7
Levin, A., and Lin, C. F. (1993). Unit Root Test in Panel Data: New Results. Department of Economics, University of California at San Diego. Discussion Paper, 93-56.
Levin, A., and Lin, C. F. (1992). Unit Root Test In Panel Data: Asymptotic And Finite Sample Properties. Discussion Paper. Department of Economics, University of California at San Diego. 92–93.
Lin, B., Omoju, O. E., Nwakeze, N. M., Okonkwo, J. U., and Megbowon, E. T. (2016). Is the Environmental Kuznets Curve Hypothesis a Sound Basis for Environmental Policy in Africa? J. Clean. Prod. 133, 712–724. doi:10.1016/j.jclepro.2016.05.173
Loganathan, N., Shahbaz, M., and Taha, R. (2014). The Link between Green Taxation and Economic Growth on CO2 Emissions: Fresh Evidence from Malaysia. Renew. Sustain. Energy Rev. 38, 1083–1091. doi:10.1016/j.rser.2014.07.057
MacCracken, M. C. (2008). Prospects for Future Climate Change and the Reasons for Early Action. J. Air & Waste Manag. Assoc. 58, 735–786. doi:10.3155/1047-3289.58.6.735
MacKinnon, J. G., Haug, A. A., and Michelis, L. (1999). Numerical Distribution Functions of Likelihood Ratio Tests for Cointegration. J. Appl. Economet. 14 (5), 563–577. doi:10.1002/(SICI)1099-1255(199909/10)14:5<563::AID-JAE530>3.0.CO;2-R
Maddala, G. S., and Wu, S. (1999). A Comparative Study of Unit Root Tests With Panel Data and a New Simple Test. Oxford Bull. Econom. Statist. 61 (S1), 631-652. doi:10.1111/1468-0084.0610s1631
Mahmood, H., Alkhateeb, T. T. Y., Al-Qahtani, M. M. Z., Allam, Z., Ahmad, N., and Furqan, M. (2019). Agriculture Development and CO2 Emissions Nexus in Saudi Arabia. PloS one 14 (12), e0225865. doi:10.1371/journal.pone.0225865
Malhi, Y., Phillips, O. L., Lloyd, J., Baker, T., Wright, J., Almeida, S., et al. (2002). An International Network to Monitor the Structure, Composition and Dynamics of Amazonian Forests (RAINFOR). J. Veg. Sci. 13 (3), 439–450. doi:10.1111/j.1654-1103.2002.tb02068.x
Namahoro, J. P., Wu, Q., Zhou, N., and Xue, S. (2021). Impact of Energy Intensity, Renewable Energy, and Economic Growth on CO2 Emissions: Evidence from Africa across Regions and Income Levels. Renew. Sustain. Energy Rev. 147, 111233. doi:10.1016/j.rser.2021.111233
Nechodom, M., Schuetzle, D., Ganz, D., and Cooper, J. (2008). Sustainable Forests, Renewable Energy, and the Environment. Environ. Sci. Technol. 42 (1), 13–18. doi:10.1021/es0870350
Panayotou, T. (1993). Empirical Tests and Policy Analysis of Development. Geneva: ILO Technology and Employment Programme Working Paper, WP238.
Pedroni, P. (1999). Critical Values for Cointegration Tests in Hetrogenous Panels with Multiple Regressors. Oxf. Bull. Econ. Statistics 61 (S1), 653–670. doi:10.1111/1468-0084.0610s1653
Pedroni, P. (2004). Panel Cointegration: Asymptotic and Finite Properties of Pooled Time Series Test with an Application to the PPP Hypothesis. Econ. Theory 20 (3), 597–625. doi:10.1017/s0266466604203073
Rafindadi, A. A. (2016). Does the Need for Economic Growth Influence Energy Consumption and CO2 Emissions in Nigeria? Evidence from the Innovation Accounting Test. Renew. Sustain. Energy Rev. 62, 1209–1225. doi:10.1016/j.rser.2016.05.028
Rahman, H. A. (2009). Global Climate Change and its Effects on Human Habitat and Environment in Malaysia. Malays. J. Environ. Manag. 10 (2), 17–32. doi:10.1016/j.rser.2014.08.081
Robalino-López, A., Mena-Nieto, Á., García-Ramos, J. E., and Golpe, A. A. (2015). Studying the Relationship between Economic Growth, CO2emissions, and the Environmental Kuznets Curve in Venezuela (1980–2025). Renew. Sustain. Energy Rev. 41, 602–614.
Sadorsky, P. (2014). The Effect of Urbanization on CO2 Emissions in Emerging Economies. Energy Econ. 41, 147–153. doi:10.1016/j.eneco.2013.11.007
Salahuddin, M., Habib, M. A., Al-Mulali, U., Ozturk, I., Marshall, M., and Ali, M. I. (2020). Renewable Energy and Environmental Quality: A Second-Generation Panel Evidence from the Sub Saharan Africa (SSA) Countries. Environ. Res. 191, 110094. doi:10.1016/j.envres.2020.110094
Schmalensee, R. (1993). ‘Comparing Greenhouse Gases for Policy Purposes. Energy J. 14, 245–255. doi:10.5547/issn0195-6574-ej-vol14-no1-10
Shafik, N., and Bandyopadhyay, S. (1992). Economic Growth and Environmental Quality: Time-Series and Cross-Country Evidence, 904. Washington, DC: World Bank Publications.
Shahbaz, M., Solarin, S. A., Sbia, R., and Bibi, S. (2015). Does Energy Intensity Contribute to CO2 Emissions? A Trivariate Analysis in Selected African Countries. Ecol. Indic. 50, 215–224. doi:10.1016/j.ecolind.2014.11.007
Shukla, V., and Parikh, K. (1992). The Environmental Consequences of Urban Growth: Cross-National Perspectives on Economic Development, Air Pollution, and City Size. Urban Geogr. 13 (5), 422–449. doi:10.2747/0272-3638.13.5.422
Silva, S., Soares, I., and Pinho, C. (2012). The Impact of Renewable Energy Sources on Economic Growth and CO2 Emissions - a SVAR Approach.
Sims, R. E. H. (2004). Renewable Energy: A Response to Climate Change. Sol. Energy 76, 9–17. doi:10.1016/s0038-092x(03)00101-4
Trewavas, A. (2002). Malthus Foiled Again and Again. Nature 418 (6898), 668–670. doi:10.1038/nature01013
Tucker, M. (1995). Carbon Dioxide Emissions and Global GDP. Ecol. Econ. 15 (3), 215–223. doi:10.1016/0921-8009(95)00045-3
Tunç, G. I., Türüt-Aşık, S., and Akbostancı, E. (2009). A Decomposition Analysis of CO2 Emissions From Energy use: Turkish Case. Energy Policy 37 (11), 4689–4699. doi:10.1016/j.enpol.2009.06.019
Ulucak, R., and Khan, S. U. D. (2020). Relationship between Energy Intensity and CO2emissions: Does Economic Policy Matter? Sustain. Dev. 28 (5), 1457–1464. doi:10.1002/sd.2041
Waheed, R., Chang, D., Sarwar, S., and Chen, W. (2018). Forest, Agriculture, Renewable Energy, and CO2 Emission. J. Clean. Prod. 172, 4231–4238. doi:10.1016/j.jclepro.2017.10.287
Zafeiriou, E., Arabatzis, G., Tampakis, S., and Soutsas, K. (2014). The Impact of Energy Prices on the Volatility of Ethanol Prices and the Role of Gasoline Emissions. Renew. Sustain. Energy Rev. 33, 87–95. doi:10.1016/j.rser.2014.02.001
Keywords: circular economy, CO2 emission, forestation, panel cointegration and panel fully modified OLS, renewable energy consumption
Citation: Ishaq M, Ghouse G, Fernández-González R, Puime-Guillén F, Tandir N and Santos de Oliveira HM (2022) From Fossil Energy to Renewable Energy: Why is Circular Economy Needed in the Energy Transition?. Front. Environ. Sci. 10:941791. doi: 10.3389/fenvs.2022.941791
Received: 11 May 2022; Accepted: 31 May 2022;
Published: 25 July 2022.
Edited by:
Syed Abdul Rehman Khan, Xuzhou University of Technology, ChinaReviewed by:
Adeel Shah, College of Business Management, PakistanMuhammad Jawad Sajid, Xuzhou University of Technology, China
Copyright © 2022 Ishaq, Ghouse, Fernández-González, Puime-Guillén, Tandir and Santos de Oliveira. This is an open-access article distributed under the terms of the Creative Commons Attribution License (CC BY). The use, distribution or reproduction in other forums is permitted, provided the original author(s) and the copyright owner(s) are credited and that the original publication in this journal is cited, in accordance with accepted academic practice. No use, distribution or reproduction is permitted which does not comply with these terms.
*Correspondence: Félix Puime-Guillén, ZmVsaXgucHVpbWVAdWRjLmVz