- Department of Water, Atmosphere and Environment, Institute of Sanitary Engineering and Water Pollution Control, University of Natural Resources and Life Sciences, Vienna (BOKU), Vienna, Austria
An evaluation of the treatment performance of small wastewater treatment plants with the capacity of ≤50 PE (population equivalent) was carried out using data collected in external monitoring reports, taking Upper Austria as an example. External monitoring data for 2009–2018 were available for this analysis. About 2′500 small WWTPs are in operation in Upper Austria. The main technologies implemented include about 870 Sequencing Batch Reactor (SBR) plants, 630 conventional activated sludge (CAS) plants and 535 vertical flow (VF) wetlands. The data set for the present evaluation comprises a total of approx. 14′000 external monitoring reports from approx. 2′000 small WWTPs. This paper presents the results of this evaluation. The evaluation showed that all technologies meet the legal requirements regarding BOD5, COD and NH4-N effluent concentrations. However, for small WWTPs with a polishing stage consisting of a VF wetland, the median values of the effluent concentrations and the limit value exceedances are significantly lower. There is no evidence of a significant deterioration in treatment performance with the age of the plant for any technology. However, for all technical WWTPs such as SBR and CAS plants, a greater fluctuation of the measured values (i.e. the median values of the effluent concentrations) can be observed when the plant is longer in operation. Compared to technical WWTPs, this fluctuation is significantly smaller in VF wetlands.
Introduction
In Austria, about 96% of the population is served by about 1′870 wastewater treatment plants (WWTPs) with a design size of >50 population equivalent (PE) (BMLRT, 2020). Aside from this, there are about 27′500 small WWTPs with design sizes less than or equal to 50 PE. Among these small WWTPs, the technologies most frequently implemented are conventional activated sludge (CAS) plants (about 6′880 plants), treatment wetlands (TWs) (about 5′460 plants) and Sequencing Batch Reactor (SBR) plants (about 4′680 plants) (Langergraber et al., 2018).
To be operated, all WWTPs require a permit given by the local authorities (Langergraber et al., 2018). According to Austrian standards (1. AEVkA, 1996), for WWTPs less than or equal to 500 PE, a maximum ammonia nitrogen effluent concentration of 10 mg/L has to be met at effluent water temperatures higher than 12°C. For organic matter, effluent concentrations (90 mg COD/L and 25 mg BOD5/L) and treatment efficiencies (85% and 95% for COD and BOD5, respectively) have to be met throughout the whole year. In contrast, there is no discharge limit for total nitrogen and phosphorus. For small WWTPs ≤50 PE, no specific Austrian standard exists. However, for plants ≤50 PE, the same effluent concentrations are usually applied as for plants ≤500 PE, i.e., 90 mg COD/L and 25 mg BOD5/L, and 10 mg NH4-N/L, respectively.
The Austrian regulation is quite strict compared to other countries in the European Union (EU). The EU Urban Wastewater Treatment Directive (UWWTD - Urban Wastewater Treatment, 1991, i.e., the Directive 91/271/EEC) regulates the treatment of wastewater from agglomerations larger than 2′000 PE and does not prescribe a general standard for agglomerations smaller than 2′000 PE. For small agglomeration, EU member states are obliged to ensure “appropriate treatment” such that the water quality objectives of the receiving waters are met. As an example, the Polish legislation requires that for WWTPs <2′000 PE the following effluent concentrations are not exceeded: 150 mg COD/L and 40 mg BOD5/L. Additionally, in sensitive areas a Total Kjeldahl Nitrogen of 30 mg N/L has to be met (PL-WWR – Polish Wastewater Regulation, 2019).
As in Austria nitrification is required for all WWTPs, vertical flow (VF) wetlands are the sole TW type implemented. The development of single-stage VF wetlands started in the early 1990s when the requirement for nitrification was introduced. The publication of the first Austrian design guide (ÖNORM B 2505, 1997) led to a significant increase of implemented VF wetlands (Langergraber and Weissenbacher, 2017).
There are only a few studies on the long-term treatment performance of small WWTPs ≤50 PE (or on-site and household wastewater treatment systems, respectively). In a study conducted in Salzburg (one of the nine federal states of Austria), random samples were taken from the effluent of 10 of the most commonly used technologies in Salzburg (i.e., VF wetlands, SBR, CAS and trickling filter). These samples were analysed for compliance with effluent requirements (i.e., TSS, BOD5, COD and NH4-N). VF wetlands examined were the only technology in which all plants complied with all the required effluent limits (Schaber and Reif, 2009). In Austria, authorities regularly collect data regarding the treatment performance of small WWTPs as part of third-party external monitoring activities. The prescribed intervals for external monitoring are different for all provinces (e.g., once a year in Upper Austria and every 3 years in Lower Austria; these intervals apply if the training course for operators of small WWTPs – offered by the Austrian Water and Waste Association (ÖWAV) – has been successfully completed). The owners of the WWTPs have to send the external monitoring reports to the responsible authorities. Usually, only the receipt of the report is noted. A detailed analysis of the reports has not been done so far.
The aim of this work was thus to carry out a first systematic evaluation of the long-term functioning and treatment performance of small WWTPs ≤50 PE on the basis of the data collected in the external monitoring reports. Up to now, no study using this large amount of data collected from small WWTPs in operation has been carried out. The main research questions are whether differences can be determined in the treatment performance of different technologies used in small WWTPs, and how the treatment performance of different technologies develops over time. The small WWTPs implemented in the province of Upper Austria are used as an example.
Methodology
Up-to-date data on the inventory of small WWTPs and the collected external monitoring reports from the years 2009–2018 were made available as MSExcel® files by the local authorities. In total, the database contained 14′200 external monitoring reports from 1′980 small WWTPs.
As a first step, each single small WWTP in the inventory had to be assigned to a technology type according to the methodology described by Langergraber et al. (2018). The following technologies were used for the inventory: SBR plants, CAS plants, VF wetlands, trickling filters, Rotating Biological Contractor (RBC) plants, Membrane Bio-Reactor (MBR) plants and filtration systems (“Bodenkörperfilter" in German). To clearly distinguish from a single-stage VF wetland used as a main treatment stage, we use the term VF bed for the cases in which it is used as a polishing stage after another treatment technology.
The plant inventory had to be merged with the dataset from external monitoring, which entailed assigning the external monitoring data to the right small WWTP type. The dataset from external monitoring is based on effluent grab samples and comprise:
- concentrations of NH4-N, COD and BOD5, as well as
- settleable substances, pH value and temperature.
For the analysis, we focused on the evaluation of the effluent concentrations of NH4-N, COD and BOD5 that are also measured during external monitoring.
The data were analysed in three steps:
1) Development of small WWTPs in Upper Austria: for the results presented previously (Langergraber et al., 2018), data from 2016 were used, representing the implementation status at the end of 2015. The current data represent the state of implementation at the end of 2018. This also made it possible to analyse the development of small WWTPs in Upper Austria during a 3-year period.
2) Analysis of the effluent concentrations of different technologies: all values available in the database were used to compare the effluent concentrations. Additionally, the influence of effluent water temperature on the effluent concentrations of different technologies was investigated.
3) Influence of the age of the plant on the treatment efficiency: here, the data from the external monitoring reports were sorted according to the age of the plant, i.e., the number of years that have passed from the original commissioning of the WWTP to the time the relevant external monitoring was undertaken. Only those years were used for the analysis in which more than five external monitoring reports were available for the respective technology. Therefore, the measured NH4-N, BOD5 and COD effluent concentrations are assigned to the years after commissioning of the treatment plants. The median value of all values for every year is then calculated to figure out if an improvement or a deterioration of the treatment performance can be seen. In order to assess the treatment performance of every single treatment plant during the relevant period of operation (with five or more years of measured values), each is inspected to determine whether there is a trend in NH4-N effluent concentration. The non-parametric Mann-Kendall trend test with a 95% significance level is performed in R-studio (more details can be found in Engstler, 2020).
Results and Discussion
Number of Small WWTPs
Table 1 and Figure 1 show the number of small WWTPs in Upper Austria. Overall, the total number of plants increased by about 130 between 2016 and 2019. Currently, there are more than 2′500 small WWTPs in operation. Among them, there are about 870 SBR plants, 630 CAS plants and 535 TWs. There are still about 300 small WWTPs that are only primary treatment plants. These plants are three-chamber septic tanks and no longer state-of-the-art. However, they were implemented before the nitrification requirement was introduced in the 1990s and have a long-term permits. Authorities aim to reduce the number of non-state-of-the-art plants with time. Between 2016 and 2019, the number of plants with only primary treatment was reduced by 80 plants. Other technologies implemented with smaller numbers are trickling filter (about 100 plants), RBC plants (37), MBR plants (26) and filtration systems (27). Nowadays, the most popular technologies for small WWTPs are SBR plants and VF wetlands, with 170 and 60 implementations between 2016 and 2019, respectively. CAS plants and trickling filters were among the first technologies implemented in the 1990s (Langergraber et al., 2018) and are decreasing in number. This might be attributable to replacement by other technologies or to the fact that some small WWTPs are closed down once public sewer networks are expanded.
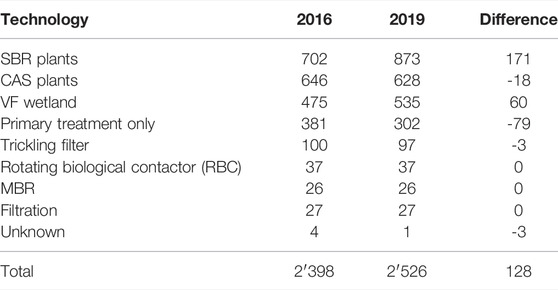
TABLE 1. Number of small WWTPs in Upper Austria 2016 (Langergraber et al., 2018) and 2019 (Engstler, 2020).
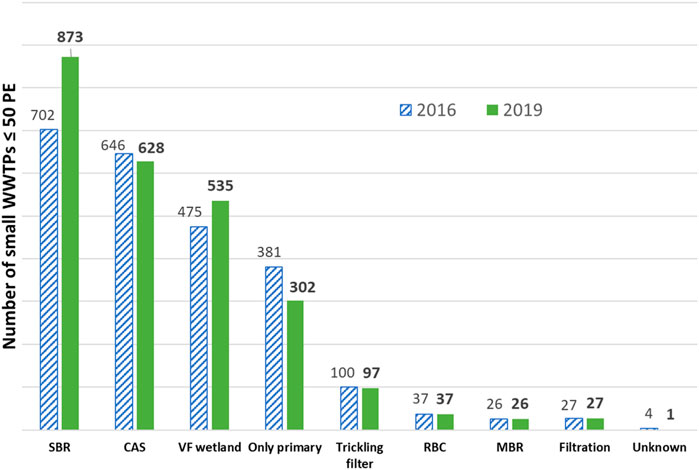
FIGURE 1. Development of the number of small WWTPs in Upper Austria (adapted from Engstler, 2020).
Based on the capacity of the receiving waters, authorities can require more stringent effluent concentrations for small WWTPs. If this is the case, a polishing stage, most of the time a VF bed following the technical system, is applied. Thus, for the evaluation of the treatment performance, not only the main treatment stage is considered. 33% of all SBR plants (290 out of 873) and 9% of CAS plants (54 of 628) are implemented with a VF bed for polishing (Figure 2).
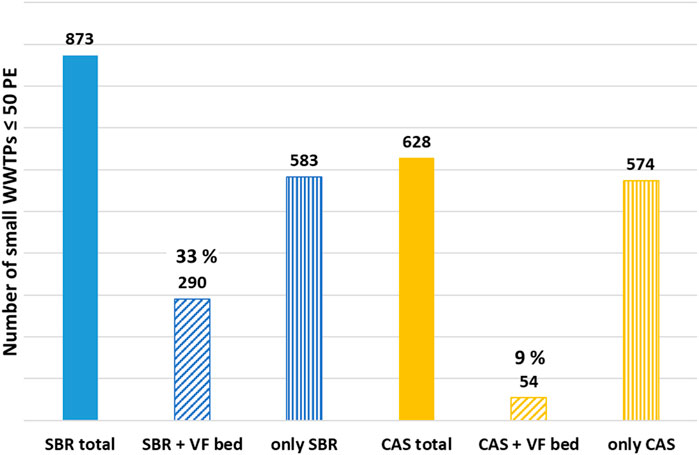
FIGURE 2. SBR and CAS plants with/without a VF bed for polishing (adapted from Engstler, 2020).
Effluent Concentrations of Different Technologies
Tables 2, 3 show the BOD5 and COD effluent concentrations for different technologies, respectively. All technologies can achieve low median values of BOD5 effluent concentrations (below 10 mg BOD5/L): the number of exceedances of the BOD5 threshold value are very low (below 10 for each technology). The lowest median values of COD effluent concentrations are found for VF wetlands, SBR and CAS plants with VF beds as polishing stage and MBR plants. For these technologies, median values were between 20 and 25 COD mg/L, for all other plant types between 35 and 45 COD mg/L. Most values exceeding the threshold are found for SBR and CAS plants, trickling filters and RBC plants.

TABLE 2. BOD5 effluent concentrations of small WWTPs with different technologies (threshold: 25 mg BOD5/L).

TABLE 3. COD effluent concentrations of small WWTPs with different technologies (threshold: 90 mg COD/L).
A similar result can be found for NH4-N as shown in Table 4. The highest number of exceedances of limit values was measured in soil filter systems (11.1%) and in trickling filter and submersible systems (each approx. 6%), while the lowest number of exceedances of limit values was noted in SBR systems with a downstream planted soil filter (0.8%) and in constructed wetlands (1.5%). Systems with a downstream planted soil filter or with a planted soil filter as the main treatment stage (constructed wetlands) also had the lowest median value of NH4-N effluent concentration. The median value was 0.24 mg/L for activated sludge plants with a downstream planted soil filter, 0.37 mg/L for constructed wetlands, and 0.68 mg/L for SBR plants with a downstream planted soil filter. MBR plants had a significantly higher median NH4-N effluent concentration of 1.78 mg/L than, for example, SBR plants and activated sludge plants using the continuous flow principle with 1.00 and 1.09 mg/L, respectively.

TABLE 4. NH4-N effluent concentrations of small WWTPs with different technologies (threshold: 10 mg NH4-N/L for effluent water temperatures >12°C).
Figure 3 shows a violin plot of NH4-N effluent concentrations for various technologies. A lot of the near-zero values were measured particularly in VF wetlands and both CAS and SBR plants with VF beds. These are also the three technologies with the lowest median values and the lowest lower quartiles. Most values measured for these technologies are clustered below 2.5 NH4-N mg/L. The higher median value of SBR plants with VF bed can be seen in the violin plot as the second bump in the density shape around the upper quartile. In contrast, the data for trickling filters and filtration plants are quite evenly distributed between very low effluent concentrations and the threshold.
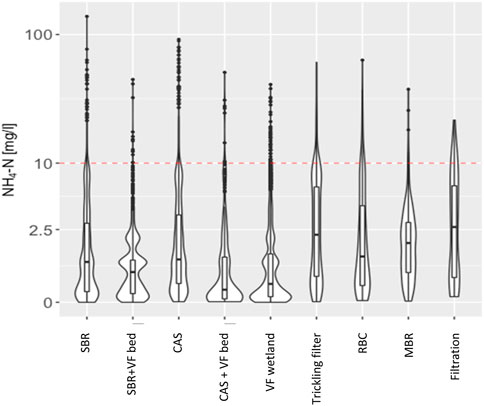
FIGURE 3. Violin plot of NH4-N effluent concentrations for various technologies (red dashed line: threshold value of 10 mg NH4-N/L). Violin plots visualize the distribution of numerical data by depicting summary statistics and the density of each variable.
Figure 4 shows the correlation of NH4-N effluent concentrations with wastewater temperature. In the case of VF wetlands, the dependence of the treatment performance on temperature is less pronounced, which in turn indicates a more stable and robust operation of VF wetlands compared to technical wastewater treatment plants (SBR, CAS, trickling filters and RBC). In SBR and in CAS plants, the NH4-N effluent concentrations are only slightly higher than in VF wetlands; in trickling filter and RBC plants, somewhat higher NH4-N effluent concentrations are generally to be expected. When a polishing VF wetland is used, the influence of temperature on the treatment performance is almost eliminated.
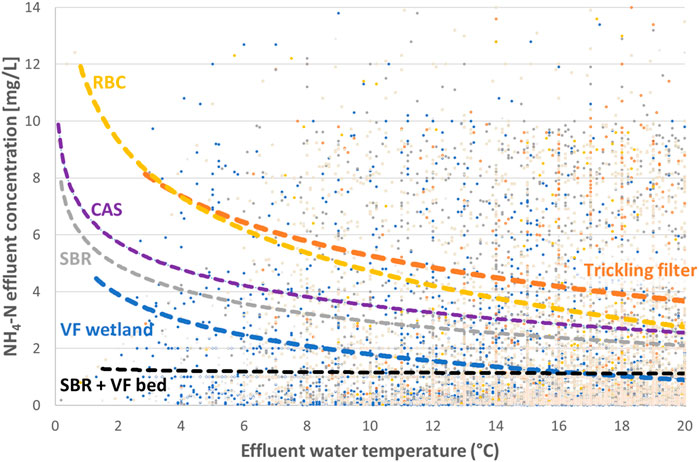
FIGURE 4. NH4-N effluent concentrations in relation to the effluent water temperature for selected technologies.
Treatment Performance Over the Operation Time
Table 5 shows the size of the dataset available and the median values of the COD effluent concentrations for four technologies depending on the age of the system. The oldest plant in this list is a trickling filter plant that was built 29 years ago. However, only a few trickling filters have been built in the last 10 years. In contrast, there are many SBR plants (with and without VF beds) and VF wetlands that were built during this period. Thus, there are many values from external monitoring reports of young plants. In the following diagrams, median values were calculated only in cases where values from more than five plants were available, in order to avoid outliers due to individual plant performance.
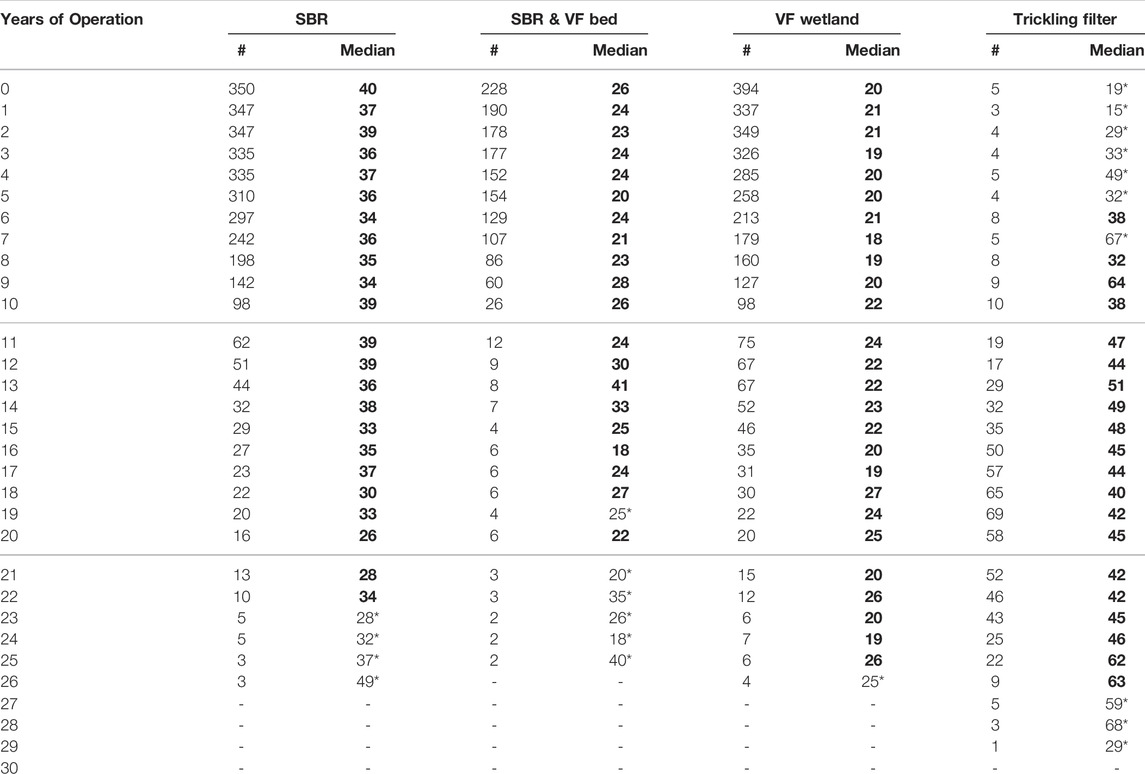
TABLE 5. Number of data (#) and median value of COD effluent concentration (in mg COD/L) for four technologies depending on the age of the plant (values in bold considered for the following diagrams, * values not considered for the following diagrams as the number of data available was ≤5).
Figures 5, 6 show the COD effluent concentrations of different technologies depending on the age of the plant, whereby Figure 6 compares the technologies with VF beds. VF wetlands and MBR plants showed the lowest COD effluent concentrations. Higher COD effluent concentrations were generally measured for RBCs and trickling filter plants. However, no significant deterioration in treatment performance over time was observed for any technologies. There is a tendency for the median values to fluctuate more from 1 year to the next as the plant ages. The fluctuations of the median values tend to be higher for technical plants when compared to VF wetlands. Larger fluctuations could be an indication of less stable performance, but can probably also be attributed to the smaller number of older plants.
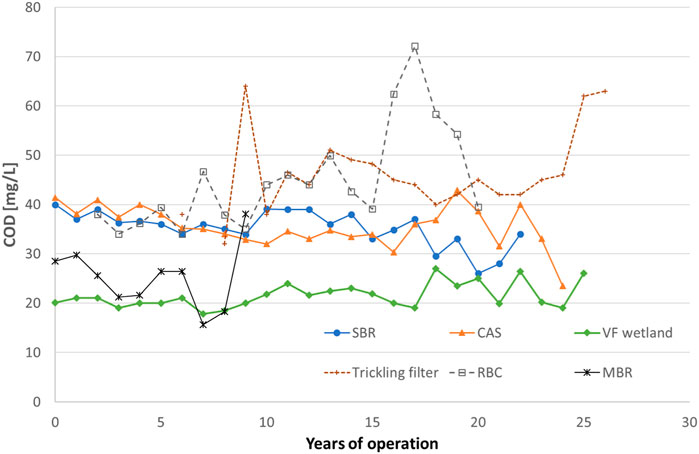
FIGURE 5. Median values of the COD effluent concentrations of six technologies in relation to the age of the small WWTP.
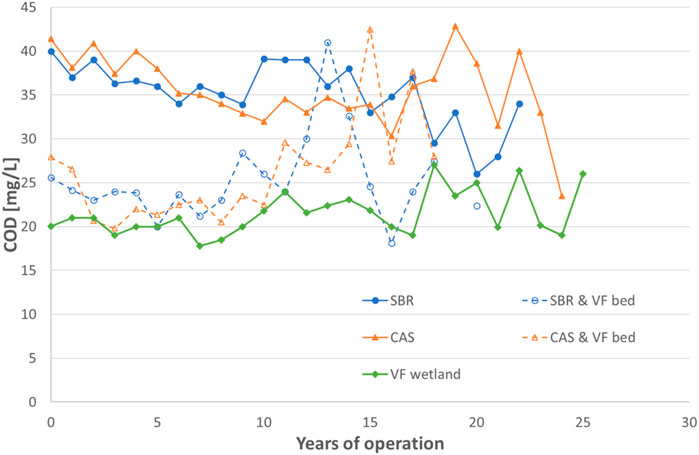
FIGURE 6. Median values of the COD effluent concentrations of technologies with or without VF beds and VF wetlands in relation to the age of the small WWTP.
Figure 6 compares SBR and CAS plants with and without VF beds and VF wetlands. Technical wastewater treatment plants with VF beds produce COD effluent concentrations similar to VF wetlands. Thus, the additional treatment step after the technical system significantly increases the treatment performance in terms of lower COD effluent concentrations and more stable treatment performance over time. Again, a greater fluctuation of the median values can be observed as the age of the plant increases. The behaviour of the BOD5 effluent concentrations is similar to that of the COD effluent concentrations (not shown).
Figures 7, 8 show the same data for the comparison of the median values of the NH4-N effluent concentrations. The comparison of the different plants yields results similar to the COD values (Figures 5, 6). Technical wastewater treatment plants show greater fluctuations in the median values of the NH4-N effluent concentrations in subsequent years when compared to VF wetlands. On the one hand, this indicates that nitrification is the most sensitive process in wastewater treatment plants. On the other hand, the robustness of VF wetlands is clearly evident, especially with regard to reliable and robust nitrification performance. CAS and SBR plants have lower NH4-N effluent concentrations and less fluctuations comparted to other technical systems. Higher NH4-N effluent concentrations of MBR plants compared to CAS and SBR plants are in contrast to the results for COD where MBR plants show better performance. The higher COD removal of MBR plants can be explained due to the removal of particulate COD during membrane filtration. For trickling filters, the high fluctuations of NH4-N effluent concentrations indicate less stable nitrification performance when compared to their COD treatment efficiency. With an additional VF beds after SBR and CAS plants, NH4-N effluent concentrations of SBR and CAS plants can be improved and similar performance of VF wetlands can be reached.
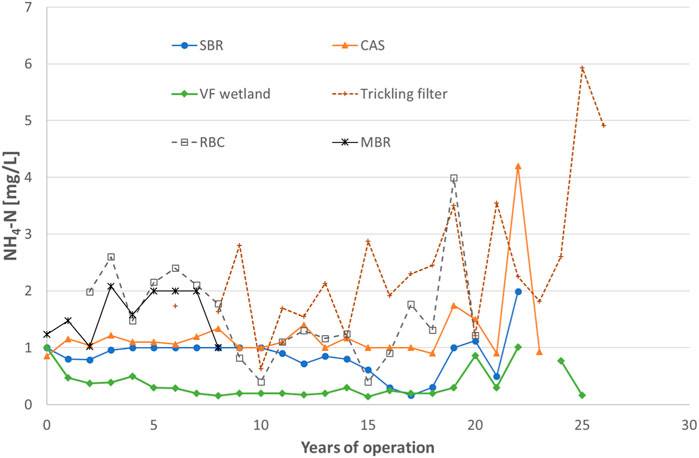
FIGURE 7. Median values of the NH4-N effluent concentrations of six technologies in relation to the age of the small WWTP.
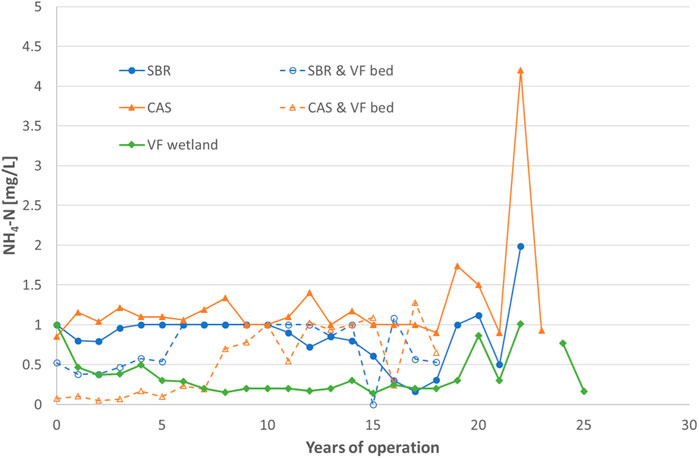
FIGURE 8. Median values of the NH4-N effluent concentrations of technologies with or without VF beds and VF wetlands in relation to the age of the small WWTP.
Table 6 shows the results of the treatment performance analysis (using NH4-N effluent concentrations) over the operation time of every single treatment plant. In total, data from 493 SBR plants were available; and of these, 369 plants had five or more measured values included in the analysis. For only 5% of the SBR plants, a trend in the treatment performance could be observed, whereby about half of these 5% had a positive trend (i.e., increasing effluent concentrations and thus deteriorating treatment performance over time) and the other half a negative trend (i.e., decreasing effluent concentrations and thus improving treatment performance over time). For all technologies with a higher number of implementations (SBR, SBR + VF bed, CAS and VF wetland), about 10% of the single plants evidenced a trend within a 95% significance level. These trends were both negative and positive, with a tendency toward higher percentages of negative trends (improving treatment performance) for VF wetlands. However, due to the low percentage of single plants showing a clear trend, this behavior is more likely attributable to specific aspects of these single plants than to a general trend for different technologies.
Comparison With Other Studies
Karczmarczyk et al. (2021) evaluated the performance of compact plants in Poland. For 2019, they presented a number of more than 230′000 implemented systems in Poland. For their study, they selected 23 plants from a list of municipalities that received funding for construction from a Regional Fund. Effluent samples from these 23 plants (including CAS and SBR plants as well as fixed-bed reactors) have been taken and analysed for BOD5 whereby more than 50% of the plants did not fulfil the Polish effluent standard of 40 mg BOD5/L. Based on their measurements, Karczmarczyk et al. (2021) estimated the environmental impact an annual costs of on-site wastewater treatment systems for Polish conditions.
In the study of Hellström and Jonsson (2004), 14 single-house treatment plants using different technologies have been investigated in Sweden. Systems tested include package plants, urine separating systems, blackwater separating systems and chemical precipitation as a supplement to sand filter beds. In addition to removal of organic matter, also nitrogen and phosphorus removal was targeted. Weiss et al. (2008) performed an environmental systems analysis of four on-site wastewater treatment options with focus on phosphorus removal under Swedish conditions. However, they did only use literature data for the performance of the systems.
Kegebein et al. (2007) evaluated the performance of four technologies (i.e., trickling filter, RBC, CAS and a moving bed biofilm system) using measured data from lab-scale experiments with defined loading of the systems. Main objective of their study was to test the behaviour of the plants during and after non-loading periods.
Performance of on-site wastewater treatment systems in Western Australia has been evaluated by Gunady et al. (2015). However, this evaluation was not based on measured quality data but on the evaluation of the reasons for non-performance of the systems. Identified reasons were inadequate installation, inadequate maintenance, poor public awareness, insufficient local authority resources, ongoing wastewater management issues, or inadequate adoption of standards, procedures, and guidelines.
Studies on the performance of small WWTPs ≤50 PE, on-site and household wastewater treatment systems are very scarce. Compared to our study, the number of measured field data used for the performance evaluation in other studies was very small (e.g., Hellström and Jonsson, 2004; Karczmarczyk et al., 2021). Other studies such as Kegebein et al. (2007) aimed to monitor the treatment performance during specific loading scenario, i.e. non-loading periods.
Reasons for non-functioning plants in Western Australia (Gunady et al., 2015) have been addressed in the Austrian case by developing design standard, proper management of small WWTPs on the authority side (e.g. permits required for every plant), proper monitoring schemes (self and external monitoring) as well as the training courses for operators od small WWTPs (Langergraber et al., 2018).
Conclusion
The evaluation of the long-term functioning and treatment performance of small WWTPs ≤50 PE carried out in this study can be considered unique in terms of number of WWTPs evaluated (almost 2′000 plants), number of data available (about 14′000), operational age of the plants (from new installed plants up to 30 years old plants), and the long period (10 years) for which data were available for single plants. To our knowledge, this study is the first that uses such a large amount of data collected from implemented plants.
Based on the performance evaluation of the small WWTPs ≤50 PE in Upper Austria we conclude that.
• SBR plants and VF wetlands are the technologies most commonly implemented in recent years for small WWTPs (with ≤50 PE) in Austria;
• all technologies implemented for small WWTPs fulfil the Austrian legal requirements regarding the effluent concentrations of BOD5, COD and NH4-N;
• small technical WWTPs with a VF bed as polishing stage have lower effluent concentrations compared to plants without a VF bed as polishing stage;
• small WWTPs with a VF bed as polishing stage have similar effluent concentrations to a single-stage VF wetland;
• none of the applied technologies shows a significant reduction of treatment performance over time; and
• aging VF wetlands show fewer fluctuations of effluent concentrations compared to technical systems, indicating a more robust performance of treatment wetlands.
Long-term functioning and good treatment performance of small WWTPs in Austria can be attributed to the well-established management scheme for these systems including designs guides, monitoring programs and training courses for operators.
Data Availability Statement
The data analyzed in this study is subject to the following licenses/restrictions: Data set is owned by the Upper Austrian Provincial Government. Requests to access these datasets should be directed to Z3VlbnRlci5sYW5nZXJncmFiZXJAYm9rdS5hYy5hdA==.
Author Contributions
EE: data analysis, figures, writing; DK: data anlalysis, reviewing; GL: project idea, supervision, writing, editing.
Conflict of Interest
The authors declare that the research was conducted in the absence of any commercial or financial relationships that could be construed as a potential conflict of interest.
Publisher’s Note
All claims expressed in this article are solely those of the authors and do not necessarily represent those of their affiliated organizations, or those of the publisher, the editors and the reviewers. Any product that may be evaluated in this article, or claim that may be made by its manufacturer, is not guaranteed or endorsed by the publisher.
Acknowledgments
The authors would like to thank the colleagues from the Office of the Upper Austrian Provincial Government (Amt der OÖ Landesregierung) for providing the data. Additionally, we would like to thank our colleague Katie Kearney for proofreading the manuscript before submission.
References
AEVkA (1996). 1. Abwasseremissionsverordnung für kommunales Abwasser (First ordinance for emissions from domestic wastewater). Vienna, Austria: Federal Ministry of Agriculture and Forestry. BGBl.210/1996.
BMLRT (2020). Kommunales Abwasser – Österreichischer Bericht 2020 (Urban Wastewater - Austrian Report 2020). Vienna, Austria: Bundesministerium für Landwirtschaft, Regionen und Tourismus. [in German].
Engstler, E. (2020). Evaluation of the Treatment Performance of Small Wastewater Treatment Plants in Upper Austria. Vienna. Austria: Master thesis, Institute of Sanitary Engineering and Water Pollution Control, University of Natural Resources and Life Sciences, Vienna (BOKU).
Gunady, M., Shishkina, N., Tan, H., and Rodriguez, C. (2015). A Review of On-Site Wastewater Treatment Systems in Western Australia from 1997 to 2011. J. Environ. Public Health 2015, 716957. doi:10.1155/2015/716957
Hellström, D., and Jonsson, L. (2004). Evaluation of Small Wastewater Treatment Systems. Water Sci. Technol. 48 (11-12), 61–68. doi:10.2166/wst.2004.0804
Karczmarczyk, A., Bus, A., and Baryła, A. (2021). Assessment of the Efficiency, Environmental and Economic Effects of Compact Type On-Site Wastewater Treatment Plants-Results from Random Testing. Sustainability 13, 982. doi:10.3390/su13020982
Kegebein, J., Hoffmann, E., and Hahn, H. H. (2007). Performance of Very Small Wastewater Treatment Plants with Pronounced Load Variations. Water Sci. Technol. 55 (7), 31–38. doi:10.2166/wst.2007.123
Langergraber, G., Pressl, A., Kretschmer, F., and Weissenbacher, N. (2018). Small Wastewater Treatment Plants in Austria - Technologies, Management and Training of Operators. Ecol. Eng. 120, 164–169. doi:10.1016/j.ecoleng.2018.05.030
Langergraber, G., and Weissenbacher, N. (2017). Survey on Number and Size Distribution of Treatment Wetlands in Austria. Water Sci. Technol. 75 (10), 2309–2315. doi:10.2166/wst.2017.112
ÖNORM B 2505 (1997). Bepflanzte Bodenfilter (Pflanzenkläranlagen) – Anwendung, Bemessung, Bau und Betrieb (Subsurface-flow constructed wetlands – Application, dimensioning, installation and operation). Vienna: Vornorm, Austrian Standards Institute. [in German].
PL-WWR – Polish Wastewater Regulation (2019). Regulation of the Minister of Maritime Economy and Inland Waterways of July 15, 2019 on Substances Particularly Harmful to the Aquatic Environment and the Conditions to Be Met when Discharging Sewage into Waters or Soil, as Well as when Discharging Rainwater or Meltwater into Waters or into Water Facilities. J. Laws, 1311. Available at: https://isap.sejm.gov.pl/isap.nsf/search.xsp?status=A&year=2019&position=1311 (accessed June 8, 2022).
Schaber, P., and Reif, H. (2009). Kleinkläranlagen aus Sicht des Gewässerschutzes im Land Salzburg (Small wastewater treatment plants from the perspective of water protection in the province of Salzburg). Wien. Mittl. 218, H1–H22. ISBN 978-3-85234-110-1. [in German].
UWWTD - Urban Wastewater Treatment (1991). Directive (1991): Council Directive 91/271/EEC of 21 May 1991 Concerning Urban Waste-Water Treatment. Available at: https://eur-lex.europa.eu/legal-content/EN/TXT/?uri=celex%3A31991L0271 (accessed June 8, 2022).
Keywords: external monitoring, technologies, treatment performance, vertical flow wetlands, long-term, on-site, household
Citation: Engstler E, Kerschbaumer DJ and Langergraber G (2022) Evaluating the Performance of Small Wastewater Treatment Plants. Front. Environ. Sci. 10:948366. doi: 10.3389/fenvs.2022.948366
Received: 19 May 2022; Accepted: 23 June 2022;
Published: 15 July 2022.
Edited by:
Björn Vinnerås, Swedish University of Agricultural Sciences, SwedenReviewed by:
Wojciech Dąbrowski, Bialystok University of Technology, PolandBeata Karolinczak, Warsaw University of Technology, Poland
Copyright © 2022 Engstler, Kerschbaumer and Langergraber. This is an open-access article distributed under the terms of the Creative Commons Attribution License (CC BY). The use, distribution or reproduction in other forums is permitted, provided the original author(s) and the copyright owner(s) are credited and that the original publication in this journal is cited, in accordance with accepted academic practice. No use, distribution or reproduction is permitted which does not comply with these terms.
*Correspondence: Guenter Langergraber, Z3VlbnRlci5sYW5nZXJncmFiZXJAYm9rdS5hYy5hdA==
 Eva Engstler
 David J. Kerschbaumer
 Guenter Langergraber